ESTCP Cost and Performance Report ENVIRONMENTAL SECURITY TECHNOLOGY CERTIFICATION PROGRAM U.S. Department of Defense (ER-200824) Verification of Methods for Assessing the Sustainability of Monitored Natural Attenuation (MNA) January 2013
Transcript
ESTCPCost and Performance Report
EnvironmEntal SEcuritytEchnology cErtification Program
u.S. Department of Defense
(ER-200824)
Verification of Methods for Assessing the Sustainability of Monitored Natural Attenuation (MNA)
4.0 SITE DESCRIPTION ....................................................................................................... 11 4.1 SITE LOCATION AND HISTORY ..................................................................... 11 4.2 SITE GEOLOGY/HYDROGEOLOGY ............................................................... 12 4.3 CONTAMINANT DISTRIBUTION .................................................................... 12
5.0 TEST DESIGN ................................................................................................................. 15 5.1 CONCEPTUAL EXPERIMENTAL DESIGN ..................................................... 15 5.2 BASELINE CHARACTERIZATION .................................................................. 15 5.3 TREATABILITY OR LABORATORY STUDY RESULTS .............................. 15 5.4 DESIGN AND LAYOUT OF TECHNOLOGY COMPONENTS ...................... 15 5.5 FIELD TESTING.................................................................................................. 15 5.6 SAMPLING METHODS ...................................................................................... 15 5.7 SAMPLING RESULTS ........................................................................................ 16
5.7.1 Overall PBOC Results .............................................................................. 16 5.7.2 Spatial Variability of PBOC at Site 45, MCRD Parris Island, SC ........... 16
6.0 PERFORMANCE ASSESSMENT .................................................................................. 19 6.1 PERFORMANCE OBJECTIVE: VALIDATION OF PBOC METHOD ............ 19 6.2 PERFORMANCE OBJECTIVE: TIME ESTIMATES OF SZD ......................... 21 6.3 PERFORMANCE OBJECTIVE: MNA SUSTAINABILITY
8.0 IMPLEMENTATION ISSUES ........................................................................................ 29 8.1 IMPLEMENTATION OF PBOC TEST ............................................................... 29 8.2 IMPLEMENTATION OF SZD ANALYSIS ....................................................... 29 8.3 IMPLEMENTATION OF MNA SUSTAINABILITY ASSESSMENT .............. 29 8.4 IMPLEMENTATION OF THE TECHNOLOGY AT OTHER SITES ............... 30
9.0 REFERENCES ................................................................................................................. 31 APPENDIX A POINTS OF CONTACT......................................................................... A-1
iii
LIST OF FIGURES
Page Figure 1. Flow chart diagramming the evaluation of reductive dechlorination
sustainability. .......................................................................................................... 5 Figure 2. Contaminant distribution at EGDY site. ............................................................... 13 Figure 3. Site 45, MCRD Parris Island, SC.......................................................................... 13 Figure 4. Range of mean PBOC values for aquifer and non-aquifer samples. .................... 16 Figure 5. Frequency distribution of PBOC at Site 45, MCRD Parris Island, SC................. 17 Figure 6. Summary of PBOC in samples collected inside and outside of the
chloroethene plume at Site 45, MCRD Parris Island, SC. .................................... 17 Figure 7. Mean DO in groundwater versus concentrations of PBOC measured in
aquifer sediments at 12 study sites........................................................................ 19 Figure 8. NAC of chloroethene plumes versus PBOC concentrations measured at 10
study sites. ............................................................................................................. 20 Figure 9. Concentrations of THAA plotted versus PBOC. .................................................. 20 Figure 10. Simulated total source mass discharge rate for EGDY from 2000 to 2100
based on pre-TSR and post-TSR calibration. ....................................................... 22 Figure 11. LTS assessment results (Scenario 1) showing long-term projection of DO
concentrations for two monitoring locations in the surficial aquifer at Site 45. .................................................................................................................. 23
Figure 12. Long-term projections of DO concentrations downgradient of the source zone in the surficial aquifer at Site 45 under changes in the background DO flux resulting from changes in land use or alterations in climate (Scenario 2). .......................................................................................................... 24
iv
LIST OF TABLES
Page Table 1. Federal MCLs for selected CVOCs. ....................................................................... 4 Table 2. Performance objectives. ........................................................................................ 10 Table 3. Summary of sites for PBOC validation. ............................................................... 11 Table 4. Cost model for MNA sustainability assessment. .................................................. 26
v
ACRONYMS AND ABBREVIATIONS AFB Air Force Base bgs below ground surface cis-DCE cis-1,2-dichloroethylene CSM Conceptual Site Model CVOC chlorinated volatile organic compound DCE dichloroethylene DNAPL dense non-aqueous phase liquid DO dissolved oxygen DOC dissolved organic carbon DoD Department of Defense EGDY East Gate Disposal Yard ESTCP Environmental Security Technology Certification Program FS feasibility study GMS Groundwater Modeling System GSI GSI Environmental, Inc. LTS long-term sustainability µg/L micrograms per liter MCL maximum contaminant level MCRD Marine Corps Recruit Depot mg/kg milligrams per kilogram mg/L milligrams per liter MNA monitored natural attenuation NABLC Naval Amphibious Base Little Creek NAC natural attenuation capacity NAES Naval Air Engineering Station NAPL non-aqueous phase liquid NAS Naval Air Station NAWC Naval Air Warfare Center ND not detected NIROP Naval Industrial Reserve Ordnance Plant NRC National Research Council NSB Naval Submarine Base NTC Naval Training Center NUWC Naval Undersea Warfare Center NWIRP Naval Weapons Industrial Reserve Plant
ACRONYMS AND ABBREVIATIONS (continued)
vi
OU operable unit PBOC potentially bioavailable organic carbon PCE tetrachloroethene RI remedial investigation RPM remedial project manager SEAM3D Sequential Electron Acceptor Model, 3D SERDP Strategic Environmental Research and Development Program SL Surficial Lower SLA Sea Level Aquifer STS short-term sustainability SU Surficial Upper SWMU solid waste management unit SZD source zone depletion TCE trichloroethene TEAP terminal electron accepting process THAA total hydrolyzable amino acids THNS total hydrolyzable neutral sugars TOC total organic carbon TSR thermal source removal USACE U.S. Army Corps of Engineers USEPA U.S. Environmental Protection Agency USGS U.S. Geological Survey VC vinyl chloride WWTP Wastewater Treatment Plant
Technical material contained in this report has been approved for public release. Mention of trade names or commercial products in this report is for informational purposes only;
no endorsement or recommendation is implied.
vii
ACKNOWLEDGEMENTS This work was funded by the Environmental Security Technology Certification Program(ESTCP). Additional support was provided by the Charles E. Via, Jr. Fellowship program at Virginia Tech. This project was assisted by the efforts of many people from the following organizations:
• Virginia Tech: Dr. Lashun King-Thomas, Dr. Michael Mobile, Jody Smiley, Janelle Boncal, and Reed Barton
• U. S. Geological Survey (USGS): Dr. Paul Bradley
• GSI Environmental, Inc.: Dr. Tom McHugh
This page left blank intentionally.
1
EXECUTIVE SUMMARY
The requirement for sustainable monitored natural attenuation (MNA) is that energy and material inputs be available for efficient and consistent performance over the life-cycle of a project. Currently, the effectiveness of MNA at chlorinated solvent sites is typically assessed over short time periods (several years). However, when MNA becomes part of a long-term remediation strategy, it is assumed that natural attenuation processes documented during site assessment will continue over the operational life of the site. Regulators, however, are reluctant to approve such MNA-based remediation strategies in the absence of direct evidence that MNA will be sustained over the life-cycle of the site. The technology demonstrated and verified in this report is an approach to assessing MNA sustainability as applied to chlorinated solvents in groundwater, particularly at sites where microbially-mediated reductive dechlorination is the primary attenuation mechanism. The MNA sustainability assessment technology may be applied at sites where MNA has been adopted and approved as the primary remediation strategy for plume management or at a site where source zone remediation is planned and MNA is the projected follow-up remediation strategy. At a given site, the assumed starting point is that site characterization efforts and data analysis have proven that the proper environmental conditions for microbially-mediated reductive dechlorination exist in the groundwater and that ample evidence exists to confirm that the microbial community is reducing chlorinated compounds. The MNA sustainability assessment technology consists of three components designed to answer specific questions (shown in italics):
1) Determine the amount of potentially bioavailable organic carbon (PBOC) that is present in the aquifer sediment and overlying soils. Is there an adequate source of fuel for reductive dechlorination in the long term?
2) Quantify the range in estimates for the contaminant source zone to deplete over time to acceptable levels. What is the required life-cycle for MNA at a given site and how long must MNA be effective and self-sustaining?
3) Estimate the long-term trend of dissolved oxygen (DO) in groundwater using a site model calibrated to current site conditions. Will DO levels trend upward to the point at which microbially-mediated reductive dechlorination will not be sustained?
The associated quantitative performance objectives of this project were to either validate or demonstrate the three components of the MNA sustainability assessment:
1) Validate a methodology for quantifying PBOC by establishing correlations with field-measured DO concentrations, concentrations of chlorinated volatile organic compounds (CVOC), concentrations of natural organic carbon compounds present in aquifer sediment, and rate and extent of reductive dechlorination;
2) Verify the upscaled source zone depletion (SZD) function using site CVOC concentration data for a range of source zone geometries; and
2
3) Validate current site conditions (i.e., short-term sustainability [STS]) using PBOC and DO concentration data and demonstrate long-term sustainability (LTS) using the Sequential Electron Acceptor Model, 3D (SEAM3D) model at a site where the SZD function was used to estimate source persistence.
PBOC was quantified using 168 samples collected at 17 chlorinated solvent sites representing a range of conditions, including sites where microbially-mediated reductive dechlorination was not active. Mean site values for PBOC in aquifer sediment ranged from 12.5 to 998 milligrams per kilogram (mg/kg). For the remaining samples, PBOC ranged from 549 mg/kg (soil) to 14,200 mg/kg (confining units). In addition, PBOC was examined using multiple samples at two of the study sites. Results showed a log-normal distribution to PBOC concentrations and variation with depth in the shallow aquifers. Samples inside chloroethene plumes had lower levels of PBOC than the background samples, indicating that carbon loss is measureable. PBOC data were compared to redox indicator data, CVOC concentration data in groundwater derived from monitoring reports for study sites, and other related laboratory data. The success criteria were achieved for the primary metric—demonstrating an inverse correlation between PBOC and DO data and a positive correlation between PBOC data and the natural attenuation capacities of chloroethene plumes. The SZD function was applied using historical monitoring data at three sites ranging in complexity and with limited data availability. The analytical model was implemented and verified at the site with the most extensive data. Model verification criteria could not be achieved at the other sites due to noise in the historical data and a lack of data over time. Assessment of the LTS of the required level of DO was demonstrated at the study site where the distribution of PBOC was investigated. A site flow and transport model was calibrated to observed DO concentration data and success criteria were achieved (errors between observed and simulated DO <0.25 milligrams per liter [mg/L]). The LTS results indicated no significant change in DO levels over time but some increase could be expected over the 100-year evaluation period. For a scenario where the background flux of oxygen increased by an order of magnitude due to a hypothetical change in land use, DO levels within the CVOC plume increase to levels that would prevent efficient reductive dechlorination. The sustainability assessment was easily implemented using the Groundwater Modeling System (GMS) software platform. Costs for implementing the MNA sustainability assessment technology were estimated for each component. The quality and quantity of available data is an important consideration when implementing this technology at other sites. Verification of the SZD function showed that the nature and extent of long-term historic CVOC data will determine if the probability distributions of predicted outcomes can be quantified. In the event that the SZD analysis is problematic or produces an unacceptable level of uncertainty, the last component of this technology may be implemented using a reasonable life-cycle time estimate. Post-auditing of modeling results is recommended as new data are collected and evaluated, allowing revision to estimates of source depletion and MNA sustainability.
3
1.0 INTRODUCTION
1.1 BACKGROUND
Monitored natural attenuation (MNA) is a component of corrective action plans at many Department of Defense (DoD) facilities nationwide. For most sites the effectiveness of MNA is assessed over short time periods, often only a few years. However, when MNA becomes part of a long-term remediation strategy, it is assumed that natural attenuation processes documented during site assessment will continue over the life of site operations. Operational life depends on the length of time that contaminants will continue to be released from source zones (National Research Council [NRC], 2000), which will span decades at most sites or even centuries at some sites. This raises an important question: Is there a sufficient supply of naturally-occurring energy and material inputs to fuel the relied-upon natural attenuation processes for consistent performance over the project life-cycle? In general, MNA sustainability over time depends upon: 1) the presence of chemical/biochemical processes that transform wastes to innocuous byproducts, and 2) the availability of energy to drive these processes to completion (Chapelle et al., 2007). Regulators may be reluctant to approve MNA-based remediation strategies in the absence of direct evidence that MNA will be sustained over the life-cycle of a site. This is particularly the case at sites with dense non-aqueous phase liquids (DNAPL), where long-term persistence of contamination can be expected. DoD remedial project managers (RPM) currently lack a conventional practice for assessing MNA sustainability. The benefit of this project is a reliable, defensible methodology that has been validated at sites that exhibit a range in the level of reductive dechlorination along with a demonstrated framework for assessing sustainability. The technology demonstrated and verified in this report is an approach to assessing MNA sustainability as applied to chlorinated solvents in groundwater, particularly at sites where microbially-mediated reductive dechlorination is the primary attenuation mechanism. Chapelle et al. (2007) presented a methodology for assessing MNA sustainability at sites contaminated by chlorinated nolatile organic compounds (CVOC) that was developed through Strategic Environmental Research and Development Program (SERDP) project ER-1349. For the case of reductive dechlorination, Chapelle et al. (2007) explains that the flux of potentially bioavailable organic carbon (PBOC) over time must be sustained at a level to consume dissolved oxygen (DO) over the project life cycle. Assessing sustainability requires evaluation of electron donor (i.e., carbon and hydrogen) and electron acceptor (e.g., DO) balances based on current site conditions and projected conditions relevant to reductive dechlorination. The Sequential Electron Acceptor Model, 3D (SEAM3D) solute transport code (Waddill and Widdowson, 2000) was used as the assessment tool for comparing current fluxes of carbon and oxygen, simulating CVOC transport and long-term mass flux from the DNAPL source zone, and estimating the long-term trend in DO.
1.2 OBJECTIVES OF THE DEMONSTRATION
The overall objective of this project was to demonstrate and validate each step in an integrated methodology (Chapelle et al., 2007) for assessing the long-term sustainability of MNA. The demonstration consisted of three quantitative and one qualitative performance objective.
4
The first performance objective was to validate a methodology for quantifying PBOC by establishing correlations with field-measured DO and CVOC concentrations; the latter used to quantify the natural attenuation capacity (NAC) of total chloroethenes plumes. Success criteria were achieved for the primary metric showing an inverse correlation between PBOC and DO data and a positive correlation between PBOC data and NAC values of chloroethenes plumes. The second performance objective was to verify the upscaled source zone depletion (SZD) function for estimating the time-varying reduction in contaminant mass flux as source mass naturally diminishes with time. The SZD function was applied to match CVOC concentration data at three DNAPL sites ranging in complexity and in data availability. The analytical model was verified at the site with the most extensive data. Model verification criteria could not be achieved at the other sites due to noise in the historical data and a lack of data over time. The final performance objective was to demonstrate the approach for assessing carbon and oxygen mass balance for current site conditions (i.e., short-term sustainability [STS]) and over the life cycle of a study site (i.e., long-term sustainability [LTS]). A site groundwater flow and solute transport model, constructed and calibrated to observed DO and CVOC concentration data, and success criteria were achieved (errors between observed and simulated DO <0.25 mg/L). Assessment of LTS was successfully demonstrated and the long-term trend in DO concentration was evaluated for two hypothetical scenarios. The qualitative performance objective associated with the final component of the sustainability assessment was achieved with only limited success. The Natural Attenuation Software (NAS) was modified to incorporate the SZD function for long-term DNAPL dissolution simulations. However, the sustainability assessment was easily implemented using an alternative modeling platform (Groundwater Modeling System [GMS]) to construct, execute and calibrate the site model using MODFLOW2000 (Harbaugh et al., 2000) and SEAM3D.
1.3 REGULATORY DRIVERS
Aqueous solubility values of common chemicals of concern associated with chlorinated ethenes found at DoD facilities greatly exceed drinking water standards including Federal maximum contaminant levels (MCL). Federal MCLs for selected chlorinated ethenes derived from the discharge of solvents, often in the form of DNAPL and daughter products of reductive dechlorination, are presented in Table 1.
MNA is a remedial approach and plume management strategy utilized or will be used at practically all chlorinated ethene sites. According to the U.S. Environmental Protection Agency (USEPA) (1999), the naturally-occurring processes that contribute to attenuation include “a variety of physical, chemical, or biological processes that under favorable conditions, act without human intervention to reduce mass, toxicity, mobility, volume, or concentration of contaminants in soil or groundwater.” MNA is often proposed as a “polishing” step following aggressive remediation efforts but can be a stand-alone technology. To make MNA sustainable, like other remediation technologies, the energy and material inputs required for efficient and consistent operation are available for the life-cycle of a project. For the specific problem of chlorinated solvents where microbially-mediated reductive dechlorination is the primary attenuation mechanism, the required conditions for sustainable operations are: 1) a consistent and active population of halorespiring bacteria, 2) groundwater at levels of DO below threshold levels necessary for efficient reductive dechlorination, and 3) a fuel source for microbial respiration. The aim of this technology is to provide a reliable, defensible framework and computational tool for assessing MNA sustainability in this context.
2.1 TECHNOLOGY DESCRIPTION
Figure 1 depicts the overall methodology for assessing MNA sustainability at chlorinated solvent sites (Chapelle et al., 2007). The required data is CVOC concentrations in groundwater derived from routine monitoring, biogeochemical parameters collected using MNA guidelines, and enough information and hydrogeological data to construct a robust conceptual site model (CSM). PBOC concentration is the only additional data requirement.
Figure 1. Flow chart diagramming the evaluation of
reductive dechlorination sustainability.
6
2.1.1 PBOC
Natural sources of organic carbon to drive reductive dechlorination include fluxes in groundwater recharge, advective transport of organic carbon from groundwater upgradient of the source, and transport by traverse dispersion from groundwater adjacent to the plume. The largest pool of natural organic carbon is that mobilized into the dissolve phase from the aquifer matrix. Rectanus et al. (2007) developed the PBOC method and described laboratory validation experiments.
2.1.2 SZD
The SZD function is a practical field-scale model for estimating CVOC fluxes versus time from source zones considering effects of mass depletion applicable to DNAPL pool sources, residual DNAPL sources, as well as intermediate and combined source types (Parker and Park, 2004; Park and Parker, 2005; Parker et al., 2008). The upscaled SZD function considers the effects of decreases in interfacial surface area with time as DNAPL mass depletes, but not in an explicit manner. The model is able to describe mass depletion and flux reductions versus time for different source zone “architectures” (via the source depletion exponent in the upscaled model), but explicit parameterization of source geometry, “ganglia-to-pool ratios” or other small-scale variables is not required to use the model. The SZD function may be written in the form
( )iieqo
i CCQMMM −
= ,
β
κ (1)
where 𝑀𝚤̇ is mass discharge of species i leaving the source zone, κ is a dimensionless mass transfer coefficient, Ceq,i is the effective solubility of species i, Ci is the average dissolved phase concentration exiting the source, Q is the volumetric flow rate through the source, M is the current total source mass, Mo is the mass at a specified time, and β is a depletion exponent.
2.1.3 MNA Sustainability Assessment
The third and final component of the MNA sustainability assessment requires a site model for CVOC transport and attenuation coupled to dynamic redox conditions. A site solute transport model using SEAM3D is calibrated to match current site conditions. The short-term requirement for sustainable reductive dechlorination is that the current PBOC flux exceeds the flux of DO, after stoichiometric adjustment to H2-equivalent fluxes, indicating that anoxic conditions exist that will enable biodegradation of CVOCs. The sustainability of long-term reductive dechlorination is evaluated by project forward in time until the source contaminant concentration decreases below a level of regulatory significance. If PBOC fluxes remain sufficient to yield anoxic conditions in the plume downgradient of the source zone, then long-term MNA sustainability is indicated. SEAM3D is an advective-dispersive solute transport model that simulates the full range of natural attenuation processes (biodegradation, sorption, dilution and dispersion, volatilization, and diminishing source mass flux) in groundwater systems (Waddill and Widdowson, 1998;
7
2000). The Biodegradation Package simulates mass loss of electron donors that serve as growth substrates for heterotrophic bacteria in the subsurface, and the consumption of electron acceptors associated with aerobic and anaerobic respiration. SEAM3D allows for the evolution of redox conditions within a plume with time and space as electron acceptors are depleted. The DNAPL Package calculates the mass balance of each DNAPL component using a field-scale mass transfer function that models mass flux at the grid-block size. The Reductive Dechlorination Package ties the rate and extent of bioattenuation of chloroethenes (i.e., reductive dechlorination and direct oxidation) to the concentrations of electron acceptors (Widdowson, 2004).
2.2 ADVANTAGES AND LIMITATIONS OF THE TECHNOLOGY
The PBOC method is relatively straight-forward and offers many advantages relative to more gross measures of organic carbon (e.g., total organic carbon [TOC]) and more involved methods (e.g., total hydrolyzable amino acids [THAA], and total hydrolyzable neutral sugars [THNS]). Chapelle et al. (2009) suggested THAA and THNS as measures of the bioavailability of organic carbon based on an analysis of two sites. However, both analyses are significantly more expensive compared to analysis of PBOC. SEAM3D is specifically designed to simulate the fate and transport of chlorinated ethenes coupled to redox conditions in groundwater. The code simulates electron acceptor and donor controls of redox conditions and fluxes of biologically-available dissolved organic carbon (DOC) along with dissolution of organic carbon from solid phase source. No other models are available that are capable of considering long-term sustainability of organic carbon to maintain aquifer conditions conducive to reductive dechlorination. The program BIOBALANCE (GSI Environmental, Inc. [GSI], 2007) was developed to assess MNA sustainability using a simple electron donor and electron acceptor stoichiometric balance. Limitations of BIOBALANCE arise due to its omission of carbon fluxes due to dissolution of natural solid phase organic carbon, recharge fluxes and transverse dispersion. These omissions can significantly affect inferred sustainability. Furthermore, BIOBALANCE uses a DNAPL source model that represents a special case of Equation 1 with a source depletion exponent (β) of 1. REMChlor (Falta et al., 2007) is an analytical model for chlorinated solvent transport that employs a variable depletion exponent as given by Equation 1. Both models consider spatially variable first-order decay of solvent species. REMChlor also considers time-dependent decay, but does not link decay rate changes to organic carbon fluxes. In addition, first-order decay models do not take into account the reservoir of PBOC in sustainability. The major disadvantage of using SEAM3D is the requirements for input parameters and data for calibration associated with any comprehensive 3D solute transport model. In theory, these limitations are moderated by implementing SEAM3D using analytical models such as the Natural Attenuation Software package. However, as described in the next section (Performance Objectives) and Section 6.0 (Performance Assessment), it was determined that implementing the STS and LTS assessments were best performed using a platform designed for exiting site models utilizing MODFLOW and SEAM3D.
This page left blank intentionally.
9
3.0 PERFORMANCE OBJECTIVES
Specific quantitative performance objectives for MNA sustainability assessment were paired with the three component of the methodology:
1. Measurement of PBOC levels 2. Estimation of timeframe for source depletion using the SZD function, and 3. LTS assessment using SEAM3D as a site model.
The first quantitative objective was validated by analyzing aquifer sediment samples from 17 chlorinated solvent sites and comparing results to redox indicator concentration data and CVOC concentration data in groundwater derived from monitoring reports for study sites. The study sites represented a wide range of hydrogeological conditions and levels of microbially-mediated reductive dechlorination. The second quantitative objective was assessed by comparing the results of the SZD function to historical CVOC concentration data in groundwater at three study sites. The sites ranged from a complex multi-aquifer system with multiple DNAPL sources within a waste burial yard with extensive site characterization and monitoring data (Site 1), to a site of moderate complexity and data availability (Site 2), as well as a site with a single source and limited characterization and monitoring data over time (Site 3). For the last quantitative objective, a site model developed using SEAM3D was compared to observed hydraulic head data and observed DO concentration data to validate STS and then implemented to demonstrate LTS. One qualitative performance objective was designed to evaluate the ease of implementing the MNA sustainability assessment. The quantitative performance objectives and the qualitative performance objective described above are summarized in Table 2. A synopsis of their evaluation is provided in this section, and further details are provided in Section 6.0.
10
Table 2. Performance objectives.
Mg/L = milligrams per liter NAPL = non-acqueous phase liquid
Performance Objective Data Requirements Success Criteria Results
Quantitative Performance Objectives Validate PBOC method CVOC and redox indicator
concentrations in groundwater
Amino acid concentrations in aquifer sediment samples
Extent of dechlorination in radio-labeled laboratory tests
Routine statistical measures to establish relationships between PBOC and each metric parameter.
Correlation coefficient (R2) will be 0.75 or greater
The success criteria were achieved for the primary metric using DO and NAC. Positive correlations were found H2 but the stated correlation coefficient was not achieved (R2<0.75). For the remaining two metrics, again positive correlations were observed for THAA and CO2 production, respectively, but the stated correlation coefficient was not achieved (R2<0.75).
Estimating SZD time Monitoring well data near source and in dissolved plume
Aquifer characteristics and site history
Mass recovery estimates from partial source mass reduction
Out-of-sample data set consistent with predicted 95% confidence limits based on calibrated model
The success criteria were achieved but quantifying confidence limits on predictions of the SZD model coupled transport and reaction models proved difficult as the level of site complexity increased (i.e., Site 1). Model verification criteria could not be achieved at Site 2 due to noise in the historical data or at Site 3 due to limited data availability.
Demonstrate sustainability assessment methodology
CVOC and redox indicator monitoring well data
• Match SEAM3D output to observed site DO data along flow path o ±0.5 mg/L DO at wells
where DO>1.0 mg/L o ±0.25 mg/L DO at wells
where DO<1.0 mg/L) • Simulate redox conditions
along flow path
The success criteria were achieved with the largest error in DO concentration of 0.1 mg/L between observed and simulated. The groundwater system at Site 3 was strongly anaerobic, and the redox condition showed no variation along the flow path due to the truncated plume length. LTS assessment was successfully demonstrated.
Qualitative Performance Objectives Ease of implementation Feedback from potential
stakeholders on applicability, ease of use, and data requirements
User can successfully complete the assessment using NAS or other modeling platform
The success criteria were achieved with only limited success. Natural Attenuation Software was modified to incorporate the SZD function for long-term NAPL dissolution simulations. However, based on input from stakeholders and evaluation of the procedure, it was determined that an alternative DoD-supported modeling platform (GMS) would provide a superior approach. The sustainability assessment was easily implemented using GMS.
11
4.0 SITE DESCRIPTION
Chlorinated solvent sites used for the performance objectives are listed in Table 3. The study sites represent a range of TOC content, geochemical conditions and degree of daughter product formation (based on peak DCE and VC concentrations). Where possible, the specific anaerobic terminal electron accepting processes (TEAP) are identified. Reductive dechlorination was a dominant mechanism for attenuation at many sites, but study sites where physical mechanisms (e.g., dilution) are a major component to plume attenuation were also included.
Table 3. Summary of sites for PBOC validation.
Notes: 1 Fe(III)-reducing OU – operable unit AFB – Air Force Base 2 Sulfate-reducing NAS – Naval Air Station NAES – Naval Air Engineering Station 3 Methanogenic NTC – Naval Training Center EGDY – East Gate Disposal Yard 4 Mn(IV)-reducing SWMU – solid waste management unit MCRD – Marine Corps Recruit Depot NWIRP – Naval Weapons Industrial Reserve Plant NIROP – Naval Industrial Reserve Ordnance Plant NSB – Naval Submarine Base NABLC – Naval Amphibious Base Little Creek NAWC – Naval Air Warfare Center NUWC – Naval Undersea Warfare Center WWTP – Wastewater Treatment Plant Multiple samples were obtained at most of the 17 sites listed in Table 3, and all samples were measured for PBOC (Performance Objective 1). For Performance Objective 2, three sites were selected for validation of the SZD function based on data quality and diversity of site conditions: Areas I&J, NAES Lakehurst, NJ; EGDY, Joint Base Lewis-McChord, WA; and Site 45, MCRD Parris Island, SC. This report will focus on results from the latter two sites.
4.1 SITE LOCATION AND HISTORY
The EGDY was used for disposing waste from equipment cleaning and degreasing. Groundwater contamination by TCE was discovered in 1985, a remedial investigation (RI) was performed in 1988, and a feasibility study (FS) was conducted in 1990. Active remediation began in 1995 with installation of two pump and treat systems. Additional extraction wells were added in 2005 and 2006. Disposal trenches were excavated in 2000 to remove contaminated waste buried above the
Site Geochemistry
(TEAP) Organic Carbon (Sediment TOC)
OU2 – NAS; Jacksonville, FL Anaerobic Moderate OU2 – NTC; Orlando, FL Anaerobic1,2 Low- Moderate SWMU 118 – NWIRP; Dallas, TX Aerobic with isolated anaerobic areas Moderate Honeywell Site; Kansas City, MO Anaerobic2,3 High (river sediment) Site 12 – NSB; Kings Bay, GA Anaerobic1,2,3 High NAWC Site; Trenton, NJ Anaerobic1,2,3 High (overburden soils) WWTP – NAS; Pensacola, FL Anaerobic1,3,4 High Site 10; Beale AFB, CA Aerobic Low Areas I&J – NAES; Lakehurst, NJ Anaerobic1 with isolated aerobic areas Low EGDY; Lewis-McCord, WA Aerobic (upper aquifer); Anaerobic (lower zone) Low- Moderate OU24 – NAS; North Island, CA Anaerobic1,2,3 Moderate OU4 – NTC; Orlando, FL Anaerobic1 Low-Moderate OU2;Hill AFB, UT Aerobic Low Site 45 – MCRD; Parris Island, SC Anaerobic1,2,3 Moderate OU1 – NIROP;, Fridley, MN Unknown Low-Moderate Site 12 – NABLC; Virginia Beach, VA
Anaerobic1,2,3 Moderate
OU1 – NUWC; Keyport, WA Anaerobic1,2,3 High
12
water table. About 1260 drums of contaminant were removed. To reduce DNAPL mass below the water table, thermal source removal (TSR) was implemented for three source zones between 2003 and 2007. Additional extraction wells were added in 2005 and 2006. Site 45 is a dry-cleaning facility located on the MCRD, (Vroblesky et al., 2009). Groundwater contamination consists of PCE and reductive dechlorination products. In early 2001, a former dry cleaning facility and related structures were removed from the site. The north plume source zone was an Environmental Security Technology Certification Program (ESTCP) demonstration site using emulsified zero-valent nanoscale iron (ER-200431 Final Report, 2010). In late 1997, the dry cleaning operations were moved to a new facility that no longer utilized PCE. However, investigations starting in 2005 showed the presence of a second groundwater contamination plume of chlorinated solvents (south plume), appearing to originate from the new dry cleaning facility. Recent field investigations indicated that the contaminant source in the southern plume was the result of a leak from a sanitary sewer connecting the old and new dry cleaning facilities (Vroblesky et al., 2009).
4.2 SITE GEOLOGY/HYDROGEOLOGY
Joint Base Lewis-McChord is underlain by a complex and heterogeneous sequence of glacial and non-glacial deposits including a shallow aquifer (Vashon) and a deep aquifer (Sea Level Aquifer [SLA]). The Vashon aquifer is unconfined and continuous throughout the area. The Vashon and SLA aquifers are separated by a mostly continuous low permeability aquiclude. However, a “window” is present about 2 kilometers downgradient of the disposal area that allows water and contaminants from the shallow Vashon aquifer to migrate to the deep SLA. Groundwater generally flows to northwest in the Vashon aquifer and west-southwest in the SLA. Details on the site geology are found in U.S. Geological Survey (USGS) (2005), Truex et al. (2006), and U.S. Army Corps of Engineers (USACE) (2008). Site 45 is underlain by a surficial aquifer that is unconfined and the depth to water is approximately 2 to 6 ft below ground surface (bgs). The surficial aquifer consists of fine sand interspersed with discontinuous beds of fine grain materials and extends to a depth of about 18 ft bgs (Tetra Tech NUS, Inc., 2004). A thin layer of black to brown organic material was encountered at depths ranging from 17 to 21 ft bgs (Vroblesky et al., 2009). This complex organic layer is directly underlain by a 3 to 6 foot-thick clay unit (Tetra Tech NUS, Inc., 2004). The complex organic layer and clay layer function as a local confining bed at Site 45. Local groundwater flow was hydraulically influenced by the storm sewers (Vroblesky et al., 2009).
4.3 CONTAMINANT DISTRIBUTION
TCE disposed in trenches produced a dissolved groundwater plume that extends over 15,000 ft downgradient of the source. The contaminant plume migrates in a northwesterly direction in the upper aquifer from the source area (Figure 2). A large fraction of the plume migrates through a gap in the confining unit to the SLA, where it forms a westerly trending plume. Near the source area, TCE concentrations generally range from 500 to >50,000 µg/L with DCE concentrations from 100 to >500 µg/L. In the plume, TCE concentrations range from 100 to 200 µg/L with DCE from 10 to 50 µg/L. The upper aquifer is aerobic. The lower aquifer is generally anaerobic, except in areas that receive high recharge from the upper aquifer USGS (2005).
13
Figure 2. Contaminant distribution at EGDY site.
(USGS, 2005) PCE plumes at Site 45, identified as the northern plume and the southern plume, are illustrated in Figure 3. The focus of this project is the southern plume which primarily is located in the lower depths of the surficial aquifer (SL wells). Source area concentrations of PCE (62,400 µg/L) indicate the presence of DNAPL (Vroblesky et al., 2009). High concentrations of TCE, DCE and VC throughout the plume combined with oxygen-depleted groundwater indicate conditions promoting reductive dechlorination. Geochemical data indicates a mixture of iron- and sulfate-reducing conditions within the footprint of the chloroethene plume (Vroblesky et al., 2009).
Figure 3. Site 45, MCRD Parris Island, SC.
(Modified from Vroblesky et al., 2009)
This page left blank intentionally.
15
5.0 TEST DESIGN
Although the performance objectives of this project are not evaluated through designed experiments, several components required for the Cost and Performance Report under Test Design are relevant to the work conducted.
5.1 CONCEPTUAL EXPERIMENTAL DESIGN
Evaluation of the quantitative performance objectives were achieved using historical monitoring well data and measures of PBOC. Sampling sites for PBOC analysis at Site 45 (MCRD, Parris Island, SC) were designed to capture variations with depth and were located inside the south plume and source zone, plume periphery and outside areas of known contamination.
5.2 BASELINE CHARACTERIZATION
No baseline characterization activities are required for this project other than screening sites for required data from reports, such as RI/FS or annual monitoring assessments. Based on this information, sites were characterized as either exhibiting high, moderate or low levels of reductive dechlorination as a means of obtaining a wide range of conditions for validation of the PBOC method. PBOC analysis was performed following site selection, and results were not utilized for baseline characterization. No additional measurements were required.
5.3 TREATABILITY OR LABORATORY STUDY RESULTS
No treatability studies were performed during this project.
5.4 DESIGN AND LAYOUT OF TECHNOLOGY COMPONENTS
No design and layout of technology components were proposed.
5.5 FIELD TESTING
No direct field testing of technology components was conducted during execution of this project.
5.6 SAMPLING METHODS
The total number of samples collected was 168 with 69% of the samples collected at 2 of the 15 sites: Site 12, NAB Virginia Beach, VA, and Site 45, MCRD Parris Island, SC, where spatial variability was investigated. Note that an unequal number of samples were collected at each site. The aim was to obtain at least one representative sample at each site in a hydrostratigraphic unit where contaminant migration was known to occur. The vast majority of the samples (~82%) were characterized as aquifer sediment with the remaining samples derived from over-burden soils or confining units that have some influence on concentrations of DOC in site groundwater.
16
5.7 SAMPLING RESULTS
5.7.1 Overall PBOC Results
Figure 4 depicts the range in the mean PBOC concentrations for the 15 study sites. The graph shows that mean values of PBOC in aquifer sediment varied by two orders of magnitude. Mean site values for PBOC in aquifer sediment ranged from 12.5 to 998 mg/kg. For the remaining samples, PBOC ranged from 549 milligrams per kilogram (mg/kg) (soil) to 14,200 mg/kg (confining unit).
Figure 4. Range of mean PBOC values for aquifer (blue) and non-aquifer (gray) samples.
5.7.2 Spatial Variability of PBOC at Site 45, MCRD Parris Island, SC
Figure 5 shows the distribution (N=96) of natural logarithm values of PBOC in sediments collected at MCRD Site 45. The plot suggests a log-normal distribution to the PBOC values. The average concentration for PBOC in aquifer sediments was 207 mg/kg with a standard deviation of 149 mg/kg. Relative to the aquifer sediment, samples collected in overburden soils showed higher levels of PBOC (mean=549 mg/kg, N=12). The highest levels of PBOC at Site 45 were found in the organic-rich confining layer, ranging from 593 to 3320 mg/kg (mean=1,590 mg/kg, N=12).
Bea
le A
FB, C
AH
ill A
FB, U
TN
AS
Jac
kson
ville
, FL
NA
ES
Lak
ehur
st, N
JFo
rt Le
wis
, WA
NA
B L
ittle
Cre
ek, V
AN
IRO
P, M
NM
CR
D P
arris
Isla
nd, S
CN
AS
Pen
saco
la, F
LN
WIR
P D
alla
s, T
XN
AS
Nor
th Is
land
, CA
NS
B K
ings
Bay
, GA
NU
WC
Key
port,
WA
NTC
Orla
ndo,
FL
(OU
2)N
TC O
rland
o, F
L (O
U4)
MC
RD
Par
ris Is
land
, SC
(Soi
l)K
ansa
s C
ity H
oney
wel
l (R
iver
)M
CR
D P
arris
Isla
nd, S
C (C
onfin
ing)
NS
B K
ings
Bay
, GA
(Soi
l)N
AS
Pen
saco
la, F
L (S
oil)
NA
WC
, NJ
(Soi
l)N
SB
Kin
gs B
ay, G
A (C
onfin
ing)
PBO
C (m
g/kg
)
100
101
102
103
104
105
17
Figure 5. Frequency distribution of PBOC (mg/kg) at Site 45, MCRD Parris Island, SC.
PBOC concentrations outside of the chloroethene plume were greater than inside of the plume by a factor of 2.0 and 1.4 for surficial upper and lower samples, respectively (Figure 6). PBOC was statistically significantly greater (p<0.05) for samples collected outside the plume in the SU samples versus inside of the plume. Although not statistically conclusive for the SL samples, the overall results indicate differences in extractable organic carbon from aquifer sediments with minimal chloroethene exposure relative to samples collected in the highly-contaminated areas.
Figure 6. Summary of PBOC in samples collected inside and outside of the chloroethene
plume at Site 45, MCRD Parris Island, SC. Standard deviations for PBOC concentrations are shown with error bars.
ln PBOC
<3 3 4 5 6 7 >8
Freq
uenc
y
0
10
20
30
40
Upper Lower
PB
OC
(mg/
kg)
0
100
200
300
400
500
Inside Outside
This page left blank intentionally.
19
6.0 PERFORMANCE ASSESSMENT
6.1 PERFORMANCE OBJECTIVE: VALIDATION OF PBOC METHOD
DO concentrations were evaluated in groundwater samples using pre-remediation performance well data collected from 12 study sites. DO ranged from not detected (ND) to 6.42 ± 0.83 mg/L. Figure 7 shows the average concentrations of DO plotted versus PBOC for each site. At eight sites that exhibited moderate to high reductive dechlorination activity, PBOC concentrations were greater than 200 mg/kg, and the mean DO concentrations were ≤0.5 mg/L. At sites where little or no reductive dechlorination activity was observed, mean concentrations of DO and PBOC were >0.8 mg/L and <75 mg/kg, respectively.
Figure 7. Mean DO in groundwater versus concentrations of PBOC measured in aquifer sediments at 12 study sites.
Standard deviations for DO concentrations are shown with error bars. Regression results demonstrated statistically significant (R2=0.96; p<0.0001) inverse correlations for PBOC and DO concentrations following a hyperbolic regression equation. This behavior is consistent with theory and stems directly from carbon-oxygen stoichiometry. These data suggest that DO concentrations approach zero at a PBOC concentration of approximately 200 mg/kg. This, in turn, suggests that a PBOC concentration of approximately 200 mg/kg is necessary in order to establish anoxic conditions. Concentrations of total chloroethenes were evaluated along the groundwater flowpath at 10 study sites. Figure 8 shows the NAC of each site plotted versus mean PBOC site values. Moderate to high reductive dechlorination activity was exhibited at seven sites where NAC values were greater than or equal to 0.0060 ft-1, and PBOC concentrations ranged from 211.0 to 1269.1 mg/kg. Lower NAC values and concentrations of PBOC were obtained for sites demonstrating minimal reductive dechlorination activity. Linear regression exhibited a positive relationship between NAC and PBOC (R2= 0.75).
Mean PBOC (mg/kg)
0 200 400 600 800 1000 1200 1400
Mea
n D
O (m
g/L)
0
2
4
6
8
20
Figure 8. NAC of chloroethene plumes versus PBOC concentrations measured at 10 study sites.
Concentrations of THAA ranged from 0.67 to 49.5 mg/kg with a mean value of 9.9 mg/kg. For concentrations of PBOC below approximately 200 mg/kg, concentrations of THAA were fairly constant at 3.6±1.8 mg/kg (Figure 9). Significantly larger THAA values (138 to 14,900 mg/kg) were observed in samples collected from surficial soils, aquitards and riverbed sediment. Regression analysis comparing THAA to PBOC concentrations suggest a moderate positive correlation (R2=0.58).
Figure 9. Concentrations of THAA plotted versus PBOC.
Mean PBOC (mg/kg)
0 200 400 600 800 1000 1200 1400
NAC
(ft-1
)
0.000
0.005
0.010
0.015
0.020
0.025
PBOC (mg/kg)
10-1 100 101 102 103 104
THAA
(mg/
kg)
10-1
100
101
102
103
104
AquiferRiverbedSoilAquitard
21
6.2 PERFORMANCE OBJECTIVE: TIME ESTIMATES OF SZD
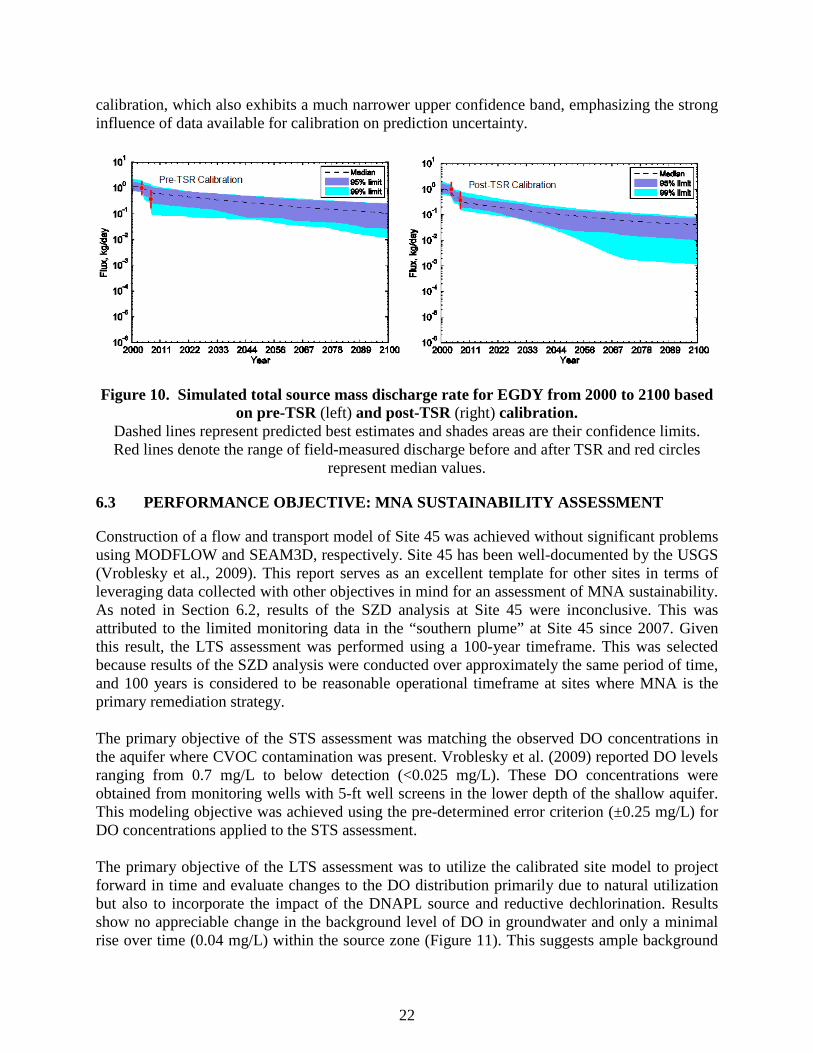
The field applications of the SZD model coupled with a dissolved transport model, calibration methodology and stochastic forward simulation approach demonstrate a key component to the MNA sustainability assessment technology. The sites ranged from a complex multi-aquifer system with multiple DNAPL sources within a waste burial yard with extensive site characterization and monitoring data (EGDY), to a site of moderate complexity and data availability (Areas I & J), as well as a site with a single source but very limited historical monitoring data (Site 45). At the latter site, the model was effectively calibrated (R2=0.78) using a total of 74 concentration values measured from 2005 through 2008; however, because no direct measurements of source mass discharge are available for this site, model verification criteria could not be evaluated. Since no measurements of source mass discharge were available at Areas I & J, model verification criteria cannot be directly evaluated for this site. Furthermore, because noise in concentration data wais substantially greater than the uncertainty in predicted source discharge, it may take many years of monitoring before predictions can be verified or simulation performance substantially improved by recalibration. Explicit verification of source mass discharge predictions with field measurements was feasible only for the EGDY, where measurements of source discharge before and after TSR treatment were available. The three sources containing mostly TCE produced a single merged plume in the shallow unconfined aquifer. Multiple measurements of source mass discharge were performed for the three DNAPL source zones before and after TSR, which were not utilized for model calibration. Pre-TSR calibration was achieved using total TCE-equivalent1 dissolved concentrations from 26 monitoring wells from 1995 through 2001. Post-TSR calibration utilized data from 26 monitoring wells and 14 newer wells near source areas from 1995 through 2009, plus estimated mass removal during TSR. Correlation coefficients between observed and predicted concentrations were 0.79 and 0.78 for pre- and post-TSR calibrations, respectively. Results of Monte Carlo simulations of total source discharge versus time with 95 and 99 % confidence bands are shown in Figure 10 for pre- and post-TSR calibrations. Maximum, minimum and median estimates of discharge rates from field measurements prior to and after TSR are also shown. Stepwise reductions in source discharge due to source mass reductions by TSR between 2004 and 2007 are evident. The 95% confidence bands are narrower for the post-TSR calibration, reflecting improved model precision associated with additional calibration data. Model-simulated mass discharge agrees well with measured values. Source discharge measurements actually exhibit greater uncertainty than model simulations of discharge, reflect the fact that the calibration approach integrates data from numerous wells over the entire plume for a much longer time. Concentration at a downgradient compliance well following TSR (using field estimates of source mass removal) with no additional active remediation show a 50% probability of dropping below 5 µg/L after 2180 using the pre-TSR calibration. This date narrows to 2145 for the post-TSR 1 Measured dissolved concentrations of CVOCs were converted to “TCE-equivalent” concentrations such that their H-demand for complete reduction is equal to that of TCE.
22
calibration, which also exhibits a much narrower upper confidence band, emphasizing the strong influence of data available for calibration on prediction uncertainty.
Figure 10. Simulated total source mass discharge rate for EGDY from 2000 to 2100 based
on pre-TSR (left) and post-TSR (right) calibration. Dashed lines represent predicted best estimates and shades areas are their confidence limits. Red lines denote the range of field-measured discharge before and after TSR and red circles
Construction of a flow and transport model of Site 45 was achieved without significant problems using MODFLOW and SEAM3D, respectively. Site 45 has been well-documented by the USGS (Vroblesky et al., 2009). This report serves as an excellent template for other sites in terms of leveraging data collected with other objectives in mind for an assessment of MNA sustainability. As noted in Section 6.2, results of the SZD analysis at Site 45 were inconclusive. This was attributed to the limited monitoring data in the “southern plume” at Site 45 since 2007. Given this result, the LTS assessment was performed using a 100-year timeframe. This was selected because results of the SZD analysis were conducted over approximately the same period of time, and 100 years is considered to be reasonable operational timeframe at sites where MNA is the primary remediation strategy. The primary objective of the STS assessment was matching the observed DO concentrations in the aquifer where CVOC contamination was present. Vroblesky et al. (2009) reported DO levels ranging from 0.7 mg/L to below detection (<0.025 mg/L). These DO concentrations were obtained from monitoring wells with 5-ft well screens in the lower depth of the shallow aquifer. This modeling objective was achieved using the pre-determined error criterion (±0.25 mg/L) for DO concentrations applied to the STS assessment. The primary objective of the LTS assessment was to utilize the calibrated site model to project forward in time and evaluate changes to the DO distribution primarily due to natural utilization but also to incorporate the impact of the DNAPL source and reductive dechlorination. Results show no appreciable change in the background level of DO in groundwater and only a minimal rise over time (0.04 mg/L) within the source zone (Figure 11). This suggests ample background
23
levels of PBOC are present in the aquifer sediment and dissolved into the groundwater over the simulation period. The long-term rise in the source zone is attributed to the diminished levels of PBOC observed in site samples and incorporated into the SEAM3D model as input. However, the ending DO concentration in the source zone is still well below threshold levels of DO commonly associated with microbially-mediated reductive dechlorination and at this level, no concerns for the sustainability of MNA are indicated.
Figure 11. LTS assessment results (Scenario 1) showing long-term projection of DO
concentrations for two monitoring locations in the surficial aquifer at Site 45. One key assumption is that land use and climate does not change over the 100-year period. Changes in land use could not only impact the rate of recharge but also the flux of oxygen entering the groundwater system. In a second scenario the flux of background oxygen was increased by an order of magnitude. This could be the consequence of any number of alterations in the existing local infrastructure, vegetation, climate or some combination. With changes in the background flux of oxygen, a much different result is apparent compared to previous results, even within a relatively short timeframe (in this case, 10 years). The order-of-magnitude increase in oxygen at the upgradient flow boundary results in a nearly-equivalent increase in DO in source zone groundwater (Figure 12). The increase in the DO level begins at year 2 and reaches a new apparent steady-state over a 4-year period, as natural groundwater flow brings higher levels of DO into the CVOC plume. The impact on reductive dechlorination is apparent by the decreasing trend in DCE concentrations at the same location starting between years 5 and 6. The starting level of DCE is the result of reductive dechlorination in the plume and DCE derived from the DNAPL source zone. As the DO level increases, the concentration of DCE begins a downward trend as oxygen begins to inhibit reductive dechlorination of PCE and TCE and the generation of DCE. Although higher DO concentrations could conceivably have a beneficial effect due to the direct (aerobic) oxidation of DCE, the short-term effect indicate sustainable MNA based on reductive dechlorination is questionable under this scenario.
24
Figure 12. Long-term projections of DO concentrations downgradient of the source zone in
the surficial aquifer at Site 45 under changes in the background DO flux resulting from changes in land use or alterations in climate (Scenario 2).
6.4 PERFORMANCE OBJECTIVE: EASE OF IMPLEMENTATION
Natural Attenuation Software was successfully modified to incorporate the SZD function for long-term non-aqueous phase liquid (NAPL) dissolution simulations. However, based on evaluation of implementation issues and procedure for conducting the SZD analysis and STS and LTS assessment, it was obvious that extended model runs using SEAM3D within the Natural Attenuation Software platform did not conform to the user run-time requirements. Instead, the DoD-supported GMS modeling platform was utilized for the STS and LTS assessments. GMS has many advantages over simpler modeling platforms, particularly for model calibration, making model calibration straight-forward without the need for considerable time and resources. Another factor is that software platforms, such as GMS, are better suited to utilize existing site models. Often site models have been developed over time through careful planning and considerable effort. Using existing site models for sustainability assessments allow leveraging of resources and may ensure a more accurate outcome.
25
7.0 COST ASSESSMENT
The objective of this project is to validate and demonstrate tools for assessing the sustainability of MNA at chlorinated solvent sites. To apply these tools in an effective manner, site characterization efforts should be in a relative mature state. MNA may be one component of a remedial action plan, the sole remediation strategy, or considered as part of a FS. In general, the only additional data requirement is laboratory measurement of PBOC. Therefore, the cost assessment for this technology demonstration will only address the incremental costs of performing the PBOC analysis and the application of computational tools to estimate the timeframe for the source zone mass flux to deplete and for the assessment of STS and LTS.
7.1 COST MODEL
The cost elements considered in the cost model for implementing for each component of the MNA sustainability assessment at a site are summarized in Table 4. The model considers the following five elements:
1. Characterization of PBOC, 2. Data Review and Modeling Plan, 3. Estimation of SZD Timeframe, 4. Assessment of STS and LTS, and 5. Reporting.
Baseline hydrogeologic and contaminant characterizations were not included in assessing cost. It is assumed that baseline characterizations have been performed, that MNA is either an implemented remedial strategy or is under consideration as a remedy, and that a CSM has been developed out of a RI/FS. For the latter, this may or may not include a working site model for solute transport and attenuation. Sample collection for PBOC analysis is accomplished using conventional methods (e.g., direct push or drill rig). These costs were not evaluated in the Cost Estimate but could be easily determined based on the sampling strategy. Because no specialized equipment or procedure is required to collect samples for PBOC analysis, the sampling effort could utilize existing programs. The sampling procedure for PBOC analysis is routine requiring no special method, supplies or equipment to obtain and collect each sample of material in 0.5-liter jar. At some sites, samples preserved in cold storage may be adequate for laboratory analysis. Reporting encompasses documentation of cost elements 1 through 4. The estimated cost of $50K includes the combined effort to produce a report that describes the application of models to evaluate time estimates for source zone mass flux depletion and provide a complete assessment of MNA sustainability. The report would also include any new data gathered (i.e., PBOC concentrations), data interpretation and any potential alterations in site-specific conceptual models for groundwater flow and contaminant fate and transport.
26
Table 4. Cost model for MNA sustainability assessment.
Cost Element Data Tracked During the Demonstration Costs Characterization of PBOC
• Finalize report and develop appendices describing modeling steps
Project engineer, 42 hr Project engineer, 120 hr
$6300 $18,000
7.1.1 Cost Element: Characterization of PBOC
The estimated cost for running a single PBOC test is $75 per sample. Unit costs provided in Table 4 reflect average values tracked during the demonstration. Hourly rates may vary as will the estimate per sample costs depending on geographic location and other economic factors. At sites where only a relative few samples are analyzed, higher unit costs may be possible. The cost of supplies includes the disposable items (e.g., centrifuge tubes) and chemicals for each extraction step (i.e., sodium pyrophosphate and sodium hydroxide). Laboratory start-up costs for equipment and associated overhead costs were not included in this cost element and are not reflected in the unit costs of Table 4. Routine laboratory equipment is required for analyzing carbon and may be operational in many environmental laboratories; therefore, costs were based on the assumption that the laboratory would have the required infrastructure and equipment for sample analysis. These items include an analytical balance, rotary tumbler, centrifuge, and a TOC analyzer. As previously noted, the cost of reporting is lumped into cost element 5.
7.1.2 Cost Element: Application of Site Models
This cost element pertains to the application of site models for estimating the timeframe of SZD and for assessing STS and LTS. The primary tasks associated with this cost element are listed in Table 4 along with the estimated labor effort required to complete them. The estimated cost for the MNA assessment is $24,900, excluding the reporting phase (i.e., the combined cost of elements 2 through 4). Because the data review and modeling plan is required for both SZD analysis and MNA sustainability assessment (cost elements 3 and 4), it was listed as a separate cost element. As noted in Section 6.3, the MNA sustainability assessment can be performed for a timeframe independent of the SZD analysis (e.g., 100 years).
27
For this demonstration, MODFLOW and SEAM3D were utilized to complete the numerical modeling. SEAM3D is available at no cost to DoD employees and DoD’s on-site contractors. The cost of a site license for GMS (version 8.3) is presently under $10K, but is free of charge to DoD personnel and DoD on-site contractors. The GMS platform includes MODFLOW and other groundwater models, including SEAM3D.
7.2 COST DRIVERS
Section 7.1 includes information for developing a reasonable cost estimate for implementing a MNA sustainability assessment at other sites including each step of the procedures described in this report. One primary driver for the total cost to perform the assessment is the quality and quantity of long-term CVOC monitoring data. This is particularly the case for analysis of SZD and estimation of the long-term reduction in contaminant source mass flux. Insufficient data can be remedied over time through additional routine monitoring data and employing new monitoring wells strategically positioned near the source. Additional high-intensity data collection, such as mass flux measurement, is also an option. Other costs of implementing a MNA sustainability assessment for data analyses will vary with the complexity of the site, the extent of data collection for PBOC tests, the level of previous mode investigations, and the level of experience that the modeler has with the site.
This page left blank intentionally.
29
8.0 IMPLEMENTATION ISSUES
8.1 IMPLEMENTATION OF PBOC TEST
Implementation of the PBOC test is relatively straight-forward and simple compared to many other methods of analysis currently in use. It is more involved and labor intensive compared to TOC of the solid phase (soil or aquifer sediment) but is less costly compared to the bioavailable iron assay (ESTCP, 2007). In fact, aquifer sediment samples previously collected and kept in cold storage are suitable. No specialized equipment or costly or labor-intensive handling of the samples is required. The results presented for Site 45 MCRD (Section 5.7) where multiple PBOC analyses were performed indicate that 1) spatial variability of PBOC within a single hydrostratigraphic unit is to be expected, and 2) solvents at high concentrations may result in PBOC concentrations below the site mean. Spatial variability in PBOC was likely to be more extreme between distinct geologic units but differences were clearly observed in similar materials. Therefore, when designing an investigation to characterize PBOC, not only are background samples necessary as controls, but differences in geologic material should be considered, particularly with depth. Additional factors are the vertical and horizontal distribution of dissolved-phase contamination, nature and age of the source, and the location of DNAPL or high-concentration source zones where diminished PBOC can be expected.
8.2 IMPLEMENTATION OF SZD ANALYSIS
Implementation issues for the SZD model center on the availability of data. The SZD model, like any mathematical model, is merely an approximation of reality, which is subject to some degree of intrinsic uncertainty owing to inherent simplifications. Furthermore, these limitations are compounded by uncertainty in source model parameters, that must be inferred by fitting to characterization data and historical monitoring data, which invariably are limited in both quantity and quality. Therefore, it is critical to quantify confidence limits on predictions of the SZD model as well as transport and reaction models to which it may be coupled. The results documented in this SZD verification study show that prediction uncertainty (i.e., increasing width of confidence bands) generally increases with greater site complexity and decreases as the amount and quantity and quality of data available for model calibration increases. Therefore, the validity of the SZD model for long-term estimates of source mass flux within a MNA scenario is conditional on ability to quantify probability distributions of predicted outcomes. Such information will enable site managers to assess the consequences and likelihood of various outcomes to realistically evaluate tradeoffs among various remediation and monitoring strategies.
8.3 IMPLEMENTATION OF MNA SUSTAINABILITY ASSESSMENT
Implementation issues of a MNA sustainability assessment are also tied to data availability at a given site along with resources to update CSMs. Sites where a mature CSM has been developed and validated over time are ideal for sustainability assessment. As discussed in Section 3.4 of the Final Report, previous modeling investigations including active site models should be leveraged
30
whenever possible to minimize cost. Data to assess the nature and spatial distribution of redox in the relevant hydrostratigraphic unit of the groundwater system is particularly necessary. DO is the key parameter for understanding redox and conducting the sustainability assessment as it pertains to chlorinated solvents. DOC in groundwater may also be useful. At present, MNA parameters are collected are regular intervals but often not as frequently as routine monitoring of CVOCs. Site data should be evaluated for the most representative data set to be used for STS assessment, which is calibration of the solute transport model to DO. In addition, the quality of the DO data should be carefully evaluated. In some cases, DO collected with older model DO probes has led to excessively high readings (i.e., DO>1 mg/L and above, which is inconsistent with reductive dechlorination).
8.4 IMPLEMENTATION OF THE TECHNOLOGY AT OTHER SITES
MNA sustainability assessment is not only applicable to sites where MNA is presently the primary remediation strategy but also at sites where the feasibility of MNA is under consideration. At this stage, the three-part assessment begins:: 1) quantify PBOC, 2) conduct SZD estimates, and 3) assess sustainability. Based on the discussion above in Section 8.2, the rate-limiting step in this process is estimating the depletion of the source zone mass flux (i.e., part 2). Thus, at any site under consideration, the quality and the extent of long-term historic CVOC data will determine if the probability distributions of predicted outcomes can be quantified. In the event that the SZD analysis is problematic or produces an unacceptable level of uncertainty, the last component of this technology may be implemented using a reasonable life-cycle time estimate. For example, a 100-year analysis could be an acceptable starting point for conducting the MNA sustainability assessment. As with any modeling investigation, best practices call for post-auditing of estimates and projections and updates to the model and results as additional data becomes available. With this approach and with new data available, a more robust estimate could be achieved (i.e., complete part 2 and revisit the sustainability assessment).
31
9.0 REFERENCES
Chapelle, F.H., J.T. Novak, J.C. Parker, B.B. Campbell, and M.A. Widdowson. 2007. A framework for assessing the sustainability of monitored natural attenuation”, U.S. Geological Survey Circular Series, C-1303, 35 p.
Chapelle, F.H., P.H. Bradley, D.J. Goode, C. Tiedeman, P.J. Lacombe, K. Kaiser, and R. Benner. 2009. Biochemical Indicators for the Bioavailability of Organic Carbon in Ground Water, Ground Water, 47(1), 108-121.
Environmental Security Technology Certification Program (ESTCP). 2007. Bioavailable Ferric Iron (BAFeIII) Assay, Cost and Performance Report, ER-0009, 29 pp.
ESTCP. 2010. Emulsified Zero-Valent Nanoscale Iron Treatment of Chlorinated Solvent DNAPL Source Areas, Final Report, ER-200431.
Falta, R.W., et al. 2007. REMChlor: Remediation evaluation model for chlorinated solvents, User’s Manual Version 1.0.
GSI Environmental, Inc. (GSI). 2007. BioBalance TookKit User’s Manual.
Harbaugh, A.W., E.R. Banta, M.C. Hill, and M.G. McDonald. 2000. MODFLOW-2000, the U.S. Geological Survey modular ground-water model – User guide to modularization concepts and the Ground-Water Flow Process.
National Research Council (NRC). 2000. Natural Attenuation for Groundwater Remediation. National Academic Press, 274 p.
Parker, J.C., and E. Park. 2004. Modeling field-scale dense nonaqueous phase liquid dissolution kinetics in heterogeneous aquifers, Water Resources Research, 40(5), doi: 10.1029/2003WR002807.
Park, E., and J.C. Parker. 2005. Evaluation of an up-scaled model for DNAPL dissolution kinetics in heterogeneous aquifers, Advances in Water Resources, 28, 1280-1291.
Parker, J.C., E. Park, and G. Tang. 2008. Dissolved plume attenuation with DNAPL source remediation, aqueous decay and volatilization – Analytical solution, model calibration and prediction uncertainty, J. Contam. Hydrol., DOI 10.1016/j.jconhyd.2008.03.009.
Rectanus, H.V., M.A. Widdowson, J.T. Novak, and F.H. Chapelle. 2007. Investigation of reductive dechlorination supported by natural organic carbon, Ground Water Monitoring and Remediation, 27(4), 53-62.
Truex, M.J., C.D. Johnson, and C.R. Cole. 2006. Numerical Flow and Transport Model for the Fort Lewis Logistics Center, Fort Lewis, Washington, DSERTS NO. FTLE-33. Pacific Northwest National Laboratory, Richland, Washington. 121 p.
32
U.S. Army Corps of Engineers (USACE). 2008. East Gate Disposal Yard Thermal Remediation Performance Assessment After Action Report. 248 p.
USEPA. 1999. Use of Monitored Natural Attenuation at Superfund, RCRA Corrective Action, and Underground Storage Tank Sites. OSWER Directive 9200.4-17P. Office of Solid Waste and Emergency Response. www.cluin.org/download/reg/d9200417.pdf
Vroblesky, D.A., M.D. Petkewich, J.E. Landmeyer, and M.A. Lowery. 2009. Source, transport, and fate of groundwater contamination at Site 45, Marine Corps Recruit Depot, Parris Island, South Carolina: U.S. Geological Survey Scientific Investigations Report 2009–5161, 80 p.
Waddill, D.W., and M.A. Widdowson. 1998. Three-Dimensional Model for Subsurface Transport and Biodegradation. ASCE J. of Environmental Engineering. 124(4): 336-344.
Waddill, D.W., and M.A. Widdowson. 2000. SEAM3D: A Numerical Model for Three-Dimensional Solute Transport and Sequential Electron Acceptor-Based Biodegradation in Groundwater. U.S. Army Engineer Research and Development Center Technical Report ERDC/EL TR-00-18, Vicksburg, MS.
Widdowson, M.A. 2004. Modeling natural attenuation of chlorinated ethenes under spatially-varying redox conditions. Biodegradation, 15, 435-451.
A-1
APPENDIX A
POINTS OF CONTACT
Point of Contact Organization
Phone Fax
E-Mail Role In Project
Carmen A. Lebrón NAVFAC ESC EV411 1100 23rd Avenue Port Hueneme, CA 93043