52
9 Annual 9 Esterline

9
Annual9Esterline

10p : / Esterl ine Technologies1p :
Operating ResultsSales $ 460,969 $ 453,902Segment earnings 56,932 60,143Net earnings 29,862 30,084Net earnings per share – basic $ 1.72 $ 1.74Net earnings per share – diluted $ 1.69 $ 1.70
Weighted average shares outstanding – basic 17,337 17,290Weighted average shares outstanding – diluted 17,658 17,718
Financial PositionTotal assets $ 453,082 $ 387,179Property, plant and equipment – net 89,339 94,062Working capital 140,908 70,099Shareholders’ equity 224,620 196,376
All share andper share data inthis report r eflecta 1998 two-for-one stock split.
Financial Highlights.
in thousands,except per shareamounts for the years ended October 31, 1999 1998
1

To our shareholders The most important aspect of 1999relates to Esterline’s future. We pushed hardduring the year to sharpen the focus on thosecore strengths that support our long-termstrategic direction. The moves we made arecreating a new Esterline – a leaner, more pro-ductive, more competitive company, with a profilethat’s simpler for investors to understand.
➞
Wendell P. HurlbutChairman
Robert W. CreminPresident and Chief Executive Officer

2 3p : /2
In the coming year, nearly 70% of Esterline’s revenues will begenerated from worldwide aerospace and defense markets.Within this arena, Esterline is the unquestioned marketleader in: High-performance sensors and controls Illuminated cockpit components Advanced elastomer
materials.
New Business Segments To better reflect our focused approach,beginning with this report, we will present the business inthree new segments: Aerospace, Advanced Materials, andAutomation (see Note 11, page 49).
The first two segments serve principally global aerospaceand defense markets. In Aerospace, Auxitrol and Korry arekey operations, designing and manufacturing high-end com-ponents for avionics, propulsion and guidance systems. InAdvanced Materials, we develop high-performance elastomersand other complex materials for a variety of applications, chieflythrough our Kirkhill operation.
Targeting the Global Aerospace Market Auxitrol is essential to our strategicgrowth plan as aviation markets continue to globalize. Overthe past several years, combining new product developmentand market share expansion with acquisitions, we have nearlytripled Auxitrol’s aerospace revenues, creating a significant
growth platform serving the needs of manufacturers and
airlines around the world. Headquartered in Europe with asolid U.S. footing – enhanced through a key 1998 acquisition –Auxitrol manufactures high-end temperature and pressuresensors as well as fluid regulation devices for monitoringand controlling various flight systems. Auxitrol’s key positionon the GE/Snecma CFM-56 jet engine is indicative of thisreach – the CFM-56 powers most Airbus models and all Boeing737s. In a recent acquisition, we further expanded Auxitrol’smarket reach by adding a U.K.-based manufacturer of micro-motors and motion control sensors. With this transactionwe gain solid new positions with the British Ministry of Defenseand such prominent original equipment manufacturers(OEMs) as TRW and BAE Systems. We also gain consolidationbenefits and the ability to support and cross-sell all of ourproduct lines to key manufacturers throughout Europe, theU.S. and the U.K.
Korry is a similar success story. The world’s leading manu-facturer of lighted cockpit switches and flight control grips,Korry has grown more than threefold since we acquired it in1989. Esterline benefits from Korry’s long-time presenceon every new Boeing commercial jet built – a position thatleads to substantial aftermarket demand from airlines aswell. And commercial aviation is only half the picture. Defenseagency demand for our control sticks, grips and proprietary
4 5p : /
sunlight-readable/night-vision compatible displays has growndramatically over the past several years as fleets of militaryaircraft and land vehicles are upgraded to state-of-the-artelectronic systems.
The continuing consolidation within the aerospace/defenseindustry is a dynamic contributor to preferred providers suchas Auxitrol and Korry. As our customers move increasinglyaway from fabrication and toward assembly/integration, wesee significant opportunities to move up the value chain.In order to sustain this momentum, we are continuallyoffering a wider package of value-added products throughinternal development and synergistic acquisitions.
As a case-in-point, in December 1999 we completed theacquisition of the world’s leading independent manufac-turer of custom keyboards and other types of multifunctiondata input subsystems. The acquisition is a great fit,not only expanding our potential for high-end i l lum-inated displays and custom panels for aerospace, but alsoextending our technology into medical and other high-endapplications.
Advanced Materials – An Important Growth Platform “Advanced Materials”may be a new business segment designation, but Esterlinehas successfully managed advanced materials operations

for more than a decade. It wasn’t until the late 1998
acquisition of Kirkhill, however, that this segment gainedthe critical mass to be considered a growth platform. Overthe years, we had carved out the leading niche position forelastomer applications in jet propulsion systems, throughour TA Mfg. subsidiary. Kirkhill provided the broader marketreach and extensive manufacturing capability to fully developthe opportunities for high-temperature elastomer products.Combining Kirkhill and TA offers obvious benefits as demandincreases for higher performance, lighter weight componentsmade from our engineered elastomer materials.
Armtec Defense Products also fits well in Advanced Materials.Armtec manufactures combustible ordnance products andis the U.S. Army’s sole supplier of propellant cases fortank gun systems, artillery, and mortars. These productsnot only act as rigid propellant containers, they also ignitewhen fired, improving the performance of the ammunition.During the year, we brought on-line a new state-of-the-artfacility to accommodate the U.S. Army’s production require-ments for its new-generation 155mm Modular Artillery ChargeSystem (MACS). We have moved experimental round pro-duction into the new facility, and anticipate that initialproduction of the recently type-classified charge will beginin mid-2000.

6 7p : /
Lasers Key to Automation Strategy Our Automation segment bore thebrunt of the economic downturn in Asia, but we continue tolead the way in the development of highly specialized auto-mated equipment for the manufacture of printed circuit boardsand the fabrication of plate steel. During the year, we main-tained our long-term focus in this segment with increasedR&D efforts at Excellon and Whitney to ensure our technologicaledge when markets improve. Significantly, we introducedtwo new laser systems. Excellon’s LVD-2001 uses two separatehigh-repetition pulsed laser sources for the production of micro-vias. These extraordinarily small holes are multiplying on theever-shrinking circuit boards used increasingly by the tele-communications industry. And Whitney’s PlateLASERTM is thefastest, most powerful laser available for precision cutting ofplate steel – redefining the competitive landscape.
We also finalized our planned exit from the slow growth indus-trial instrumentation market late in the year, with the divestitureof our Federal Products subsidiary. The transaction, whichresulted in an $8 million gain, was the last of three such divest-itures completed in recent years related to this market.
As for many small cap manufacturing companies, 1999 wasnot the best of years for Esterline’s stock price. Yet in spiteof some pretty tough market conditions, we finished the year

with sales and earnings effectively unchanged from last year’srecord-breaking performance.
We believe the actions of 1999 – particularly the continuedrefinement of our core growth platforms and the exit fromnon-strategic businesses – present a clearer, more coherentpicture of Esterline’s true strengths to investors. And moreimportantly, they underscore Esterline’s strategic direction:to focus our efforts and resources on technologies that offergreater opportunities for growth and higher returns to share-holders.
In closing, we would like to draw attention to the extraordi-nary efforts of our employees. These dedicated people,numbering more than 4,000 around the world, have con-tributed significantly to Esterline’s accomplishments. Thebooklet you found at the front of this report is a messagefrom them and represents only a small sample of the tangibleresults achieved by their hard work.
Robert W. Cremin | Wendell P. Hurlbut
President and Chief Executive Officer Chairman

ou r moves➞

greater
focus➞
automation• exited non-core
businesses
• R&D yieldssignificant advancesin laser technology
• positioned for improvingelectronics markets
advanced materials• focus on
worldwideaerospace /defenseapplications
• efficient operatingstructure offers opportunityfor accelerated growth
• creating extraordinaryvalue with proprietaryhigh-performancematerials
• acquisitionsextend globalreach
aerospace
• expanded presencewith OEMs,aftermarkets,and defenseapplications
• consolidationbrings greaterefficiency

greater
execution➞
➞ ➞ ➞
automation• exited non-core
businesses
• R&D yieldssignificant advancesin laser technology
• positioned for improvingelectronics markets
advanced materials• focus on
worldwideaerospace /defenseapplications
• efficient operatingstructure offers opportunityfor accelerated growth
• creating extraordinaryvalue with proprietaryhigh-performancematerials
• Acquisitions play an important role inour global expansion – particularly forour Europe-based Auxitrol. In additionto consolidating the European designand manufacture of aerospacetemperature and pressure sensors,aggressive moves have been madeto acquire U.S. and U.K.-basedcompanies to expand our geographicreach and our product offering toinclude fluid regulation devices andmotion control sensors.
• We lead the industry in high-performancesensors, controls and illuminated cockpitcomponents – worldwide. And as aviationmarkets continue to globalize, we arecombining acquisitions, new productdevelopment and market share expansionin our own globalization. Our aerospacerevenues are now derived equally fromU.S. and Europe, OEMs and airlines,commercial and defense. • Continuing industry consolidation provides
significant growth opportunities for preferredpartners like Esterline to provide more value-added products to customers. Internalconsolidation also provides benefits. Korryand Mason will operate as one going into2000, creating the opportunity to cross-selldisplays and control wheels, sticks and gripsto cockpit designers around the world.
aerospace • consolidationbrings greaterefficiency
• expanded presencewith OEMs,aftermarket,and defenseapplications
• acquisitionsextend globalreach

greater
opportunity
➞ ➞ ➞
automation• exited non-core
businesses
• R&D yieldssignificant advancesin laser technology
• positioned for improvingelectronics markets
• We combined the operationsof three elastomer operationsinto one. TA Mfg., whichleads the aerospace industryin high-value, jet engineapplications and KRK’sspecialty seals are nowdivisions of Kirkhill.We also combined large-scale manufacturingexperience with proprietarytechnologies: a combinationthat leverages the strengthsof each operation.
• Our advanced materialsoperations offer tremendousgrowth opportunity as aero-space, defense, medical,telecom and computercustomers seek lighterweight, higher performanceand lower cost customsolutions. Our proprietarysilicone elastomers, somecapable of withstanding700°F for extended periodsof time, enable higherperformance from jetpropulsion systems.
• Two important advanced materialbreakthroughs will fuel our growth.First, Armtec’s new 155mm modularartillery case system is expected toenter production in mid-2000. Asdurable as a steel shell casing, MACSis critical technology, and Armtecis the U.S. Army’s sole source.Second, Fastbloc®, a proprietaryhigh-temperature silicone elastomerthat forms an effective fire barrierwhen applied as a caulk, putty orpaint, offers great potential.
advanced materials• focus on
worldwideaerospace /defenseapplications
• efficient operatingstructure offers opportunityfor accelerated growth
• creating extraordinaryvalue with proprietaryhigh-performancematerials
• expanded presencewith OEMs,aftermarket,and defenseapplications
• acquisitionsextend globalreach
• consolidationbrings greaterefficiency
aerospace

greater
innovation
➞ ➞ ➞
• Sold in October, Federal was Esterline’sonly metrology company and accountedfor just 10% of total revenue over thelast several years. The transactionenables us to better focus resources onhigher-growth technology platforms.
• Electronics markets are recovering from theAsian crisis, and leading indicators are pointingin a positive direction. Excellon is well positionedfor the recovery. With a full spectrum of bothmechanical and laser drilling equipment. Atspeeds up to 60,000 holes per minute, ourlaser technology sets the new standard forthe production of micro-vias – holes as smallas .0002" in all types of multilayer PCBs andmultichip modules.
• From circuit boards to plate steel, we also developedthe world’s most powerful steel cutting laser. Thenew PlateLASER 6000 Class combines years of cuttingexperience with patented technology to produce theleader in power, speed and productivity. The 6 kilowattlaser produces parts with smooth, straight edgesin material up to 2" thick, perfect for automatedassembly.
automation• exited non-core
businesses
• R&D yieldssignificant advancesin laser technology
• positioned for improvingelectronics markets
advanced materials• focus on
worldwideaerospace /defenseapplications
• efficient operatingstructure offers opportunityfor accelerated growth
• creating extraordinaryvalue with proprietaryhigh-performancematerials
• acquisitionsextend globalreach
• consolidationbrings greaterefficiency
aerospace
• expanded presencewith OEMs,aftermarket,and defenseapplications

16% Advanced Materials
33% Aerospace
51% Automation
28% Advanced Materials
40% Aerospace
32% Automation
Taken individually, our moves are designed toadd capability and revenue. Taken as a whole,they will accomplish much more. The moveswe’ve made over the past three years werespecifically designed to position Esterline asthe dominant player in highly specialized marketniches, while simultaneously enabling cross-selling,greater geographic reach, deeper market accessand clearer business focus. The result hassubstantially improved the balance of productsand technologies Esterline offers, while positioningthe company for significant growth.
We acquiredMuirhead and NorcroftDynamics to expandopportunities for ourAuxitrol division througha broader offeringof products and mutualaccess to U.K. andEuropean markets.
During calendar 1997 and1998 we began developingour new alignment. Weacquired Fluid Regulators,Kai R. Kuhl, MemtronTechnologies and KirkhillRubber. Combined withstrategic product lineacquisitions, mostly withinour aerospace business,we took the first stepsto making Esterline morefocused on its inherentmarket strengths.
To further enhance ourdominant posi t ion in
l ighted switch displaytechnologies, we added
Advanced Input Devices toour capabi l i ty and product
mix. There is an immediatemarket and product
synergy between A.I .D.and our Korry div is ion.
From 1997 through 1999, we have moved Esterline in a newdirection. But it is important to understand that our strategydemands that we remain opportunistic, and we have left thedoor open to shaping our business on the basis of greatestreward. We define that as whatever offers the best fit withour core competencies: with product line extension; withgreater market reach; with synergies in operations; with newtechnology and customers.
By the end of 1999Ester l ine has evolved intoa more balanced company,with substant ia l increasesin our aerospace marketcapabi l i t ies , products andrevenues.
➞
➞
1997 Sales
1999 Sales

This growth will occur thanks to the strengthwe’ve gained by strategically combining ouracquisitions with our existing companies. Add the initiative of our people – who continueto discover ways to be more effective, moreefficient and more responsive to our customers –and the value of this well-positioned group ofbusinesses called Esterline becomes increasinglyevident. And we’ll continue to evaluate andfollow new opportunities that lead us to an evenmore valuable definition of our company.
The peopleof Esterline
have taken theinitiative in
developing theirown distinctive
approach toapplying lean
manufacturingtechniques.
We want to thank thepeople of Ester l ine forthei r commitment andini t iat ive. Thei r contr ibu-t ions cannot be under-est imated. We al l benef i tf rom the improvementsthey’ve made in the waythey do thei r jobs, theproducts they produce andthe re lat ionships theybui ld. The resul ts they’vereal ized contr ibute to theway we work, and theresul ts we a l l achieve.
Their drive to makeprocess improvementsstarted small, andspread throughoutEsterline companies.It all began with anidea and has becomea process our peopleown, completely.

financial review➞
management’s discussionand analysisp : 24
notesp : 36
statementsp : 32
➞
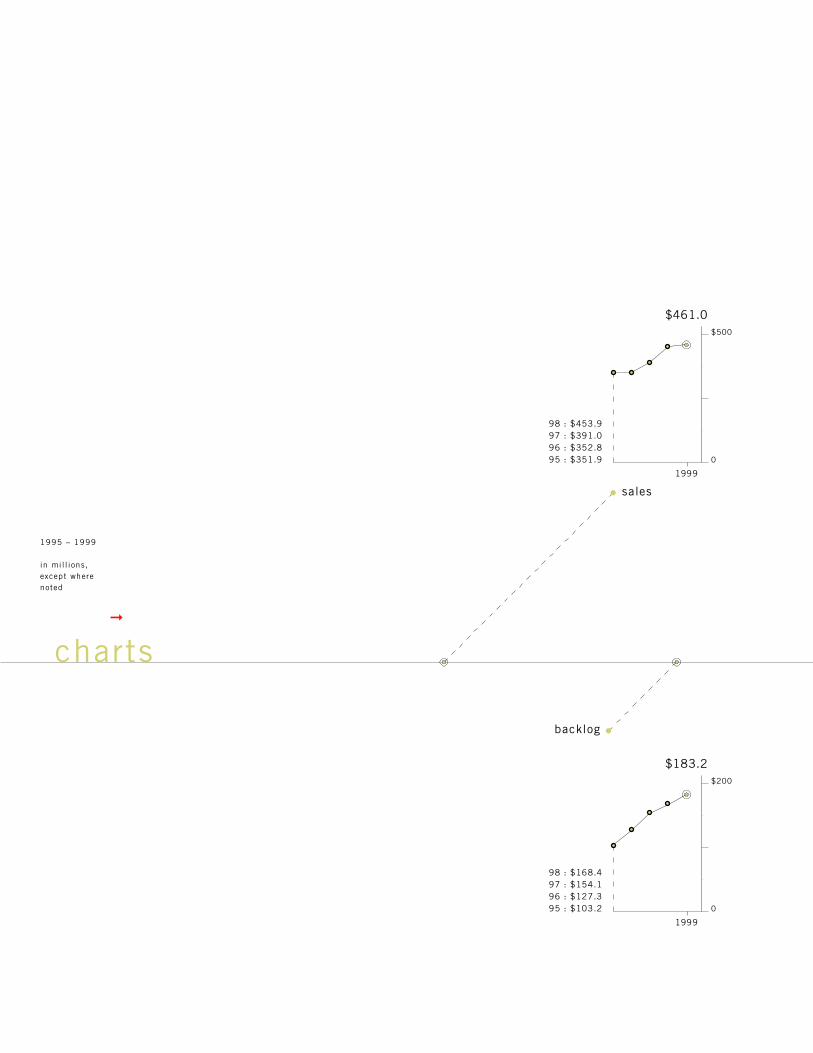
1995 – 1999
in mil l ions,except wherenoted
98 : $453.997 : $391.096 : $352.895 : $351.9
$461.0
sales
backlog
98 : $168.497 : $154.196 : $127.395 : $103.2
$183.2
1999
1999
0
$500
0
$200
charts

$1.69
98 : $1.7097 : $1.4496 : $1.3195 : $1.26
net earningsper share –diluted[ dollars ]
total equity /total capital [ percent ]
shareholders’equity
$29.9
98 : $30.197 : $25.396 : $21.495 : $17.4
net earnings
63%
98 : 69%97 : 82%96 : 78%95 : 62%
$224.6
98 : $196.497 : $165.796 : $142.395 : $083.7
1999 1999
1999 1999
0
$30
0
$2.00
0
$250
0
100%
Esterl ine Technologies
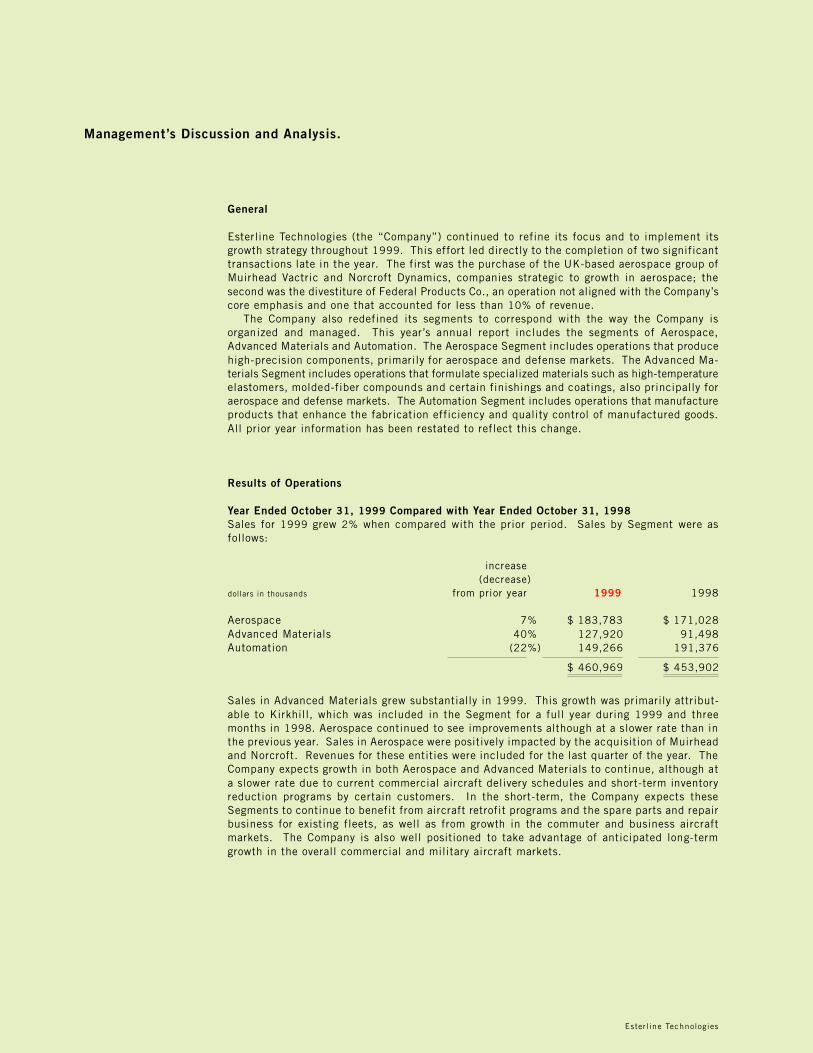
Management’s Discussion and Analysis.
General
Esterline Technologies (the “Company”) continued to refine its focus and to implement itsgrowth strategy throughout 1999. This effort led directly to the completion of two significanttransactions late in the year. The first was the purchase of the UK-based aerospace group ofMuirhead Vactric and Norcroft Dynamics, companies strategic to growth in aerospace; thesecond was the divestiture of Federal Products Co., an operation not aligned with the Company’score emphasis and one that accounted for less than 10% of revenue.
The Company also redefined its segments to correspond with the way the Company isorganized and managed. This year’s annual report includes the segments of Aerospace,Advanced Materials and Automation. The Aerospace Segment includes operations that producehigh-precision components, primarily for aerospace and defense markets. The Advanced Ma-terials Segment includes operations that formulate specialized materials such as high-temperatureelastomers, molded-fiber compounds and certain finishings and coatings, also principally foraerospace and defense markets. The Automation Segment includes operations that manufactureproducts that enhance the fabrication efficiency and quality control of manufactured goods.All prior year information has been restated to reflect this change.
Results of Operations
Year Ended October 31, 1999 Compared with Year Ended October 31, 1998Sales for 1999 grew 2% when compared with the prior period. Sales by Segment were asfollows:
increase(decrease)
dollars in thousands from prior year 1999 1998
Aerospace 7% $ 183,783 $ 171,028Advanced Materials 40% 127,920 91,498Automation (22%) 149,266 191,376
$ 460,969 $ 453,902
Sales in Advanced Materials grew substantially in 1999. This growth was primarily attribut-able to Kirkhill, which was included in the Segment for a full year during 1999 and threemonths in 1998. Aerospace continued to see improvements although at a slower rate than inthe previous year. Sales in Aerospace were positively impacted by the acquisition of Muirheadand Norcroft. Revenues for these entities were included for the last quarter of the year. TheCompany expects growth in both Aerospace and Advanced Materials to continue, although ata slower rate due to current commercial aircraft delivery schedules and short-term inventoryreduction programs by certain customers. In the short-term, the Company expects theseSegments to continue to benefit from aircraft retrofit programs and the spare parts and repairbusiness for existing fleets, as well as from growth in the commuter and business aircraftmarkets. The Company is also well positioned to take advantage of anticipated long-termgrowth in the overall commercial and military aircraft markets.

Esterl ine Technologies2524 /p :MD + A
Sales in Automation declined due to a variety of unfavorable market conditions during theyear. These included continuing poor worldwide demand for printed circuit board (“PCB”)manufacturing equipment as well as soft agriculture and automotive markets. The sale ofTulon in late 1998 also impacted Automation in the year-over-year comparison.
Sales to foreign customers, including export sales by domestic operations, totaled $137.3 millionand $120.2 million, and accounted for 30% and 26% of the Company’s sales for 1999 and1998, respectively.
Gross margin as a percentage of sales was 38% for both 1999 and 1998. On a compara-tive basis, gross margin in Aerospace decreased slightly due to volumes that were lower thanexpected. Gross margin for Advanced Materials decreased during the year due to volumedecreases and new business included for a full year, primarily Kirkhill. An increase in Auto-mation margin was related primarily to improvements at Federal Products relative to the prioryear, and the divestiture of Tulon late in 1998. Gross margins by Segment ranged from 34%to 40% in 1999, compared with 33% to 42% in the prior year.
Selling, general and administrative expenses (which include corporate expenses) increasedto $106.2 million in 1999 compared with $102.4 million in the prior year. As a percentageof sales, selling, general and administrative expenses were 23% in both 1999 and 1998.Research, development and related engineering spending increased to $24 million in 1999from $20.8 million in 1998, and remained constant as a percentage of sales when comparedwith the prior year. Developments continued in laser technology for Automation; switchesand sensors for Aerospace; and fireproofing elastomer for Advanced Materials during 1999.
Segment earnings (excluding corporate expenses) decreased 5% to $56.9 million com-pared with $60.1 million in the prior year. Aerospace earnings were essentially flat with lastyear. Advanced Materials posted earnings of $29.2 million in 1999 compared with $24.7 millionin 1998. The improvement was primarily due to Kirkhill’s full year of earnings. Automationearnings decreased to $2.9 million in 1999 compared with $10.7 million in the prior year.This reduction was primarily due to the continued effects of a depressed worldwide PCBequipment market and was compounded in the second half of the year by a significant de-cline in the agriculture sector.
Prior to the close of the year, the Company completed the sale of Federal Products to MahrGmbH. Federal Products was the Company’s only metrology business and accounted for lessthan 10% of the Company’s sales during 1999. The Company recognized an $8 million gainon the sale for 1999.
Interest income increased to $2.9 million compared with $1.6 million in the prior year.Interest expense increased to $9 million during 1999 compared with $3.8 million in the prioryear. In November 1998, the Company completed a $100 million private placement of seniornotes (“1999 Senior Notes”). The proceeds of this placement were used to retire an out-standing bridge facility arising from the Kirkhill acquisition. The remainder has been investedand is being utilized to fund other internal expansion and acquisition activities.
The effective income tax rate decreased to 35% in 1999 from 36% in 1998, primarily dueto a one-time benefit related to state taxes.
Net earnings in 1999 were $29.9 million, or $1.69 per share on a diluted basis, comparedwith $30.1 million, or $1.70 per share, in the prior year.
Orders received in 1999 increased 6% to $475.7 million from $448.5 million in the prioryear. Backlog at October 31, 1999 was $183.2 million compared with $168.4 million at theend of the prior year. Approximately $32.5 million of backlog is scheduled to be deliveredafter 2000. Backlog is subject to cancellation until delivery.
Esterl ine Technologies
Year Ended October 31, 1998 Compared with Year Ended October 31, 1997
Sales for 1998 grew 16% when compared with the prior period. Sales by Segment were asfollows:
increase(decrease)
dollars in thousands from prior year 1998 1997
Aerospace 32% $ 171,028 $ 129,354Advanced Materials 46% 91,498 62,760Automation (4%) 191,376 198,844
$ 453,902 $ 390,958
Sales in Aerospace and Advanced Materials grew substantially in 1998. The growth wasprimarily attributable to continued strong aerospace market demand and acquisitions. Dur-ing this period, both Segments benefited from the increased production of new aircraft. Automationexperienced a downturn during the last half of the year primarily due to sluggish worldwidemarket demand for PCB manufacturing equipment. A contributing factor was the destabilizedAsian economy.
Sales to foreign customers, including export sales by domestic operations, totaled $120.2 millionand $129.6 million, and accounted for 26% and 33% of the Company’s sales for 1998 and1997, respectively.
Gross margin as a percentage of sales was 38% for both 1998 and 1997. On a comparativebasis, Aerospace gross margin improved due to favorable commercial aerospace market con-ditions, while decreases were experienced in Advanced Materials and Automation. The AdvancedMaterials gross margin decrease included the impact of costs related to occupying new facili-ties. Key factors in the Automation gross margin decrease were the fourth quarter weaknessin the market for quality control instrumentation products related to a strike at General Motors,and economic instability in Asia which directly affected pricing and demand for PCB manu-facturing equipment. In addition, consolidation of the customer base resulted in larger butfewer buyers in the PCB manufacturing markets. Gross margins by Segment ranged from33% to 42% in 1998, compared with 35% to 46% in the prior year.
Selling, general and administrative expenses (which include corporate expenses) increasedto $102.4 million in 1998 compared with $90.9 million in the prior year. As a percentage ofsales, selling, general and administrative expenses were 23% in both 1998 and 1997. Research,development and related engineering spending increased to $20.8 million in 1998 from $17.6million in 1997, and remained constant as a percentage of sales. New laser technology,specialized materials, and lighting solutions for aircraft cockpits were some of the projectsbeing pursued in 1998 which resulted in new and enhanced products.
Segment earnings (excluding corporate expenses) increased 26% to $60.1 million comparedwith $47.6 million in the prior year. Aerospace and Advanced Materials posted earnings of$24.8 million and $24.7 million in 1998 compared with $16.0 million and $15.9 million in1997. Strong aerospace and defense markets were the primary factors for improved earnings inboth Segments. Automation earnings decreased 32% for the year to $10.7 million from $15.8million in the prior year primarily due to the difficult PCB manufacturing environment.

Esterl ine Technologies2726 /p :
As available cash was used to complete acquisitions, interest income decreased to $1.6 millioncompared with $2.4 million in the prior year. Interest expense remained essentially unchanged at$3.8 million during 1998 from $3.6 million in the prior year.
The effective income tax rate increased to 36% in 1998 from 34% in 1997 primarily due tonon-deductible goodwill resulting from acquisitions made during the year.
Net earnings in 1998 were $30.1 million, or $1.70 per share on a diluted basis, comparedwith $25.3 million, or $1.44 per share, in the prior year.
Orders received in 1998 increased 7% to $448.5 million from $417.8 million in the prioryear. Backlog at October 31, 1998 was $168.4 million compared with $154.1 million at theend of the prior year.
The Company has not experienced any significant year 2000 (“Y2K”) issues, however, it doesexpect that immaterial Y2K related issues may occur. To that extent, the Company is engagedin ongoing efforts to ensure all Y2K issues are identified and resolved as early as possible.
Few of the Company’s products contain software coding. For products identified as con-taining software, testing was completed and updates have been available for some time. TheCompany has sought to identify customers that require upgrades. The Company’s businesseshave posted information on their websites and on each invoice sent to customers. In theevent that a customer experiences a Y2K failure, staff and upgrade kits are available to resolveissues.
Based on currently available information, the Company estimates total costs to be expendedfor outside consultants, software and hardware applications to be less than $1 million. TheCompany does not track internal costs such as payroll related to Y2K projects.
Liquidity and Capital Resources
Cash and equivalents at October 31, 1999 totaled $55 million, an increase of $46.2 millionfrom October 31, 1998. Short-term investments at October 31, 1999 were $25.9 millioncompared with no short-term investments at October 31, 1998. Net working capital increasedto $140.9 million at October 31, 1999 from $70.1 million at October 31, 1998. Increasesin both cash and net working capital are primarily related to the 1999 Senior Notes. Proceedsfrom the placement were used to retire a bridge facility for the Kirkhill acquisition. Theremainder has been invested and is being utilized to fund other internal expansion and acqui-sition activities.
Net accounts receivable were $69.6 million at October 31, 1999, compared to $77.5 millionat October 31, 1998. Accounts payable decreased $6.4 million to $16.9 million at October 31,1999. Federal and foreign income taxes payable increased $5.9 million to $6.3 million atOctober 31, 1999. These variances were primarily in Automation, largely due to the sale ofFederal Products in October, and also the depression in both the PCB and agriculture relatedbusinesses. Net property, plant and equipment was $89.3 million at October 31, 1999,compared with $94.1 million at the end of the prior year primarily due to the sale of FederalProducts. The reduction was partially offset by the purchase of Muirhead/Norcroft. Goodwillalso increased to $105.4 million at October 31, 1999 compared with $99.3 million at October 31,1998, due to the acquisition.
MD + A
Esterl ine Technologies
Capital expenditures for 1999 were $15.6 million (excluding acquisitions) and includedmachinery and equipment, some minor facility expansions and enhancements to informationtechnology systems in order to support growth and operational effectiveness. Capital expen-ditures are anticipated to approximate $21.5 million for 2000 as the Company continues tosupport expansion through investments in infrastructure.
Total debt increased $39.4 million from October 31, 1998 to $129.4 million at October 31,1999, principally due to the 1999 Senior Notes placement. Total debt outstanding at October 31,1999 consisted of $100 million under the Company’s 1999 Senior Notes, $17.1 million underthe Company’s 8.75% Senior Notes, $1.6 million for revenue bonds and $10.7 million undervarious foreign currency debt agreements, including capital lease obligations. The 8.75% SeniorNotes have a scheduled annual payment of $5.7 million, which will continue until maturityon July 30, 2002. The 1999 Senior Notes have maturities ranging from 5 to 10 years andinterest rates from 6% to 6.77%. Management believes cash on hand, funds generated fromoperations and other available debt facilities are sufficient to fund operating cash require-ments and capital expenditures through 2000.
Market Risk Exposure
The Company has financial instruments that are subject to interest rate risk, principally short-term investments and debt obligations issued at a fixed rate. To the extent that sales aretransacted in a foreign currency, the Company is also subject to foreign currency fluctuationrisk. Furthermore, the Company has assets denominated in foreign currencies that are notoffset by liabilities in such foreign currencies. Historically, the Company has not experi-enced material gains or losses due to interest rate or foreign exchange fluctuations.
Subsequent Events
On December 21, 1999, the Company purchased Advanced Input Devices (“A.I.D.”). A.I.D.is a privately held company with annual sales of approximately $40 million, located in Coeurd’Alene, Idaho. It is the world’s leading independent manufacturer of custom keyboards andother multifunction data input subsystems. A.I.D. is a strategic purchase for the Company’sgrowth platform around high-end illuminated displays and custom panels and will be in-cluded in Aerospace. The transaction was accounted for under the purchase method andfunded with available cash.

Esterl ine Technologies2928 /p :
Forward-Looking Statements
Certain statements in the above commentary and throughout this annual report contain for-ward-looking statements within the meanings of Section 27A of the Securities Act of 1933,as amended, and Section 21E of the Securities Exchange Act of 1934, as amended. Suchstatements involve risks and uncertainties regarding matters that could significantly affectexpected results, including information about industry trends, growth, Y2K, orders, currencyfluctuations, backlog, capital expenditures and cash requirements. The Company is suscep-tible to economic cycles and financial results can vary widely based on a number of factors,including domestic and foreign economic conditions and developments affecting specificindustries and customers.
A significant portion of the sales and profitability of the Company’s businesses is derivedfrom aerospace, defense, computer, electronics, telecommunications, medical and agricultureequipment markets. The products sold by most of the Company’s businesses represent capi-tal investment or support for capital investment by either the initial customer or the ultimateend-user. Changes in general economic conditions or conditions in these and other specificindustries, capital acquisition cycles and government policies, collectively or individually,can have a significant effect on the Company’s results of operations and financial condition.Thus, actual results may vary materially from these forward-looking statements. The Companydoes not undertake any obligation to publicly release the results of any revisions that may bemade to these forward-looking statements to reflect any future events or circumstances.
Recent Accounting Pronouncements
In June 1998, the Financial Accounting Standards Board (“FASB”) issued Statement ofFinancial Accounting Standards No. 133, “Accounting for Derivative Instruments and HedgingActivities,” and established standards for derivative instruments, including certain derivativeinstruments embedded in other contracts and hedging activities. The FASB delayed imple-mentation of this standard, therefore, it will now be effective for the Company beginning infiscal 2001. The Company is studying this pronouncement to determine its effect, includingadditional disclosure requirements that may be necessary.
MD + A

Esterl ine Technologies
Selected Financial Data.
in thousands,except per shareamounts
for the years endedOctober 31, 1999 1998 1997 1996 1995
Operating Results
Sales $ 460,969 $ 453,902 $ 390,958 $ 352,843 $ 351,897Cost of sales 286,410 281,539 243,197 215,015 215,934Selling, general
and administrative 106,239 102,361 90,918 88,042 90,475Research, development
and engineering 24,022 20,846 17,556 15,373 16,638Gain on
sale of business (7,956) – – – –Restructuring
credit – – – – (2,067)Interest income (2,859) (1,594) (2,397) (1,989) (1,156)Interest expense 9,011 3,803 3,603 4,328 5,598Income tax expense 16,240 16,863 12,760 10,720 9,094Net earnings 29,862 30,084 25,321 21,354 17,381Net earnings
per share –diluted $ 1.69 $ 1.70 $ 1.44 $ 1.31 $ 1.26
Financial Structure
Total assets $ 453,082 $ 387,179 $ 289,847 $ 276,646 $ 225,714Long-term debt, net 116,966 74,043 27,218 29,007 35,543Shareholders’ equity 224,620 196,376 165,718 142,304 83,706
Weightedaverage sharesoutstanding –diluted 17,658 17,718 17,608 16,334 13,740

Esterl ine Technologies3130 /p :
Principal Market –New York Stock Exchange
Quarter
First $ 24.13 $ 18.25 $ 19.13 $ 15.81Second 19.63 12.13 23.13 16.50Third 16.75 12.38 24.50 17.63Fourth 16.63 13.25 21.88 15.50
At October 31, 1999 there were approximately 839 holders of record of the Company’s commonstock.
Market Price of Esterline Common Stock.
for the years endedOctober 31, 1999 1998
High Low High Low
SelectedFinancialData
MarketPrice ofEsterlineCommonStock
in dollars
Esterl ine Technologies
Sales $ 460,969 $ 453,902 $ 390,958Cost of Sales 286,410 281,539 243,197
174,559 172,363 147,761Expenses
Selling, general and administrative 106,239 102,361 90,918Research, development
and engineering 24,022 20,846 17,556
Total Expenses 130,261 123,207 108,474
Operating Earnings 44,298 49,156 39,287
Gain on sale of business (7,956) – –Interest income (2,859) (1,594) (2,397)Interest expense 9,011 3,803 3,603
Net Other (Income) Expense (1,804) 2,209 1,206
Earnings Before Income Taxes 46,102 46,947 38,081Income Tax Expense 16,240 16,863 12,760
Net Earnings $ 29,862 $ 30,084 $ 25,321
Net Earnings Per Share – Basic $ 1.72 $ 1.74 $ 1.48
Net Earnings Per Share – Diluted $ 1.69 $ 1.70 $ 1.44
Consolidated Statement of Operations.
in thousands,except pershare amounts for the years ended October 31, 1999 1998 1997
see notes toconsolidatedfinancialstatements

Esterl ine Technologies3332 /p :
Assets
Current AssetsCash and equivalents $ 55,047 $ 8,897Short-term investments 25,933 –Accounts receivable, net of allowances
of $2,233 and $2,987 69,613 77,477Inventories 71,430 71,835Deferred income taxes 16,212 15,693Prepaid expenses 4,251 4,055
Total Current Assets 242,486 177,957
Property, Plant and EquipmentLand 13,159 13,400Buildings 62,561 66,451Machinery and equipment 117,555 126,253
193,275 206,104Accumulated depreciation 103,936 112,042
89,339 94,062
Other Non-Current AssetsGoodwill, net 105,383 99,344Intangibles, net and other assets 15,874 15,816
$ 453,082 $ 387,179
Liabilities and Shareholders’ Equity
Current LiabilitiesAccounts payable $ 16,918 $ 23,307Accrued liabilities 65,974 68,275Credit facilities 5,138 9,533Current maturities of long-term debt 7,249 6,358Federal and foreign income taxes 6,299 385
Total Current Liabilities 101,578 107,858
Long-Term LiabilitiesLong-term debt, net of current maturities 116,966 74,043Deferred income taxes 9,918 8,902
Commitments and contingencies – –
Shareholders’ EquityCommon stock, par value
$.20 per share,authorized 60,000,000 shares,issued and outstanding17,342,374 and 17,317,178 shares 3,468 3,463
Capital in excess of par value 46,824 46,793Retained earnings 178,953 149,091Accumulated other comprehensive income (4,625) (2,971)
Total Shareholders’ Equity 224,620 196,376
$ 453,082 $ 387,179
in thousands,except shareand per shareamounts October 31, 1999 1998
see notes toconsolidatedfinancialstatements
Operations
BalanceSheet
Consolidated Balance Sheet.
Esterl ine Technologies
Cash Flows Provided (Used)by Operating ActivitiesNet earnings $ 29,862 $ 30,084 $ 25,321Gain on sale of business (7,956) – –Depreciation and amortization 20,796 18,316 17,404Deferred income taxes 497 (447) 4,764Working capital changes,
net of effect of acquisitionsAccounts receivable 4,778 (2,344) (436)Inventories (2,640) (4,920) (8,947)Prepaid expenses 98 (222) (862)Accounts payable (7,805) 167 447Accrued liabilities (5,795) (1,557) (3,525)Federal and foreign income taxes 5,643 (1,542) (2,611)
Other, net 1,684 (2,420) (1,099)
39,162 35,115 30,456
Cash Flows Provided (Used)by Investing ActivitiesCapital expenditures (15,641) (29,773) (17,390)Capital dispositions 28,995 9,421 1,820Purchases of short-term investments (25,933) – –Acquisitions, net of cash acquired (20,860) (113,304) –
(33,439) (133,656) (15,570)
Cash Flows Provided (Used)by Financing ActivitiesNet change in credit facilities (3,649) 6,579 (2,417)Repayment of long-term obligations (6,287) (5,079) (1,922)Proceeds from sale of senior notes 100,000 – –Proceeds from bridge facility – 50,000 –Repayment of bridge facility (50,000) – –
40,064 51,500 (4,339)
Effect of exchange rates 363 (107) (938)
Net increase (decrease) incash and equivalents 46,150 (47,148) 9,609
Cash and equivalents –beginning of year 8,897 56,045 46,436
Cash and equivalents – end of year $ 55,047 $ 8,897 $ 56,045
Supplemental Cash Flow InformationCash paid during the year for
Interest $ 6,805 $ 3,244 $ 3,720Income taxes 8,779 17,517 7,015
see notes toconsolidatedfinancialstatements
Consolidated Statement of Cash Flows.
in thousands for the years ended October 31, 1999 1998 1997

Esterl ine Technologies3534 /p :
see notes toconsolidatedfinancialstatements
Cash Flows
Shareholders’Equity andComprehensiveIncome
Common Stock, Par Value $.20 Per Share
Beginning of year $ 3,463 $ 3,457 $ 3,401Shares issued under stock option plans 5 6 56
End of year 3,468 3,463 3,457
Capital in Excess of Par Value
Beginning of year 46,793 46,831 46,716Shares issued under stock option plans 31 (38) 115
End of year 46,824 46,793 46,831
Retained Earnings
Beginning of year 149,091 119,007 93,686Net earnings 29,862 30,084 25,321
End of year 178,953 149,091 119,007
Accumulated Other Comprehensive Income
Beginning of year (2,971) (3,577) (1,499)Foreign currency translation adjustment (1,654) 606 (2,078)
End of year (4,625) (2,971) (3,577)
Shareholders’ Equity $ 224,620 $ 196,376 $ 165,718
Comprehensive Income
Net earnings $ 29,862 $ 30,084 $ 25,321Foreign currency translation adjustment (1,654) 606 (2,078)
Comprehensive Income $ 28,208 $ 30,690 $ 23,243
Consolidated Statement of Shareholders’ Equityand Comprehensive Income.
in thousands,except pershare amounts for the years ended October 31, 1999 1998 1997

Esterl ine Technologies
Accounting Policies
Nature of OperationsEsterline Technologies (the “Company”) designs, manufactures and markets highly engineeredproducts. The Company principally serves the aerospace and defense industry and electronicequipment manufacturers throughout the world.
Basis of PresentationThe consolidated financial statements include all subsidiaries. All significant intercompanyaccounts and transactions have been eliminated. Classifications have been changed for cer-tain amounts in the preceding periods to conform with the current year’s presentation.
Management EstimatesTo prepare financial statements in conformity with generally accepted accounting principles,management is required to make estimates and assumptions that affect the reported amountsof assets and liabilities, disclosure of contingent assets and liabilities at the date of thefinancial statements, and the reported amounts of revenues and expenses during the report-ing period.
Foreign Currency TranslationForeign currency assets and liabilities are translated into their U.S. dollar equivalents basedon year-end exchange rates. Revenue and expense accounts are generally translated at aver-age exchange rates. Aggregate exchange gains and losses arising from the translation offoreign assets and liabilities are included in shareholders’ equity. Transaction gains andlosses are included in income and have not been significant in amount.
Cash EquivalentsCash equivalents consist of highly liquid investments with maturities of three months or lessat the date of purchase. Fair value of cash equivalents approximates carrying value.
Short-Term InvestmentsShort-term investments, consisting principally of local government obligations, are classifiedas available-for-sale. These investments are carried at amortized cost which approximatesthe fair market value.
InventoriesInventories are stated at the lower of cost or market. One subsidiary values its inventoriesunder the last-in, first-out (LIFO) method while the remainder use the first-in, first-out (FIFO)method. Inventory cost includes material, labor and factory overhead.
Property, Plant and Equipment, and DepreciationProperty, plant and equipment is carried at cost and includes expenditures for major improve-ments. Depreciation is generally provided on the straight-line method based upon estimateduseful lives ranging from 3 to 30 years. Depreciation expense was $16,297,000, $15,126,000and $14,515,000 for 1999, 1998 and 1997, respectively.
Notes to Consolidated Financial Statements.
1 :
N O TE

Esterl ine Technologies3736 /p :
Asset ValuationThe carrying amount of long-lived assets, including goodwill attributable to those assets, isreviewed periodically for impairment. An asset is considered impaired when estimated futurecash flows are less than the carrying amount of the asset. In the event the carrying amount ofsuch asset is not deemed recoverable, the asset is adjusted to its estimated fair value. Fairvalue is generally determined based upon discounted future cash flow.
Goodwill and IntangiblesIntangible assets and the excess purchase price paid over net assets of businesses acquiredare amortized on a straight-line basis over the period of expected benefit which ranges from 5to 40 years. Accumulated amortization as of October 31, 1999 and 1998, was $33,355,000and $28,876,000, respectively.
EnvironmentalEnvironmental exposures are provided for at the time they are known to exist or are consid-ered reasonably probable and estimable. No provision has been recorded for environmentalremediation costs which could result from changes in laws or other circumstances currentlynot contemplated by the Company. Costs provided for future expenditures on environmentalremediation are not discounted to present value.
Stock SplitIn April 1998, the Company effected a two-for-one stock split on all outstanding shares ofcommon stock. All share and per share data have been restated.
Revenue RecognitionSales are generally recorded at the time of shipment of products or performance of servicesand are presented net of sales returns and allowances.
Research, Development and Related Engineering CostsResearch, development and related engineering costs are generally expensed as incurred.
Earnings Per ShareBasic earnings per share are computed on the basis of the weighted average number of com-mon shares outstanding during the year. Diluted earnings per share also include the dilutiveeffect of stock options. The weighted average number of shares outstanding used to computebasic earnings per share was 17,337,000, 17,290,000 and 17,124,000 for the years endedOctober 31, 1999, 1998 and 1997, respectively. The weighted average number of sharesoutstanding used to compute diluted earnings per share was 17,658,000, 17,718,000 and17,608,000 for the years ended October 31, 1999, 1998 and 1997, respectively.
Recent Accounting PronouncementsIn June 1998, the Financial Accounting Standards Board (“FASB”) issued Statement ofFinancial Accounting Standards (“SFAS”) No. 133, “Accounting for Derivative Instruments andHedging Activities,” and established standards for derivative instruments, including certainderivative instruments embedded in other contracts and hedging activities. The FASB delayedimplementation of this standard, therefore, it will now be effective for the Company beginningin fiscal 2001. The Company is studying this pronouncement to determine its effect, includingadditional disclosure requirements that may be necessary.
Note 1

Esterl ine Technologies
Inventories
Inventories at October 31 consisted of the following:
in thousands 1999 1998
Raw materials and purchased parts $ 30,014 $ 27,239Work in process 27,803 33,284Finished goods 13,613 11,312
$ 71,430 $ 71,835
Inventories stated under the last-in, first-out method totaled $6,267,000 and $8,845,000 atOctober 31 , 1999 and 1998 , respectively. Had the first-in, f irst-out method beenused, these inventories would have been $524,000 and $5,621,000 higher than reported atOctober 31, 1999 and 1998, respectively. Federal Products Co., one of the operating unitsusing the last-in, first-out method, was sold in October 1999.
2 :
N O TE

Esterl ine Technologies3938 /p :
3 :
N O TE
Accrued Liabilities
Accrued liabilities at October 31 consisted of the following:
in thousands 1999 1998
Payroll and other compensation $ 21,135 $ 24,762Self-insurance 5,642 5,137Interest 3,446 1,240Warranties 7,440 7,212State and other tax accruals 9,396 8,077Other 18,915 21,847
$ 65,974 $ 68,275
Note 2
Note 3

Esterl ine Technologies
4 :
N O TE
Retirement Benefits
The Company accounts for pension benefits in accordance with SFAS No. 132, “Employers’Disclosures About Pensions and Other Postretirement Benefits.” Pension benefits are providedfor substantially all U.S. employees under a non-contributory pension plan, and are based onyears of service and five-year average compensation. The Company makes actuarially com-puted contributions as necessary to adequately fund benefits. The actuarial computationsassumed discount rates for benefit obligations on plan assets of 7.25%, 6.5% and 7.5%for 1999, 1998 and 1997, respectively, and annual compensation increases of 5%. Theexpected long-term rate of return on plan assets was assumed at 8.5% for 1999, 1998 and1997. Plan assets primarily consist of publicly traded common stocks, bonds and governmentsecurities. The Company also has an unfunded supplemental retirement plan for key executivesproviding for periodic payments upon retirement.
Total pension expense (benefit) for all benefit plans, including defined benefit plans, was$902,000, ($971,000) and $1,758,000 for the years ended October 31, 1999, 1998 and1997, respectively. Net periodic pension expense (benefit) for the Company’s defined benefitplans for the years ended October 31 consisted of the following:
in thousands 1999 1998 1997
Components of Net Periodic Benefit CostService cost $ 3,351 $ 2,639 $ 3,150Interest cost 5,726 5,645 5,598Expected return on plan assets (9,122) (8,895) (7,612)Amortization of transition asset (400) (405) (404)Amortization of prior service cost 105 105 34Amortization of actuarial (gain) loss 4 (1,157) –
Net periodic (benefit) cost $ (336) $ (2,068) $ 766

Esterl ine Technologies4140 /p :Note 4
The funded status of the defined benefit pension plan at October 31 was as follows:
in thousands 1999 1998
Benefit ObligationBeginning balance $ 92,509 $ 81,480Service cost 3,351 2,639Interest cost 5,726 5,645Amendments – 705Actuarial (gain) loss (8,717) 11,131Acquisition (divestiture) – (5,323)Benefits paid (8,708) (3,768)
Ending balance $ 84,161 $ 92,509
Plan Assets – Fair ValueBeginning balance $ 109,663 $ 113,001Actual return on plan assets 16,299 5,740Acquisition (divestiture) – (5,323)Company contributions 3,758 13Benefits paid (8,708) (3,768)
Ending balance $ 121,012 $ 109,663
Reconciliation of Funded Status to Net Amount RecognizedFunded status – plan assets in excess
of (less than) benefit obligation $ 36,851 $ 17,084Unrecognized net actuarial gain (23,830) (7,861)Unrecognized prior service costs 874 979Unrecognized net transition obligations (assets) (162) (562)
Net amount recognized $ 13,733 $ 9,640
Amount Recognized in the Consolidated Balance SheetPrepaid benefit cost $ 14,279 $ 13,427Accrued benefit liability (546) (3,787)
Net amount recognized $ 13,733 $ 9,640

Esterl ine Technologies
5 :
N O TE
Income Taxes
Income tax expense (benefit) for the years ended October 31 consisted of the following:
in thousands 1999 1998 1997
CurrentU.S. Federal $ 13,530 $ 14,799 $ 5,776State 160 1,295 1,200Foreign 2,053 1,216 1,020
15,743 17,310 7,996
DeferredU.S. Federal 684 (429) 3,138State 20 (18) 196Foreign (207) – 1,430
497 (447) 4,764
$ 16,240 $ 16,863 $ 12,760
U.S. and foreign components of income before income taxes for the years ended October 31 were:
in thousands 1999 1998 1997
U.S. $ 42,518 $ 45,608 $ 34,121Foreign 3,584 1,339 3,960
$ 46,102 $ 46,947 $ 38,081

Esterl ine Technologies4342 /p :Note 5
Primary components of the Company’s deferred tax assets (liabilities) for the years endedOctober 31 resulted from temporary tax differences associated with the following:
in thousands 1999 1998
Reserves and liabilities $ 17,339 $ 17,108Employee benefits 4,425 4,306
Total deferred tax assets 21,764 21,414
Depreciation and amortization (9,720) (10,869)Retirement benefits (5,013) (3,496)Other (737) (258)
Total deferred tax liabilities (15,470) (14,623)
$ 6,294 $ 6,791
A valuation allowance was not required due to the nature of and circumstances associatedwith the temporary tax differences.
A reconciliation of the United States federal statutory income tax rate to the effective incometax rate for the years ended October 31 was as follows:
1999 1998 1997
U.S. statutory income tax 35.0% 35.0% 35.0%State income taxes 0.2 1.8 2.0Foreign taxes 1.2 1.3 0.5Foreign sales corporation (1.1) (1.5) (1.8)Tax exempt interest (0.8) (0.3) (0.7)Non-deductible goodwill 1.7 0.9 –Other, net (1.0) (1.3) (1.5)
Effective income tax rate 35.2% 35.9% 33.5%
No provision for federal income taxes has been made on accumulated earnings of foreignsubsidiaries, since such earnings have either been permanently reinvested or would be sub-stantially offset by foreign tax credits.

Esterl ine Technologies
Debt
Long-term debt at October 31 consisted of the following:
in thousands 1999 1998
Bank of America bridge facility $ – $ 50,0006.77% Senior Notes, due 2008 40,000 –6.40% Senior Notes, due 2005 30,000 –6.00% Senior Notes, due 2003 30,000 –8.75% Senior Notes, due 2002 17,143 22,857Other 7,072 7,544
124,215 80,401
Less current maturities 7,249 6,358
$ 116,966 $ 74,043
The Company completed a $100 million private placement of senior notes (“1999 SeniorNotes”) in November 1998. The 1999 Senior Notes are payable in 2003, 2005 and 2008with interest payments due semi-annually in November and May of each year. Proceeds fromthe placement were used to retire a bridge facility used for the Kirkhill acquisition. TheSenior Notes due in 2002 are payable in equal annual installments and interest is payablesemi-annually in January and July. All Senior Notes are unsecured.
Maturities of long-term debt are as follows:
in thousands
2000 $ 7,2492001 6,9092002 6,6182003 30,6552004 5012005 and thereafter 72,283
$ 124,215
Short-term credit facilities at October 31 consisted of the following:
in thousands 1999 1998
Outstanding Interest Outstanding InterestBorrowings Rate Borrowings Rate
U.S. dollar $ – – $ – –Foreign 5,138 5.60% 9,533 4.22%
$ 5,138 $ 9,533
N O TE
6 :
Esterl ine Technologies4544 /p :
Note 6
Note 6-7
N O TE
The Company’s primary U.S. dollar credit facility totals $35,000,000 through a group of banks.The credit agreement is unsecured and interest is based on standard inter-bank offering rates.An additional $9,000,000 of unsecured foreign currency credit facilities have been extendedby foreign banks for a total of $44,000,000 available companywide. The underlying agree-ments contain various covenant restrictions which include maintenance of net worth, pay-ment of dividends, interest coverage and limitations on additional borrowings. The Companyis in compliance with these covenants. Available credit under the above credit facilities was$36,741,000 at October 31, 1999, when reduced by outstanding borrowings of $5,138,000and letters of credit of $2,121,000.
The fair market value of the Company’s long-term debt and short-term borrowings wasestimated at $121,000,000 and $91,000,000 at October 31, 1999 and 1998, respectively.These estimates were derived using discounted cash flow with interest rates currently avail-able to the Company for issuance of debt with similar terms and remaining maturities.
Commitments and Contingencies
Net rental expense for operating leases totaled $4,647,000, $4,628,000 and $3,754,000 in1999, 1998 and 1997, respectively.
The Company’s rental commitments for noncancelable operating leases with a duration inexcess of one year are as follows:
in thousands
2000 $ 4,4772001 4,2522002 4,1352003 4,0812004 3,2542005 and thereafter 7,692
$ 27,891
The Company is a party to various lawsuits and claims, both as plaintiff and defendant, andhas contingent liabilities arising from the conduct of business, none of which, in the opinionof management, is expected to have a material effect on the Company’s financial position orresults of operations. The Company believes that it has made adequate provisions for contingentliabilities.
7 :

Esterl ine Technologies
Stock Option Plans
The Company provides a nonqualified stock option plan for officers and key employees. AtOctober 31, 1999, the Company had 1,760,250 shares reserved for issuance to officers andkey employees, of which 405,000 shares were available to be granted in the future. TheBoard of Directors authorized the Compensation and Stock Option Committee to administeroption grants and their terms. Awards under the plan may be granted to eligible employees ofthe Company over a 10-year period ending March 4, 2007. Options granted become exercisableover a period of four years following the date of grant and expire on the tenth anniversary ofthe grant. Option exercise prices are equal to the fair market value of the Company’s commonstock on the date of grant.
The following table summarizes the changes in outstanding options granted under theCompany’s stock option plans:
1999 1998 1997
Weighted Weighted WeightedAverage Average Average
Shares Price Shares Price Shares Price
Outstanding,beginning of year 1,313,250 $ 10.125 1,190,000 $ 8.472 1,516,250 $ 6.089
Granted 202,000 18.973 187,000 18.644 271,000 14.304Exercised (47,500) 5.016 (63,750) 4.261 (589,750) 5.086Cancelled (112,500) 17.070 – – (7,500) 3.750
Outstanding,end of year 1,355,250 $ 11.046 1,313,250 $ 10.125 1,190,000 $ 8.472
Exercisable,end of year 925,500 $ 8.413 741,500 $ 6.893 574,750 $ 5.511
The Company accounts for its stock-based compensation plans in accordance with AccountingPrinciples Board Opinion No. 25. Additional disclosures as required under SFAS No. 123,“Accounting for Stock-Based Compensation,” are included below. The Black-Scholes option-pricing model was used to calculate the estimated compensation expense that would have beenrecognized under these guidelines.
If only options granted after 1995 were included, as prescribed by SFAS No. 123, proforma net income would have been $28,920,000, $28,971,000 and $24,517,000 for 1999,1998 and 1997, respectively. Basic earnings per share for 1999, 1998 and 1997 would havebeen $1.67, $1.68 and $1.43, respectively. Diluted earnings per share for 1999, 1998 and
N O TE
8 :

Esterl ine Technologies4746 /p :Note 8
1997 would have been $1.64, $1.64 and $1.40, respectively.The pro forma disclosures presented below include the fair value compensation expense
for all options that would have been amortized during 1999, 1998 and 1997:
in thousands, except per share amounts
years ended October 31, 1999 1998 1997
Net earnings as reported $ 29,862 $ 30,084 $ 25,321Pro forma net earnings 28,915 28,928 24,400
Basic earnings per share as reported $ 1.72 $ 1.74 $ 1.48Pro forma basic earnings per share $ 1.67 $ 1.67 $ 1.43
Diluted earnings per share as reported $ 1.69 $ 1.70 $ 1.44Pro forma diluted earnings per share $ 1.63 $ 1.63 $ 1.39
The weighted average Black-Scholes value of options granted during 1999, 1998 and 1997was $12.109, $10.870 and $7.320, respectively. The assumptions used in the Black-Scholesoption-pricing model for 1999, 1998, and 1997 were as follows:
1999 1998 1997
Volatility 60.5% 55.3% 41.6%Risk-free interest rate 5.99 – 6.23% 4.1 – 4.57% 5.73 – 5.92%Expected life (years) 5 – 8 5 – 8 5 – 8Dividends – – –
The following table summarizes information for stock options outstanding at October 31, 1999:
Options Outstanding Options Exercisable
WeightedAverage Weighted Weighted
Range of Remaining Average AverageExercise Prices Shares Life (years) Price Shares Price
$ 3.6875 – 4.9375 280,500 3.94 $ 4.0753 280,500 $ 4.07535.6250 – 8.8750 273,000 4.15 6.3182 273,000 6.3182
10.5000 – 13.2500 388,250 6.94 11.9129 263,500 11.711213.4375 – 19.6250 302,500 8.12 17.1971 95,500 16.477319.8750 – 20.6875 111,000 8.84 20.4972 13,000 19.8750

Esterl ine Technologies
Capital Stock
The authorized capital stock of the Company consists of 500,000 shares of preferred stock,including 25,000 shares ($100 par value) and 475,000 shares ($1.00 par value) issuable inseries, and 60,000,000 shares of common stock ($.20 par value). At October 31, 1999,there were no shares of preferred stock outstanding.
The Company has a Shareholder Rights Plan providing for the distribution of one PreferredStock Purchase Right (“Right”) for each share of common stock held. Each Right entitles theholder to purchase one one-hundredth of a share of Series A Serial Preferred Stock at anexercise price of $56. The Rights expire December 23, 2002.
The Rights will be exercisable and transferable apart from the common stock only if aperson or group acquires beneficial ownership of 10% or more of the Company’s commonstock or commences a tender offer or exchange offer which would result in a person or groupbeneficially owning 10% or more of the Company’s common stock. The Rights will beredeemable by the Company for $ .01 each at any time prior to the tenth day after anannouncement that a person or group beneficially owns 10% or more of the common stock.Upon the occurrence of certain events, the holder of a Right can purchase, for the thencurrent exercise price of the Right, shares of common stock of the Company (or under certaincircumstances, as determined by the Board of Directors, cash, other securities or property)having a value of twice the Right’s exercise price. Upon the occurrence of certain otherevents, the holder of each Right would be entitled to purchase, at the exercise price of theRight, shares of common stock of a corporation or other entity acquiring the Company orengaging in certain transactions involving the Company, that has a market value of twicethe Right’s exercise price.
N O TE
9 :

Esterl ine Technologies4948 /p :
10 :Acquisitions and Divestitures
Effective August 1, 1999, the Company acquired all of the outstanding shares of MuirheadVactric Components Limited and Norcroft Dynamics Limited. The total purchase price,including closing and other direct costs of the acquisition, was approximately $22,000,000in cash. The acquisition resulted in an excess of cost over identifiable tangible assets ofapproximately $12,400,000. The purchase method of accounting was used, with the resultsof operations included since the effective date of the acquisition.
Effective October 28, 1999, the Company sold all of the outstanding shares of FederalProducts Co., a wholly owned subsidiary. The gain on the sale of the subsidiary was $7,956,000and the results of its operations were included in the accompanying consolidated financialstatements through the date of divestiture.
On December 21, 1999, the Company purchased Advanced Input Devices (“A.I.D.”). A.I.D.is a strategic purchase for the Company’s growth platform around high-end illuminated dis-plays and custom panels and will be included in Aerospace. The transaction was accountedfor under the purchase method and funded with available cash.
Business Segment Information
During 1999, the Company adopted SFAS No. 131 “Disclosures about Segments of an Enterpriseand Related Information.” This statement changed the segment requirements from disclosuresbased on product lines to a focus on how the Company is organized and managed. TheCompany is organized based on three primary segments: aerospace, advanced materials andautomation.
The Aerospace Segment includes operations that produce high precision components, pri-marily for aerospace and defense applications. Sales are worldwide and include both militaryand commercial customers. The Advanced Materials Segment includes operations thatformulate specialized materials such as high-temperature elastomers, molded-fiber compoundsand certain finishings and coatings. Sales are primarily to domestic military, defense andaerospace customers. The Automation Segment includes operations that manufacture productsthat enhance the fabrication efficiency and quality control of manufactured goods. Sales areworldwide and customers include printed circuit board, original equipment, transportationand general manufacturers.
Geographic sales information is based on product origin. The Company evaluates thesesegments based on segment profits prior to net interest, other income/expense, corporate
N O TE
11 :
Note 9
Note 10-11

Esterl ine Technologies
expenses and income taxes.Details of the Company’s operations by business segment for the years ended October 31were as follows:
in thousands 1999 1998 1997
SalesAerospace $ 183,783 $ 171,028 $ 129,354Advanced Materials 127,920 91,498 62,760Automation 149,266 191,376 198,844
$ 460,969 $ 453,902 $ 390,958
Earnings Before Income TaxesAerospace $ 24,822 $ 24,766 $ 15,970Advanced Materials 29,186 24,683 15,864Automation 2,924 10,694 15,778
Segment Earnings 56,932 60,143 47,612
Corporate expense (12,634) (10,987) (8,325)Gain on sale of business 7,956 – –Interest income 2,859 1,594 2,397Interest expense (9,011) (3,803) (3,603)
$ 46,102 $ 46,947 $ 38,081
Identifiable AssetsAerospace $ 144,836 $ 123,346 $ 82,984Advanced Materials 135,907 142,902 34,337Automation 62,868 87,227 89,726Corporate1 109,471 33,704 82,800
$ 453,082 $ 387,179 $ 289,847
Capital ExpendituresAerospace $ 6,029 $ 9,103 $ 10,297Advanced Materials 3,866 11,997 4,014Automation 5,518 7,748 6,836Corporate 228 925 461
$ 15,641 $ 29,773 $ 21,608
Depreciation and AmortizationAerospace $ 6,961 $ 6,065 $ 5,231Advanced Materials 6,814 4,579 4,493Automation 6,270 7,084 7,271Corporate 751 588 409
$ 20,796 $ 18,316 $ 17,404
1 Primarily cash, prepaid pension expense (see Note 4) and net deferred tax assets (see Note 5).
N O TE
11 :continued

Esterl ine Technologies5150 /p :
The Company’s operations by geographic area for the years ended October 31 were as follows:
in thousands 1999 1998 1997
SalesDomesticUnaffiliated customers – U.S. $ 323,702 $ 333,678 $ 261,391Unaffiliated customers – export 57,776 58,926 67,194Intercompany 8,670 11,042 10,202
390,148 403,646 338,787
FranceUnaffiliated customers 58,871 47,056 40,467Intercompany 10,694 9,552 9,576
69,565 56,608 50,043
All Other ForeignUnaffiliated customers 20,620 14,242 21,906Intercompany 843 1,761 1,815
21,463 16,003 23,721
Eliminations (20,207) (22,355) (21,593)
$ 460,969 $ 453,902 $ 390,958
Segment Earnings1
Domestic $ 52,585 $ 58,579 $ 43,439France 5,233 2,485 3,587All other foreign (625) (1,025) (122)Eliminations (261) 104 708
$ 56,932 $ 60,143 $ 47,612
Identifiable Assets2
Domestic $ 269,860 $ 302,977 $ 165,216France 35,758 39,343 28,986All other foreign 37,993 11,155 12,845
$ 343,611 $ 353,475 $ 207,047
1 Before corporate expense, shown on page 50.
2 Excludes corporate, shown on page 50.
Note 11

Esterl ine Technologies
The Company’s principal foreign operations consist of manufacturing facilities located inFrance, the United Kingdom and Spain, and include sales and service operations located inGermany, Italy, Japan, Hong Kong and France. Intercompany sales are at prices comparablewith sales to unaffiliated customers. Sales to any single customer or government entity didnot exceed 10% of consolidated sales.
Product lines contributing more than 10% of total sales in any of the years ended October 31were as follows:
1999 1998 1997
Elastomeric products 14% 5% 2%Printed circuit board drilling equipment 12% 16% 22%Aerospace switches and indicators 10% 13% 12%Gauge products 9% 10% 11%
Quarterly Financial Data (Unaudited)
The following is a summary of unaudited quarterly financial information:
in thousands,except per share amounts Fourth Third Second First
Year endedOctober 31, 1999
Sales $ 123,402 $ 112,748 $ 116,121 $ 108,698Gross margin 46,053 43,425 44,957 40,124Net earnings 11,711 5,952 7,142 5,057Net earnings
per share – basic $ 0.68 $ 0.34 $ 0.41 $ 0.29Net earnings
per share – diluted $ 0.66 $ 0.34 $ 0.40 $ 0.29
Year endedOctober 31, 1998
Sales $ 132,730 $ 110,891 $ 114,551 $ 95,730Gross margin 49,456 42,051 44,149 36,707Net earnings 9,417 7,919 7,912 4,836Net earnings
per share – basic $ .54 $ .46 $ .46 $ .28Net earnings
per share – diluted $ .53 $ .45 $ .45 $ .27
N O TE
12 :
11 :continued
Esterl ine Technologies5352 /p :
Note 11-12
Auditors’Report
To the Shareholders and the Board of DirectorsEsterline Technologies CorporationBellevue, Washington
We have audited the accompanying consolidated balance sheets of Esterline TechnologiesCorporation and its subsidiaries (the “Company”) as of October 31, 1999 and 1998, and therelated consolidated statements of operations, shareholders’ equity and comprehensive income,and cash flows for each of the three years in the period ended October 31, 1999. Thesefinancial statements are the responsibility of the Company’s management. Our responsibilityis to express an opinion on these financial statements based on our audits.
We conducted our audits in accordance with generally accepted auditing standards. Thosestandards require that we plan and perform the audit to obtain reasonable assurance aboutwhether the financial statements are free of material misstatement. An audit includes examining,on a test basis, evidence supporting the amounts and disclosures in the financial statements.An audit also includes assessing the accounting principles used and significant estimatesmade by management, as well as evaluating the overall financial statement presentation. Webelieve that our audits provide a reasonable basis for our opinion.
In our opinion, such consolidated financial statements present fairly, in all material respects,the financial position of Esterline Technologies Corporation and its subsidiaries as of October 31,1999 and 1998, and the results of their operations and their cash flows for each of the threeyears in the period ended October 31, 1999 in conformity with generally accepted accountingprinciples.
Deloitte & Touche LLPSeattle, WashingtonDecember 9, 1999
Report of Independent Auditors.

Esterl ine Technologies
Directors Wendell P. HurlbutChairmanEsterline Technologies
Richard R. AlbrechtExecutive Vice President (Retired)Commercial Airplane GroupThe Boeing Company
Gilbert W. AndersonPresident andChief Executive Officer (Retired)Physio-Control Corporation;Private Investments
Ross J. CentanniChairman, President andChief Executive OfficerGardner Denver, Inc.
John F. ClearmanChief Financial OfficerMilliman & Robertson
Robert S. ClineChairman andChief Executive OfficerAirborne Freight Corporation
Robert W. CreminPresident andChief Executive OfficerEsterline Technologies
E. John FinnChairman (Retired)Dorr-Oliver Incorporated
Robert F. GoldhammerChairmanImClone Systems,Incorporated;PresidentConcord InternationalInvestments Group L.L.P.
Jerry D. LeitmanPresident andChief Executive OfficerFuel Cell Energy, Inc.
Paul G. SchloemerPresident andChief Executive Officer (Retired)Parker Hannifin Corporation
Malcolm T. StamperVice Chairman (Retired)The Boeing Company;Chairman, Chief ExecutiveOfficer and PublisherStorytellers Ink
Robert W. CreminPresident andChief Executive Officer
James J. Cich, Jr.Group Vice President
Robert D. GeorgeVice President andChief Financial Officer
Marcia J.M. GreenbergVice PresidentHuman Resources
Larry A. KringGroup Vice President
Stephen R. LarsonVice PresidentStrategy and Technology
Officers
Esterline Technologies Information.

Esterl ine Technologies5554 /p :
EsterlineTechnologiesInformation
Corporate Headquarters10800 NE 8th StreetBellevue, WA 98004(425) 453-9400www.esterline.com
Stock Exchange ListingNew York Stock ExchangeSymbol-ESL
Transfer Agent and RegistrarChaseMellonShareholder Services L.L.C.
www.chasemellon.com
Shareholder Relations(800) 522-6645
Outside of the U.S.(800) 329-8660
TDD Hearing Impaired(800) 231-5469
TDD Hearing ImpairedOutside of the U.S.(800) 329-8534
Shareholder CorrespondenceP.O. Box 3315South Hackensack, NJ 07606
Overnight Delivery85 Challenger RoadRidgefield Park, NJ 07660
Annual Meeting of ShareholdersThe 2000 annual mee t ing ofshareholders will be held at theFour Seasons Olympic Hotel, 411University, Seattle, Washington, onThursday, March 2, 2000. Themeeting will start at 10:00 a.m.
10-K reportA copy of Esterline’s annual reporton Form 10 -K f i led wi th theSecurities and Exchange Commis-sion will be provided without chargeupon written request to the corporateheadquarters, attention: Director,Corporate Communications or throughour website.
Stock Held in Street NameEsterline maintains a direct mailinglist to help ensure that shareholderswhose stock is held in street name(broker or similar accounts) receiveinformation on a timely basis. If youwould like your name added to thislist, please send your request to thecorporate headquarters, attention:Director, Corporate Communications.
InvestorInformation
Esterl ine Technologies
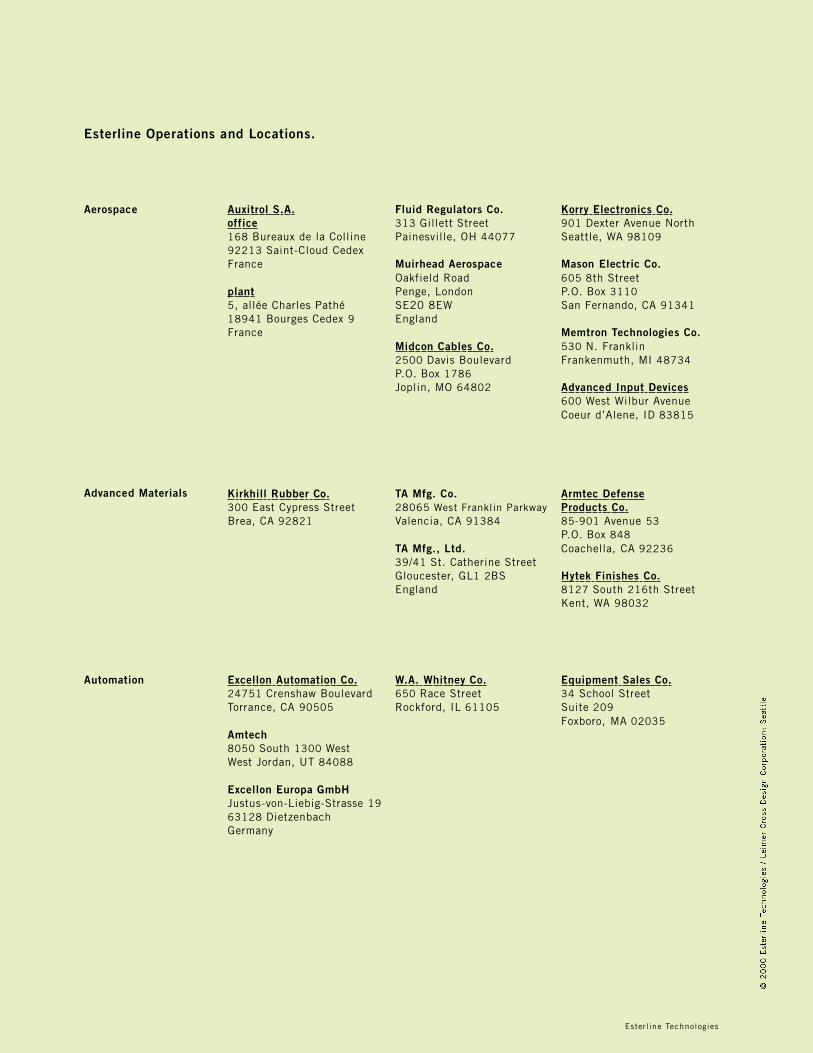
Esterline Operations and Locations.
Auxitrol S.A.office168 Bureaux de la Colline92213 Saint-Cloud CedexFrance
plant5, allée Charles Pathé18941 Bourges Cedex 9France
Fluid Regulators Co.313 Gillett StreetPainesville, OH 44077
Muirhead AerospaceOakfield RoadPenge, LondonSE20 8EWEngland
Midcon Cables Co.2500 Davis BoulevardP.O. Box 1786Joplin, MO 64802
Aerospace Korry Electronics Co.901 Dexter Avenue NorthSeattle, WA 98109
Mason Electric Co.605 8th StreetP.O. Box 3110San Fernando, CA 91341
Memtron Technologies Co.530 N. FranklinFrankenmuth, MI 48734
Advanced Input Devices600 West Wilbur AvenueCoeur d’Alene, ID 83815
Kirkhill Rubber Co.300 East Cypress StreetBrea, CA 92821
TA Mfg. Co.28065 West Franklin ParkwayValencia, CA 91384
TA Mfg., Ltd.39/41 St. Catherine StreetGloucester, GL1 2BSEngland
Advanced Materials Armtec DefenseProducts Co.85-901 Avenue 53P.O. Box 848Coachella, CA 92236
Hytek Finishes Co.8127 South 216th StreetKent, WA 98032
Excellon Automation Co.24751 Crenshaw BoulevardTorrance, CA 90505
Amtech8050 South 1300 WestWest Jordan, UT 84088
Excellon Europa GmbHJustus-von-Liebig-Strasse 1963128 DietzenbachGermany
W.A. Whitney Co.650 Race StreetRockford, IL 61105
Automation Equipment Sales Co.34 School StreetSuite 209Foxboro, MA 02035


