35
This presentation contains no controlled technical data or technology. Esterline Explained Fourth Quarter, Fiscal 2016

This presentation contains no controlled technical data or technology.
Esterline Explained Fourth Quarter, Fiscal 2016

This presentation may contain "forward-looking statements" within the meaning of the Private Securities Litigation Reform Act of 1995. These statements relate to future events or our future financial performance. In some cases, you can identify forward-looking statements by terminology such as “anticipate,” “believe,” “continue,” “could,” “estimate,” “expect,” “intend,” “may,” “might,” “plan,” “potential,” “predict,” “should” or “will,” or the negative of such terms, or other comparable terminology. These forward-looking statements are only predictions based on the current intent and expectations of the management of Esterline, are not guarantees of future performance or actions, and involve risks and uncertainties that are difficult to predict and may cause Esterline’s or its industry’s actual results, performance or achievements to be materially different from any future results, performance or achievements expressed or implied by the forward-looking statements. Esterline's actual results and the timing and outcome of events may differ materially from those expressed in or implied by the forward-looking statements due to risks detailed in Esterline's public filings with the Securities and Exchange Commission including its most recent Annual Report on Form 10-K. This presentation also contains references to non-GAAP financial information subject to Regulation G. The reconciliations of each non-GAAP financial measure to its comparable GAAP measure as well as further information on management’s use of non-GAAP financial measures are included in Esterline’s press release dated November 10, 2016, included as Exhibit 99.1 to Form 8-K filed with the SEC on the same date, as well as in this presentation.
1 Esterline Explained, November 2016

Well positioned to create shareholder value
Overview Esterline is… Key Investment Highlights
…a specialized global manufacturer of custom-engineered solutions for aerospace & defense.
• ~13,000 employees
• Annual Sales ~$2 billion
• Enterprise Value*: $2.9 billion
• Three distinct business segments
• Highly diversified, balanced global business
• Technology leader in core markets
• Commitment to the Esterline Operating System
• Strong cash flow generation
Esterline Explained, November 2016 2 * Data from Yahoo Finance as of November 10, 2016

3
A BALANCED AND DIVERSIFIED GLOBAL COMPANY
Esterline Explained, November 2016
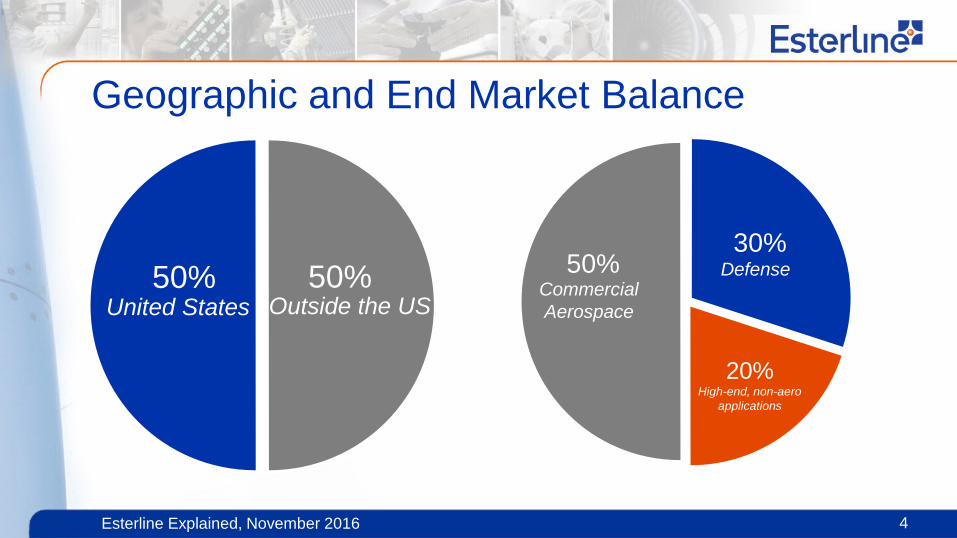
United States 50% 50%
Outside the US Defense
20%
30% 50%
Commercial Aerospace
High-end, non-aero applications
Geographic and End Market Balance
4 Esterline Explained, November 2016

Esterline Explained, November 2016 5
Global Coverage
• Strong global footprint for sales and manufacturing • Nearly 20% of operations in low-cost countries • Focused on competitive cost structure • Ability to leverage technologies across the world

Product Characteristics Across Markets
6
Aerospace Defense High-End Non-Aero
Esterline Explained, November 2016
High regulatory barriers to entry Highly reliable products for harsh environments Critical human-machine interface capabilities Precision machine-machine system interfaces Mission-critical subsystems and components

3 Business Segments – 8 Primary Capabilities
7
Avionics & Controls Sensors & Systems Advanced Materials
Esterline Explained, November 2016

Advanced Materials Segment
8
Highly engineered harsh-environment components
Esterline Explained, November 2016

Avionics & Controls Segment
9
Tier 1 components and systems provider
Esterline Explained, November 2016

Sensors & Systems Segment
10
World leader in relays, GFI, Tier 1 sensor packages, and connectors
Esterline Explained, November 2016

Dozens of Major Customers
11 Esterline Explained, November 2016

13
COMMITMENT TO CONTINUOUS IMPROVEMENT AND CULTURE
Esterline Explained, November 2016

Mission-Critical Culture
14 Esterline Explained, November 2016

Profitable & Balanced
Sales Growth
Enterprise Excellence
Leverage the Enterprise
Employee Engagement
Regulatory & Customer
Compliance
Strategic Focus Areas
15 Esterline Explained, November 2016

16
• Organic – Product experts focused on customer needs – Executive ownership of key customer
relationships across platforms • M&A
– Bolt-on approach with synergy focus – Completing integration of advanced displays
business (2015 acquisition)
Esterline Explained, November 2016
Balanced and Profitable Sales Growth

Company-Wide Efficiency Initiatives Update
Esterline Explained, November 2016 17
Ops Excellence Strategic Sourcing Global Footprint
INITIATIVE GOALS Achieve significant savings in
material and services Implement standards and tools
for sustainability
• Final two announced restructuring projects finished
• India Design Center now has more than 60 engineers
• LCC presence increasing and absorbing demand
• 2016 savings targets achieved • Wave 3 implementation plan for
savings developed • Vendors attending lean wkshps. • Tracking tools in place
(dashboard, scorecards, etc.)
INITIATIVE GOALS Enterprise-wide Lean transformation
New operating system deployed Leadership-driven, fully aligned
operational improvements
INITIATIVE GOALS Leverage global presence for growth Develop competitive cost structure
Infrastructure supporting the Esterline Operating System
• 2017 Policy Deployment flow-down completed
• Continuous Improvement (CI) driving better business margins
• Over 1000 employees through CI Academy by end of 2016
• Lean Transformation continues

18
COMPELLING FINANCIAL PERFORMANCE
Esterline Explained, November 2016

$1,603
$1,853 $1,867 $2,029 $2,002 $1,993
2011 2012 2013 2014 2015 2016
Sales from Cont. Ops. ($ in millions) Recent Revenue Growth
19
*
Esterline Explained, November 2016 * 11-month fiscal year recast to 12 months ended Oct. 2, 2015

2016 Year-over-Year (YOY) Summary*
20
Dollars in millions, except EPS Q4 2016 Q4 2015 Change FY 2016 FY 2015 Change
Sales $ 544 $ 545 ($1) $ 1,993 $ 2,003 ($10)
Gross margin $ 194 $ 186 $8 $ 661 $ 679 ($18)
As a % of sales 35.6% 34.1% 1.5% 33.2% 33.9% (0.7%)
Earnings from continuing operations $ 52 $ 40 $12 $ 117 $ 128 ($11)
Earnings per diluted share from continuing ops $ 1.75 $ 1.34 $0.41 $ 3.93 $ 4.10 ($0.17)
* Comparison is to the recast three-month and twelve-month periods ended October 2, 2015.
Esterline Explained, November 2016

2016 Earnings Adjustment
21
Dollars in millions, except EPS EPS adjustments are net of tax
Q4 Earnings from Continuing Ops EPS FY Earnings from
Continuing Ops EPS
GAAP $ 52 $ 1.75 $ 117 $3.93
• Accelerated integration costs 3 0.11 7 0.24
• Compliance costs 2 0.06 9 0.30
• DAT integration costs 1 0.04 10 0.34
• Long-term contract adjustments - - 2 0.05
Adjusted* $ 58 $ 1.96 $ 145 $4.86
* See Page 1 regarding non-GAAP financial measures
Esterline Explained, November 2016

2016 Sales Change (YOY)* Items Q4 Sales FY Sales
2015* $ 545 $ 2,003
• Foreign currency translation (7) (31)
• FX forward contract gain 3 6
• DAT incremental (acquired sales) - 52
• Defense Technologies energetic incident (13) (18)
• Sales volume 16 (19)
2016 $ 544 $ 1,993
Dollars in millions
22 * Comparison is to the recast three-month and twelve-month periods ended October 2, 2015.
Esterline Explained, November 2016

2016 Segment Sales Change (YOY)* Q4 Total Change
Q4 Organic¹
Q4 FX
Q4 Other2
FY Total Change
FY Organic¹
FY FX
FY Other2
Avionics & Controls
9% 9% <1% - 4% (1%)
<(1%) 6%
Sensors & Systems
(2%) (2%) <1% - (3%) (2%) (1%) -
Advanced Materials
(15%) <(1%) (4%) (10%) (6%) <1% (2%) (4%)
Total <(1%) 3% <(1%) (2%) <(1%) <(1%) (1%) 2%
1 Organic sales growth represents the total reported increase within the company’s continuing operations less the impact of all foreign currency translation and hedging activities. 2 Other represents acquired sales (Avionics & Controls) and energetic incident (Advanced Materials).
23 * Comparison is to the recast three-month and twelve-month periods ended October 2, 2015.
Esterline Explained, November 2016

2016 Gross Margin Change (YOY)* Items Q4 Gross Margin FY Gross Margin
2015* $ 186 $ 679
• FX Impact - (3)
• DAT purchase accounting and integration expenses 2 3
• DAT incremental (acquired sales) - 21
• Sales volume / mix 13 (11)
• Defense Technologies energetic incident (5) (7)
• Higher mfg. costs / Inventory reserves / EAC / Other adjustments (2) (21)
2016 $ 194 $ 661
Dollars in millions
24 * Comparison is to the recast three-month and twelve-month periods ended October 2, 2015.
Esterline Explained, November 2016

FY 2016 Free Cash Flow Reconciliation*
25
* Comparison is to the recast twelve-month period ended October 2, 2015. ** See Page 1 regarding non-GAAP financial measures.
FY 2016 FY 2015*
Net Earnings $ 103 $ 88
• Depreciation and amortization (Depreciation of $49M and $51M) 100 103
• Change in working capital (A/R, Inventory, A/P) (43) (2)
• Other 7 5
Cash flow from operations $ 167 $ 194
• Capital expenditures (68)¹ (55)
Free cash flow** $ 99 $ 139
Dollars in millions; GAAP results
¹ 2016 Cap Ex includes ~ $15 million used to purchase and improve the primary facility of the DAT business.
Esterline Explained, November 2016

FY 2016 EBITDA*
26
* Comparison is to the recast twelve-month period ended October 2, 2015. ** See Page 1 regarding non-GAAP financial measures.
FY 2016 FY 2015*
Operating Earnings from Continuing Operations $ 170 $ 199
• Depreciation and amortization 99 100
EBITDA from Continuing Operations ** $ 269 $ 299
Dollars in millions; GAAP results
Esterline Explained, November 2016
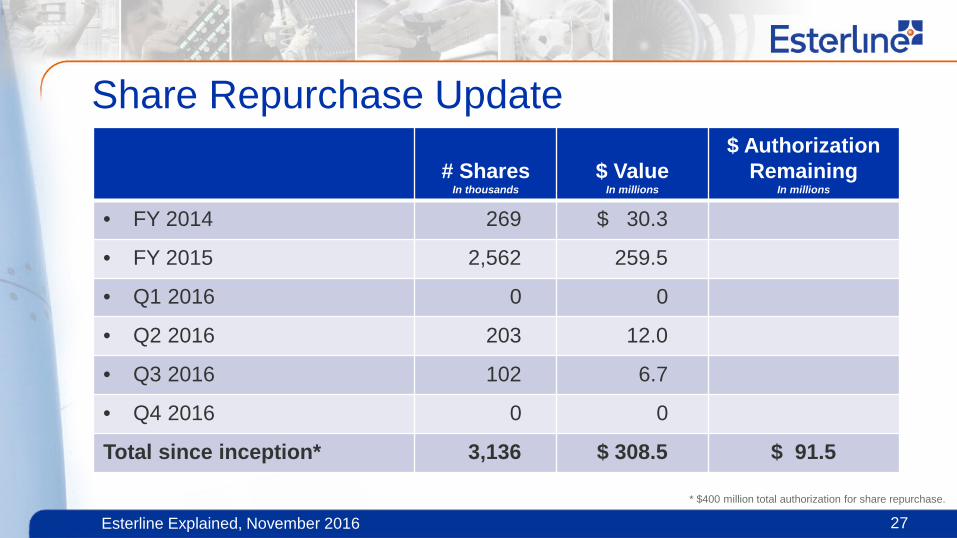
Share Repurchase Update
# Shares In thousands
$ Value In millions
$ Authorization Remaining
In millions
• FY 2014 269 $ 30.3
• FY 2015 2,562 259.5
• Q1 2016 0 0
• Q2 2016 203 12.0
• Q3 2016 102 6.7
• Q4 2016 0 0
Total since inception* 3,136 $ 308.5 $ 91.5
* $400 million total authorization for share repurchase.
27 Esterline Explained, November 2016

2017 Guidance Guidance
Sales $2.0B - $2.05B
GAAP EPS (diluted, continuing ops)
$4.30 - $4.70
Adjusted EPS* (diluted, continuing ops)
$4.50 - $4.90
EBITDA* $295M - $315M
Free Cash Flow* $165M - $185M
28
Guidance 2017 Adjusted EPS
GAAP EPS (diluted, continuing ops) $4.30 - $4.70
Compliance Costs $0.18
DAT Integration Costs $0.02
Adjusted EPS* (diluted, continuing ops) $4.50 - $4.90
* See Page 1 regarding non-GAAP financial measures.
Esterline Explained, November 2016

Sales Growth and Outlook 2016
Sales Mix End Market 2017 Sales Growth* Comments
~50% Commercial Aerospace Low single digit Increased OE production rates: 737Max, A320Neo, 787, A350, C-Series
~30% Defense Flat New products / contracts: Avionics, Defense Technologies, Power Systems
Lower production rates (legacy products) / New LTAs (lower pricing): Avionics, Defense Technologies, Engineered Materials
~20% Adjacent Markets Flat Growth in high-end medical offsets decreases in gaming
Total Flat to 2% (excl ~$15M increase from Defense
Tech incident recovery)
29
* Organic sales growth, excluding impacts from FX and Defense Technologies recovery from May 2016 energetic incident (~ $15m).
Esterline Explained, November 2016

Capital Allocation
30
Share Buyback
Acquisition Growth
Focus on ROIC
R&D CapEx
Esterline Explained, November 2016
$308M repurchased
since June 2014 authorization
DAT acquisition in early 2015

31
POSITIONED TO DRIVE GROWTH, INCREASE PROFITS AND CREATE SHAREHOLDER VALUE
Esterline Explained, November 2016

Investing for Growth • Commercial
– 787, 777x, 737MAX – A320 Neo, A350 – E2, MRJ, CSeries
• Defense – JSF, A400M, P-8, KC-390
• Adjacent – UK nuclear market – Asian rail market – High-end medical – Gaming
32 Esterline Explained, November 2016

Program Esterline approx. Name value per ship set Airbus A380 $ 1,000,000 Airbus A400M $ 1,000,000 Boeing 787 $ 600,000 Boeing P-8 $ 1,000,000 Boeing 747-8 $ 450,000 Lockheed F-35 $ 900,000 Sukhoi Super Jet 100 $ 500,000
Important Program Values
33
Additional Growth Programs: Boeing 777X, Airbus A350, Bombardier CSeries, Embraer E2, Mitsubishi Reg. Jet
Esterline Explained, November 2016

Stakeholder Commitment
34
Customers • OTD / Quality as committed • Competitive products &
services • Partner they depend on • Economics to justify new growth
Shareholders • Peer group leader • Acquisition funding • Higher stock price • Long-term growth
Employees • World-class organization • Financially stable company • Learning and development • Growth opportunities
Esterline Explained, November 2016
A high-performing aerospace and defense company whose engaged employees deliver
value through world-class products, services, and technologies.


![[ PowerPoint Template ]](https://static.documents.pub/doc/80x56/56814853550346895db565d2/-powerpoint-template--5697ba40150e6.jpg)


