ESTIMATED WATER USE IN PUERTO RICO, 1995 OPEN-FILE REPORT 98-276 U.S. Department of the Interior U.S. Geological Survey PUERTO RICO DEPARTMENT OF NATURAL AND ENVIRONMENTAL RESOURCES, and the PUERTO RICO AQUEDUCT AND SEWER AUTHORITY, PUERTO RICO ENVIRONMENTAL QUALITY BOARD Prepared in cooperation with the
Transcript
ESTIMATED WATER USE INPUERTO RICO, 1995
OPEN-FILE REPORT 98-276
U.S. Department of the InteriorU.S. Geological Survey
PUERTO RICO DEPARTMENT OF NATURAL AND ENVIRONMENTAL RESOURCES, and the
PUERTO RICO AQUEDUCT AND SEWER AUTHORITY,
PUERTO RICO ENVIRONMENTAL QUALITY BOARD
Prepared in cooperation with the
U.S. DEPARTMENT OF THE INTERIOR BRUCE BABBITT, Secretary
U.S. GEOLOGICAL SURVEYThomas J. Casadevall, Acting Director
For additional information write to: Copies of this report can be purchased from:
District Chief U.S. Geological Survey U.S. Geological Survey GSA Center, Suite 400-15 Branch of Information Services 651 Federal Drive Box 25286 Guaynabo, Puerto Rico 00965-5703 Denver, CO 80225-0286
Purpose and Scope......................................................................................................................................... 2
Water Use by Category ........................................................................................................................................ 7
Public-Supply Withdrawals and Deliveries to Domestic, Commercial, and Industrial Users ...................... 7
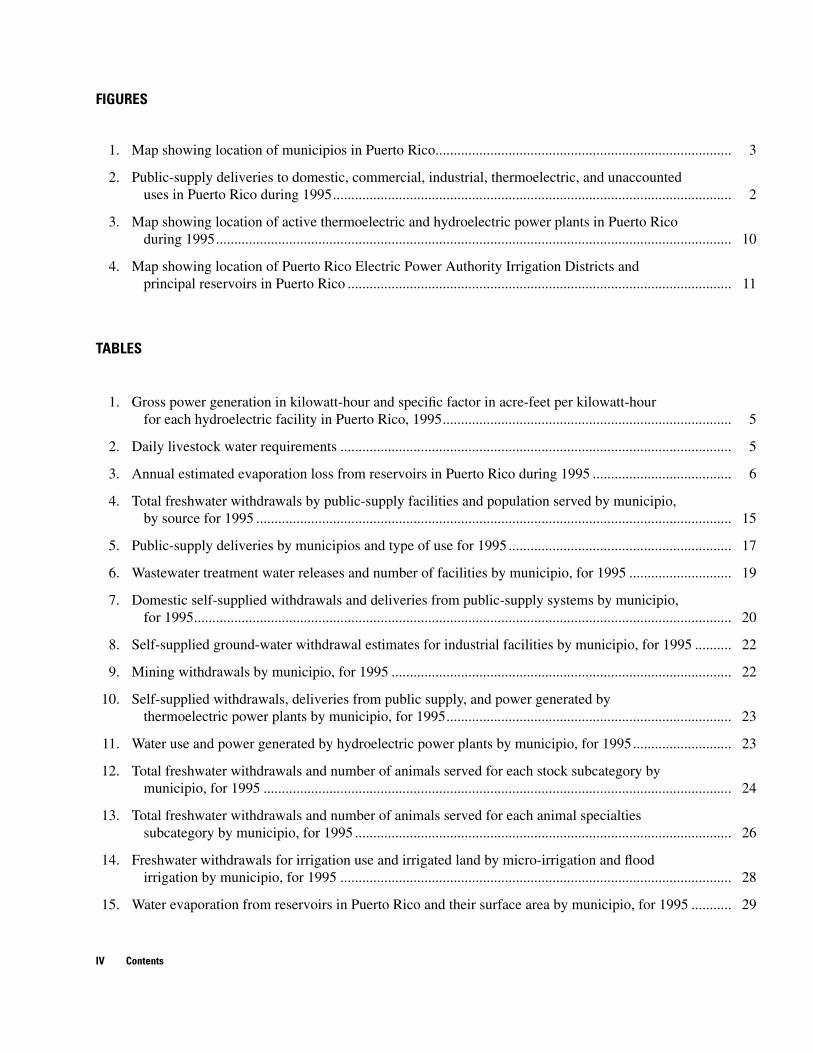
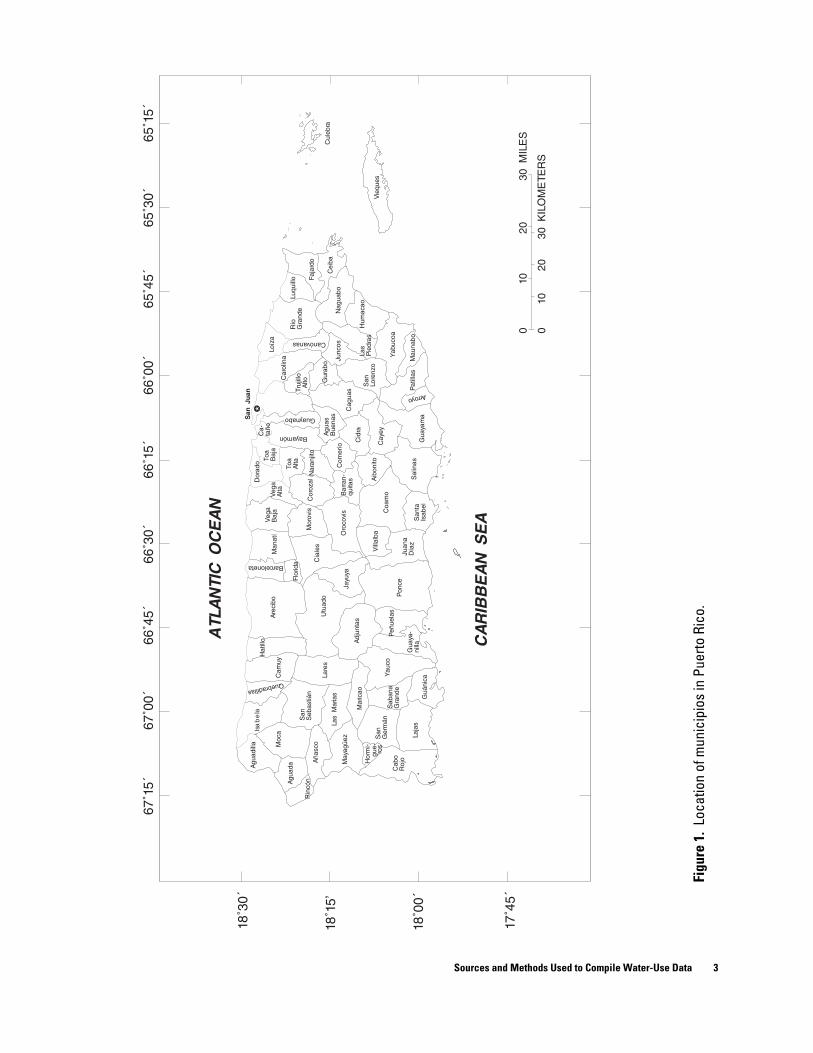
1. Map showing location of municipios in Puerto Rico................................................................................. 3
2. Public-supply deliveries to domestic, commercial, industrial, thermoelectric, and unaccounteduses in Puerto Rico during 1995............................................................................................................. 2
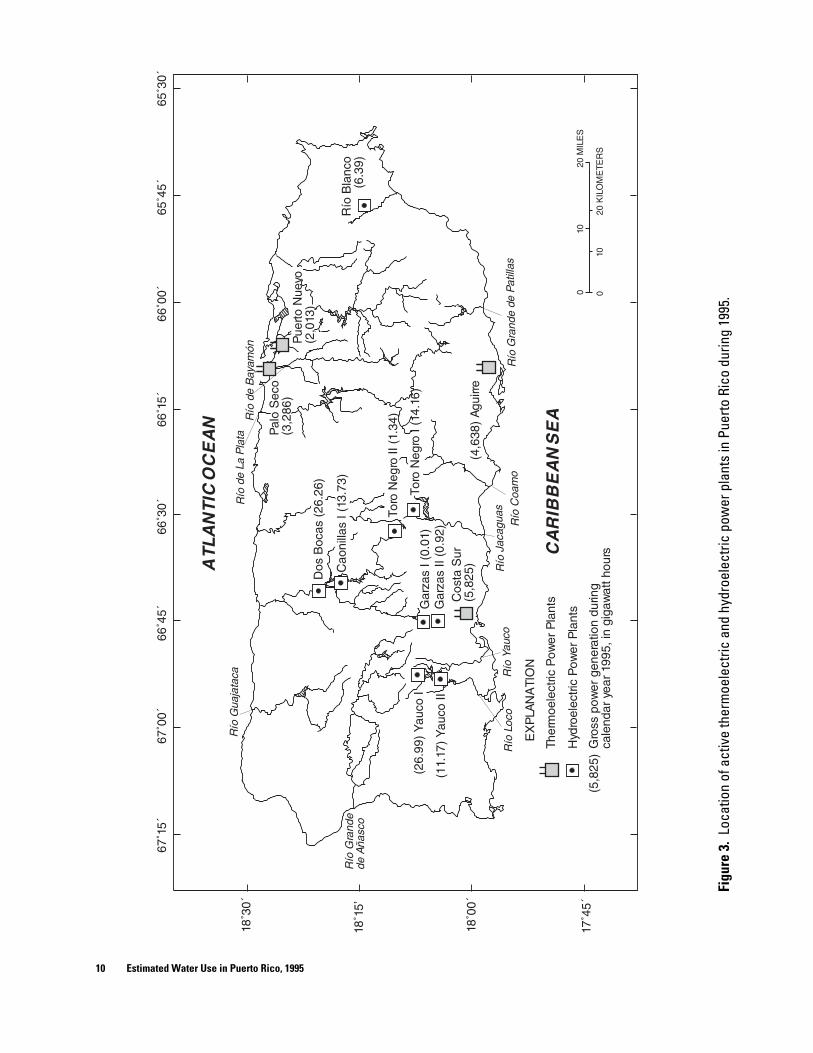
3. Map showing location of active thermoelectric and hydroelectric power plants in Puerto Ricoduring 1995............................................................................................................................................. 10
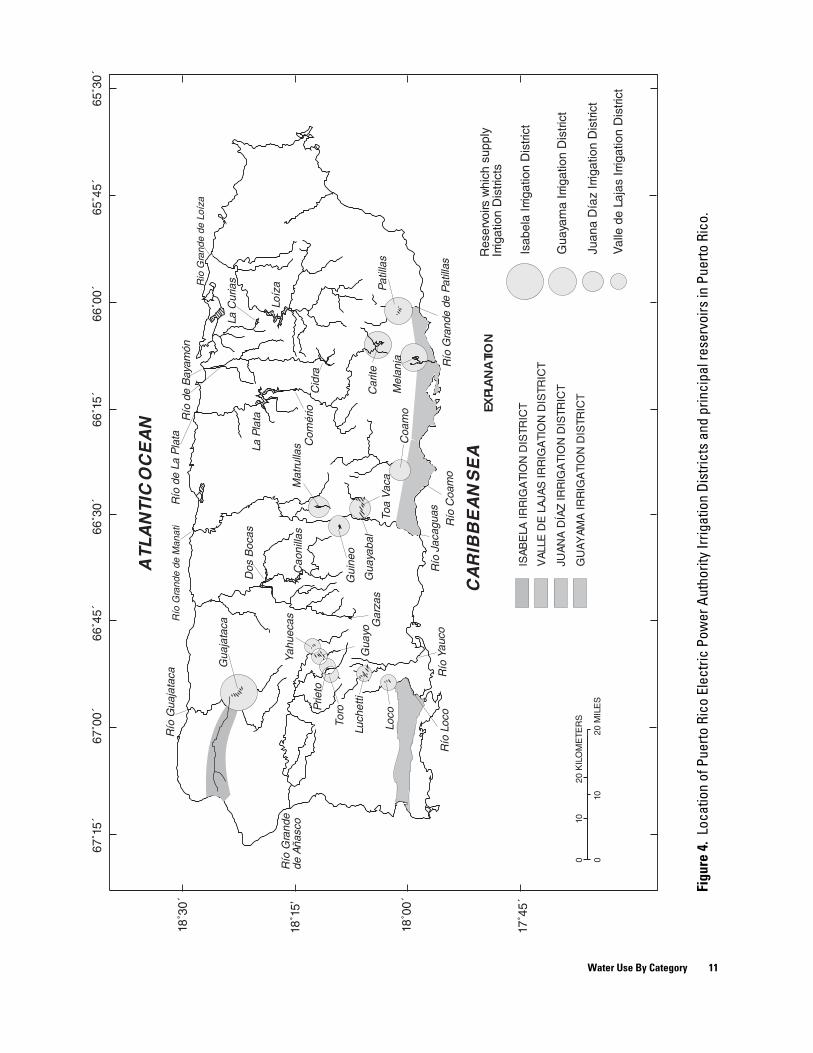
4. Map showing location of Puerto Rico Electric Power Authority Irrigation Districts andprincipal reservoirs in Puerto Rico ......................................................................................................... 11
TABLES
1. Gross power generation in kilowatt-hour and specific factor in acre-feet per kilowatt-hourfor each hydroelectric facility in Puerto Rico, 1995............................................................................... 5
2. Daily livestock water requirements ........................................................................................................... 5
3. Annual estimated evaporation loss from reservoirs in Puerto Rico during 1995 ...................................... 6
4. Total freshwater withdrawals by public-supply facilities and population served by municipio,by source for 1995 .................................................................................................................................. 15
5. Public-supply deliveries by municipios and type of use for 1995 ............................................................. 17
6. Wastewater treatment water releases and number of facilities by municipio, for 1995 ............................ 19
7. Domestic self-supplied withdrawals and deliveries from public-supply systems by municipio,for 1995................................................................................................................................................... 20
8. Self-supplied ground-water withdrawal estimates for industrial facilities by municipio, for 1995 .......... 22
9. Mining withdrawals by municipio, for 1995 ............................................................................................. 22
10. Self-supplied withdrawals, deliveries from public supply, and power generated bythermoelectric power plants by municipio, for 1995.............................................................................. 23
11. Water use and power generated by hydroelectric power plants by municipio, for 1995 ........................... 23
12. Total freshwater withdrawals and number of animals served for each stock subcategory bymunicipio, for 1995 ................................................................................................................................ 24
13. Total freshwater withdrawals and number of animals served for each animal specialtiessubcategory by municipio, for 1995 ....................................................................................................... 26
14. Freshwater withdrawals for irrigation use and irrigated land by micro-irrigation and floodirrigation by municipio, for 1995 ........................................................................................................... 28
15. Water evaporation from reservoirs in Puerto Rico and their surface area by municipio, for 1995 ........... 29
Contents IV
CONVERSION FACTORS, ABBREVIATED WATER-USE UNITS, AND ACRONYMS
Multiply By To obtain
foot 0.3048 meter
acre-foot (acre-ft) 1233.489 cubic meter
cubic foot per second 0.02832 cubic meter per second
gallon per minute 0.0630 liter per second
million gallon per day (Mgal/d) 43.81 liter per second
square mile 2.590 square kilometer
Additional abbreviated water-use units used in this report:
gWh Gigawatt-hour
kWh Kilowatt-hour
gal/d gallon per day
gal/d/acre gallon per day per acre
Acronyms
PRASA Puerto Rico Aqueduct and Sewer Authority
PRDOH Puerto Rico Department of Health
PRDNER Puerto Rico Department of Natural and Environmental Resources
PREPA Puerto Rico Electric Power Authority
PREQB Puerto Rico Environmental Quality Board
USGS U.S. Geological Survey
MSHA U.S. Mine Safety and Health Administration
SWUDS State Water-Use Data System
Contents V
Estimated Water Use in Puerto Rico, 1995By Wanda L. Molina-Rivera
Abstract
Water-use data during calendar year 1995 was compiled for the 78 municipios of the Commonwealth of Puerto Rico. Eight offstream water-use categories were considered during the study: public supply, wastewater treatment discharges, domestic, industrial, mining, thermoelectric power, livestock, and irrigation. Three instream water-use categories were considered: hydroelectric power, saline water used at thermoelectric power plants, and reservoir evaporation. Freshwater withdrawals for offstream use from surface- and ground-water sources in Puerto Rico were estimated to be 566 million gallons per day. The largest amount of freshwater withdrawn was 431 million gallons per day for public supply. Total discharge from public wastewater treatment facilities was reported as 185 million gallons per day. Fresh surface- and ground-water withdrawals for domestic and industrial self-supplied facilities were estimated to be about 19 million gallons per day. Mining activities, which in Puerto Rico are mostly limited to the production of sand and gravel, withdrew about 4.2 million gallons per day of freshwater. Livestock activities used 6.3 million gallons per day from surface- and ground-water sources to meet the water needs of the 12.1 million animals counted in the 1992 Census of Agriculture in Puerto Rico. Self-supplied ground-water withdrawals for thermoelectric facilities were estimated to be 2.2 million gallons per day. Freshwater withdrawals for irrigation purposes were estimated to be 103 million gallons per day, or approximately 18 percent of all offstream freshwater withdrawals. Instream freshwater
withdrawals by hydroelectric facilities were 349 million gallons per day. Reservoir evaporation is considered to be a consumptive use associated with the storage of water. The evaporation from 15 reservoirs in Puerto Rico was estimated to average about 23,900 acre-feet from a total reservoir surface area of 6,900 acres. The largest amount of withdrawals was 2,260 million gallons per day of saline water (instream use) for thermoelectric power.
INTRODUCTION
The National Water-Use Information Program of the U. S. Geological Survey (USGS) is a Federal-State Cooperative Program designed to compile, store, and disseminate water-use information locally and nationwide. The program was implemented in Puerto Rico in 1980 to provide data for the management of the Commonwealth’s water resources. It is essential for water resources planners and managers to have information regarding the amount of water used, and where and how it is used, so that they can adequately assess many of the critical water problems facing Puerto Rico.
The major objectives of the Water-Use Information Program in Puerto Rico are to:
1. Maintain accountability of the water use;
2. Create a computerized data base for data entry and retrieval of water-use information at the local, regional, and national levels;
3. Compile water-use data of uniform quality;
4. Define new methodologies for obtaining high quality water-use data;
Introduction 1
5. Present information and reports that will help in projecting the future water needs of Puerto Rico;
6. Identify water-use problems so that appropriate management solutions can be determined; and
7. Improve the collection, analysis, anddissemination of water-use information.
In order to meet the general objectives of the Water-Use Information Program and to maintain an adequate data base, the USGS maintains cooperative agreements with the Puerto Rico Aqueduct and Sewer Authority (PRASA), the Puerto Rico Department of Natural and Environmental Resources (PRDNER), and the Puerto Rico Environmental Quality Board (PREQB) to compile water-use data for major use categories of importance to water resources managers and planners in Puerto Rico.
A number of terms are used throughout the body of this report that may be unfamiliar to the reader. All such terms are highlighted in boldface type at their first usage in the text. Concise working definitions of these terms are supplied in a glossary at the back of the report.
Purpose and Scope
This report presents estimates of the amount of water withdrawn from surface-water and groundwater sources and used for offstream and instream uses in Puerto Rico during calendar year 1995. The eight categories of offstream water use include public supply, wastewater treatment discharges, domestic, industrial, mining, thermoelectric power, livestock, and irrigation. Three categories of instream water use include hydroelectric power generation, saline water use at thermoelectric power plants, and reservoir evaporation. The data were obtained from the PRASA, PRDNER, the Puerto Rico Department of Health (PRDOH), the Puerto Rico Electric and Power Authority (PREPA), the U.S. Bureau of the Census, and the U.S. Mine Safety and Health Administration (MSHA).
Discussion about the sources and methods used to compile the data parallels the presentation and discussion of water-use data by category. The data are
compiled by municipio, which constitutes the basic political sub-division in Puerto Rico. All data are stored in a computerized storage-retrieval system, the Aggregate Water-Use Data System (AWUDS), which is administered by the USGS.
Acknowledgments
The author gratefully acknowledges the following Commonwealth agencies for their cooperation: the PRASA, PRDNER, PRDOH, and PREPA. The author is also grateful to many other federal and local government employees who, in various ways, provided assistance during this study.
SOURCES AND METHODS USED TO COMPILE WATER-USE DATA
Puerto Rico is divided into 78 municipios (fig. 1). Water-use data for a number of categories were compiled for each municipio. The sources and the methods used to compile water-use data differ for each category and are described in the following sections.
Public-Supply Withdrawals and Deliveries to Domestic, Commercial, and Industrial Users
Public supply includes freshwater withdrawals and deliveries to domestic, commercial, and industrial water-use customers, and public uses such as water for firefighting, street washing, municipal parks, and swimming pools. The withdrawal data were obtained from annual reports prepared by the PRASA (Puerto Rico Aqueduct and Sewer Authority, 1994–95). Public-supply deliveries to domestic, commercial, industrial and public uses were estimated developing a coefficient based on the increase of population per municipio from 1993 to 1995. The deliveries reported by the PRASA for 1993 were then multiplied by this coefficient to obtain the estimated deliveries for 1995. The public-supply deliveries to commercial facilities also include the water distributed by the PRASA to government facilities (such as schools, offices, public parks, and buildings).
Estimated Water Use in Puerto Rico, 1995 2
67˚1
5´
67˚0
0´
66˚4
5´
66˚3
0´
66˚1
5´
66˚0
0´
65˚4
5´
65˚3
0´
65˚1
5´
Sources and Methods Used to Compile Water-Use Data
18˚3
0´
18˚1
5’
18˚0
0´
17˚4
5´
Isa
be
la
Rin
cón
Moc
a
San
Seb
astiá
n
gue
Cab
oR
ojo
San
Sab
ana
Guá
nica
Mar
icao
nilla
Utu
ado
Quebradillas
Cam
uy H
atill
o
Man
atí
Baj
a B
aja
Ca
taño
San
Ju
an
Río
Cei
ba
Nag
uabo
Hum
acao
Mau
nabo
Arroyo
Sal
inas
San
taIs
abel
Juan
aD
íaz
Coa
mo
Cia
les
is
San
Junc
os
Cag
uas
Bue
nas
quita
s
0
200
Agu
adill
a
Agu
ada A
ñasc
o
May
agüe
z
Las
Mar
ias
Hor
mi
ros
Laja
s
Ger
mán
Gra
nde
Yau
co
Gua
yaPeñ
uela
s P
once
Adj
unta
s
Lare
s
Are
cibo
Jayu
ya
Flor
ida Barceloneta
Veg
aV
ega
Alta
Dor
ado To
a
Car
olin
a
Loíz
a
Gra
nde
Luqu
illo Fa
jard
o
Yab
ucoa
Pat
illas
G
uaya
ma
Vill
alba
A
ibon
ito
Cay
ey
Oro
covi
s
Mor
ovC
oroz
al
Toa
Alta
Bayamón
Guaynabo
Truj
illo
Alto
Canóvanas
Lore
nzo
Las
Pie
dras
Gur
abo
Agu
as
Cid
ra
Com
erío
Nar
anjit
o
Bar
ran
Vie
ques
Cul
ebra
10
20
30 K
ILO
ME
TER
S
30 M
ILE
S10
ATL
AN
TIC
OC
EA
N
CA
RIB
BE
AN
SE
A
Figu
re 1
. Lo
catio
n of
mun
icip
ios
in P
uerto
Ric
o.
3
The domestic use category also includes public-supply facilities which are not operated by the
PRASA, but serve more than 25 people or have a
minimum of 15 connections and are known as non-
PRASA systems. These data were supplied by the
PRDOH (Puerto Rico Department of Health, 1995).
The total population served by public-supply
sources was estimated by extrapolating the PRASA
data from 1993 to 1995. Also, a report prepared by
PRDOH including the non-PRASA population was
used to estimate the total population served from these
systems (PRDOH, 1995). The population served from
surface-water public-supply sources was calculated by
dividing surface-water withdrawals by total
withdrawals, and then multiplying the quotient by the
estimated total population served from a public-supply
source (PRASA + non-PRASA population). The
population served from ground-water public-supply
sources was estimated by subtracting the population
served by surface-water systems from the total
population served from a public-supply source. To
estimate the water used per day per person (per capita water use), the daily domestic water use was divided
by the population using potable water. Daily water use
was determined by dividing the total domestic water
use by the number of days in a year.
Wastewater Treatment
The wastewater treatment category was included in this report because it contains information on the amount of water returned to the hydrologic system by public wastewater treatment facilities and the number of public facilities that treat wastewater. Wastewater treatment discharges from domestic, commercial, and industrial users served from public-supply systems were obtained from annual reports prepared by the PRASA (Puerto Rico Aqueduct and Sewer Authority, 1995). These annual reports indicate the number of public wastewater treatment facilities and the volume of sewage treated by municipio.
Self-Supplied Domestic
Self-supplied domestic water withdrawals were estimated by multiplying the population not served by a public-supply system in each municipio by the per capita water-use estimate obtained for domestic users supplied from a public-supply source. The self-supplied domestic population was determined by subtracting the public-supplied population, served by PRASA and non-PRASA systems, from the total population. The total populations of each municipio for 1995 was estimated using a population projection prepared by the Bureau of Census (U.S. Department of Commerce, 1995).
Self-Supplied Industrial and Mining
The annual self-supplied industrial surface- and ground-water withdrawal estimates were obtained from individual facilities (by personal visits, and telephone and mail surveys). The surveys provide information concerning the location of the systems and the amount of water withdrawn by each industrial facility. Also a listing of franchises provided by the Permits and Franchise Division of the PRDNER was used to estimate the ground-water withdrawals of some industrial facilities.
The 1995 fresh surface- and ground-water withdrawals used for mining purposes were obtained from the Permits and Franchises Division of the PRDNER and from a list of site locations provided by the MSHA. This list contains information about the active facilities operating in Puerto Rico during 1995.
Thermoelectric and Hydroelectric
Freshwater use from public supply for the Puerto Nuevo and Palo Seco thermoelectric power plants from self-supplied ground-water withdrawals at the Aguirre and Costa Sur plants, and instream saline water use (seawater withdrawals) was obtained from reports prepared by the PREPA. Most of the freshwater withdrawn by thermoelectric power plants is used for boiler feed, whereas saline water is used for cooling purposes.
Estimated Water Use in Puerto Rico, 1995 4
The total annual amount of instream water use by hydroelectric power plants throughout Puerto Rico during 1995 was obtained from monthly power generation reports by the PREPA. The amount of water used for hydroelectric power was obtained from the amount of power generated by each facility on a monthly basis. The following equation was used to obtain monthly instream water use:
Water Use = P (F / N) (1)
where
P is the gross power generation, in kilowatt-hours;
F is a specific factor for each reservoir, given the relation between monthly energy production and instream water requirement, in acre-feet per kilowatt-hour; and
N is the number of days in a month.
Table 1 shows the gross power generation in kilowatt-hours and the specific factor in acre-feet per kilowatt-hour used for each hydroelectric facility in Puerto Rico during 1995.
Table 1. Gross power generation in kilowatt-hours (P) and specific factor in acre-feet per kilowatt-hour (F) for each hydroelectric facility in Puerto Rico, 1995
Reservoir P F
Dos Bocas 26.26 0.0033598
Río Blanco 6.39 0.0003233
Toro Negro II 1.34 0.0001771
Garzas I 0.01 0.0002089
Garzas II 0.92 0.0002089
Caonillas I 13.73 0.0006161
Toro Negro I 14.16 0.0002469
Yauco I 26.99 0.0003589
Yauco II 11.17 0.001417
Livestock
Livestock in Puerto Rico totaled 12,103,626 animals according to the 1992 Census of Agriculture (U.S. Department of Commerce, 1994). The freshsurface- and ground-water withdrawals used for livestock watering purposes are presented in two subcategories: (1) the water associated with the production of red meat, poultry, eggs, and milk, called "stock" water use and (2) the "animal specialties" water use, which includes the water associated with the production of fur-bearing animals, horses, rabbits, and aquaculture (fish farms).
To estimate the total water use for livestock, the daily average watering requirements per animal (Kirk, 1982; table 2) was multiplied by the total number of animals reported in the agricultural census in each municipio. In general, the livestock watering requirements given in table 2 represent maximum rates in the life cycle. As an example, watering needs for hogs range from 0.6 gal/d for piglets to about 6.0 gal/d for lactating sows (U.S. Department of Commerce, 1990, p. 394).
Table 2. Daily livestock water requirements [gal/d, gallons per day]
Livestock Water required (gal/d)
Dairy cows 35
Cattle, horses, mules 12
Hogs 4
Sheep, goats 2
Rabbits 1
Chicken 0.06
Irrigation
Surface-water withdrawals for irrigation purposes were estimated using an inventory of the amount of water withdrawn from reservoirs owned by the PREPA. Ground-water withdrawals for irrigation purposes in the municipios of Guánica, Guayama, Guayanilla, Juana Díaz, Ponce, Salinas, and Santa
Sources and Methods Used to Compile Water-Use Data 5
Isabel were obtained from a vegetable crops application rate based on a water delivery rate of 242 gal/d/acre and an average daily application of 7.2 hours per day for 365 days per year.
Irrigation withdrawals at municipios of Guayama, Patillas, Quebradillas, Villalba, and Yauco were obtained from data reported by the PREPA. The data presented on the number of acres irrigated were obtained from the 1992 Census of Agriculture (U.S. Department of Commerce, 1994).
Reservoir Evaporation
Evaporation of water from a reservoir is considered to be a consumptive use associated with the storage of water. It was calculated for the reservoirs in Puerto Rico that had capacity equal to or greater than 5,000 acre-ft when originally constructed. The annual water loss due to evaporation for
reservoirs throughout Puerto Rico was calculated using the following equation:
RE = RA (PE)(K) (2)
where
RE is the estimated reservoir evaporation during 1995, in thousands of acre-feet per year;
RA is the reservoir surface area at normal pool elevation, in thousands of acres;
PE is the class A annual pan evaporation, in feet; and
K is a constant, equal to 0.7.
The surface area for each reservoir was obtained from the PREPA and PRDNER. Reservoir levels were assumed to be at the spillway elevation. Class A pan evaporation for each reservoir was based on the National Oceanic and Atmospheric Administration data sites located within the same climatic subdivision as the reservoir (U.S. Department of Commerce, 1995; table 3).
Table 3. Annual estimated evaporation loss from reservoirs in Puerto Rico during 1995 [X, average]
Municipio Reservoir Surface area (in thousands of acres) Climatological station Class A pan
evaporation (in inches)
Adjuntas Lago Garzas 0.10 Adjuntas Substation 49.67
Lago Guayo 0.28 Adjuntas Substation 49.67
Arecibo Lago Dos Bocas 0.63 Corozal Substation 48.17
Cidra Lago Cidra 0.27 Adjuntas and Gurabo Substation
X=57.23
Comerio Lago Comerio II 0.06 Corozal Substation 48.17
Guayama Lago Carite 0.33 Adjuntas Substation 49.67
Patillas Lago Patillas 0.31 Gurabo Substation 64.78
Ponce Lago Cerrillos 0.61 Ponce 4E 79.10
Quebradillas Lago Guajataca 1.00 Isabela Substation 42.33
Toa Alta Lago La Plata 0.56 Corozal Substation 48.17
Trujillo Alto Lago Loíza 0.60 Gurabo Substation 64.78
Utuado Lago Caonillas 0.70 Corozal Substation 48.17
Villalba Lago Toa Vaca 0.84 Ponce 4E 79.10
Lago Guayabal 0.33 Ponce 4E 79.10
Yauco Lago Luchetti 0.27 Ponce 4E and Lajas Substation X=59.38
Estimated Water Use in Puerto Rico, 1995 6
WATER USE BY CATEGORY
Freshwater withdrawals during 1995 from surface- and ground-water sources for offstream use averaged 566 Mgal/d; surface-water withdrawals averaged 420 Mgal/d and ground-water withdrawals averaged 146 Mgal/d. Withdrawals during 1995 by municipio are summarized in tables 4 through 15 (at the end of the report) for the categories of water use presented in this section.
Public-Supply Withdrawals and Deliveries to Domestic, Commercial, and Industrial Users
The 144 public-supply facilities operating in Puerto Rico were supplied from surface-water sources and 349 public-supply wells during 1995. Culebra is the only municipio that uses a seawater desalinization plant to obtain public-supplied water.
Freshwater withdrawals by public-supply facilities from surface- and ground-water sources totaled 431 Mgal/d during 1995. The largest public-supply withdrawal was 89 Mgal/d from the Sergio Cuevas facility at Trujillo Alto (table 4, at end of report). This facility withdraws water from the Lago Loíza reservoir and provides water principally to the municipios of Trujillo Alto, Carolina, and San Juan, and augments the supply from other sources to the municipios of Guaynabo and Cataño.
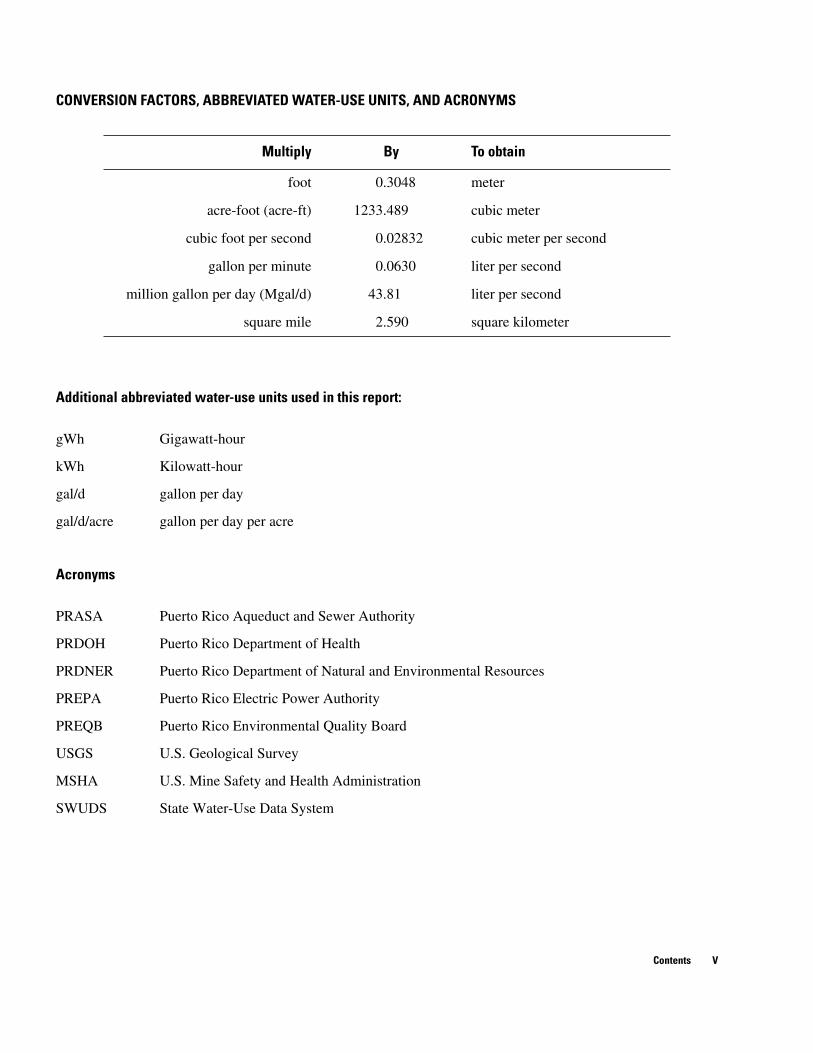
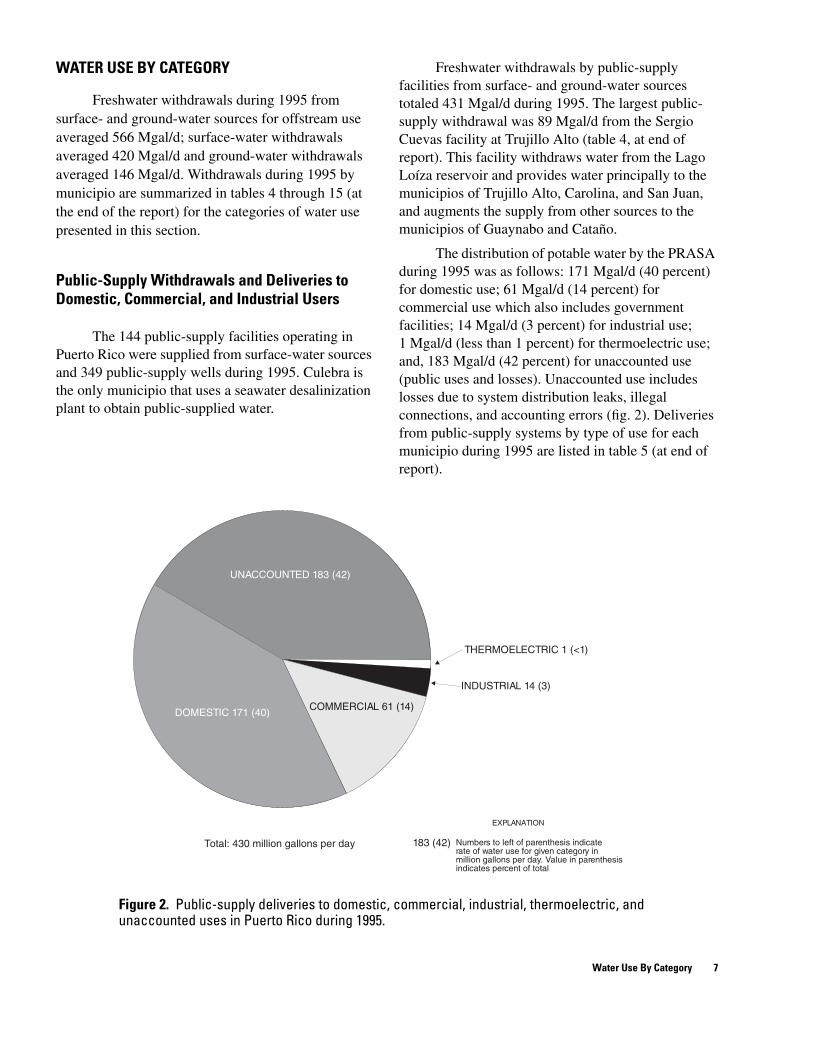
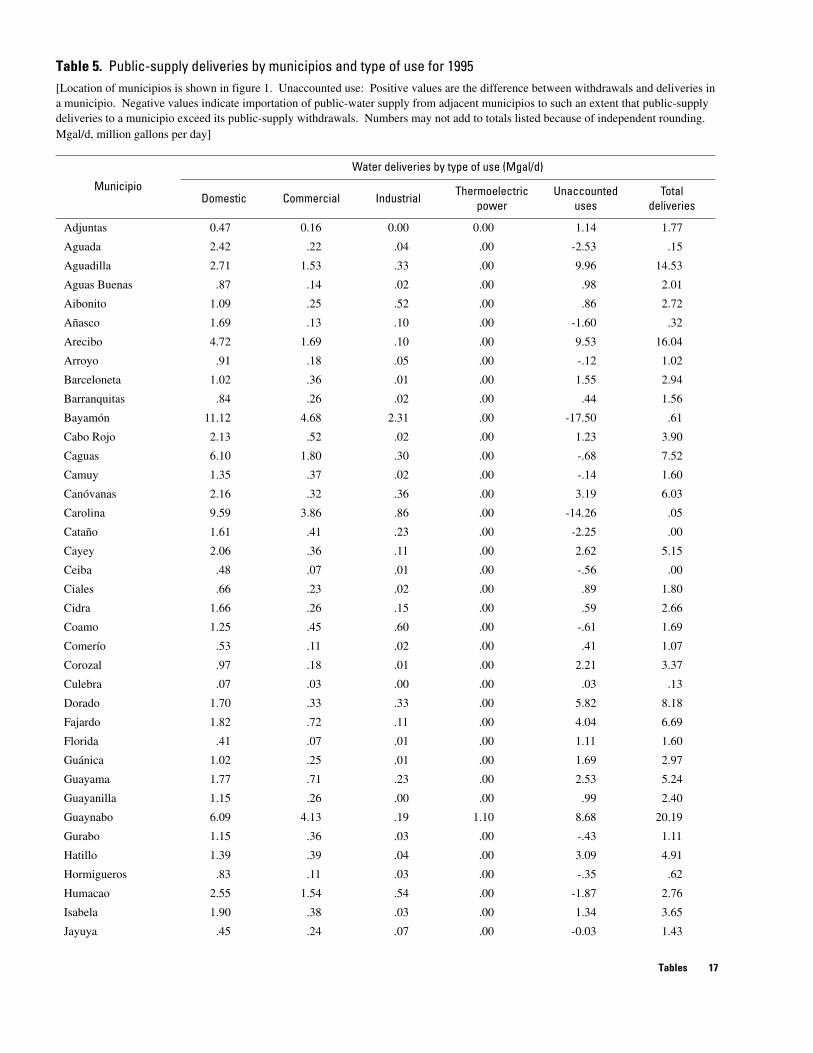
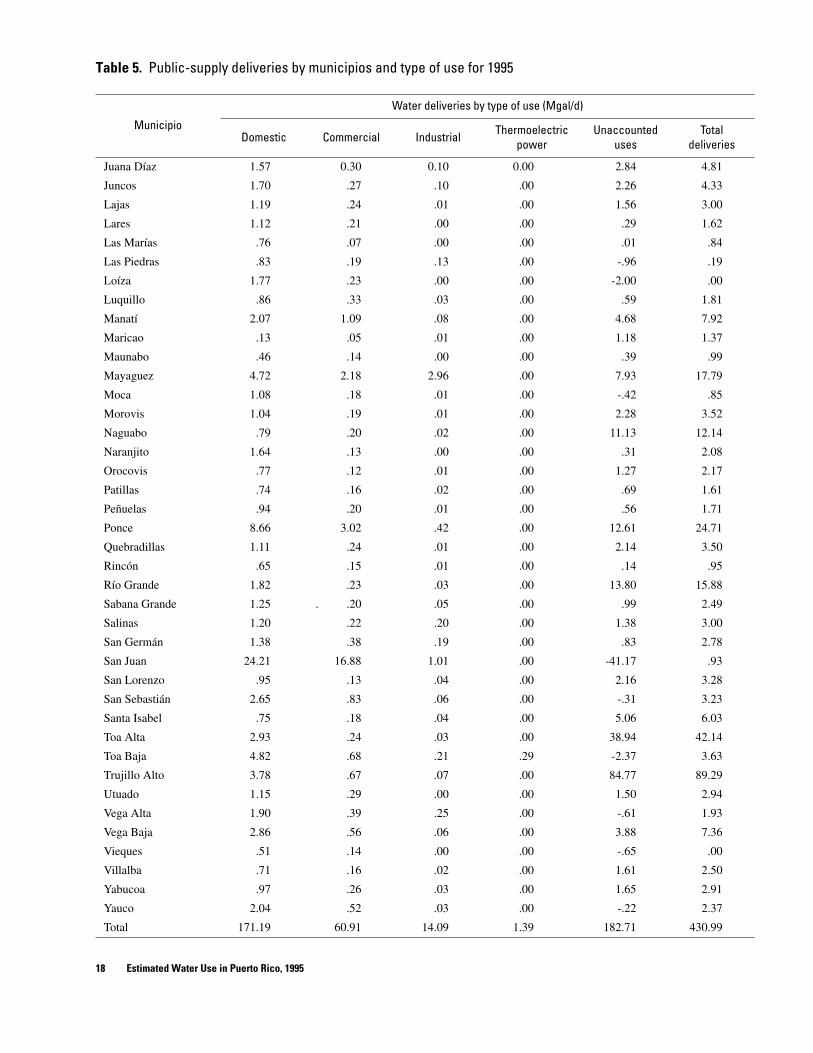
The distribution of potable water by the PRASA during 1995 was as follows: 171 Mgal/d (40 percent) for domestic use; 61 Mgal/d (14 percent) for commercial use which also includes government facilities; 14 Mgal/d (3 percent) for industrial use; 1 Mgal/d (less than 1 percent) for thermoelectric use; and, 183 Mgal/d (42 percent) for unaccounted use (public uses and losses). Unaccounted use includes losses due to system distribution leaks, illegal connections, and accounting errors (fig. 2). Deliveries from public-supply systems by type of use for each municipio during 1995 are listed in table 5 (at end of report).
THERMOELECTRIC 1 (<1)
INDUSTRIAL 14 (3)
UNACCOUNTED 183 (42)
COMMERCIAL 61 (14) DOMESTIC 171 (40)
EXPLANATION
Total: 430 million gallons per day 183 (42) Numbers to left of parenthesis indicate rate of water use for given category in million gallons per day. Value in parenthesis indicates percent of total
Figure 2. Public-supply deliveries to domestic, commercial, industrial, thermoelectric, and unaccounted uses in Puerto Rico during 1995.
Water Use By Category 7
Positive values resulting from the difference between withdrawals and deliveries within a municipio and listed under "unaccounted use" in table 5 may represent exports of public-water supply to adjacent municipios in addition to the reasons previously defined under unaccounted use. Negative values indicate importation of public-water supply from adjacent municipios to such an extent that public-supply deliveries to a municipio exceed its public-supply withdrawals.
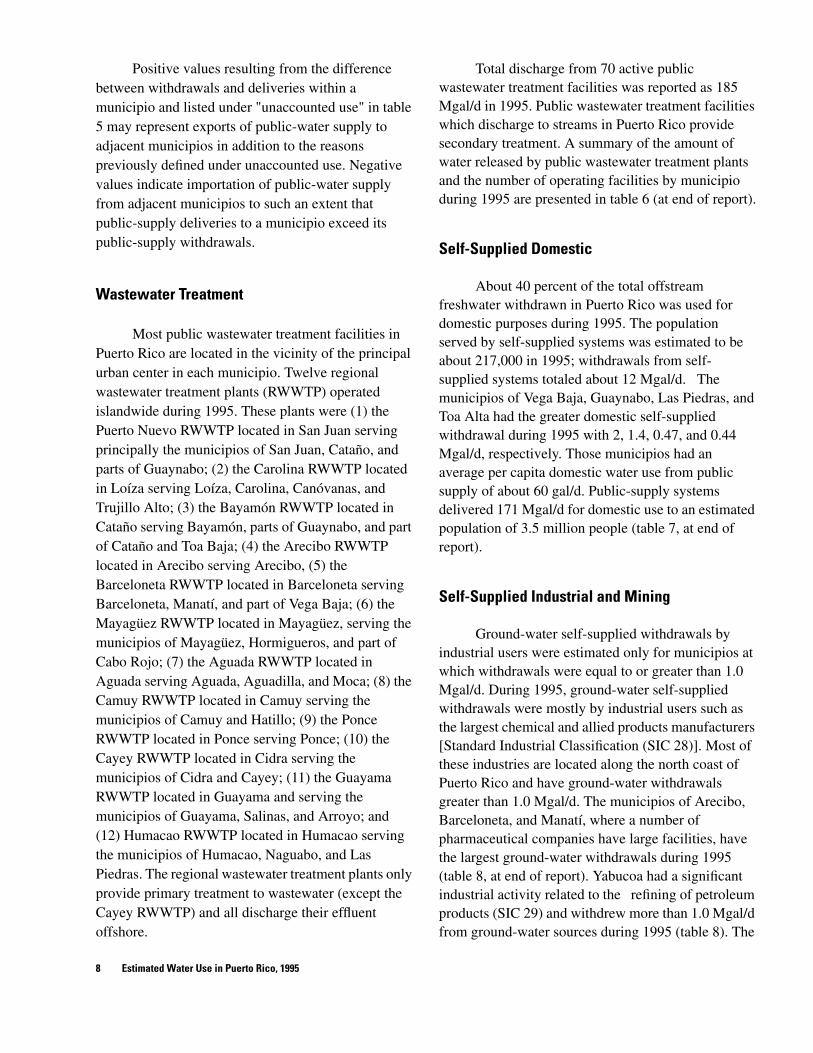
Wastewater Treatment
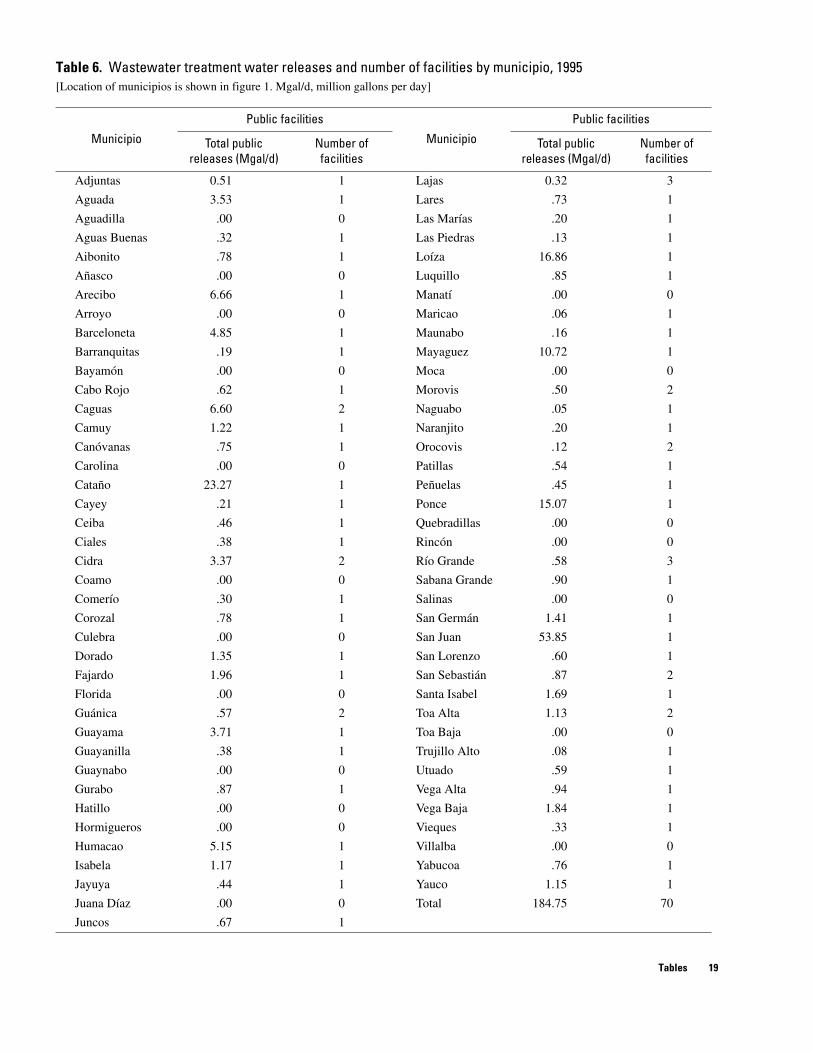
Most public wastewater treatment facilities in Puerto Rico are located in the vicinity of the principal urban center in each municipio. Twelve regional wastewater treatment plants (RWWTP) operated islandwide during 1995. These plants were (1) the Puerto Nuevo RWWTP located in San Juan serving principally the municipios of San Juan, Cataño, and parts of Guaynabo; (2) the Carolina RWWTP located in Loíza serving Loíza, Carolina, Canóvanas, and Trujillo Alto; (3) the Bayamón RWWTP located in Cataño serving Bayamón, parts of Guaynabo, and part of Cataño and Toa Baja; (4) the Arecibo RWWTP located in Arecibo serving Arecibo, (5) the Barceloneta RWWTP located in Barceloneta serving Barceloneta, Manatí, and part of Vega Baja; (6) the Mayagüez RWWTP located in Mayagüez, serving the municipios of Mayagüez, Hormigueros, and part of Cabo Rojo; (7) the Aguada RWWTP located in Aguada serving Aguada, Aguadilla, and Moca; (8) the Camuy RWWTP located in Camuy serving the municipios of Camuy and Hatillo; (9) the Ponce RWWTP located in Ponce serving Ponce; (10) the Cayey RWWTP located in Cidra serving the municipios of Cidra and Cayey; (11) the Guayama RWWTP located in Guayama and serving the municipios of Guayama, Salinas, and Arroyo; and (12) Humacao RWWTP located in Humacao serving the municipios of Humacao, Naguabo, and Las Piedras. The regional wastewater treatment plants only provide primary treatment to wastewater (except the Cayey RWWTP) and all discharge their effluent offshore.
Total discharge from 70 active public wastewater treatment facilities was reported as 185 Mgal/d in 1995. Public wastewater treatment facilities which discharge to streams in Puerto Rico provide secondary treatment. A summary of the amount of water released by public wastewater treatment plants and the number of operating facilities by municipio during 1995 are presented in table 6 (at end of report).
Self-Supplied Domestic
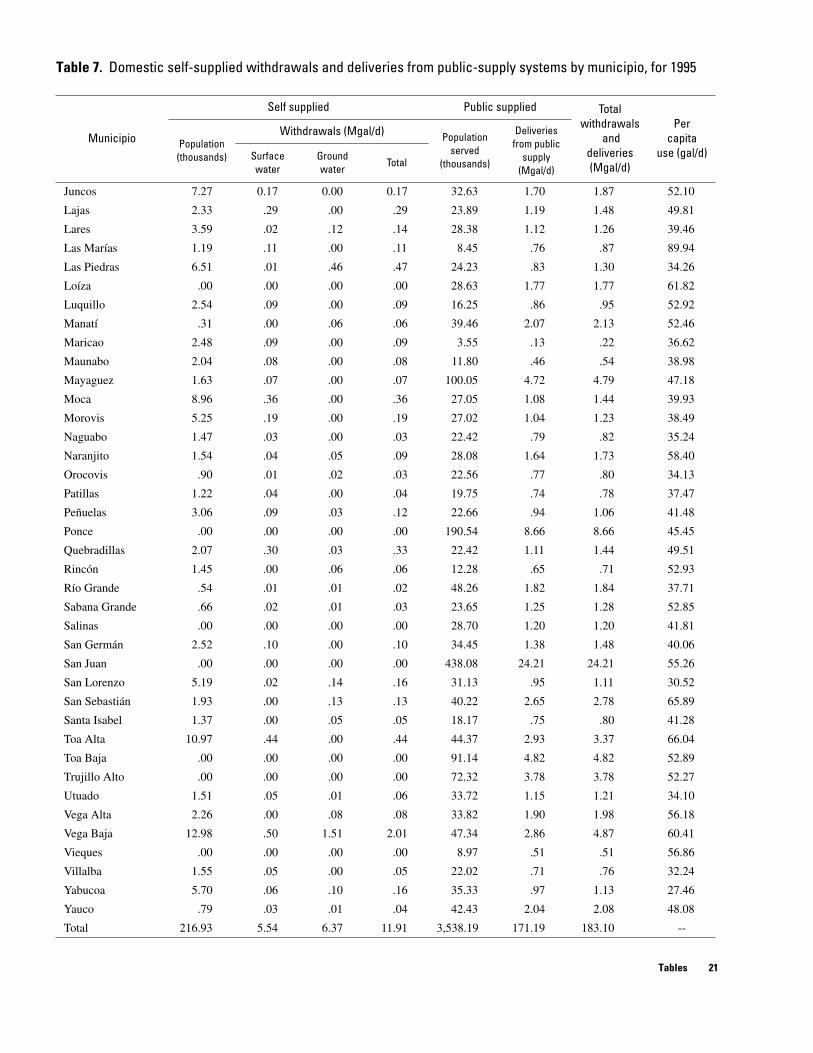
About 40 percent of the total offstream freshwater withdrawn in Puerto Rico was used for domestic purposes during 1995. The population served by self-supplied systems was estimated to be about 217,000 in 1995; withdrawals from self-supplied systems totaled about 12 Mgal/d. The municipios of Vega Baja, Guaynabo, Las Piedras, and Toa Alta had the greater domestic self-supplied withdrawal during 1995 with 2, 1.4, 0.47, and 0.44 Mgal/d, respectively. Those municipios had an average per capita domestic water use from public supply of about 60 gal/d. Public-supply systems delivered 171 Mgal/d for domestic use to an estimated population of 3.5 million people (table 7, at end of report).
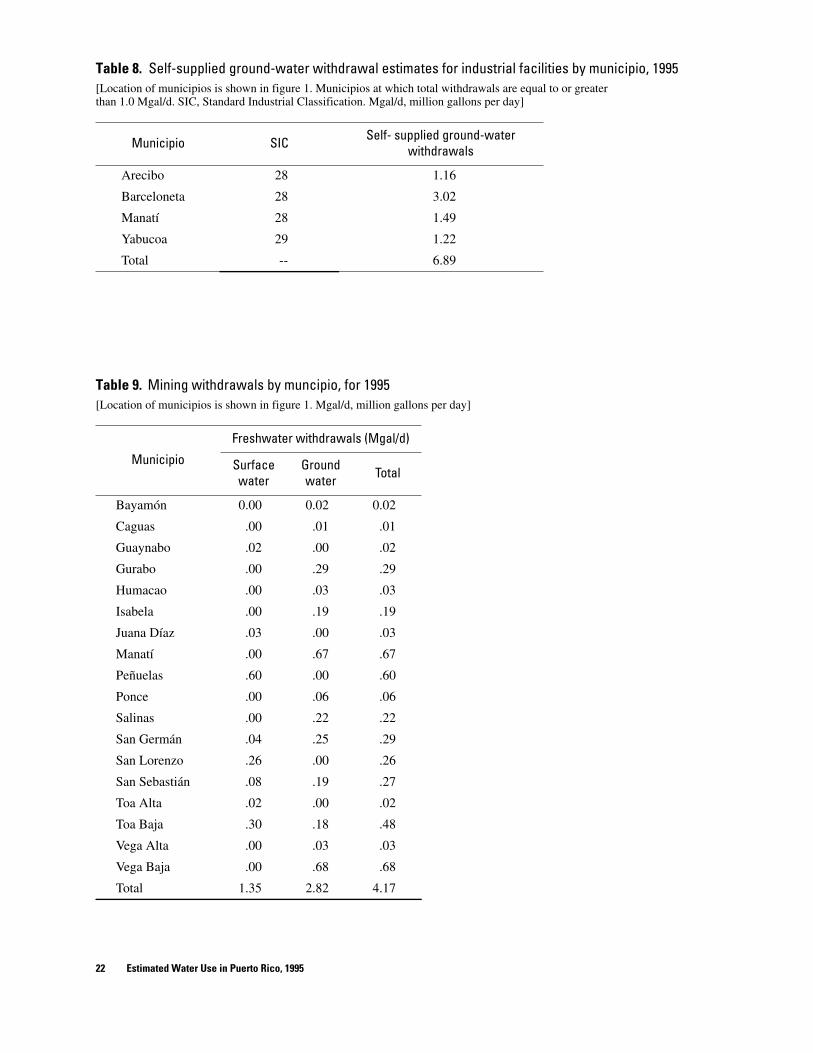
Self-Supplied Industrial and Mining
Ground-water self-supplied withdrawals by industrial users were estimated only for municipios at which withdrawals were equal to or greater than 1.0 Mgal/d. During 1995, ground-water self-supplied withdrawals were mostly by industrial users such as the largest chemical and allied products manufacturers [Standard Industrial Classification (SIC 28)]. Most of these industries are located along the north coast of Puerto Rico and have ground-water withdrawals greater than 1.0 Mgal/d. The municipios of Arecibo, Barceloneta, and Manatí, where a number of pharmaceutical companies have large facilities, have the largest ground-water withdrawals during 1995 (table 8, at end of report). Yabucoa had a significant industrial activity related to the refining of petroleum products (SIC 29) and withdrew more than 1.0 Mgal/d from ground-water sources during 1995 (table 8). The
Estimated Water Use in Puerto Rico, 1995 8
total industrial self-supplied ground-water withdrawals in Puerto Rico were estimated to be 7 Mgal/d for 1995.
The principal mining activity in Puerto Rico is the production of sand and gravel for the construction industry. Mining water withdrawals were about 4.2 Mgal/d during 1995. Most of the production was concentrated in the northeastern part of Puerto Rico, with the largest fresh ground water withdrawal occurring in Manatí and Vega Baja. Mining water-use activities during 1995 are summarized by municipio in table 9 (at end of report).
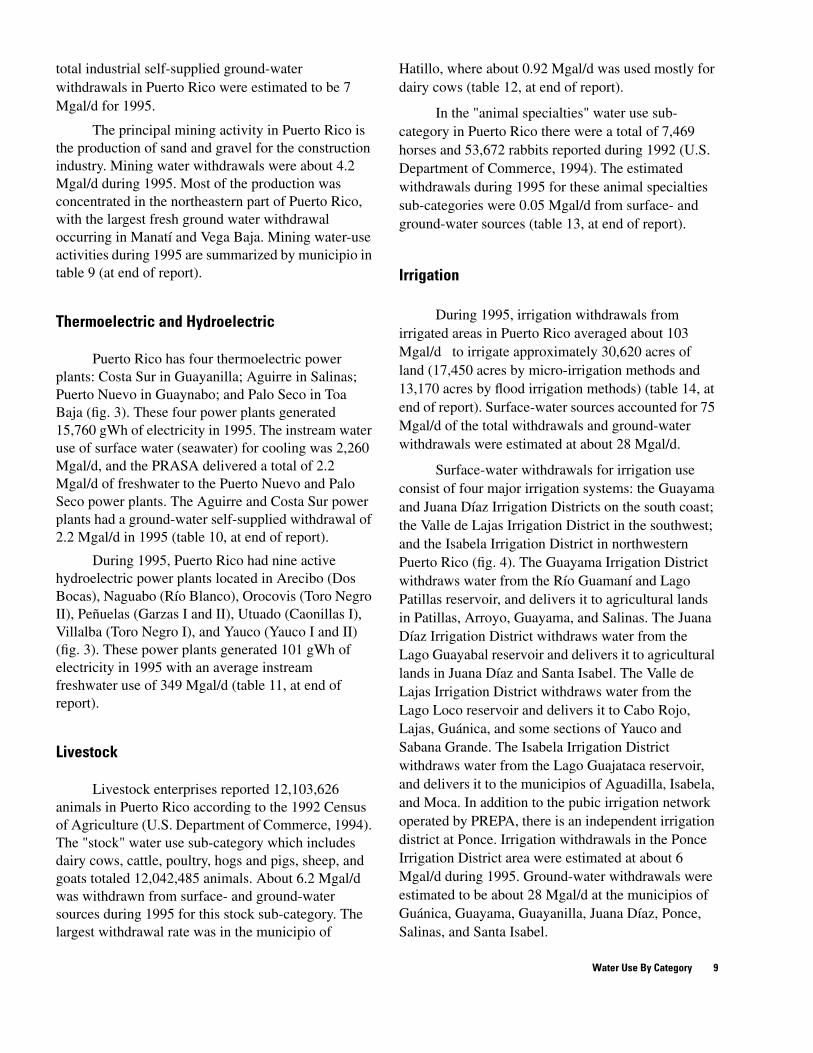
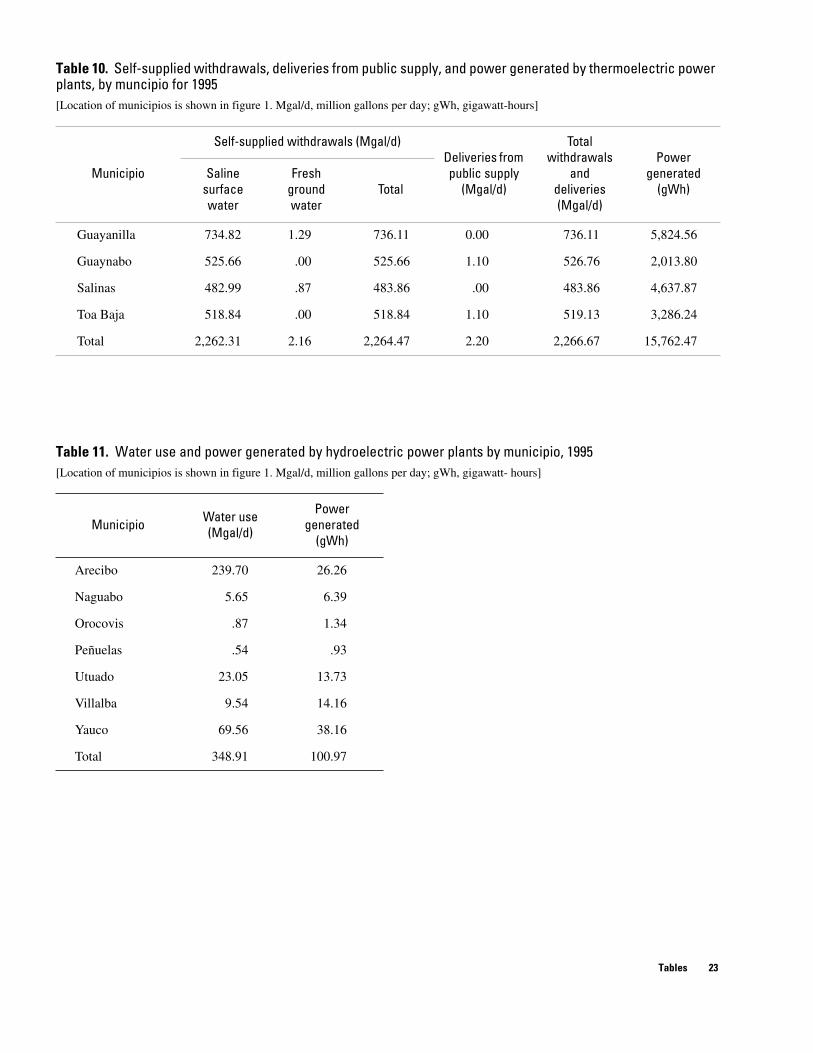
Thermoelectric and Hydroelectric
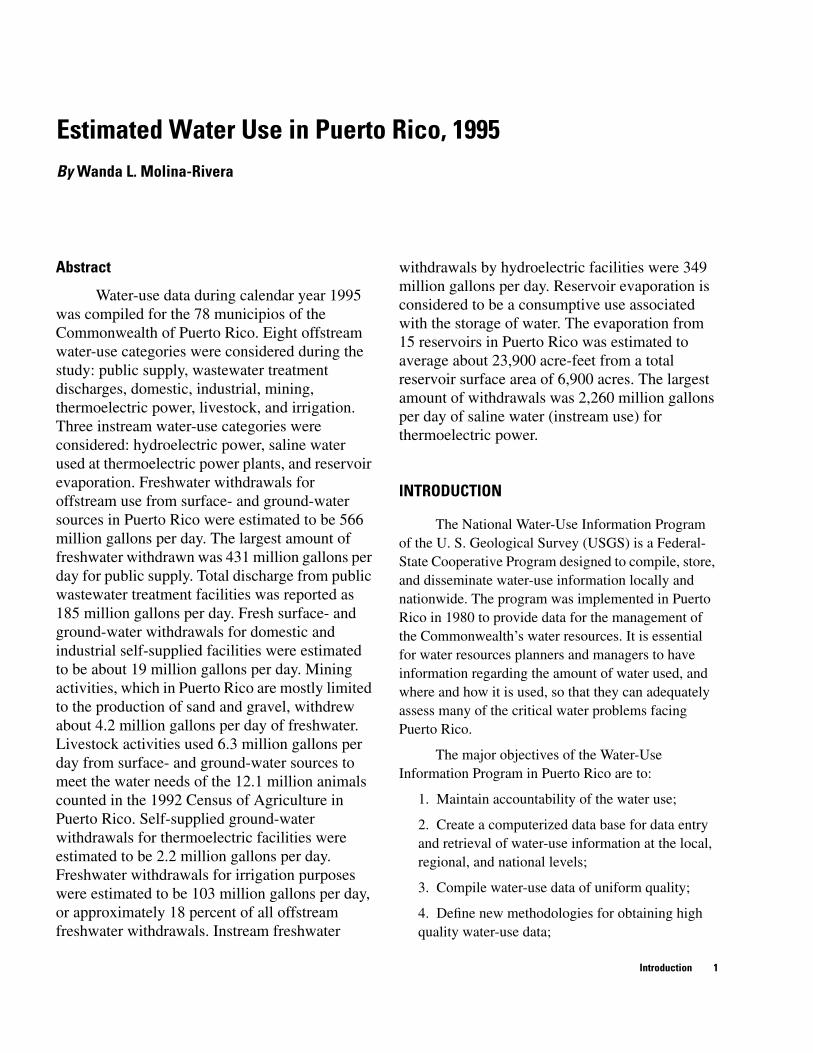
Puerto Rico has four thermoelectric power plants: Costa Sur in Guayanilla; Aguirre in Salinas; Puerto Nuevo in Guaynabo; and Palo Seco in Toa Baja (fig. 3). These four power plants generated 15,760 gWh of electricity in 1995. The instream water use of surface water (seawater) for cooling was 2,260 Mgal/d, and the PRASA delivered a total of 2.2 Mgal/d of freshwater to the Puerto Nuevo and Palo Seco power plants. The Aguirre and Costa Sur power plants had a ground-water self-supplied withdrawal of 2.2 Mgal/d in 1995 (table 10, at end of report).
During 1995, Puerto Rico had nine active hydroelectric power plants located in Arecibo (Dos Bocas), Naguabo (Río Blanco), Orocovis (Toro Negro II), Peñuelas (Garzas I and II), Utuado (Caonillas I), Villalba (Toro Negro I), and Yauco (Yauco I and II) (fig. 3). These power plants generated 101 gWh of electricity in 1995 with an average instream freshwater use of 349 Mgal/d (table 11, at end of report).
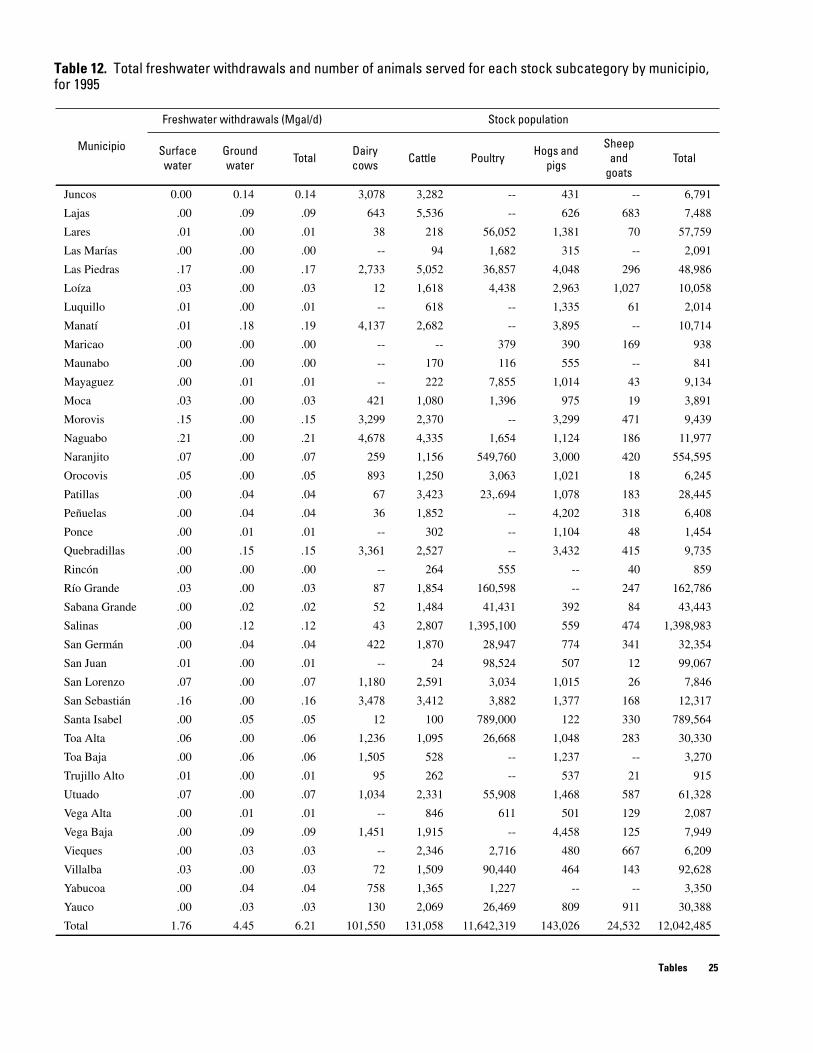
Livestock
Livestock enterprises reported 12,103,626 animals in Puerto Rico according to the 1992 Census of Agriculture (U.S. Department of Commerce, 1994). The "stock" water use sub-category which includes dairy cows, cattle, poultry, hogs and pigs, sheep, and goats totaled 12,042,485 animals. About 6.2 Mgal/d was withdrawn from surface- and ground-water sources during 1995 for this stock sub-category. The largest withdrawal rate was in the municipio of
Hatillo, where about 0.92 Mgal/d was used mostly for dairy cows (table 12, at end of report).
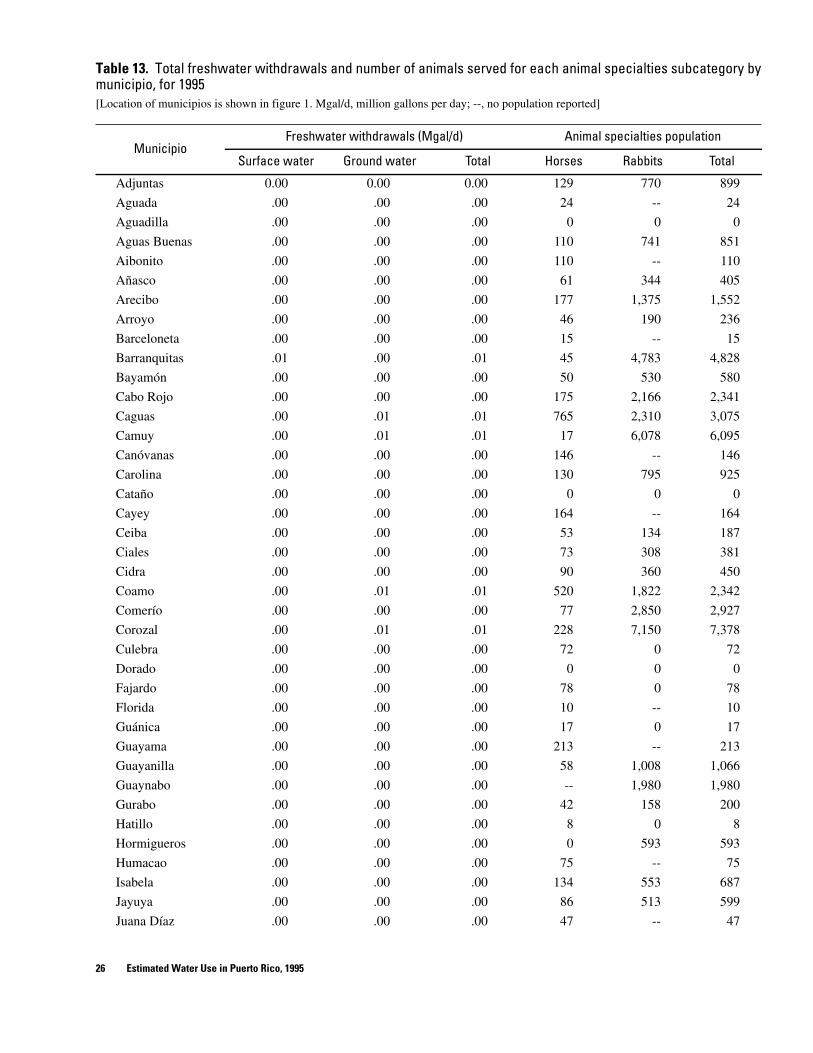
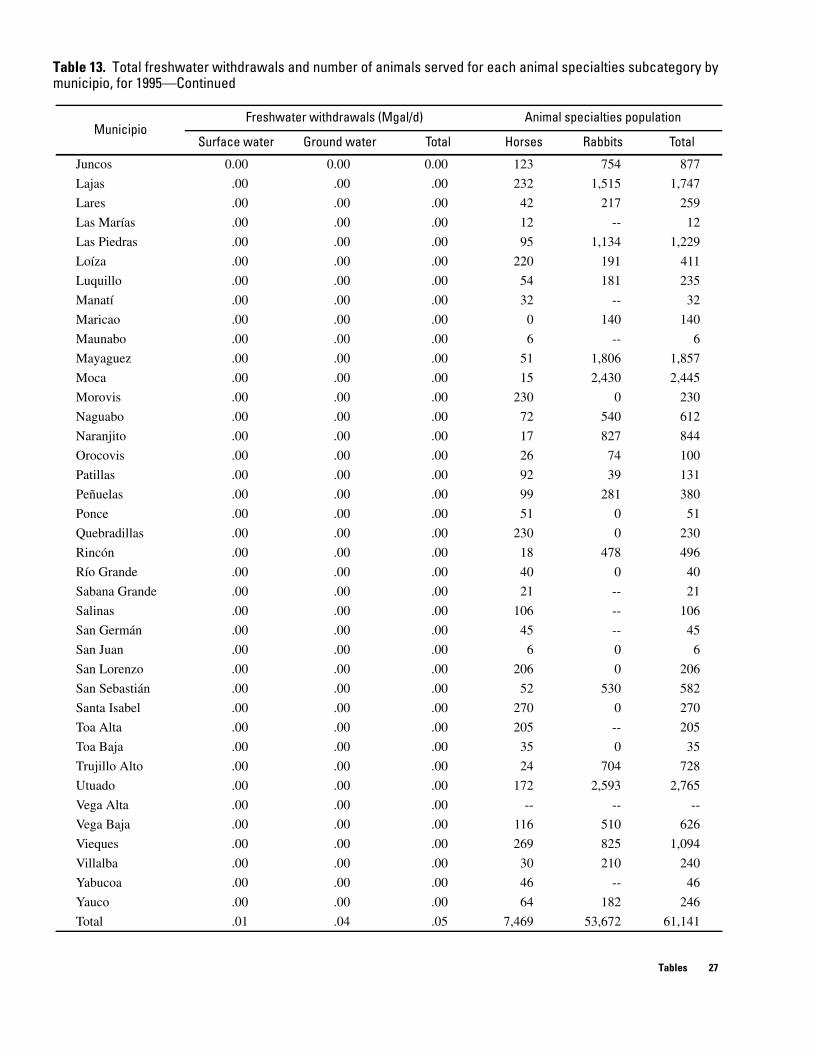
In the "animal specialties" water use subcategory in Puerto Rico there were a total of 7,469 horses and 53,672 rabbits reported during 1992 (U.S. Department of Commerce, 1994). The estimated withdrawals during 1995 for these animal specialties sub-categories were 0.05 Mgal/d from surface- and ground-water sources (table 13, at end of report).
Irrigation
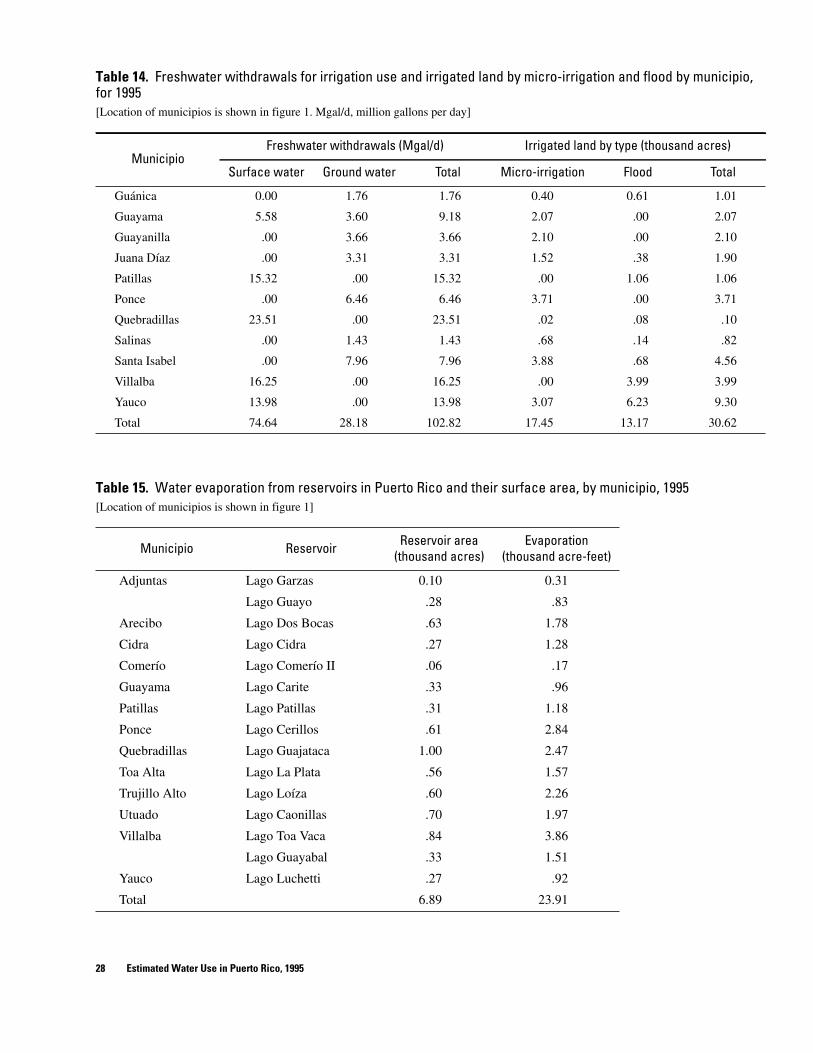
During 1995, irrigation withdrawals from irrigated areas in Puerto Rico averaged about 103 Mgal/d to irrigate approximately 30,620 acres of land (17,450 acres by micro-irrigation methods and 13,170 acres by flood irrigation methods) (table 14, at end of report). Surface-water sources accounted for 75 Mgal/d of the total withdrawals and ground-water withdrawals were estimated at about 28 Mgal/d.
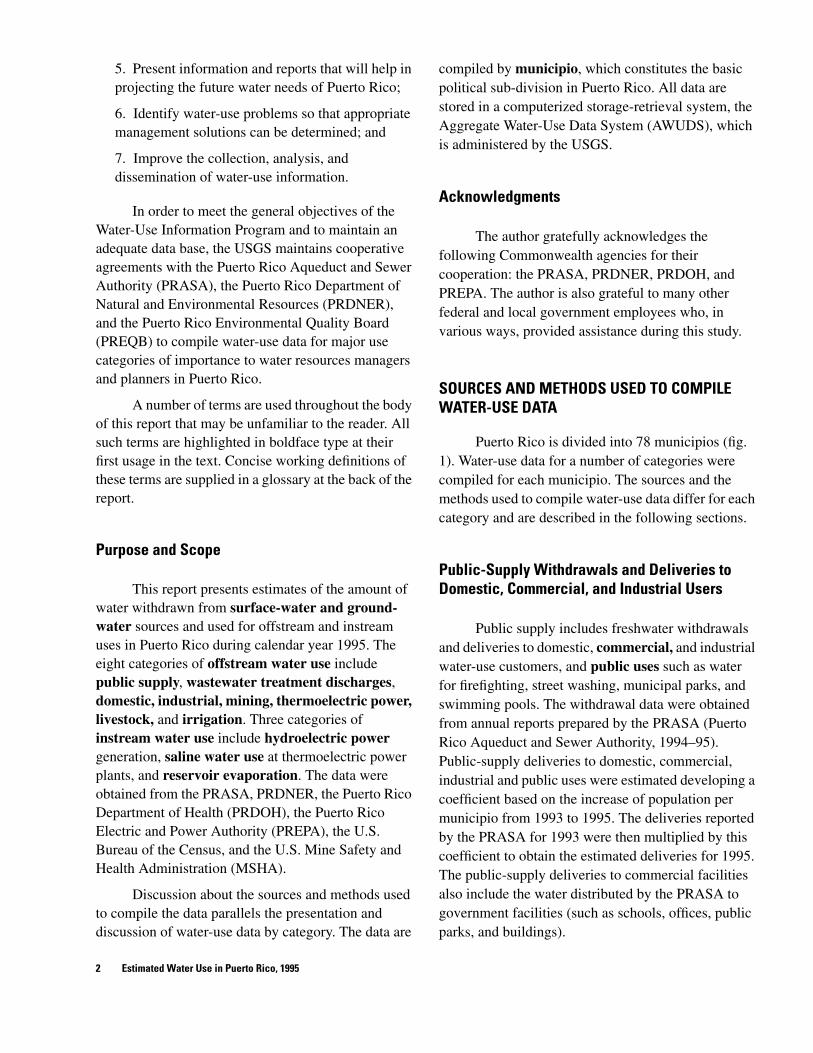
Surface-water withdrawals for irrigation use consist of four major irrigation systems: the Guayama and Juana Díaz Irrigation Districts on the south coast; the Valle de Lajas Irrigation District in the southwest; and the Isabela Irrigation District in northwestern Puerto Rico (fig. 4). The Guayama Irrigation District withdraws water from the Río Guamaní and Lago Patillas reservoir, and delivers it to agricultural lands in Patillas, Arroyo, Guayama, and Salinas. The Juana Díaz Irrigation District withdraws water from the Lago Guayabal reservoir and delivers it to agricultural lands in Juana Díaz and Santa Isabel. The Valle de Lajas Irrigation District withdraws water from the Lago Loco reservoir and delivers it to Cabo Rojo, Lajas, Guánica, and some sections of Yauco and Sabana Grande. The Isabela Irrigation District withdraws water from the Lago Guajataca reservoir, and delivers it to the municipios of Aguadilla, Isabela, and Moca. In addition to the pubic irrigation network operated by PREPA, there is an independent irrigation district at Ponce. Irrigation withdrawals in the Ponce Irrigation District area were estimated at about 6 Mgal/d during 1995. Ground-water withdrawals were estimated to be about 28 Mgal/d at the municipios of Guánica, Guayama, Guayanilla, Juana Díaz, Ponce, Salinas, and Santa Isabel.
Water Use By Category 9
Estimated Water Use in Puerto Rico, 1995
67˚1
5´
67˚0
0´
66˚4
5´
66˚3
0´
66˚1
5´
66˚0
0´
65˚4
5´
65˚3
0´
18˚3
0´
18˚1
5’
18˚0
0´
17˚4
5´
Río
Gua
jata
ca
Río
deL a
Pla
ta
Río
de B
ayam
ón
oan
ded
atas
R
íoC
mo
Río
Jaca
guas
R
Yauc
o L
00
(3,2
86)
(5,8
25)
Cos
ta S
ur(5
,825
)
Río
Bla
nco
(6.3
9)
Dos
Boc
as (
26.2
6)
Río
Gra
nde
de A
ñasc
o
Rí
Gr
eP
illoa
íoR
íooc
o
10
20 K
ILO
ME
TER
S
10
20 M
ILE
S
ATL
AN
TIC
OC
EA
N
CA
RIB
BE
AN
SE
A
Pal
o S
eco
(26.
99)
Yau
co I
(11.
17)
Yau
co II
G
arza
s I (
0.01
) G
arza
s II
(0.9
2)
(4,6
38)
Agu
irre
Hyd
roel
ectri
c P
ower
Pla
nts
Gro
ss p
ower
gen
erat
ion
durin
g ca
lend
ar y
ear
1995
, in
giga
wat
t hou
rs
Ther
moe
lect
ric P
ower
Pla
nts
Pue
rto N
uevo
(2
,013
)
EX
PLA
NA
TIO
N
Toro
Neg
ro II
(1.
34)
Cao
nilla
s I (
13.7
3)
Toro
Neg
ro I
(14.
16)
Figu
re 3
. Lo
catio
n of
act
ive
ther
moe
lect
ric a
nd h
ydro
elec
tric
pow
er p
lant
s in
Pue
rto R
ico
durin
g 19
95.
10
67˚1
5´
67˚0
0´
66˚4
5´
66˚3
0´
66˚1
5´
66˚0
0´
65˚4
5´
65˚3
0´
Water Use By Category
18˚3
0´
18˚1
5’
18˚0
0´
17˚4
5´
Gua
jata
ca
o
LG
uayo
Gar
Prie
to
Gui
neo
Dos
Boc
as
Cao
nilla
s
Coa
mo
Cid
ra
L
L
Mel
ania
P
Río
Gua
jata
ca
Río
deL a
Pla
ta
Río
de B
ayam
ón
Gr a
nde
dat
as
Río
Cm
o Ja
cag
s R
Yauc
o R
ío
0 0
ISA
BE
LA IR
RIG
ATI
ON
DIS
TRIC
T
VA
LLE
DE
LA
JAS
IRR
IGA
TIO
N D
ISTR
ICT
JUA
NA
DÍA
Z IR
RIG
ATI
ON
DIS
TRIC
T
GU
AY
AM
A IR
RIG
ATI
ON
DIS
TRIC
T
Yah
ueca
s
Tor
Loco
uche
tti
zas
Gua
yaba
l
Toa
Vac
a
Mat
rulla
s a P
lata
Com
ério
a C
uria
s
Loíz
a
Car
iteat
illas
Río
Gra
nde
de M
anat
i
Rio
Gra
nde
de L
oíza
Isab
ela
Irrig
atio
n D
istri
ct
Res
ervo
irs w
hich
sup
ply
Irr
igat
ion
Dis
trict
s
Gua
yam
a Irr
igat
ion
Dis
trict
Juan
a D
íaz
Irrig
atio
n D
istri
ct
Val
le d
e La
jas
Irrig
atio
n D
istri
ct
EXPL
AN
ATIO
N
Río
Gra
nde
de A
ñasc
o
Río
eP
illoa
Río
uaío
o Lo
c
10
20 K
ILO
ME
TER
S
10
20 M
ILE
S
ATL
AN
TIC
OC
EA
N
CA
RIB
BE
AN
SE
A
Figu
re 4
. Lo
catio
n of
Pue
rto R
ico
Elec
tric
Pow
er A
utho
rity
Irrig
atio
n Di
stric
ts a
nd p
rinci
pal r
eser
voirs
in P
uerto
Ric
o.
11
Reservoir Evaporation
The amount of water that evaporated from 15 reservoirs throughout Puerto Rico was estimated to be about 23,900 acre-ft from a total reservoir area of 6,900 acres. Lago Toa Vaca and Lago Guayabal, in Villalba, had the largest amount of evaporation, totaling 5,370 acre-ft from a total reservoir area of 1,170 acres (table 15, at end of report; fig. 4).
SUMMARY
Puerto Rico is divided into 78 municipios. Water-use data for 1995 were compiled for each municipio in Puerto Rico. The data were compiled for eight offstream water-use categories: public-supply, wastewater treatment discharges, domestic, industrial, mining, thermoelectric power, livestock, and irrigation. Three instream water-use categories were considered: hydroelectric power, saline water used at thermoelectric power plants, and reservoir evaporation.
During 1995, freshwater withdrawals from surface- and ground-water sources (excluding wastewater treatment) averaged 566 Mgal/d. Freshwater withdrawals to public-supply facilities from surface- and ground-water sources totaled 431 Mgal/d. The largest amount of water delivered by the PRASA in 1995 was 183 Mgal/d (42 percent) for unaccounted uses. The second largest delivery by the PRASA was 171 Mgal/d for domestic uses. Public wastewater treatment plants treated 185 Mgal/d.
About 40 percent of the total offstream freshwater withdrawn was used for domestic purposes. Ground-water self-supplied withdrawals by industrial users (estimated only for municipios in which withdrawals were 1.0 Mgal/d or greater) totaled 7
Mgal/d. Withdrawals for mining activity totaled about 3 Mgal/d of ground water.
Puerto Rico has four thermoelectric power plants that consume large amounts of saline surface water for cooling. These withdrawals totaled 2,260 Mgal/d. The PRASA also delivered 2.2 Mgal/d of fresh ground water to the Puerto Nuevo and Palo Seco plants. The Aguirre and Costa Sur power plants withdrew 2.2 Mgal/d of freshwater from their groundwater wells. There were nine active hydroelectric power plants located throughout Puerto Rico. These power plants used 349 Mgal/d of instream freshwater in 1995.
Livestock enterprises reported 12,103,626 animals in Puerto Rico according to the 1992 Census of Agriculture. The stock sub-category totaled 12,042,485 animals, and used 6.2 Mgal/d from surface- and ground-water sources during 1995. The animal specialties sub-category totaled 7,469 horses and 53,672 rabbits, and used 0.05 Mgal/d from surface- and ground-water sources.
Surface water for irrigation use was withdrawn from the public irrigation district operated by the PREPA which consists of four major systems. An independent irrigation district at Ponce and several municipios also obtain their irrigation water from ground water systems. About 103 Mgal/d of surface-and ground-water was withdrawn to irrigate 30,620 acres of land.
Reservoir evaporation is considered to be a consumptive use associated with the storage of water. The evaporation of water from 15 reservoirs in Puerto Rico totaled 23,900 acre-ft during 1995 from a total reservoir surface area of 6,900 acres.
Estimated Water Use in Puerto Rico, 1995 12
REFERENCES
Kirk, J.R., Jarhoe, J., Sanderson, E.W., Sasman, R.T., and Lonnquist, C., 1982, Water withdrawals in Illinois, 1980: Illinois State Water Survey Circular 152, 47 p.
Puerto Rico Aqueduct and Sewer Authority, 1994-95, Annual Water Production Report: 41 p.
_____1996, Estudio de Necesidad de Producción de Agua para Puerto Rico hasta el año 2,050, 82 p.
Puerto Rico Department of Health, 1995, NONPRASA System Inventory, 36 p.
GLOSSARY
Commercial water use: Water for motels, hotels, restaurants, office buildings, other commercial facilities, and civilian and military institutions. The water is obtained from a public supply or is self-supplied.
Consumptive use: That part of water withdrawn that is evaporated, transpired, incorporated into products or crops, consumed by humans or livestock, or otherwise removed from the immediate water environment.
Domestic water use: Water for household purposes, such as drinking, food preparation, bathing, washing clothes and dishes, flushing toilets, and watering lawns and gardens. The water is obtained from a public supply or is self-supplied.
Freshwater: Water that contains less than 1,000 milligrams per liter (mg/L) of dissolved solids; generally, more than 500 mg/L of dissolved solids is undesirable for drinking and many industrial uses.
Ground water: Generally all subsurface water as distinct from surface water; specifically, that part of the subsurface water in the saturated zone, where the water is under pressure greater than atmospheric.
U.S. Department of Commerce, 1990, The Water Encyclopedia: 2nd Edition, 394 p.
_____1994, 1992 Census of Agriculture: Puerto Rico, Bureau of Census, AC 92–A–52, 211 p.
_____1995, Climatological data (monthly reports), Puerto Rico and the Virgin Islands: National Oceanic and Atmospheric Administration, January–December, 1995, 12 p.
_____1995, Estimates of the resident population of Puerto Rico municipios, July 1, 1995, and components of change since 1990, 2 p.
Hydroelectric power water use: The use of water in generating electricity at power plants where the turbine generators are driven by falling water; an instream use.
Industrial water use: The water used to manufacture products such as steel, chemical, and paper products. It includes water used in petroleum refining such as processing, washing, and cooling operations. This category includes self-supplied water and water purchased from a water supplier.
Instream water use: Water use taking place within the stream channel for such purposes as hydroelectric power generation, navigation, water quality improvement, fish propagation, and recreation. In Puerto Rico instream water is mainly used in the generation of hydroelectric power.
Irrigation water use: The application of water on lands to assist in the growing of crops and pastures or to maintain vegetative growth in recreational lands, such as parks and golf courses.
Livestock water use: Water for stock watering, feed lots, dairy operations, fish farming, and other farm needs. Livestock as used here includes cattle, sheep, goats, hogs, and poultry. Also included are such animal specialities as horses, rabbits, bees, pets, fur-bearing animals in captivity, and fish in captivity.
Glossary 13
Mining water use: Water use for extraction of minerals occurring naturally including solids, such as coal and ores; liquids, such as crude petroleum; and gases, such as natural gas. Also includes uses associated with quarrying, well operations (dewatering), milling (crushing, screening, washing, floatation), and other preparations customarily completed at the mine site or as part of a mining activity. The main mining activity in Puerto Rico is the production of sand and gravel.
Municipio: The minimum legal or jurisdictional unit in Puerto Rico as used by the U.S. Bureau of Census. It is more or less equivalent to a county in the United States.
Offstream water use: Water withdrawn or diverted from a ground- or surface-water source for use in public supply, industry, source for irrigation, livestock, thermoelectric power generation, and other activities.
Per capita water use: The average amount of water used per person during a standard time period, generally per day.
Public-supply use: Water withdrawn by public and private water suppliers and delivered to groups of users. Public suppliers provide water for a variety of uses, such as domestic, commercial, thermoelectric power, industrial, and public water use.
Public water use: Water supplied from a public supply and used for such purposes as firefighting, street washing, and municipal parks and swimming pools.
Reservoir evaporation: Water loss by evaporation from man-made impoundments which have a normal capacity equal to or greater than 5,000 acre-feet. Normal capacity is defined as the total volume in a reservoir below the normal retention level, including dead storage but excluding flood-control and surcharge storage.
Saline water use: Water that contains more than 1,000 milligrams per liter of dissolved solids.
Self-supplied water: Water withdrawn from a surface- or ground water source by a user rather than being obtained from a public supply.
Sewage: Wastewater carried off by sewer and drains.
Surface water: An open body of water, such as a stream or a lake.
Thermoelectric power water use: The amount of water used in the production of electric power generated with fossil fuel. Fossil fuels include coal, oil, and natural gas. The water used is self-supplied or is delivered by a water supplier through a distribution system.
Wastewater treatment discharges: Water that carries wastes from homes, businesses, and industries.
Withdrawal: Water removed from the ground or diverted from a surface-water source for use.
Estimated Water Use in Puerto Rico, 1995 14
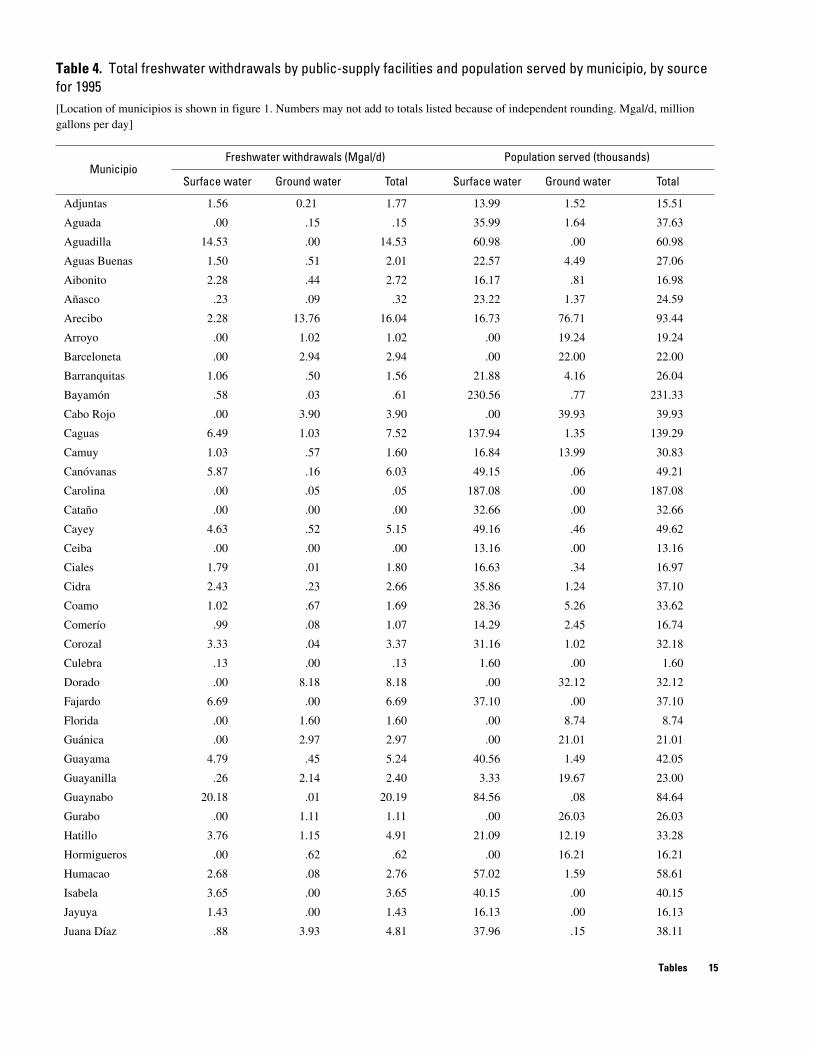
Table 4. Total freshwater withdrawals by public-supply facilities and population served by municipio, by source for 1995 [Location of municipios is shown in figure 1. Numbers may not add to totals listed because of independent rounding. Mgal/d, million gallons per day]
Municipio Freshw
Surface water
ater withdrawals (
Ground water
Mgal/d)
Total
Popu
Surface water
lation served (thousands)
Ground water Total
Adjuntas 1.56 0.21 1.77 13.99 1.52 15.51
Aguada .00 .15 .15 35.99 1.64 37.63
Aguadilla 14.53 .00 14.53 60.98 .00 60.98
Aguas Buenas 1.50 .51 2.01 22.57 4.49 27.06
Aibonito 2.28 .44 2.72 16.17 .81 16.98
Añasco .23 .09 .32 23.22 1.37 24.59
Arecibo 2.28 13.76 16.04 16.73 76.71 93.44
Arroyo .00 1.02 1.02 .00 19.24 19.24
Barceloneta .00 2.94 2.94 .00 22.00 22.00
Barranquitas 1.06 .50 1.56 21.88 4.16 26.04
Bayamón .58 .03 .61 230.56 .77 231.33
Cabo Rojo .00 3.90 3.90 .00 39.93 39.93
Caguas 6.49 1.03 7.52 137.94 1.35 139.29
Camuy 1.03 .57 1.60 16.84 13.99 30.83
Canóvanas 5.87 .16 6.03 49.15 .06 49.21
Carolina .00 .05 .05 187.08 .00 187.08
Cataño .00 .00 .00 32.66 .00 32.66
Cayey 4.63 .52 5.15 49.16 .46 49.62
Ceiba .00 .00 .00 13.16 .00 13.16
Ciales 1.79 .01 1.80 16.63 .34 16.97
Cidra 2.43 .23 2.66 35.86 1.24 37.10
Coamo 1.02 .67 1.69 28.36 5.26 33.62
Comerío .99 .08 1.07 14.29 2.45 16.74
Corozal 3.33 .04 3.37 31.16 1.02 32.18
Culebra .13 .00 .13 1.60 .00 1.60
Dorado .00 8.18 8.18 .00 32.12 32.12
Fajardo 6.69 .00 6.69 37.10 .00 37.10
Florida .00 1.60 1.60 .00 8.74 8.74
Guánica .00 2.97 2.97 .00 21.01 21.01
Guayama 4.79 .45 5.24 40.56 1.49 42.05
Guayanilla .26 2.14 2.40 3.33 19.67 23.00
Guaynabo 20.18 .01 20.19 84.56 .08 84.64
Gurabo .00 1.11 1.11 .00 26.03 26.03
Hatillo 3.76 1.15 4.91 21.09 12.19 33.28
Hormigueros .00 .62 .62 .00 16.21 16.21
Humacao 2.68 .08 2.76 57.02 1.59 58.61
Isabela 3.65 .00 3.65 40.15 .00 40.15
Jayuya 1.43 .00 1.43 16.13 .00 16.13
Juana Díaz .88 3.93 4.81 37.96 .15 38.11
Tables 15
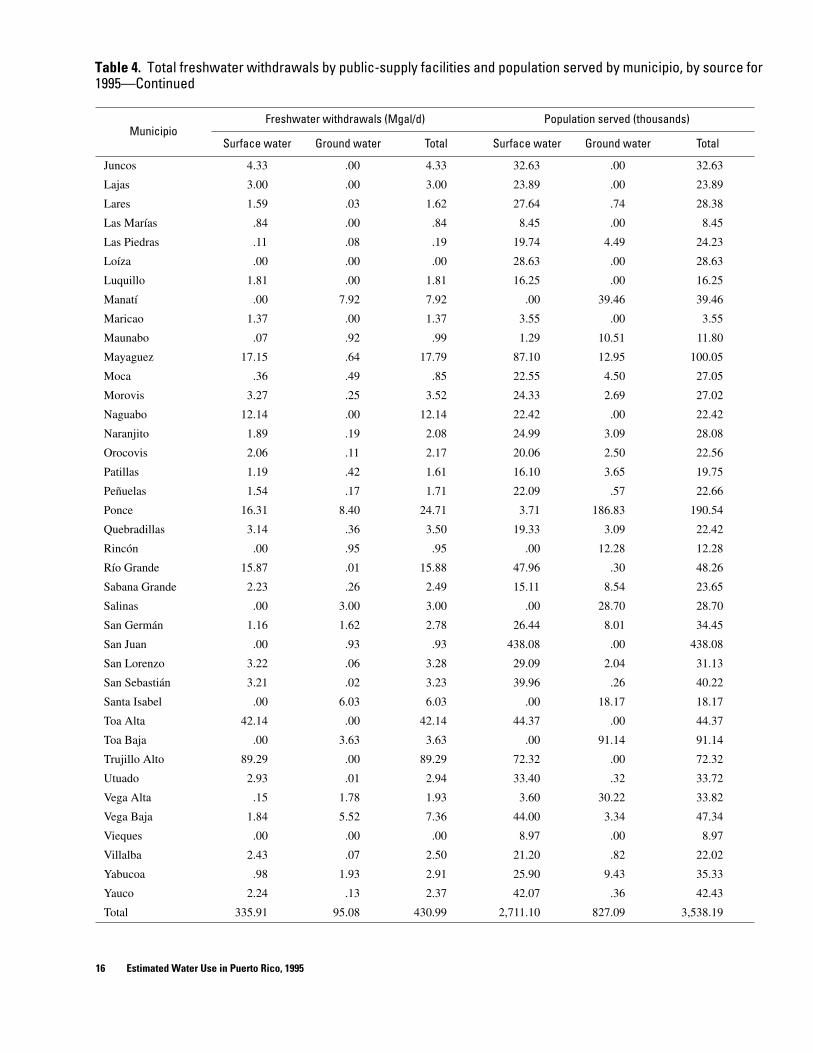
Table 4. Total freshwater withdrawals by public-supply facilities and population served by municipio, by source for 1995—Continued
Freshwater withdrawals (Mgal/d) Population served (thousands) Municipio
Surface water Ground water Total Surface water Ground water Total
Juncos 4.33 .00 4.33 32.63 .00 32.63
Lajas 3.00 .00 3.00 23.89 .00 23.89
Lares 1.59 .03 1.62 27.64 .74 28.38
Las Marías .84 .00 .84 8.45 .00 8.45
Las Piedras .11 .08 .19 19.74 4.49 24.23
Loíza .00 .00 .00 28.63 .00 28.63
Luquillo 1.81 .00 1.81 16.25 .00 16.25
Manatí .00 7.92 7.92 .00 39.46 39.46
Maricao 1.37 .00 1.37 3.55 .00 3.55
Maunabo .07 .92 .99 1.29 10.51 11.80
Mayaguez 17.15 .64 17.79 87.10 12.95 100.05
Moca .36 .49 .85 22.55 4.50 27.05
Morovis 3.27 .25 3.52 24.33 2.69 27.02
Naguabo 12.14 .00 12.14 22.42 .00 22.42
Naranjito 1.89 .19 2.08 24.99 3.09 28.08
Orocovis 2.06 .11 2.17 20.06 2.50 22.56
Patillas 1.19 .42 1.61 16.10 3.65 19.75
Peñuelas 1.54 .17 1.71 22.09 .57 22.66
Ponce 16.31 8.40 24.71 3.71 186.83 190.54
Quebradillas 3.14 .36 3.50 19.33 3.09 22.42
Rincón .00 .95 .95 .00 12.28 12.28
Río Grande 15.87 .01 15.88 47.96 .30 48.26
Sabana Grande 2.23 .26 2.49 15.11 8.54 23.65
Salinas .00 3.00 3.00 .00 28.70 28.70
San Germán 1.16 1.62 2.78 26.44 8.01 34.45
San Juan .00 .93 .93 438.08 .00 438.08
San Lorenzo 3.22 .06 3.28 29.09 2.04 31.13
San Sebastián 3.21 .02 3.23 39.96 .26 40.22
Santa Isabel .00 6.03 6.03 .00 18.17 18.17
Toa Alta 42.14 .00 42.14 44.37 .00 44.37
Toa Baja .00 3.63 3.63 .00 91.14 91.14
Trujillo Alto 89.29 .00 89.29 72.32 .00 72.32
Utuado 2.93 .01 2.94 33.40 .32 33.72
Vega Alta .15 1.78 1.93 3.60 30.22 33.82
Vega Baja 1.84 5.52 7.36 44.00 3.34 47.34
Vieques .00 .00 .00 8.97 .00 8.97
Villalba 2.43 .07 2.50 21.20 .82 22.02
Yabucoa .98 1.93 2.91 25.90 9.43 35.33
Yauco 2.24 .13 2.37 42.07 .36 42.43
Total 335.91 95.08 430.99 2,711.10 827.09 3,538.19
Estimated Water Use in Puerto Rico, 1995 16
Table 5. Public-supply deliveries by municipios and type of use for 1995 [Location of municipios is shown in figure 1. Unaccounted use: Positive values are the difference between withdrawals and deliveries in a municipio. Negative values indicate importation of public-water supply from adjacent municipios to such an extent that public-supply deliveries to a municipio exceed its public-supply withdrawals. Numbers may not add to totals listed because of independent rounding. Mgal/d, million gallons per day]
Water deliveries by type of use (Mgal/d)
Municipio Domestic Commercial Industrial Thermoelectric
power Unaccounted
uses Total
deliveries
Adjuntas 0.47 0.16 0.00 0.00 1.14 1.77
Aguada 2.42 .22 .04 .00 -2.53 .15
Aguadilla 2.71 1.53 .33 .00 9.96 14.53
Aguas Buenas .87 .14 .02 .00 .98 2.01
Aibonito 1.09 .25 .52 .00 .86 2.72
Añasco 1.69 .13 .10 .00 -1.60 .32
Arecibo 4.72 1.69 .10 .00 9.53 16.04
Arroyo .91 .18 .05 .00 -.12 1.02
Barceloneta 1.02 .36 .01 .00 1.55 2.94
Barranquitas .84 .26 .02 .00 .44 1.56
Bayamón 11.12 4.68 2.31 .00 -17.50 .61
Cabo Rojo 2.13 .52 .02 .00 1.23 3.90
Caguas 6.10 1.80 .30 .00 -.68 7.52
Camuy 1.35 .37 .02 .00 -.14 1.60
Canóvanas 2.16 .32 .36 .00 3.19 6.03
Carolina 9.59 3.86 .86 .00 -14.26 .05
Cataño 1.61 .41 .23 .00 -2.25 .00
Cayey 2.06 .36 .11 .00 2.62 5.15
Ceiba .48 .07 .01 .00 -.56 .00
Ciales .66 .23 .02 .00 .89 1.80
Cidra 1.66 .26 .15 .00 .59 2.66
Coamo 1.25 .45 .60 .00 -.61 1.69
Comerío .53 .11 .02 .00 .41 1.07
Corozal .97 .18 .01 .00 2.21 3.37
Culebra .07 .03 .00 .00 .03 .13
Dorado 1.70 .33 .33 .00 5.82 8.18
Fajardo 1.82 .72 .11 .00 4.04 6.69
Florida .41 .07 .01 .00 1.11 1.60
Guánica 1.02 .25 .01 .00 1.69 2.97
Guayama 1.77 .71 .23 .00 2.53 5.24
Guayanilla 1.15 .26 .00 .00 .99 2.40
Guaynabo 6.09 4.13 .19 1.10 8.68 20.19
Gurabo 1.15 .36 .03 .00 -.43 1.11
Hatillo 1.39 .39 .04 .00 3.09 4.91
Hormigueros .83 .11 .03 .00 -.35 .62
Humacao 2.55 1.54 .54 .00 -1.87 2.76
Isabela 1.90 .38 .03 .00 1.34 3.65
Jayuya .45 .24 .07 .00 -0.03 1.43
Tables 17
Table 5. Public-supply deliveries by municipios and type of use for 1995
Water deliveries by type of use (Mgal/d)
Municipio Domestic Commercial Industrial Thermoelectric
power Unaccounted
uses Total
deliveries
Juana Díaz 1.57 0.30 0.10 0.00 2.84 4.81
Juncos 1.70 .27 .10 .00 2.26 4.33
Lajas 1.19 .24 .01 .00 1.56 3.00
Lares 1.12 .21 .00 .00 .29 1.62
Las Marías .76 .07 .00 .00 .01 .84
Las Piedras .83 .19 .13 .00 -.96 .19
Loíza 1.77 .23 .00 .00 -2.00 .00
Luquillo .86 .33 .03 .00 .59 1.81
Manatí 2.07 1.09 .08 .00 4.68 7.92
Maricao .13 .05 .01 .00 1.18 1.37
Maunabo .46 .14 .00 .00 .39 .99
Mayaguez 4.72 2.18 2.96 .00 7.93 17.79
Moca 1.08 .18 .01 .00 -.42 .85
Morovis 1.04 .19 .01 .00 2.28 3.52
Naguabo .79 .20 .02 .00 11.13 12.14
Naranjito 1.64 .13 .00 .00 .31 2.08
Orocovis .77 .12 .01 .00 1.27 2.17
Patillas .74 .16 .02 .00 .69 1.61
Peñuelas .94 .20 .01 .00 .56 1.71
Ponce 8.66 3.02 .42 .00 12.61 24.71
Quebradillas 1.11 .24 .01 .00 2.14 3.50
Rincón .65 .15 .01 .00 .14 .95
Río Grande 1.82 .23 .03 .00 13.80 15.88
Sabana Grande 1.25 . .20 .05 .00 .99 2.49
Salinas 1.20 .22 .20 .00 1.38 3.00
San Germán 1.38 .38 .19 .00 .83 2.78
San Juan 24.21 16.88 1.01 .00 -41.17 .93
San Lorenzo .95 .13 .04 .00 2.16 3.28
San Sebastián 2.65 .83 .06 .00 -.31 3.23
Santa Isabel .75 .18 .04 .00 5.06 6.03
Toa Alta 2.93 .24 .03 .00 38.94 42.14
Toa Baja 4.82 .68 .21 .29 -2.37 3.63
Trujillo Alto 3.78 .67 .07 .00 84.77 89.29
Utuado 1.15 .29 .00 .00 1.50 2.94
Vega Alta 1.90 .39 .25 .00 -.61 1.93
Vega Baja 2.86 .56 .06 .00 3.88 7.36
Vieques .51 .14 .00 .00 -.65 .00
Villalba .71 .16 .02 .00 1.61 2.50
Yabucoa .97 .26 .03 .00 1.65 2.91
Yauco 2.04 .52 .03 .00 -.22 2.37
Total 171.19 60.91 14.09 1.39 182.71 430.99
Estimated Water Use in Puerto Rico, 1995 18
Table 6. Wastewater treatment water releases and number of facilities by municipio, 1995 [Location of municipios is shown in figure 1. Mgal/d, million gallons per day]
Municipio
Public facilities
Total public releases (Mgal/d)
Number of facilities
Municipio
Public facilities
Total public releases (Mgal/d)
Number of facilities
Adjuntas 0.51 1 Lajas 0.32 3
Aguada 3.53 1 Lares .73 1
Aguadilla .00 0 Las Marías .20 1
Aguas Buenas .32 1 Las Piedras .13 1
Aibonito .78 1 Loíza 16.86 1
Añasco .00 0 Luquillo .85 1
Arecibo 6.66 1 Manatí .00 0
Arroyo .00 0 Maricao .06 1
Barceloneta 4.85 1 Maunabo .16 1
Barranquitas .19 1 Mayaguez 10.72 1
Bayamón .00 0 Moca .00 0
Cabo Rojo .62 1 Morovis .50 2
Caguas 6.60 2 Naguabo .05 1
Camuy 1.22 1 Naranjito .20 1
Canóvanas .75 1 Orocovis .12 2
Carolina .00 0 Patillas .54 1
Cataño 23.27 1 Peñuelas .45 1
Cayey .21 1 Ponce 15.07 1
Ceiba .46 1 Quebradillas .00 0
Ciales .38 1 Rincón .00 0
Cidra 3.37 2 Río Grande .58 3
Coamo .00 0 Sabana Grande .90 1
Comerío .30 1 Salinas .00 0
Corozal .78 1 San Germán 1.41 1
Culebra .00 0 San Juan 53.85 1
Dorado 1.35 1 San Lorenzo .60 1
Fajardo 1.96 1 San Sebastián .87 2
Florida .00 0 Santa Isabel 1.69 1
Guánica .57 2 Toa Alta 1.13 2
Guayama 3.71 1 Toa Baja .00 0
Guayanilla .38 1 Trujillo Alto .08 1
Guaynabo .00 0 Utuado .59 1
Gurabo .87 1 Vega Alta .94 1
Hatillo .00 0 Vega Baja 1.84 1
Hormigueros .00 0 Vieques .33 1
Humacao 5.15 1 Villalba .00 0
Isabela 1.17 1 Yabucoa .76 1
Jayuya .44 1 Yauco 1.15 1
Juana Díaz .00 0 Total 184.75 70
Juncos .67 1
Tables 19
Table 7. Domestic self-supplied withdrawals and deliveries from public-supply systems by municipio, for 1995 [Location of municipios is shown in figure 1. Mgal/d, million gallons per day; gal/d, gallons per day; --, not applicable]
Total 216.93 5.54 6.37 11.91 3,538.19 171.19 183.10
Tables 21
--
Table 8. Self-supplied ground-water withdrawal estimates for industrial facilities by municipio, 1995 [Location of municipios is shown in figure 1. Municipios at which total withdrawals are equal to or greater than 1.0 Mgal/d. SIC, Standard Industrial Classification. Mgal/d, million gallons per day]
Municipio SIC Self- supplied ground-water withdrawals
Arecibo 28 1.16
Barceloneta 28 3.02
Manatí 28 1.49
Yabucoa 29 1.22
Total 6.89
Table 9. Mining withdrawals by muncipio, for 1995 [Location of municipios is shown in figure 1. Mgal/d, million gallons per day]
Freshwater withdrawals (Mgal/d)
Municipio Surface water
Ground water Total
Bayamón 0.00 0.02 0.02
Caguas .00 .01 .01
Guaynabo .02 .00 .02
Gurabo .00 .29 .29
Humacao .00 .03 .03
Isabela .00 .19 .19
Juana Díaz .03 .00 .03
Manatí .00 .67 .67
Peñuelas .60 .00 .60
Ponce .00 .06 .06
Salinas .00 .22 .22
San Germán .04 .25 .29
San Lorenzo .26 .00 .26
San Sebastián .08 .19 .27
Toa Alta .02 .00 .02
Toa Baja .30 .18 .48
Vega Alta .00 .03 .03
Vega Baja .00 .68 .68
Total 1.35 2.82 4.17
Estimated Water Use in Puerto Rico, 1995 22
Table 10. Self-supplied withdrawals, deliveries from public supply, and power generated by thermoelectric power plants, by muncipio for 1995 [Location of municipios is shown in figure 1. Mgal/d, million gallons per day; gWh, gigawatt-hours]
Self-supplied withdrawals (Mgal/d) Total Deliveries from withdrawals Power
Municipio Saline Fresh public supply and generated surface ground Total (Mgal/d) deliveries (gWh) water water (Mgal/d)
Total 2,262.31 2.16 2,264.47 2.20 2,266.67 15,762.47
Table 11. Water use and power generated by hydroelectric power plants by municipio, 1995 [Location of municipios is shown in figure 1. Mgal/d, million gallons per day; gWh, gigawatt- hours]
Municipio Water use (Mgal/d)
Power generated
(gWh)
Arecibo 239.70 26.26
Naguabo 5.65 6.39
Orocovis .87 1.34
Peñuelas .54 .93
Utuado 23.05 13.73
Villalba 9.54 14.16
Yauco 69.56 38.16
Total 348.91 100.97
Tables 23
-- -- --
--
--
-- -- -- -- -- --
-- --
-- -- --
-- -- -- -- -- --
-- -- --
-- --
--
-- --
-- -- --
--
--
Table 12. Total freshwater withdrawals and number of animals served for each stock subcategory by municipio, for 1995 [Location of municipios is shown in figure 1. Mgal/d, million gallons per day; --, no population reported]
Total 1.76 4.45 6.21 101,550 131,058 11,642,319 143,026 24,532 12,042,485
Tables 25
--
--
--
--
--
--
--
--
--
--
Table 13. Total freshwater withdrawals and number of animals served for each animal specialties subcategory by municipio, for 1995 [Location of municipios is shown in figure 1. Mgal/d, million gallons per day; --, no population reported]
Surface water Ground water Total Horses Rabbits Total
Juncos 0.00 0.00 0.00 123 754 877
Lajas .00 .00 .00 232 1,515 1,747
Lares .00 .00 .00 42 217 259
Las Marías .00 .00 .00 12 12
Las Piedras .00 .00 .00 95 1,134 1,229
Loíza .00 .00 .00 220 191 411
Luquillo .00 .00 .00 54 181 235
Manatí .00 .00 .00 32 32
Maricao .00 .00 .00 0 140 140
Maunabo .00 .00 .00 6 6
Mayaguez .00 .00 .00 51 1,806 1,857
Moca .00 .00 .00 15 2,430 2,445
Morovis .00 .00 .00 230 0 230
Naguabo .00 .00 .00 72 540 612
Naranjito .00 .00 .00 17 827 844
Orocovis .00 .00 .00 26 74 100
Patillas .00 .00 .00 92 39 131
Peñuelas .00 .00 .00 99 281 380
Ponce .00 .00 .00 51 0 51
Quebradillas .00 .00 .00 230 0 230
Rincón .00 .00 .00 18 478 496
Río Grande .00 .00 .00 40 0 40
Sabana Grande .00 .00 .00 21 21
Salinas .00 .00 .00 106 106
San Germán .00 .00 .00 45 45
San Juan .00 .00 .00 6 0 6
San Lorenzo .00 .00 .00 206 0 206
San Sebastián .00 .00 .00 52 530 582
Santa Isabel .00 .00 .00 270 0 270
Toa Alta .00 .00 .00 205 205
Toa Baja .00 .00 .00 35 0 35
Trujillo Alto .00 .00 .00 24 704 728
Utuado .00 .00 .00 172 2,593 2,765
Vega Alta .00 .00 .00
Vega Baja .00 .00 .00 116 510 626
Vieques .00 .00 .00 269 825 1,094
Villalba .00 .00 .00 30 210 240
Yabucoa .00 .00 .00 46 46
Yauco .00 .00 .00 64 182 246
Total .01 .04 .05 7,469 53,672 61,141
Tables 27
Table 14. Freshwater withdrawals for irrigation use and irrigated land by micro-irrigation and flood by municipio, for 1995 [Location of municipios is shown in figure 1. Mgal/d, million gallons per day]
Municipio Freshw
Surface water
ater withdrawals
Ground water
(Mgal/d)
Total
Irrigated lan
Micro-irrigation
d by type (thousa
Flood
nd acres)
Total
Guánica 0.00 1.76 1.76 0.40 0.61 1.01
Guayama 5.58 3.60 9.18 2.07 .00 2.07
Guayanilla .00 3.66 3.66 2.10 .00 2.10
Juana Díaz .00 3.31 3.31 1.52 .38 1.90
Patillas 15.32 .00 15.32 .00 1.06 1.06
Ponce .00 6.46 6.46 3.71 .00 3.71
Quebradillas 23.51 .00 23.51 .02 .08 .10
Salinas .00 1.43 1.43 .68 .14 .82
Santa Isabel .00 7.96 7.96 3.88 .68 4.56
Villalba 16.25 .00 16.25 .00 3.99 3.99
Yauco 13.98 .00 13.98 3.07 6.23 9.30
Total 74.64 28.18 102.82 17.45 13.17 30.62
Table 15. Water evaporation from reservoirs in Puerto Rico and their surface area, by municipio, 1995 [Location of municipios is shown in figure 1]
Municipio Reservoir Reservoir area (thousand acres)
Evaporation (thousand acre-feet)
Adjuntas Lago Garzas 0.10 0.31
Lago Guayo .28 .83
Arecibo Lago Dos Bocas .63 1.78
Cidra Lago Cidra .27 1.28
Comerío Lago Comerío II .06 .17
Guayama Lago Carite .33 .96
Patillas Lago Patillas .31 1.18
Ponce Lago Cerillos .61 2.84
Quebradillas Lago Guajataca 1.00 2.47
Toa Alta Lago La Plata .56 1.57
Trujillo Alto Lago Loíza .60 2.26
Utuado Lago Caonillas .70 1.97
Villalba Lago Toa Vaca .84 3.86
Lago Guayabal .33 1.51
Yauco Lago Luchetti .27 .92
Total 6.89 23.91
Estimated Water Use in Puerto Rico, 1995 28
District Chief Caribbean District U.S. Geological SurveyWater Resources DivisionGSA Center, Suite 400-15651 Federal DriveGuaynabo, Puerto Rico 00965