Estimating Polymer Properties and Practicing Statistical Tools in Undergraduate Level through Simple Experiments
Marco C. P. Soaresa,b,*, Thiago D. Cabrala, Gabriel Perlia, Jéssica M. Bressaninb, Julio R. Bartolib aLaboratory of Photonic Materials and Devices, School of Mechanical Engineering, University of Campinas, Campinas, SP, Brazil 13083-860 bDepartment of Materials Engineering and Bioprocess, School of Chemical Engineering, University of Campinas, Campinas, SP, Brazil 13083-852 [email protected]
This paper presents a practical laboratory approach on polymer melt flow rate and stress-strain testing to teach undergraduate students how to measure important properties of molten and solid plastics. They may learn how to obtain parameters that are important for: quality control; processing; engineering design on polymer and petrochemical industries; and even in materials selection for engineering applications. Starting from a database obtained from this traditional practice, statistical tools for data analysis were applied. Four different grades of commercial polypropylene were studied, and the 95 % confidence intervals of different parameters were compared with the suppliers’ catalogue data. This pedagogical approach aims to add a statistical point of view to laboratory experiments and to complement the learning.
1. Introduction
Polypropylene (PP) is one of the most used polymers in plastic industry because of its good comprehensive mechanical properties, easy processing and low cost. It is a thermoplastic material with properties dependent on: the chosen synthesis process; use of catalysts to form long macromolecular chains of distinct sizes and molar masses distributions; and the specific configuration of the monomer unit in the chains, which results in PP isomers (isotactic, syndiotactic, atactic). The regular and repeated symmetrical arrangements of methyl groups along the chain can form a crystalline morphology in the solid state PP. The polymer’s degree of crystallinity imparts its physical properties, and, again, it depends on the processing conditions used to obtain the polymer. The cooling temperature and rate, as well as the presence of nucleating agents are often used to control the crystallinity (Young and Lovell, 1991). Consequently, four basic types of PP are commonly found: homopolymers, the most common; PP block copolymers, obtained by firstly polymerizing the propylene and then copolymerizing it with ethylene; PP random copolymers, made in a single reactor by copolymerizing propylene with small amounts of ethylene (1 to 8 % in mass), which is randomly distributed along the PP chain; and PP random block copolymers (Costa et al., 2005). Due to such a variety of properties, there are also several different applications for this material: in fibres; spun bonded nonwovens; tapes; films and sheets; boards; tubes; blow moulding; and in all sorts of injection moulded parts. The selection of the type of PP depends on its specific use. For instance, the homopolymer, more crystallizable, is largely used when stiffness and strength are required, whereas the copolymerized ethylene is added to improve impact resistance, flexibility, and transparency (Gächter et al., 1993). Therefore, before selecting a particular type or grade of polymer to a practical application, it is important to know how to characterize its basic properties and how to compare the assessed data to datasheet values. Many of the mechanical and flow properties, such as the stress-strain behaviour (which allows to evaluate the ductility and tensile modulus), and the melt flow rate (MFR), can be obtained or estimated from simple tests (Rudin, 1982). However, it is important to mention that the flow rate obtained with the extrusion plastometer is not a fundamental rheological property of the polymer melt, but an empirically defined parameter critically
1375
influenced by the physical properties and molecular structure of the polymer and by the specific conditions of measurement. The rheology of polymer melts depends on a number of variables, such as the shear viscosity over a wide range of shear rates, measured with special capillary rheometers under test conditions representative of industrial processing. MFR measurements are obtained at low shear rates, so their values may differ substantially from those verified in Injection Moulding and Extrusion conditions. Nevertheless, MFR is a simple and effective method to correlate flow rate and the weight-average molar mass of polymers (which is inversely proportional to MFR). Besides that, the typical MFR instruments are also compact and cost-effective compared to capillary rheometers (Manrich, 2005). Herein, simple experimental practices on characterization of polymeric materials are presented: melt flow rate and tensile stress-strain testing performed in a laboratory course ministered to Chemical Engineering undergraduate students at the University of Campinas (SP, Brazil). Before this course, the students had completed an introductory course on polymers. The purpose of the experiments is to teach them how to analyse the physical peculiarities and applications of different grades of an outstanding commercial polymer, as PP. The students were divided into groups of 5 or 6 individuals, receiving random samples of two distinct PP grades. Stress-strain and MFR tests were performed and the results were compared to the supplier’s datasheets to illustrate common procedures of quality assurance. Samples from the database gathering the diverse results collected were statistically treated as a case of study. This study aims to add information beyond the basic one learned from the traditional laboratory experiments. It is possible to corroborate the intended conclusions about PP properties experiments with the advanced statistical techniques. The Analysis of Variance (ANOVA) was used to identify the contribution of the four PP grades (factors) to the total variation observed in the variables. The Tukey's HSD (honestly significant difference) test was employed to verify statistically significant differences among the results. This work was conducted with educational purposes and its contributions fall on the increasing of students’ perception around the benefit and utility of statistics courses for their engineer’s careers. As a result, the implementation of a horizontal integration teaching method is suggested. It combines the exhibited practice in science of the materials with statistics subjects, being a cross-disciplinary approach.
2. Materials, methods, and results
Most of the polymeric materials are highly sensitive to their elongation state and to environmental characteristics, including temperature, humidity, oxygen concentration, and contact with organic solvents. The flow behaviour of the molten polymer and the response of the solid material to external mechanical stresses are decisive to the selection of the processing strategy and of its possible engineering applications (Ashby, 1995; Callister Jr. and Rethwisch, 2013). Accordingly, four different grades of PP (donated from a local supplier) were studied regarding their specific fluidities and applications (grade identifications are fictitious), as follow. HoHF grade is a high MFR homopolymer with narrow weight-average molar mass (Mw) distribution, for applications in fibre extrusion, filaments with high toughness, and staple fibres. HoLF grade is a homopolymer with high Mw, low fluidity, for applications in bio-oriented films for flexible packaging, metallized films, and high-speed processing. HoMF grade is a medium MFR homopolymer for applications in household appliances, sealed or flip-top closures, and monofilament extrusion injection moulding. CoMF grade is a medium MFR random copolymer, containing 3 % of ethylene in mass, for injection applications including containers for freezer use, transparent containers, and packing. They were all obtained through polymerization catalysed by ZN111-4 (commercial catalyst of titanium chloride on MgCl2), but under different concentrations of H2. The physical properties of the four PP grades given in the supplier’s Technical Data Sheet (TDS) were considered as reference values for comparison with students’ results. Samples were used as received: in pellets form for MFR; and as dumbbell-shaped specimens (injection moulded) for tensile tests. The samples had their MFR evaluated with a MI-3 plastometer (DSM Instrumentação Científica). This test quantifies the total polymeric mass (in grams) that flows through the equipment’s capillary die (internal diameter of 2.092 mm; capillary length L; diameter D; and ratio L/D = 4:1) over 10 min, when the sample is submitted to a fixed condition of temperature and pressure dependent on the polymer type (e.g.: PP standard conditions are: 230 ºC and load of 2.16 kg). The relation between the total volume of polymer flowing during the experimental time interval (i.e., the product between the capillary area and the piston velocity u) and the correspondent collected mass was used for the estimation of the molten polymer density. All experiments were performed according to ASTM D1238 standard (2002). The MFR is an easily obtained measurement and so it is largely used as a quality control parameter in petrochemical and plastic industries. In many cases, it is the only flow parameter given by suppliers, but it is only an approximate indication of the viscosity under given conditions of temperature. Indeed, low MFRs are indicative of high viscosities and high weight-average molar masses (Mw), the conditions that are preferable for the extrusion, whereas high MFRs indicate low viscosities and Mw, what is preferable for the injection moulding. On the other hand, the shear rates applied to the MFR tests are very low due to reduced L/D ratios and to the low and approximately constant pressures applied.
1376
Under these conditions, the viscosities μ of the molten polymers are generally in the Newtonian behaviour region of the rheological curves, and then can be approximated by Eq(1) (Hagen-Poiseuille equation). In this equation, τ is the stress applied: (mass of the load) x (gravity acceleration)/(area of the capillary); u is the velocity of the MFR piston: (length of the capillary)/(time required for the piston to cross the capillary); L and D are the capillary length and diameter, respectively; and μ is the dynamic viscosity (Manrich, 2005). PP injection moulded specimens (conditioning at 23 °C and 50 % relative humidity) were submitted to the stress-strain tests according to the ASTM D638 standard (2000), using a DL-2000 dynamometer (EMIC-Instron), maximum testing speed of 500 mm/min, and load cell maximum capacity of 20 kN. The test specimens used (dumbbell-shaped) were in conformity with Type I dimensions of ASTM D638: 3.3 mm thickness; 13 mm width; and 57 mm length for the narrow section. The initial distance between grips was 115 mm. Polymers may show three types of behaviour in this test: brittle behaviour, with fracture while deforming elastically; elastic deformation followed by yielding and ductile behaviour (i.e., plastic deformation); and elastomers (not the case for PP) (Ashby, 1995; Manrich, 2005). The tensile results could reveal different intrinsic properties of the material, such as weight-average molar mass (Mw) and the width of the Mw distribution, the polymer morphology, and the presence of additives or fillers (Callister Jr. and Rethwisch, 2013). It is worth noticing that both the above-mentioned environmental factors and the applied dynamometer velocity have great effect on the polymer tests data. Increasing the speed of testing leads to a more brittle (or less ductile) behaviour, similar to what is observed when decreasing the temperature. Then, speeds ranging from 50 to 100 mm/s were applied in accordance to ASTM D638 (2000). This range presented the lowest velocities capable of causing the specimen to fracture within 0.5 to 5 min testing time. An idealized “stress (σ) –strain (ɛ)” curve for a ductile polymer specimen is shown in Figure 1. The nominal stress σ is given by the relation between the applied force F and the cross-section area of the specimen A (σ = F/A). In its turn, ɛ is defined (in %) by Eq(2), where Lo is the initial length of the sample and ∆L is the total variation of length (Young and Lovell, 1991; Callister Jr. and Rethwisch, 2013). The initial linear portion of the curve in Figure 1 represents the elastic deformation, with slope α to the strain axis. The modulus of elasticity E, also termed Young tensile modulus, should be measured at the very beginning of the elastic region, being the angular coefficient of the straight line Eq(3). The stress-strain curve may present a first maximum point, the yield point, where there is plastic (irreversible) deformation of the material. The yield stress (σY) and the correspondent yield strain (ɛY) are obtained from the coordinates of the yield point. The tensile stress at break (σB) and the strain at break (ɛB) are determined at the end of the test (Callister Jr. and Rethwisch, 2013). τ = 128 × (μ. L. u) D²⁄ (1) ɛ = (ΔL) L⁄ × (100%) (2) E = dσ dε⁄ = tan (α) (3)
It is important to reinforce the educational aspect of this experiment, intended to teach how to estimate the engineering materials’ properties. Since the dynamometer used for the experiments was not equipped with an accurate strain gauge for assessing the specimen deformation on the beginning of elastic region, the students obtained the tensile modulus by plotting the linear portion of the stress–strain curve. Besides, “true” deformation was not measured, because it is not a common procedure to instantly evaluate the reduction of the cross section on test, e.g., by using a camera. Thus, specimen dimensions were obtained before and after each experiment. In the present work, aiming to reinforce the applicability of statistical tools, the results collected by different groups (13 groups testing HoHF and HoLF; and 8 groups testing HoMF and CoMF) were processed with the software Minitab 17 (Minitab Inc). For all the four polymer grades, the 95 % confidence intervals (CI) of each one of the obtained parameters (density of molten polymer, viscosity of the molten polymer, MFR, E, ɛY, σY, ɛB and σB) and the statistical significance among their differences were calculated using the ANOVA procedure and the Tukey–Kramer method (Montgomery and Runge, 2003). The data were also compared to the information provided by the supplier’s Technical Data Sheets. The densities of the molten PP grades were calculated, and the means and 95 % CIs (Figure 2a) were obtained from the students groups results. There is no statistical difference (95 % of confidence) among the melt densities within the uncertainties of the used methodology (ASTM D1238). Besides, it could be clearly observed by the students that the polymer melting is accompanied by an increase in specimen volume, what is consequence of the loss of the ordered phase (crystalline). Then, the opaque solid PP is changed to a transparent melt; that is, a complete amorphous state. It was found a typical melt density around 0.73 g/cm³ for the PP grades, whereas the density of the solid PP is between 0.902 and 0.905 g/cm³, as reported in the supplier TDS. The MFR results of the four grades of PP (Figure 2b) showed the expected behaviour according to the supplier specifications: HoHF grade presents the highest MFR (mean and 95 % CI: 16.4 ± 0.6 g/10
1377
min), followed by the HoMF (9.5 ± 0.6 g/10 min) and the CoMF (9.8 ± 0.7 g/10 min), with no statistical difference observed between these last two. Finally, the HoLF showed the lowest MFR (3.6 ± 0,7 g/10 min). The Student’s t-test (95 % of confidence) was used in this work to verify if the MFR mean of each PP samples was not different from the specified reference value. It was found that only the MFR experimental value of HoHF grade was statistically slightly inferior than the reference. The HoHF is a high flow rate grade, so MFR measurements are not easy to perform because of the very fast mass flow. Further experimental errors are also more likely to happen for learners. The HoLF grade presented the highest viscosity among the molten polymers (Figure 2c) and the HoHF the lowest one, as it was expected from their high and low molar mass (Mw) provided in the TDS. The ANOVA at 95 % of confidence indicates that there are no differences among the melt viscosities of high and medium flow PP grades: HoHF, HoMF and CoMF, either being homopolymer or copolymer.
Figure 1: Typical stress-strain curve obtained for a ductile thermoplastic polymer.
The Tensile Moduli (E) of the four PP grades (Figure 2d) were analysed using ANOVA Single Factor at 95 % of confidence. It was found that only the Tensile Modulus of the high flow homopolymer HoHF (mean and 95 % CI = 1.09 ± 0.17 GPa) was statistically different (p value = 0.006) from the medium flow copolymer CoMF, 0.80 ± 0.15 GPa; which in turn, was also almost different (p value = 0.108) from the medium flow homopolymer HoMF, 1.02 ± 0.18 GPa. So, the students were able to assess the effect of random ethylene units on the polypropylene physical properties, by comparing the CoMF copolymer with the others PP homopolymer grades. In fact, copolymerization is normally used to modify the properties of polymers to meet specific needs, for instance: how to increase flexibility of PP, or to reduce its crystallinity, which would make it less opaque (Young and Lovell, 1991). Yet, the reference elastic modulus in the supplier's TDS is reported in bending mode, so a straight comparison with experimental tensile values is not possible. Nevertheless, the students were able to observe that the measured tensile moduli showed the same trend of the flexural moduli data for all the PP grades, in order: HoHF > HoMF > HoLF > CoMF. The results, depicted for the four PP grades in Figures 2e to 2g, were analysed using ANOVA Single Factor at 95 % of confidence. The mean value of the Strain ɛY at Yield Point (Figure 2e) for the copolymer (CoMF), 12.1 ± 2.1 %, was statistically different from the mean values for the high (HoHF) and medium (HoMF) flows homopolymers, 8.1 ± 0.8 % and 8.3 ± 1.2 %, respectively. It should be noted that the speed of testing (100 mm/min) for the very ductile copolymer was twice the value used for the homopolymers. The higher velocity was used to obtain the fracture of the specimen within the testing time of the ASTM D638 standard. If the strain-rate is increased and the temperature is held constant, the yield stress increases (time and temperature superposition principle). The PP copolymer could display some rubbery characteristics at given testing conditions, and it can be induced to show glassy behaviour by either reducing the temperature or increasing the testing speed (Young and Lovell, 1991). Therefore, the time and temperature dependence of the viscoelastic properties of polymers may be correlated. The more flexible behaviour exhibited by the PP copolymer (required for transparent freezer containers) was also verified by the students. The experimental data of ɛY obtained for the four PP grades follow the tendency of the supplier’s specifications. The results of Stress at Yield Point σY (Figure 2f) did not show statistical differences (ANOVA Single Factor) among the four PP grades, but the “p-value” (0.06) was close to the significance level (0.05) between the homopolymer grade HoMF and the copolymer CoMF. On the other hand, the Student’s t-test (95 % of confidence) showed that σY of the grade HoHF (31 ± 1 MPa) was significantly lower than the supplier specification (36 MPa); whereas no statistical differences were found for the other grades.
1378
It is interesting to notice that the HoHF grade also showed non-conformity for the MFR value. However, it is not possible to separate the total uncertainty into the contributions of the measurement system and the one related to the experimental errors. Then, it was inconclusive if the differences between the experimental evaluation and the supplier reference values are related to the quality of the supplied polymer or to errors in the experiment execution. Nevertheless, students may gain insights into a likely material non-conformity when performing quality control tests. The results of Strain and Stress at the Break (Figures 2g and 2h) of the HoHF grade (ɛB = 155 ± 41 % and σB = 8.4 ± 2 MPa) were significantly different from the others three PP grades (ANOVA, 95 % of confidence). Indeed, high flow homopolymer PP is very suitable for fibres and filaments extrusion, which need high toughness (energy of deformation to fracture, measured from the area under stress-strain curve).
Figure 2: Mean values and 95 % CIs obtained for each PP grade: (a) density of molten polymers; (b) MFR; (c) viscosity of molten polymers; (d) modulus of elasticity E; (e) yield strain; (f) yield stress; (g) strain at break; and (h) tensile stress at break (reference values from supplier’s TDS).
Figure 3: Typical Force x Strain curves obtained from the testing machine for the PP grades: HoMF, HoLF, CoMF, HoHF. Inset a: initial portion of the curves (elongation < 30 mm). Inset b: PP fractured specimens, HoMF (left) and HoHF (right), submitted to the tensile tests showing necking and crazing phenomenon.
1379
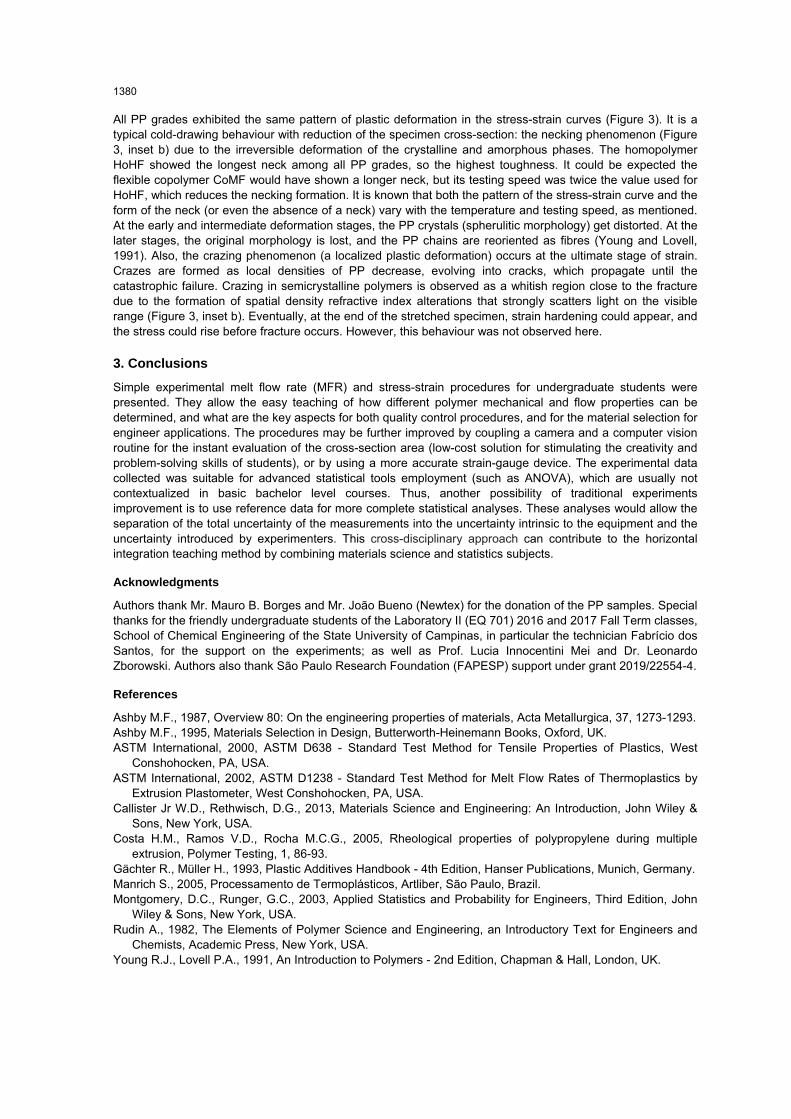
All PP grades exhibited the same pattern of plastic deformation in the stress-strain curves (Figure 3). It is a typical cold-drawing behaviour with reduction of the specimen cross-section: the necking phenomenon (Figure 3, inset b) due to the irreversible deformation of the crystalline and amorphous phases. The homopolymer HoHF showed the longest neck among all PP grades, so the highest toughness. It could be expected the flexible copolymer CoMF would have shown a longer neck, but its testing speed was twice the value used for HoHF, which reduces the necking formation. It is known that both the pattern of the stress-strain curve and the form of the neck (or even the absence of a neck) vary with the temperature and testing speed, as mentioned. At the early and intermediate deformation stages, the PP crystals (spherulitic morphology) get distorted. At the later stages, the original morphology is lost, and the PP chains are reoriented as fibres (Young and Lovell, 1991). Also, the crazing phenomenon (a localized plastic deformation) occurs at the ultimate stage of strain. Crazes are formed as local densities of PP decrease, evolving into cracks, which propagate until the catastrophic failure. Crazing in semicrystalline polymers is observed as a whitish region close to the fracture due to the formation of spatial density refractive index alterations that strongly scatters light on the visible range (Figure 3, inset b). Eventually, at the end of the stretched specimen, strain hardening could appear, and the stress could rise before fracture occurs. However, this behaviour was not observed here.
3. Conclusions
Simple experimental melt flow rate (MFR) and stress-strain procedures for undergraduate students were presented. They allow the easy teaching of how different polymer mechanical and flow properties can be determined, and what are the key aspects for both quality control procedures, and for the material selection for engineer applications. The procedures may be further improved by coupling a camera and a computer vision routine for the instant evaluation of the cross-section area (low-cost solution for stimulating the creativity and problem-solving skills of students), or by using a more accurate strain-gauge device. The experimental data collected was suitable for advanced statistical tools employment (such as ANOVA), which are usually not contextualized in basic bachelor level courses. Thus, another possibility of traditional experiments improvement is to use reference data for more complete statistical analyses. These analyses would allow the separation of the total uncertainty of the measurements into the uncertainty intrinsic to the equipment and the uncertainty introduced by experimenters. This cross-disciplinary approach can contribute to the horizontal integration teaching method by combining materials science and statistics subjects.
Acknowledgments
Authors thank Mr. Mauro B. Borges and Mr. João Bueno (Newtex) for the donation of the PP samples. Special thanks for the friendly undergraduate students of the Laboratory II (EQ 701) 2016 and 2017 Fall Term classes, School of Chemical Engineering of the State University of Campinas, in particular the technician Fabrício dos Santos, for the support on the experiments; as well as Prof. Lucia Innocentini Mei and Dr. Leonardo Zborowski. Authors also thank São Paulo Research Foundation (FAPESP) support under grant 2019/22554-4.
References
Ashby M.F., 1987, Overview 80: On the engineering properties of materials, Acta Metallurgica, 37, 1273-1293. Ashby M.F., 1995, Materials Selection in Design, Butterworth-Heinemann Books, Oxford, UK. ASTM International, 2000, ASTM D638 - Standard Test Method for Tensile Properties of Plastics, West
Conshohocken, PA, USA. ASTM International, 2002, ASTM D1238 - Standard Test Method for Melt Flow Rates of Thermoplastics by
Extrusion Plastometer, West Conshohocken, PA, USA. Callister Jr W.D., Rethwisch, D.G., 2013, Materials Science and Engineering: An Introduction, John Wiley &
Sons, New York, USA. Costa H.M., Ramos V.D., Rocha M.C.G., 2005, Rheological properties of polypropylene during multiple
extrusion, Polymer Testing, 1, 86-93. Gächter R., Müller H., 1993, Plastic Additives Handbook - 4th Edition, Hanser Publications, Munich, Germany. Manrich S., 2005, Processamento de Termoplásticos, Artliber, São Paulo, Brazil. Montgomery, D.C., Runger, G.C., 2003, Applied Statistics and Probability for Engineers, Third Edition, John
Wiley & Sons, New York, USA. Rudin A., 1982, The Elements of Polymer Science and Engineering, an Introductory Text for Engineers and
Chemists, Academic Press, New York, USA. Young R.J., Lovell P.A., 1991, An Introduction to Polymers - 2nd Edition, Chapman & Hall, London, UK.