Estimating the Worldwide Volume of Counterfeit U.S. Currency: Data and Extrapolation Ruth Judson Richard Porter [email protected][email protected]Division of Monetary Affairs Board of Governors of the Federal Reserve System Washington, DC 20551 September 2003 Abstract The incidence of currency counterfeiting and the possible total stock of counterfeits in circulation are popular topics of speculation and discussion in the press and are of substantial practical interest to the U.S. Treasury and the U.S. Secret Service. This paper assembles data from Federal Reserve and U.S. Secret Service sources and presents a range of estimates for the number of counterfeits in circulation. In addition, the paper presents figures on counterfeit passing activity by denomination, location, and method of production. The paper has two main conclusions: first, the stock of counterfeits in the world as a whole is likely on the order of 1 or fewer per 10,000 in both piece and value terms; second, losses to the U.S. public from the most commonly used note, the $20, are relatively small, and are miniscule when only counterfeit notes of reasonable quality are considered. JEL Classifications: E49, C10
Transcript
Estimating the Worldwide Volume of Counterfeit U.S. Currency: Data and Extrapolation
Board of Governors of the Federal Reserve System Washington, DC 20551
September 2003
Abstract
The incidence of currency counterfeiting and the possible total stock of counterfeits in circulation are popular topics of speculation and discussion in the press and are of substantial practical interest to the U.S. Treasury and the U.S. Secret Service. This paper assembles data from Federal Reserve and U.S. Secret Service sources and presents a range of estimates for the number of counterfeits in circulation. In addition, the paper presents figures on counterfeit passing activity by denomination, location, and method of production. The paper has two main conclusions: first, the stock of counterfeits in the world as a whole is likely on the order of 1 or fewer per 10,000 in both piece and value terms; second, losses to the U.S. public from the most commonly used note, the $20, are relatively small, and are miniscule when only counterfeit notes of reasonable quality are considered.
In a series of earlier papers and reports, we estimated that the majority of US currency is
in circulation outside the United States and that the share abroad has been generally increasing
over the past few decades.2 Numerous news reports in the mid-1990s suggested that vast
quantities of counterfeit dollars might be circulating overseas as well; these reports contrasted
sharply with information from official sources indicating that counterfeiting is relatively rare.3
In this paper, we attempt to place an upper bound on the quantity of counterfeit in circulation
1 The authors thank colleagues in the U.S. Secret Service Counterfeit Division, the Cash Function of the Federal Reserve Bank of New York, and the Division of Reserve Bank Operations and Payment Systems for assistance in compiling and obtaining data and for valuable discussions and comments. Members of the Divisions of Monetary Affairs and International Finance also contributed helpful comments. The views presented are solely those of the authors and do not necessarily represent those of the Federal Reserve Board or its staff.
2 Judson and Porter (2001), Porter (1993), Porter and Judson (1996), U.S. Treasury (2000, 2003), Porter and Weinbach (1999). Portions of the material here, which were written by the authors, appear in U.S. Treasury (2000, 2003).
3 The reports of counterfeiting led to a congressional hearing on counterfeiting issues in February 1996, which resulted in a legislation requiring overseas audits of U.S. currency. (See “Counterfeit U.S. Currency Abroad: Observations on Counterfeiting and U.S. Deterrence Efforts," Statement of JayEtta Z. Hecker before the Subcommittee on General Oversight and Investigations, Committee on Banking and Financial Services, House of Representatives, February 27, 1996. In testimony leading up to this legislation, the GAO argued that the evidence about the true dimensions of the counterfeiting problem facing the United States overseas was mixed. In particular, the GAO could not verify the claims of the Treasury that the problem was economically insignificant nor those of Secret Service about the actual extent of the counterfeiting. In part because of these concerns, the Congress passed the Anti-Terrorism and Effective Death Penalty Act of 1996, which obligated the Secretary of the Treasury, in consultation with the interagency Advanced Counterfeit Deterrence group, see http://www.treasury.gov/offices/domestic-finance/acd/about.html, to make several reports to the Congress on the use and counterfeiting of U.S. currency abroad, including U.S. Treasury (2000, 2003).
1
based on samples of counterfeit data collected by the Secret Service and Federal Reserve
together with our understanding of circulation patterns for genuine and counterfeit currency.4
This paper differs from previous work in that the magnitude of the counterfeiting problem is
examined for all denominations now being issued rather than just for $100s, as in our earlier
work.5
We have very good sampling data from two sources that can be considered independent
in various dimensions. In order to develop appropriate confidence bounds for extrapolation, we
compare the data from these two sources. Both sources suggest that the incidence of counterfeits
in the population is quite small, in the neighborhood of one note in 10,000 for the denominations
now being issued. We are able to estimate the degree to which the currency received by the
Federal Reserve System is likely to represent the total population of currency outstanding.
We conclude that it is unlikely that pockets containing large numbers of counterfeits can
exist for very long outside the banking system, and that the total number of counterfeits
circulating is at most a couple of times what the sampling data indicate. In particular, we find
that an upper bound on the stock of counterfeit currency in circulation, as a share of genuine,
4 The Treasury and Federal Reserve work together on currency design. Currency is produced by the Bureau of Engraving and Printing, a branch of the Treasury. The Federal Reserve distributes currency. The Secret Service, formerly a branch of the Treasury but as of 2003 a branch of the Department of Homeland Security, is charged with the responsibility of detecting and arresting any person committing any offense against the laws of the United States relating to currency. Since 1996, the Federal Reserve and Treasury have been legally required to provide estimates of genuine and counterfeit currency circulating outside the United States.
5 Data coverage for the $2 denomination is not as complete as it is for the other denominations, and so some of the analysis is not possible. However, the volume of $2 notes in circulation is tiny, about 0.2 percent of the value of currency held outside banks.
2
would still be less than 3 in 10,000. In addition, we present evidence that, for the denominations
most commonly handled by U.S. consumers, the incidence of counterfeits that cannot be
detected with minimal authentication effort is much smaller, on the order of less than one in
100,000.
The paper proceeds as follows. The next section provides a brief overview of dollar
usage outside the United States and counterfeiting within and outside the United States. Section
3 reviews the data sources that we use. The fourth section presents our estimates of the likely
total value of counterfeit dollars in circulation. The fifth section presents estimates of how
representative the notes that pass through the banking system are. The sixth section presents a
model of currency circulation that demonstrates that it is quite unlikely that a large pool of
counterfeits can circulate undetected. The seventh section concludes.
2
Background
Out of the approximately $630 billion in U.S. dollars held outside banks at the end of
2002, the Secret Service reported that about $40 million in counterfeit currency was passed on
the public6 While the loss associated with a counterfeit to the individual who mistakenly accepts
it can be significant, the aggregate loss of $40 million in 2002 amounts to about 15 cents per
U.S. resident, a minor amount. Losses from counterfeiting have also been very small relative to
the cost of check fraud and other forms of fraudulent transactions. For example, in 2002, the
6The Secret Service reported that additional quantities were "seized," or confiscated before they entered circulation. In this paper we focus on the figures for "passed" counterfeits. While seized notes posed some threat prior to the seizure, passed notes clearly caused losses to the banknote-using public. Moreover, the fact that they were passed at least once suggests that
3
cost of check fraud to commercial banks was estimated to be nearly $700 million, or nearly 20
times the cost of counterfeiting.7
2.1 U.S. Dollar Usage Around the World
The Federal Reserve supplies currency on demand. In practical terms, Federal Reserve
Banks provide currency at face value to banks that have accounts with them. Banks that do not
have accounts with the Federal Reserve can purchase currency through their correspondent
banks that do have Federal Reserve accounts. Individuals and nonfinancial firms typically
obtain currency from banks or currency exchanges.
As a share of the monetary aggregates, currency is relatively small: it makes up just over
a third of the narrow monetary aggregate, M1, and about a tenth of the broader monetary
aggregate, M2. However, there is a great deal of currency outstanding. Currency held outside
depository institutions at the end of 2002 amounted to about $630 billion, or about $2,200 for
every U.S. resident.8
Although a great deal of U.S. currency is in circulation per U.S. resident, not all U.S.
currency is held within the United States.9 Cash U.S. dollars are used widely overseas. The U.S.
they passed a "quality control" by fooling at least one person. 7American Bankers Association, 2002. Other industry sources report that the overall losses from
check fraud to consumers and businesses are in the range of $10 billion per year. 8 Weekly figures on the quantity of currency held by the public are reported on the H.6 report in
Tables 4 and 7. The December 2002 not seasonally adjusted figure for the currency component, or currency outside U.S. Treasury, Federal Reserve Banks and the vaults of depository institutions, as shown on Table 7, was $630.6 billion
4
9 The observations in this section are drawn from first-hand visits to dozens of economies by both authors over the past decade under the auspices of the International Currency Awareness
dollar is the leading international currency in many regions, and our estimates from earlier
studies suggest that between half and two thirds of all U.S. currency in circulation is held outside
the United States.10 People outside the U.S. have a wide range of motivations for holding and
using dollars and a correspondingly wide range of habits for managing their dollar holdings.
Generally, dollars are held when other assets are inferior in reliability, liquidity, anonymity, or
compactness. In highly volatile economic and political conditions, dollars can virtually drive out
other assets, including domestic currency. Moreover, once people lose faith in their local
currency, they tend to hold dollars for a long time before the local currency is able to regain
credibility. Beyond these situations, dollars are the currency of choice for travelers headed for
destinations outside Western Europe, and are favored as a store of value or medium of
transaction for large purchases in areas with moderate instability and underdeveloped financial
services. U.S. currency provides individuals in these countries with a vehicle for savings and
transactions that they would not otherwise have. For the U.S. taxpayers, there are benefits, too:
total currency outstanding has yielded seignorage income of $20 billion to $32 billion per year in
recent years, and the estimated portion of this revenue derived from overseas dollar holdings is
in the range of $10 to $20 billion per year.11
Program run jointly by the Federal Reserve, U.S. Treasury, U.S. Secret Service, and Bureau of Printing and Engraving; see U.S. Treasury (2003), Table 3.1 for a list of countries visited. During these visits, the authors have spoken with literally hundreds of senior officials from central banks, commercial banks, cash handlers, and law enforcement agencies about currency usage and counterfeiting outside the United States.
10 Judson and Porter (2001), Porter (1993), Porter and Judson (1996), U.S. Treasury (2000, 2003).
5
11For every dollar in currency obtained, individuals must give the Federal Reserve an asset worth
For the purposes of this paper, we group currency abroad outstanding into three
categories: currency hoarded, or held for long periods in one place; currency that circulates, but
stays outside the United States and the banking system in general; and currency that is used
largely for tourism or otherwise circulates back to the Federal Reserve through the banking
system. The currency in circulation abroad that is most readily analyzed with existing data
sources is that in the last category.
2.2 The Economics of Counterfeiting
Both theoretical studies and the little empirical information we have suggest that high-
quality counterfeiting is expensive and only effective when few counterfeits are passed relative
to the amount of genuine currency in circulation. Producing high-grade counterfeits requires
access to presses, inks, and high-grade paper. The last item is the most important element
because cashiers and bank tellers often rely on touch to detect counterfeits. In addition, the notes
must then be either passed or distributed to others for passing, which is a complicated
undertaking when large volumes of notes are produced. A bank or an individual might be fooled
into accepting a batch of counterfeits once, but it seldom happens more than that. Thus, the
notes must be ever more widely dispersed. Informal discussions with the Secret Service indicate
that the full cost of producing and distributing high-grade counterfeit $100s can be in excess of
a dollar. The Federal Reserve purchases Treasury securities with these assets. As long as the dollar remains outstanding, the Federal Reserve earns interest on its Treasury securities. Such interest earnings are rebated to the Treasury after deducting Federal Reserve expenses. In the four years from 1999 to 2002, the Federal Reserve returned between $23.7 and $32.3 billion to the Treasury each year (Economic Report of the President 2003, Table B-81.)
6
$50 per counterfeit.12
The few theoretical papers on currency counterfeiting also conclude that the only long-
run equilibria are for very low or very high levels of counterfeiting. Lengwiler (1997) finds that
in fact the only possible equilibria are for zero counterfeiting or a high level of counterfeiting. In
his model, the equilibrium that actually occurs is a function of the note's production cost (i.e.,
difficulty of counterfeiting) and its face value. The monetary authority is more likely to invest in
higher-cost notes and thus insure a zero-counterfeiting equilibrium the higher is the cost of
counterfeiting and the higher is the value of the note. The U.S. dollar, especially its pre-1996
series, had significantly fewer counterfeit protection devices than many other industrialized
countries and was relatively low in value.13 However, as Green and Weber (1996) point out, the
technology embedded in the new-design 1996-series $100 approached that of other countries'
currency at that time. The technology of euro banknotes, which were introduced in 2002, is
generally higher than the 1996-series U.S. dollar, but the new-design $20 issued in October,
2003 has comparable security to the euro.
3
Data Sources
We have two primary sources of data from the Secret Service and the Federal Reserve.
In addition, we have some institutional knowledge gleaned from both continuing contact and
12The fixed costs of producing high-grade counterfeits are relatively high. In addition, the costs of (successfully) passing more than a few notes into circulation can escalate quickly.
13The highest denomination now issued is $100. In contrast, many other countries issue denominations valued between $500 and $1,000, and a few countries issue notes whose value exceeds $1,000.
7
periodic visits to banks, currency dealers, banknote shippers, and other officials responsible for
currency distribution and counterfeit detection around the world. Both sources of data suggest
that the incidence of counterfeiting among actively circulating U.S. banknotes is quite low.
3.1 Secret Service Data on Counterfeiting
The Secret Service is responsible for investigating, prosecuting, and preventing
counterfeiting activity. They record counterfeit currency seized (i.e., found at the point of
production, before it enters circulation) and passed (i.e., found in circulation) counterfeit
currency by denomination, location, and production method. We focus on the data for notes
passed for two reasons: first, only notes passed were ever in circulation; second, only passed
counterfeits generate an economic loss to the public.
The Secret Service data are in principle complete, and should provide representative
figures. That is, if twice as many counterfeits are found in Country X than in Country Y, one
would in principle conclude that Country X had twice as many counterfeits as Country Y.
However, these data are incomplete for two major reasons. First, while U.S. law requires that all
counterfeits be turned over to the Secret Service, local treatment and reporting of counterfeits
outside of the United States varies considerably. Counterfeit U.S. dollars found abroad may be
retained by banks, returned to customers, or held by local law enforcement authorities without
being reported to the Secret Service. In some countries, counterfeiting of foreign currency is not
illegal, or counterfeits presented at banks or exchange offices are routinely returned to the holder
or retained by the bank or exchange office. Teams from the Treasury’s International Currency
Awareness Program (ICAP) visit banks and other cash handlers in various countries, and when
8
teams visit it is not at all uncommon for the banks visited to produce substantial caches of
counterfeits that they have accumulated and held, either because they wish to use the notes to
train their cashiers or because, prior to meeting the Secret Service agents, they had little idea that
the Secret Service considers it useful to at least examine and ideally retain passed counterfeits
for investigative purposes. The banks are not necessarily obligated to turn the counterfeits over
to the Secret Service. Second, the capacity of the Secret Service itself to detect and seize
counterfeit U.S. currency overseas is directly related to its ability to develop working
relationships with the appropriate agencies and officials overseas--detection of counterfeits is
generally higher in countries in which the Secret Service has better ties with local law
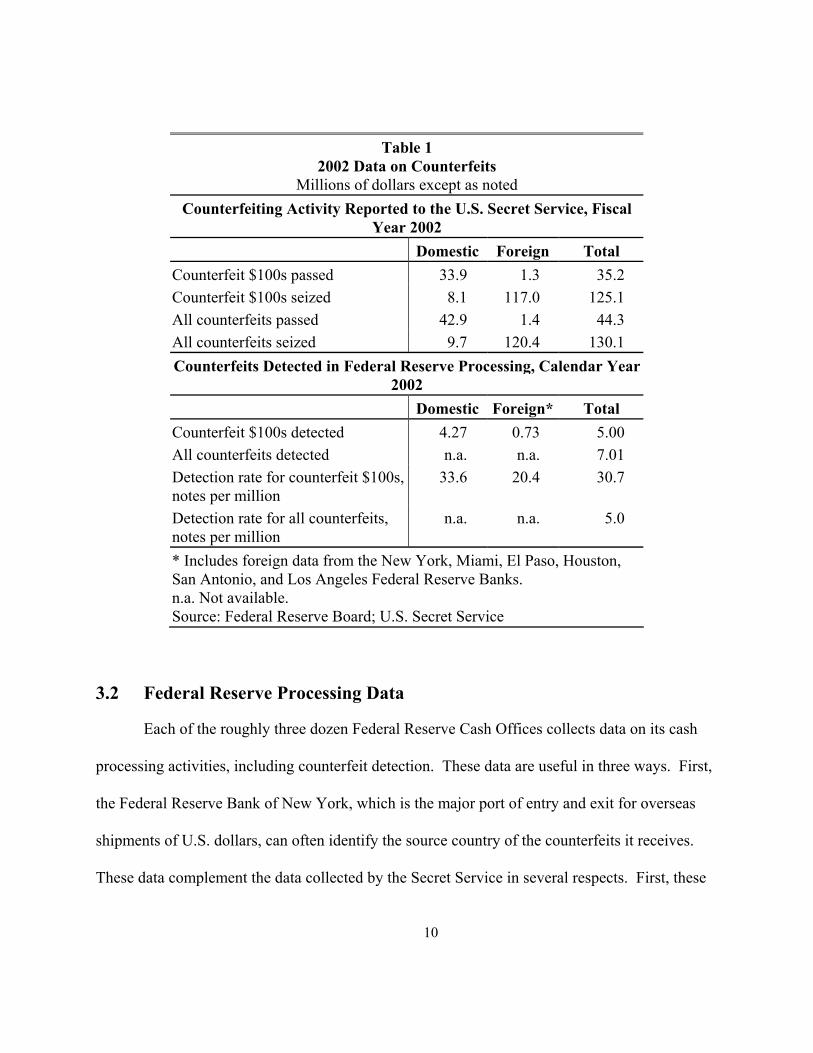
enforcement agencies. As shown in the top panel of Table 1, in fiscal year 2002 the Secret
Service recorded $42.9 million in counterfeit currency passing in the United States, but only $1.4
million in passing activity outside the United States. Because of the reporting and data problems
described above, the Secret Service agrees that the true quantity of U.S. notes passed abroad is
considerably larger than the reported quantity and is likely similar in magnitude to U.S. passing
activity.14
14 U.S. Treasury (2000, 2003). 9
Table 1 2002 Data on Counterfeits
Millions of dollars except as noted Counterfeiting Activity Reported to the U.S. Secret Service, Fiscal
Year 2002 Domestic Foreign Total Counterfeit $100s passed 33.9 1.3 35.2 Counterfeit $100s seized 8.1 117.0 125.1 All counterfeits passed 42.9 1.4 44.3 All counterfeits seized 9.7 120.4 130.1 Counterfeits Detected in Federal Reserve Processing, Calendar Year
2002 Domestic Foreign* Total Counterfeit $100s detected 4.27 0.73 5.00 All counterfeits detected n.a. n.a. 7.01 Detection rate for counterfeit $100s, notes per million
33.6 20.4 30.7
Detection rate for all counterfeits, notes per million
n.a. n.a. 5.0
* Includes foreign data from the New York, Miami, El Paso, Houston, San Antonio, and Los Angeles Federal Reserve Banks. n.a. Not available. Source: Federal Reserve Board; U.S. Secret Service
3.2 Federal Reserve Processing Data
Each of the roughly three dozen Federal Reserve Cash Offices collects data on its cash
processing activities, including counterfeit detection. These data are useful in three ways. First,
the Federal Reserve Bank of New York, which is the major port of entry and exit for overseas
shipments of U.S. dollars, can often identify the source country of the counterfeits it receives.
These data complement the data collected by the Secret Service in several respects. First, these
10
data measure counterfeiting in dollars that circulate differently. The Secret Service data cover
notes that were detected abroad, or, in the taxonomy mentioned in the introduction, are
circulating but remain outside the Federal Reserve. The Federal Reserve data, in contrast,
capture notes that by definition have been returned to the United States. Thus, the correlation
between these two sources can be used to calculate confidence bounds for the population of
notes in circulation as a whole.
The second use of Federal Reserve processing data for this paper comes from the fact that
separate statistics are recorded for pre-1990 series notes, 1990-series notes, and 1996-series
notes.15 Notes circulating within the United States are likely to return to Cash Offices more
quickly, while overseas notes in remote areas and areas where dollars are used more as a store of
value than as a medium of exchange are like to circulate to Cash Offices only infrequently.16
The information on the series status, however, can be exploited to obtain estimates of how much
of the total currency population is in "active" circulation and how much might be hoarded.
The third use of Federal Reserve processing data is the most direct: from counterfeit
detection rates and total processing figures, we can estimate confidence intervals for the true
151990-series notes were first issued in 1991 and include a security thread and microprinting. 1996-series notes were first issued in 1996 and include a larger portrait, a reflective security thread, a watermark, additional microprinting, optically-variable ink, and other features to prevent counterfeiting. A 2004-series $20 design was unveiled in May, 2003.
16 Depository institutions bear the cost of transporting currency for deposit in Federal Reserve Banks. For U.S. depository institutions, the volumes of currency are typically relatively large and the nearest Federal Reserve Bank is typically not very far away, so the transportation costs are relatively minor. For overseas institutions, however, the costs of transporting currency to the nearest Federal Reserve Bank can be considerably higher, providing an incentive for these institutions to try to recirculate currency rather than return it.
11
incidence of counterfeits among the stock of dollars circulating actively.
3.3 Institutional Information
The final sources of information, but not hard data, are the observations made during the
International Currency Awareness Program’s visits to dollar-using countries, in which both
authors have participated. Locations visited by the authors of the current paper included
Argentina, Bahrain, Belarus, Bolivia, Bulgaria, Chile, China, Colombia, the Dominican
Republic, Ecuador, El Salvador, Egypt, Greece, Hong Kong, Latvia, Lithuania, Mexico, Panama,
Peru, the Philippines, Poland, Romania, Russia, Saudi Arabia, Singapore, South Africa,
Switzerland, Taiwan, Turkey, United Arab Emirates, the United Kingdom, and Vietnam. Other
team members visited Brazil, Cambodia, Indonesia, Japan, South Korea, Paraguay, and
Thailand. In addition to providing a great deal of information about how and why U.S. currency
circulates in other countries, discussions during ICAP team visits indicate that most currency
returns to the banking system with surprising regularity, that internal counterfeit detection
statistics at commercial and central banks worldwide fall into a fairly narrow and low range, that
counterfeit detection skills are remarkably high wherever dollars are used, and that counterfeit
detection practices are very responsive to market forces.17
4
Estimating the Total Quantity of Counterfeit Dollars in Circulation Worldwide
The worldwide estimates of counterfeiting rely on a variety of data sources with differing
17Banks displayed varying counterfeit detection practices depending on local labor costs, local counterfeiting activity, and the relative cost of missing a counterfeit.
12
characteristics. Specifically, we have made three sets of calculations to estimate the total amount
of counterfeit currency now in circulation. First, we generate a lower bound for the total number
of counterfeits by denomination based on Federal Reserve cash processing data. Second, we
generated an upper bound for counterfeits by denomination by extrapolating from Federal
Reserve data to cover counterfeits found outside the Federal Reserve. Third, we generate a
range of plausible estimates for all denominations based on the relative incidence of $100
counterfeits and lower-denomination counterfeits. We conclude that the total value of
counterfeits in circulation at any moment is on the order of $40 to $50 million, or less than $1 for
every $10,000 outstanding, and is highly unlikely to exceed $108 million, or less than $2 for
every $10,000 in circulation. Further, we conclude that the incidence of counterfeits is roughly
the same inside and outside the United States, and thus the distribution of counterfeits follows
the estimated distribution of genuine currency, which is estimated to be about 55 to 60 percent
abroad with the remainder located within the United States.
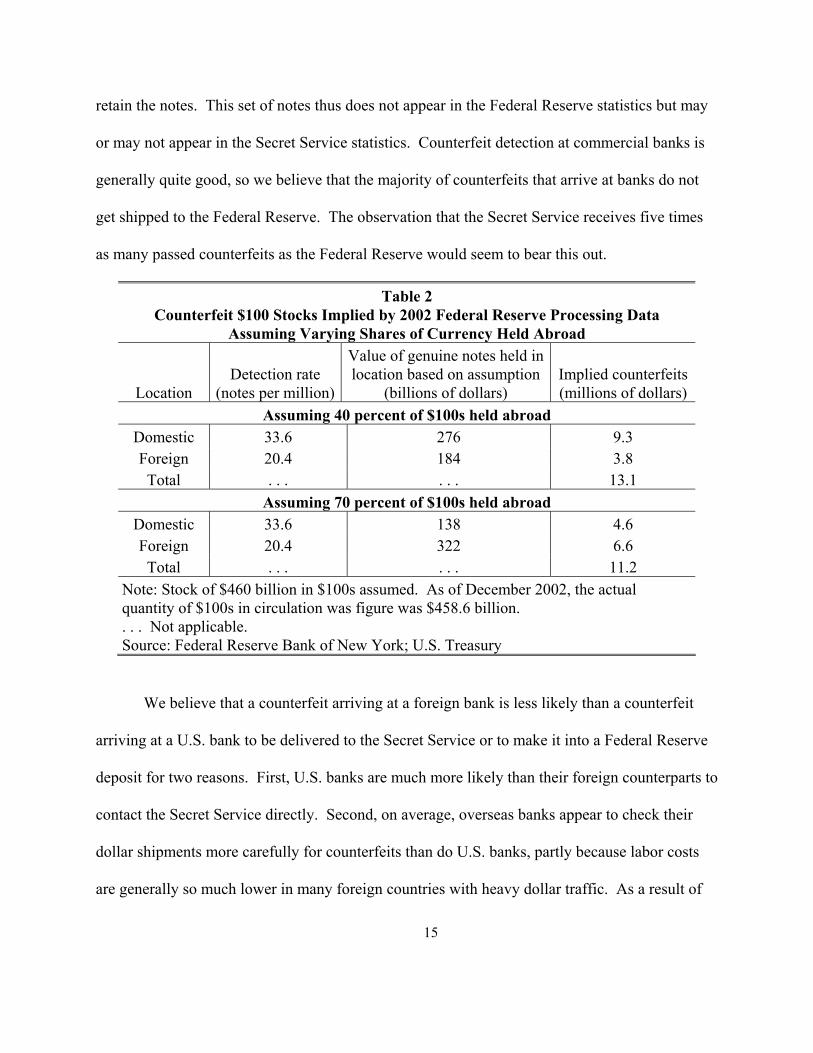
4.1 Estimating the Minimum Stock of Counterfeits in Circulation
The Federal Reserve keeps records on the origin of counterfeit U.S. notes it detects.
However, as a basis for comparison, the exact amount of U.S. currency held abroad is unknown.
To take account of the possibilities, we use a broad range of assumptions on the share of total
U.S. currency held abroad. For shares of $100s held abroad from 40 percent to 70 percent, Table
2 presents the counterfeit detection rate per million notes and the implied value of counterfeit
13
notes.18 The Federal Reserve processing data suggest that the total stock of $100 counterfeits
outstanding is in the range of about $11 million to $13 million, a figure we consider a lower
bound for several reasons. First, the notes sent to Federal Reserve Cash Offices are a relatively
“clean” sample of the population of all notes in circulation because such notes have already
passed through several detection “screens” before reaching the Federal Reserve. If a counterfeit
is deposited at a commercial bank, the probability that it will remain in the stock of notes sent on
to the Federal Reserve is less than 1, and most likely substantially less than 1. Four possibilities
for disposal await a counterfeit that arrives at a commercial bank. First, if undetected it could be
recirculated or sent to the Federal Reserve. In the latter case, it would appear in the Federal
Reserve processing data.19 Second, it could be detected as a counterfeit by the bank, and
reported to the police and Secret Service. In this case, the note would appear in the Secret
Service's statistics but not in the Federal Reserve's statistics. Third, it could be detected and
returned to the depositor (although virtually no U.S. banks return suspected counterfeits to
depositors).20 Fourth, it could be detected and confiscated but either not reported to the police
and Secret Service or not released. Banks are often eager to retain a few counterfeits for use in
training their own tellers. In some countries, banks are permitted to report counterfeits and then
18Although the estimates in Porter and Judson (October 1996) and U.S. Treasury (2000, 2003) put the estimated overall share of currency abroad between 55 and 70 percent, Feige (1996) presents estimates as low as 40 percent.
19It is assumed that the Federal Reserve detects all counterfeits in shipments it receives. For a discussion of this assumption, see Allison and Pianalto (1997).
20Nearly every central bank in the world, including the Federal Reserve, forbids this behavior on the part of local banks and currency exchanges, but some evidence and the ICAP teams’ interviews suggest that it occurs with some regularity outside the United States.
14
retain the notes. This set of notes thus does not appear in the Federal Reserve statistics but may
or may not appear in the Secret Service statistics. Counterfeit detection at commercial banks is
generally quite good, so we believe that the majority of counterfeits that arrive at banks do not
get shipped to the Federal Reserve. The observation that the Secret Service receives five times
as many passed counterfeits as the Federal Reserve would seem to bear this out.
Table 2 Counterfeit $100 Stocks Implied by 2002 Federal Reserve Processing Data
Assuming Varying Shares of Currency Held Abroad
Location Detection rate
(notes per million)
Value of genuine notes held in location based on assumption
(billions of dollars) Implied counterfeits(millions of dollars)
Assuming 40 percent of $100s held abroad Domestic 33.6 276 9.3 Foreign 20.4 184 3.8 Total . . . . . . 13.1
Assuming 70 percent of $100s held abroad Domestic 33.6 138 4.6 Foreign 20.4 322 6.6 Total . . . . . . 11.2
Note: Stock of $460 billion in $100s assumed. As of December 2002, the actual quantity of $100s in circulation was figure was $458.6 billion. . . . Not applicable. Source: Federal Reserve Bank of New York; U.S. Treasury
We believe that a counterfeit arriving at a foreign bank is less likely than a counterfeit
arriving at a U.S. bank to be delivered to the Secret Service or to make it into a Federal Reserve
deposit for two reasons. First, U.S. banks are much more likely than their foreign counterparts to
contact the Secret Service directly. Second, on average, overseas banks appear to check their
dollar shipments more carefully for counterfeits than do U.S. banks, partly because labor costs
are generally so much lower in many foreign countries with heavy dollar traffic. As a result of
15
the higher level of screening abroad, the incidence of counterfeits from foreign deposits is just
over half of that for domestic deposits in recent years.21
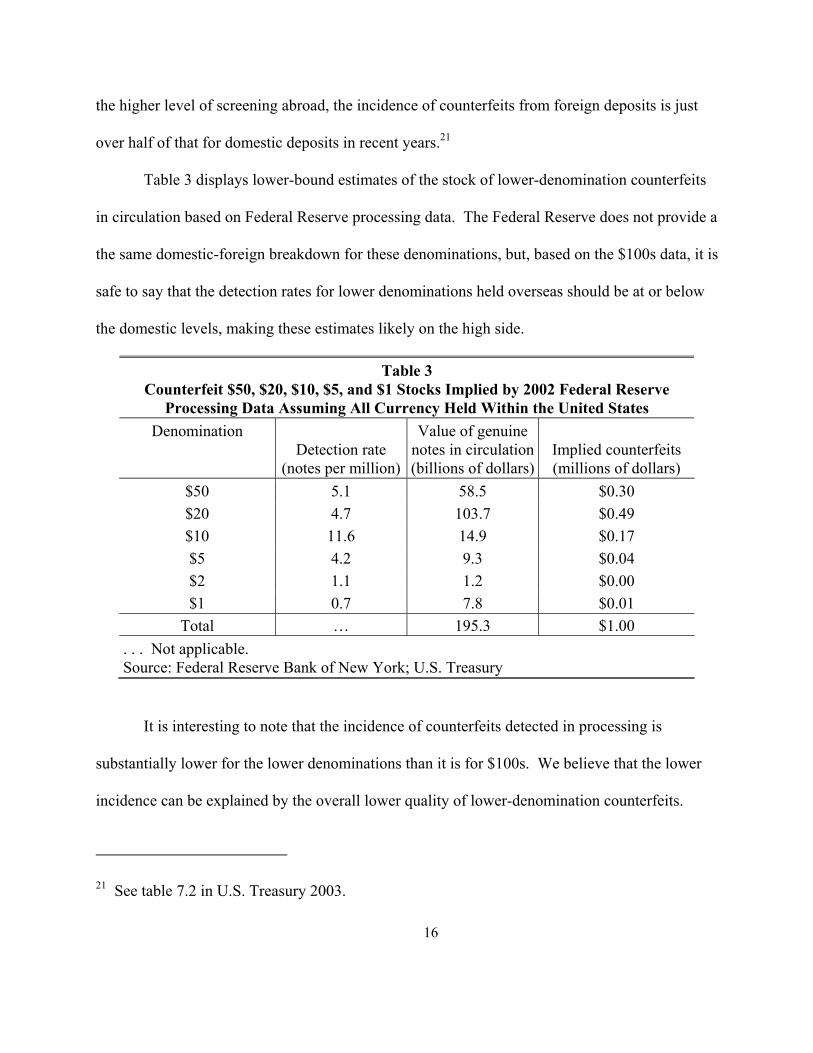
Table 3 displays lower-bound estimates of the stock of lower-denomination counterfeits
in circulation based on Federal Reserve processing data. The Federal Reserve does not provide a
the same domestic-foreign breakdown for these denominations, but, based on the $100s data, it is
safe to say that the detection rates for lower denominations held overseas should be at or below
the domestic levels, making these estimates likely on the high side.
Table 3 Counterfeit $50, $20, $10, $5, and $1 Stocks Implied by 2002 Federal Reserve
Processing Data Assuming All Currency Held Within the United States Denomination
Detection rate (notes per million)
Value of genuine notes in circulation (billions of dollars)
Total* $23,616,120 $16,663,019 $40,279,139 58.6% *Excludes denominations above $100. **Raised notes are high-denomination counterfeits that are constructed from genuine lower-denomination notes. For example, raised notes often feature one or more corners of a high-denomination note attached to the body of a lower denomination note. Source: U.S. Secret Service
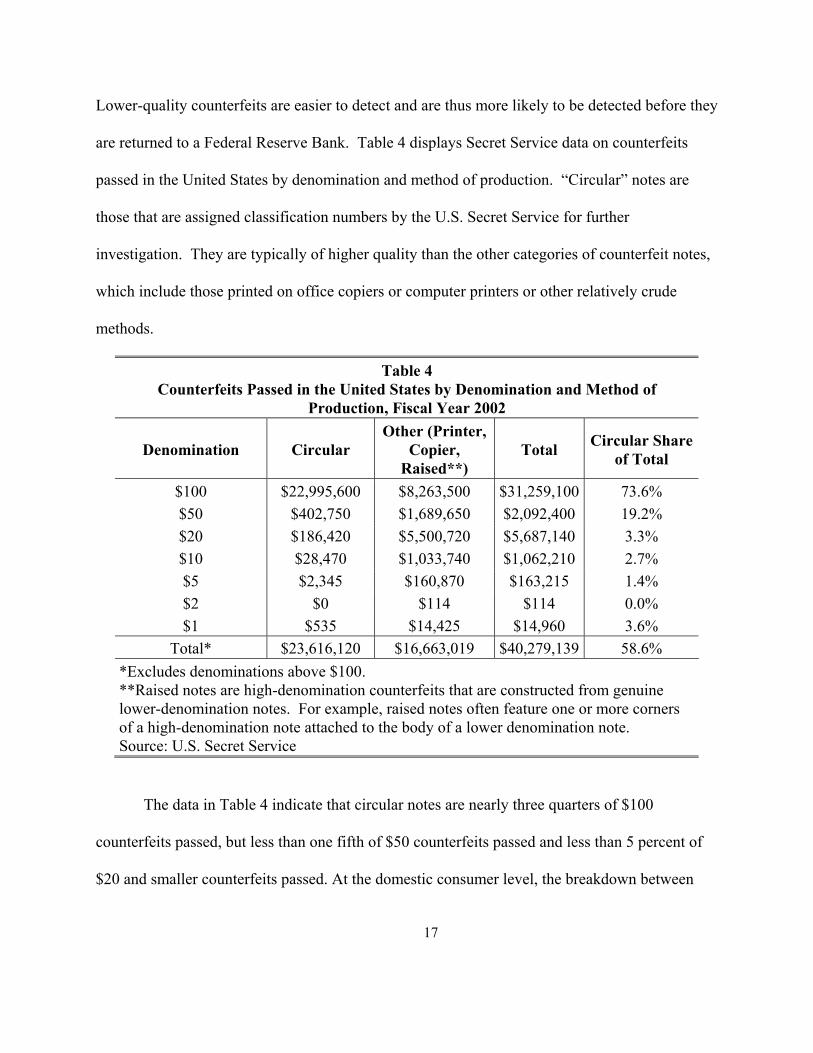
The data in Table 4 indicate that circular notes are nearly three quarters of $100
counterfeits passed, but less than one fifth of $50 counterfeits passed and less than 5 percent of
$20 and smaller counterfeits passed. At the domestic consumer level, the breakdown between
17
circular and other notes is significant. A non-circular counterfeit note is usually of minimal
quality: a person with minimal training in counterfeit detection and currency authentication
should be able to detect it readily with the naked eye, and successful passing occurs only when
the recipient of the note fails to give it much scrutiny at all. Over 95 percent of the notes in the
$20 and smaller denominations, which are those most commonly used by U.S. consumers, fall
into the non-circular category. The implication for most U.S. residents is that a minimal level of
vigilance is enough to virtually rule out losses from counterfeiting: as can be seen from Table 4,
the value of circular counterfeits passed in the $20 and smaller denominations in 2002 was less
than $220,000.
4.2 Using Federal Reserve and Secret Service Data to Estimate the Total Stock of Counterfeits in Circulation
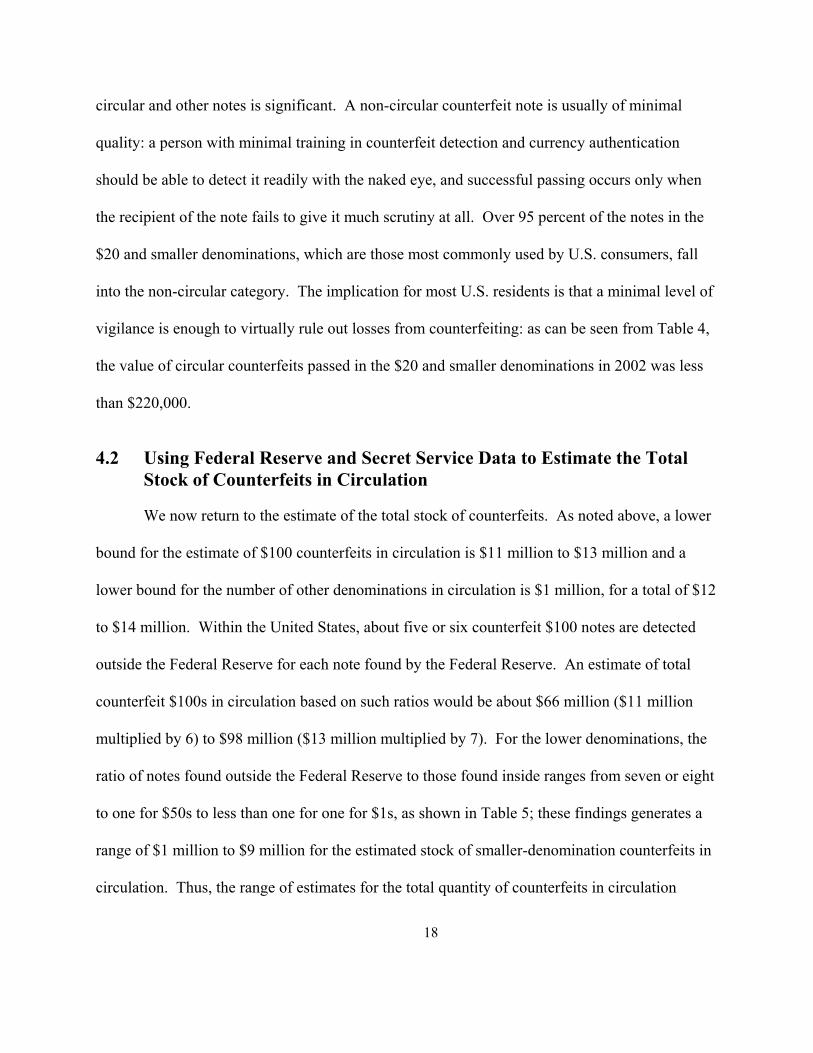
We now return to the estimate of the total stock of counterfeits. As noted above, a lower
bound for the estimate of $100 counterfeits in circulation is $11 million to $13 million and a
lower bound for the number of other denominations in circulation is $1 million, for a total of $12
to $14 million. Within the United States, about five or six counterfeit $100 notes are detected
outside the Federal Reserve for each note found by the Federal Reserve. An estimate of total
counterfeit $100s in circulation based on such ratios would be about $66 million ($11 million
multiplied by 6) to $98 million ($13 million multiplied by 7). For the lower denominations, the
ratio of notes found outside the Federal Reserve to those found inside ranges from seven or eight
to one for $50s to less than one for one for $1s, as shown in Table 5; these findings generates a
range of $1 million to $9 million for the estimated stock of smaller-denomination counterfeits in
circulation. Thus, the range of estimates for the total quantity of counterfeits in circulation
18
becomes $67 million to $108 million.
This range, however, should be viewed as an upper bound, for reasons similar to those
discussed above. The counterfeits found outside the Federal Reserve are generally of lower
quality and more easily detected (hence their detection outside the Federal Reserve). Thus, they
likely do not circulate for as long as the counterfeits that survive until reaching the Federal
Reserve.22 Since we believe that both the upper-bound and lower-bound estimates are relatively
far from the true stock of counterfeits in circulation, a middle-range value of about $40 to $50
million, or less than $1 worth of counterfeit for every $10,000 in circulation, is most likely.
Table 5 Counterfeits Passed in the United States in 2002
22Appendix B in U.S. Treasury (2000) takes up the issue of the lifespan of a counterfeit. 19
5 How Representative Are Our Datasets? Comparing the Datasets
5.1 Country-Level Comparisons
In principle, the country-by-country Federal Reserve Cash Office processing data on
counterfeits should be a subset of the Secret Service data. Under certain conditions, moreover,
the proportions of counterfeits detected by country and region should be similar in both datasets.
However, neither of these conditions holds exactly in the data we present here and as a result,
the ratios do not exactly coincide, though most observations do fall within two standard
deviations of the mean absolute deviation.
There are two conditions that would need to hold for the country-specific counterfeit
datasets to exactly match both each other and the underlying true country distribution of
counterfeits. First, the Secret Service's ability to detect counterfeits would have to be exactly
uniform across countries. This condition is surely not the case given variation in staff size,
relations with local law enforcement, and other local factors. Second, the notes processed by the
Federal Reserve would have to be a random sample of the notes in circulation in a given country.
This condition is somewhat more likely to hold. While some currency is held for long periods
and some currency is selected for return to the United States because it is extremely worn or
dirty, our estimates below on hoarding suggest that notes circulate fairly randomly.
The Secret Service data used here cover only notes passed to the public in fiscal year
2002; they do not include notes seized, since these notes by definition were never in circulation.
Since the Secret Service dataset includes counterfeits found by the Federal Reserve, the Secret
Service's figure for each country should exceed the Federal Reserve's figure. Countries are 20
dropped if the Secret Service shows fewer counterfeits than the Federal Reserve.
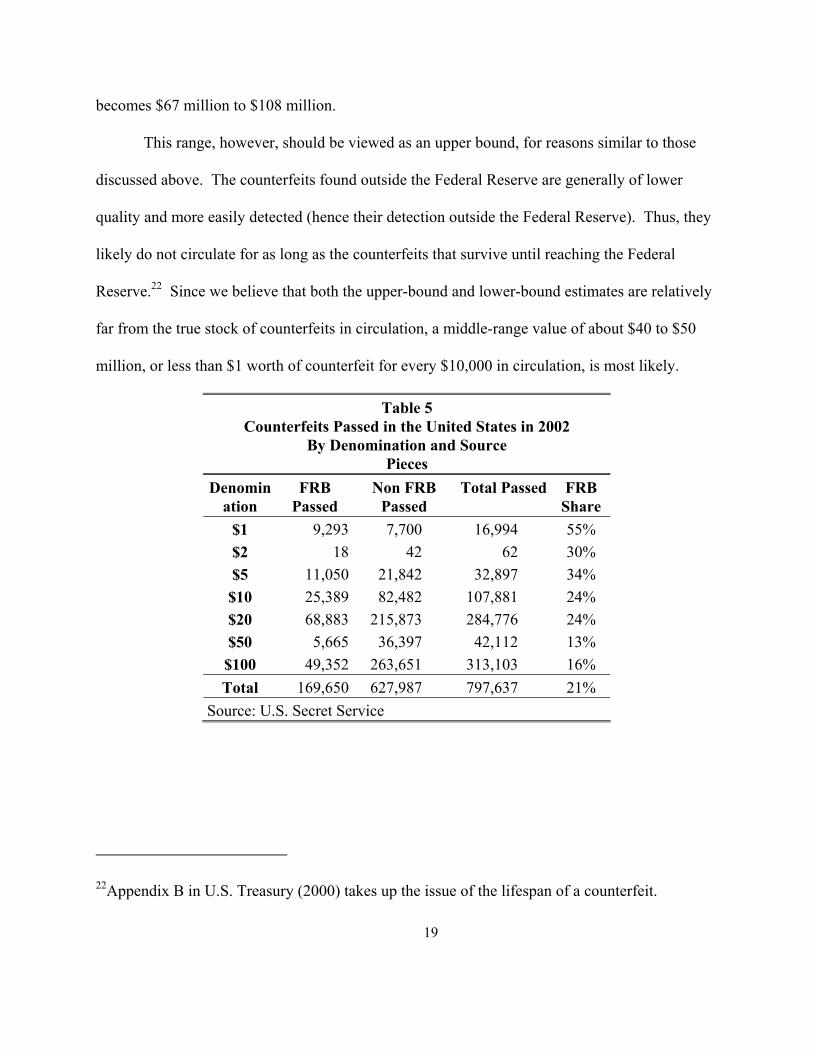
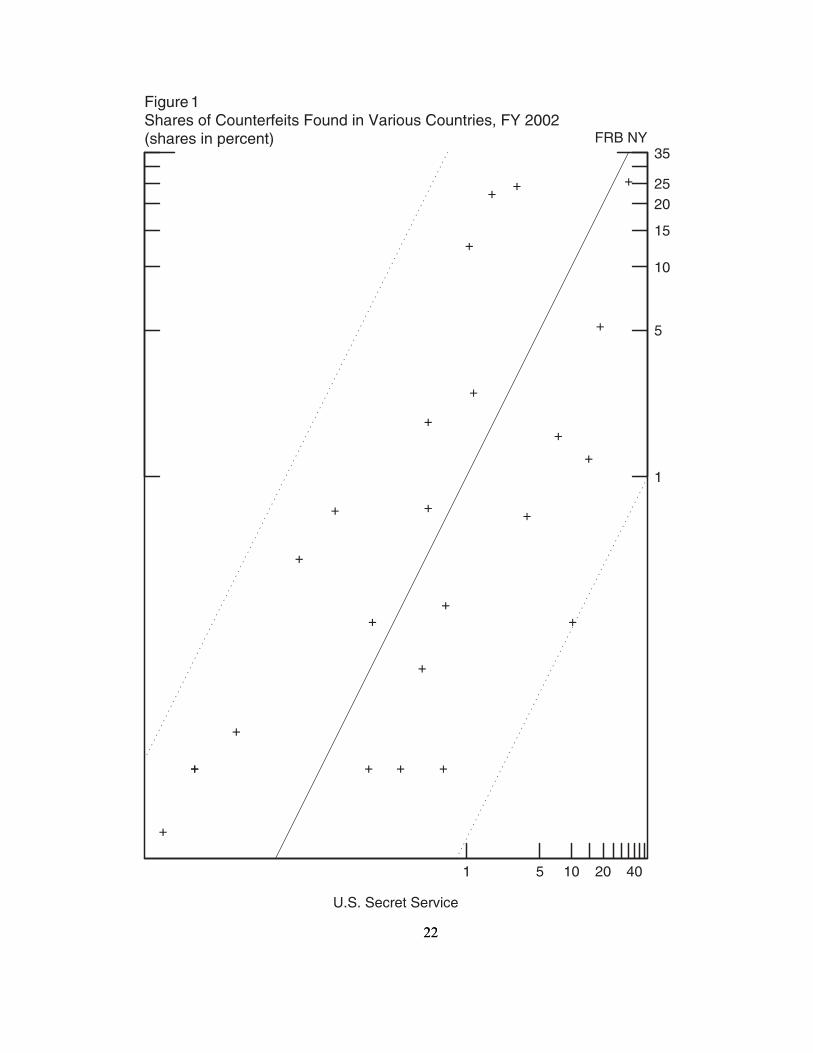
Each point in Figure 1 represents one country's share of the counterfeits detected in each
data set. Thus, a point at (5,10) would indicate that 5 percent of the counterfeits detected at the
New York Federal Reserve Cash Office came from that country while 10 percent of the
counterfeits detected by the Secret Service did. These points would all lie on the 45-degree line
if the relative detection rates between the two data sets agreed and if the samples of notes
processed were exactly representative of the notes in circulation. The dotted lines represent a 95
percent confidence interval around the 45-degree line. Since all of the points associated with the
individual country pairs lie within the confidence band, we cannot reject the hypothesis that the
relative detection rates in the two datasets are not significantly different from one another.
21
22 22
5.2 Secret Service Data and Counterfeit Stock Estimates
We now return to the estimate of the total stock of counterfeits. Recall that extrapolation
from Federal Reserve cash processing data yields an estimated stock of $12-$14 million in
counterfeits of all denominations in circulation. In contrast, the Secret Service data for 2002
indicate that the total value of counterfeit currency passed on the public in 2002 was about $41.5
million, roughly three to three and a half times what the Federal Reserve data would suggest, but
in the range of our “mid-range” estimate and well below our upper bound. It is not clear what
this discrepancy implies. Most notably, we do not know how long a typical counterfeit
circulates before being detected. If, for example, the average counterfeit only circulated for one
month before being detected, then the annual Secret Service statistics could be consistent with as
little as $3.5 million in counterfeit currency circulating at any given time.23 Thus, if we were
willing to assume that the Secret Service on average finds counterfeits within a three or four
months of their first appearance, the Federal Reserve and Secret Service figures would be
consistent with each other.
In fact, our circulation data can help resolve this issue. Assume first that we are in
counterfeit equilibrium in which the stock of counterfeits as a share of genuine currency in
circulation is roughly constant. Then the number of counterfeits that is detected and removed
from circulation each year should be roughly equal to the number that are placed into
23That is, if each month $3.5 million in counterfeits entered circulation, were then detected by the Secret Service in that month, and were then replaced with new counterfeits, the Secret Service could find $3.5 million x 12 = $42 million in counterfeit currency each year even though at any moment only $3.5 million was in circulation.
23
circulation.24 The questions are then how fast the stock of counterfeits turns over and what share
of total counterfeits detected are reported to the Secret Service.
Consider the circulation lives of $100 notes. Genuine notes circulate, return to Reserve
Banks, and sometimes recirculate; their average lifespan is about eight years.25 In contrast,
counterfeits end their lives when they are detected, which at the very latest is on their first (and
only) trip to a Federal Reserve Cash Office. Cash processing data from the first year following
the introduction of the 1996-series $100 note indicate that about one-third of the total notes
outstanding at the beginning of the period were replaced, which means that one-third of the notes
visited the Federal Reserve at least once. If counterfeits circulate at least as fast as genuine
notes, which we benchmark with observations on $100s after the introduction of the 1996-series
notes, then on average counterfeits should remain in circulation at most about three years before
facing certain detection at a Federal Reserve Bank. However, the average lifespan of a
counterfeit $100 is probably only a small fraction of three years for three reasons. First, as noted
earlier, more than 80 percent of $100 counterfeits are detected prior to reaching a Federal
Reserve Bank.26 Second, we have reason to believe that, if anything, counterfeits circulate faster
24 More precisely, assuming that counterfeits represent a constant percentage of currency in circulation, the number of new counterfeits entering circulation would be equal to the number of counterfeits leaving circulation multiplied by the overall growth rate of currency in circulation.
25The estimate is probably on the high side. A 1991 Federal Reserve survey found such an estimate but the rate at which $100s has been received from circulation has increased significantly since then, suggesting an average age more in the neighborhood of 5 years might be more appropriate now.
26 As seen in Table 5, in calendar year 2002, Federal Reserve Banks 16 percent of all counterfeit $100s passed.
24
than genuine notes: all other things equal, if an individual has two notes and considers one of
them “suspicious” or possibly counterfeit, the individual is likely to try to get rid of that note
first. Thus, we assume that on average counterfeits could remain in circulation at most for one
year, with a few months being much more likely.27
Table 6: Stocks of $100 Counterfeits for Various Longevity and Share Abroad Assumptions ($ Million)
Counterfeit $100s detected within the U.S. by the Secret Service in 2002: $31 million
Next, the question is what share of notes that are detected as counterfeit appear in the
Secret Service's statistics. For domestic notes, this figure is almost surely near 100 percent. For
counterfeits detected overseas, this figure is surely well below 100 percent, but whether it is 10
27 Appendix B.2 in U.S. Treasury (2000) addresses this issue in more detail. In informal discussions, agents from the U.S. Secret Service have repeatedly noted that their investigations point to very short active lives for counterfeits in active circulation; they consider one year to be beyond a reasonable upper bound for the average lifespan of a counterfeit note. Based on the calculations in U.S. Treasury (2000) and the input from the U.S. Secret Service, we would place the probability that the true average lifespan of a counterfeit dollar exceeds a year at well
25
percent or 70 percent is difficult to say. In any case, using domestic figures as a benchmark, we
know that about $31 million worth of $100 notes was recorded as passed in fiscal year 2002.
Using the figure of an average lifespan of a counterfeit note of one year and the assumption of
constant shares of counterfeit activity, we arrive at an estimate of domestic steady-state stock of
counterfeit $100s of about $31 million.
We can extrapolate to the rest of the world in a couple of directions; Table 6 presents the
calculations. Depending on how much of the stock of $100s we assume is held outside the
United States and how long we think the average counterfeit $100 survives before being
detected, there could be anywhere from $5 million to $104 million in counterfeit $100s
outstanding. These calculations rest critically on the assumption of the lifespan of a counterfeit.
As noted above, we consider the one-year assumption to be a very realistic or conservative upper
bound.
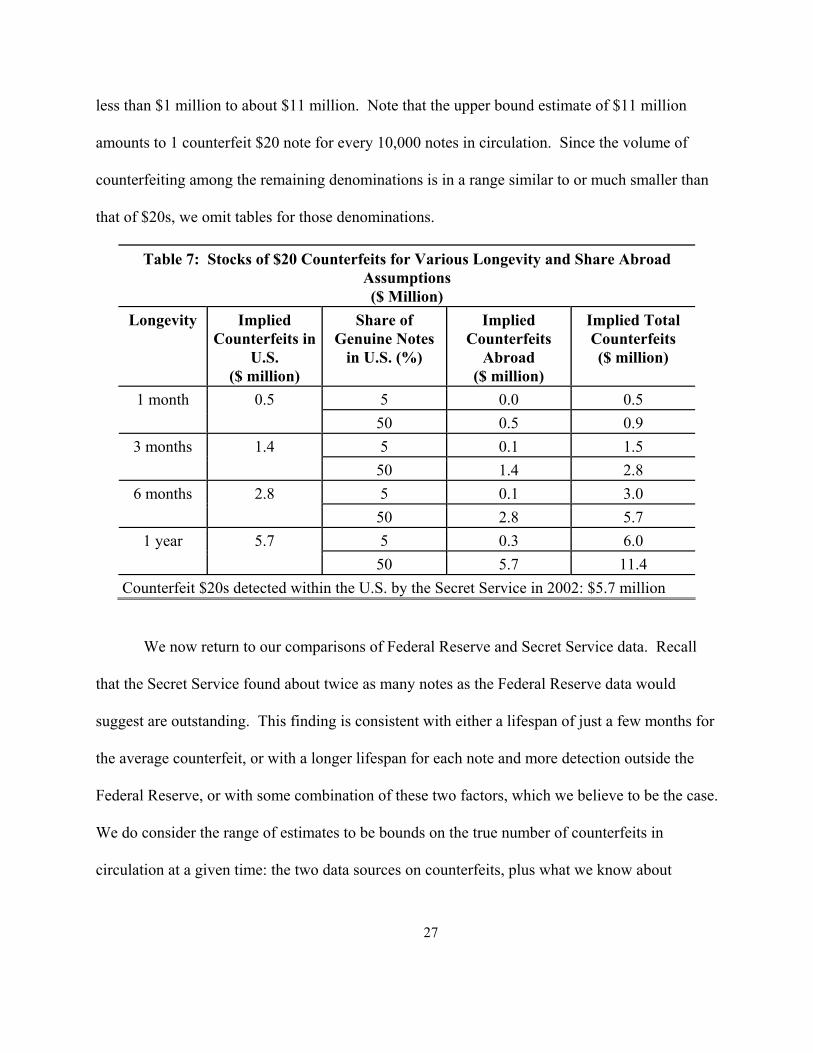
Table 7 displays the results of similar calculations for $20s. We have not formally
estimated how many $20s are in circulation outside the United States, but we consider 50 percent
to be a reasonable upper bound. In addition, $20s circulate much more rapidly than $100s: in
2002, about three times as many $20s were processed by Federal Reserve Banks as were in
circulation, so on average a $20 circulates for only a few months before certain detection at a
Federal Reserve Bank. The average life of a counterfeit $20 is likely even shorter than a few
months, but we show the same range of time possibilities as for $100s just for comparison. The
results for $20s, as for $100s, have a very wide range, but the value is substantially lower: from
below 1percent. 26
less than $1 million to about $11 million. Note that the upper bound estimate of $11 million
amounts to 1 counterfeit $20 note for every 10,000 notes in circulation. Since the volume of
counterfeiting among the remaining denominations is in a range similar to or much smaller than
that of $20s, we omit tables for those denominations.
Table 7: Stocks of $20 Counterfeits for Various Longevity and Share Abroad Assumptions ($ Million)
Counterfeit $20s detected within the U.S. by the Secret Service in 2002: $5.7 million
We now return to our comparisons of Federal Reserve and Secret Service data. Recall
that the Secret Service found about twice as many notes as the Federal Reserve data would
suggest are outstanding. This finding is consistent with either a lifespan of just a few months for
the average counterfeit, or with a longer lifespan for each note and more detection outside the
Federal Reserve, or with some combination of these two factors, which we believe to be the case.
We do consider the range of estimates to be bounds on the true number of counterfeits in
circulation at a given time: the two data sources on counterfeits, plus what we know about
27
circulation, suggest that it is very unlikely that more than $31 million in counterfeit $100s is in
circulation within the United States. Extrapolation to the stock of notes circulating outside the
United States is similarly ambiguous, but does yield an upper bound figure of $104 million.
Estimates for $20s would add $11 million to that total, and estimates for the remaining
denominations would add at most another $10 million, for a total of at the very most $125
million for all notes in circulation. Note that this figure, which we consider to be extremely
conservative (i.e., very much on the high side of the truth) still represents less than 1/50 of one
percent of all currency in circulation.
6
The Next Step: How Unrepresentative Are Our Data?
The estimates constructed above rely heavily on the assumption that currency, both
genuine and counterfeit, circulates with some frequency, which we generally believe to be true.28
However, it is sometimes asserted that counterfeit notes somehow find their way into isolated
"pools" of currency that never reach the banking system.
Below we present two models that show why it is unlikely that notes can remain outside
the banking system indefinitely. The first model shows that notes in active circulation almost
surely return to the banking system after a relatively small number of transactions, which on
average translates into a relatively short period. The second model exploits cash processing data
to estimate the shares of currency at home and abroad that might be hoarded, or out of
circulation for more than a year at a time. Both of these models suggest that it is extremely
28 Counterfeit currency likely circulates more rapidly than genuine currency, but with rare exceptions, all currency moves into the market occasionally.
28
unlikely that large quantities of counterfeits that have been passed can hide anywhere for very
long.
6.1 Hoarding
In some countries and circumstances, U.S. dollars are used as a store of value and can be
held for a very long time without circulating. We exploit the processing data from the Federal
Reserve Cash Offices to estimate the parameters of a simple model of hoarding. In this model, a
share h of the currency stock is hoarded in a given year, and a share α of the hoarded stock is
turned over every year. The currency processed is a random sample of the active notes only.
The key ingredient in this model is the fact that a new-series $100 note was introduced in 1991.
After this date, all old-series $100s arriving at Cash Offices were replaced with new-series notes.
We have six years of data, 1991-1996, and two unknowns, h and α. If the population of notes is
n and notes are drawn (processed) randomly with replacement, then the probability that a note
gets processed in one draw is 1/n. The probability that a note is drawn after p draws is thus
) n1 - 1 ( - 1 p
Observe that the only notes that can be processed are in the active share of the pool, A.
Thus, the right figure to use in the denominator of the equation above is not n but An. Since the
draws are independent, the number of notes replaced, say r, is just equal to An times the
probability that one note will be replaced:
) ) n1 - 1 ( - 1 ( n A =r p
Dividing both sides by n, we obtain an expression in terms of R, the share of notes
29
replaced, as a function of A, the active share of the population, n, the total note population, and p,
the number of notes processed. This is our basic equation:
))A1
n1-(1-(1 A = R p
tt
t
The stock of $100s outstanding grew fairly rapidly in this period. We assume, however,
that the share of notes hoarded remained constant. After the first year, R is defined net of note
growth. Moreover, one must account for the fact that some notes enter the active pool and some
leave. If α is the share of inactive notes that re-enter the active pool each period, R after the first
period is defined as
)m1( )nG - (I R at1>t ≡
where I is the number of new notes issued, G is the growth rate of the stock of notes, and ma and mh
are active and hoarded stocks of new-series notes, with ma defined as follows:
)A
n / m( )G + (1 + m - m( - m m - m m ttt
h1-t
h1-tt
htt
at αα≡≡
Since there are two parameters, we conduct a grid search to find the best fit. We estimate
the parameters separately for notes circulating within and outside the United States. Since we do
not know the total number of notes circulating in each area, we estimated the parameters for a
range of assumptions about the share of notes held abroad. As in previous work (Porter and
Judson, 1996), we treated the New York Cash Office as the "foreign" office since we know that
it handles the bulk of foreign shipments.
The objective functions are well-behaved but fairly flat. In general, they indicate that
hoarding is unlikely to be important for very long, and that turnover is likely to be high. For
30
example, for the case of fifty percent of currency stocks assumed abroad, we find that α, the
turnover rate for inactive currency, is 0.6 for domestic currency and 0.99 (corner solution) for
overseas dollars. We find that the share hoarded at home is 0.19 and is effectively zero (again a
corner solution) overseas.29 For other assumptions, the highest share of hoarding found is 0.69
and the lowest turnover is 0.47. We conclude that it is highly unlikely that large quantities of
notes are likely to stay out of circulation (and hidden from counterfeit detection) for very long.
6.2 "Pools" of Undetected Counterfeits
One often-cited possibility is that there are isolated "pools" of circulating currency with
high concentrations of counterfeits that do not circulate to Cash Offices. Although such an idea
is in principle plausible, we are able to show that it is in practice highly unlikely.
This idea that notes could circulate outside the banking system indefinitely is based on
several assumptions, including some variation on the following:
(a) Currency overseas endlessly recirculates without being processed by any banking
entity, thus counterfeit is not detected and continues to circulate, or
(b) Currency is processed by banking entities that lack detection capability, thus
counterfeit is not detected and continues to circulate, or
29At first blush, it might seem counterintuitive that overseas notes emerge from the hoarding state with a greater propensity abroad. A 1989 survey of notes circulating domestically and internationally found that the turnover rates of foreign and domestic notes were similar in that they had similar age-degree of use profiles where use was measured by the quality and degree of soil on the notes. Such a pattern indicates that the notes were active to about the same degree both domestically and overseas. Since currently a large portion of United States is held abroad in rather undeveloped economies where currency is used extensively, the turnover rate may be higher abroad simply because currency is a relatively more important source of
31
(c) Currency is processed by banking entities that detect the counterfeit, but choose
to recirculate the currency to avoid losses, thus counterfeit continues to circulate,
(d) Currency continues to circulate overseas without routinely being repatriated, thus
counterfeit is not detected and continues to circulate.
When we visited central and commercial banks and authorities charged with stopping
counterfeiting in a large group of countries, we were able to observe counterfeit detection
capabilities and the condition of the currency. Based on what we observed, it was apparent that
currency does not endlessly recirculate in any of the markets we visited. Currency is used for a
wide range of transactions, but even in gray or black market economies it will eventually find its
way into a commercial banking institution, most likely after being used in relatively few
transactions.30
The logic behind our conclusion that notes cannot remain in circulation very long is
readily laid out. Since transactions are usually between unrelated individuals, it is plausible to
assume that successive transactions are statistically independent of one another. To make the
payment than in the United States and therefore used more often. 30There is an important exception to this argument. For years, stories have circulated that some
government(s) hostile to the United States had obtained plates to print currency and were going to produce a flood of counterfeits in an effort to destabilize the dollar. It was argued that these counterfeits could circulate endlessly and freely within the bounds of such countries. We have no way of confirming or denying such stories. If "closed" countries (e.g., North Korea) do indeed have many counterfeits in circulation, it is impossible to know as long as the system remains closed. The evidence and model we present here apply to open markets and economies. Moreover, in a closed system where nobody is being fooled about the genuineness (or lack thereof) of the currency, it is not clear that there is a loss to consumers and, as long as the counterfeits remain confined to the closed economy, they do not affect the value of genuine dollars.
32
analysis tractable, also assume that there is a constant probability, say µ, that after any
transaction a given banknote will not be returned to a financial institution. There is a
presumption that µ should be relatively small. After all, apart from transactions between
individuals, most currency transactions are with retail establishments and most retailers
generally accumulate nearly all of the currency they receive and deposit/sell all but "seed" cash
-- in particular, all large-denomination notes -- at financial institutions or exchange houses on at
least a daily basis. Survey evidence suggests that currency circulating both within and outside
the United States turns over (is exchanged) on average about once a week.31 If the probability is
µ that the note recirculates, the note is used in one transaction per week, and successive
transactions are independent, the probability that the note will continue to recirculate after θ
weeks has a joint binomial distribution with probability µθ. Thus, the complementary event that
a given note is returned to a financial institution after θ transactions is 1-µθ. Clearly, this
probability will approach unity after a relatively short interval of time even if µ is close to unity
because it is raised to the power θ. For example, consider the extreme case where µ = 0.9 so the
odds are 9 to 1 that a note will recirculate; even in this case after 7 weeks, the probability is
greater than one half that the note will hit the banking system; and after 22 weeks, the probability
is greater than 0.95 that the note will stop recirculating. A more plausible assumption would be
to assume µ = 0.1 so that most transactions are with retail vendors and not with "hand-to-hand
transactors." In this case, the probability that the note will be returned to a financial institution
approaches one almost immediately.
31See Porter and Judson (1996) and Feige (1996). 33
If notes turn over more frequently than one time per week, the time of the first passage to
the financial institution would be even sooner. In some countries, cash dollars are the dominant
medium of exchange even for small daily purchases; in this case, notes could turnover as fast as
once per day on average. If currency turned over on a daily basis, the twenty-two week period
for the first passage of a note to a financial institution in the extreme case with µ = 0.9 would be
cut to one-seventh of the time, or approximately three weeks.
Once currency hits the banking system, it naturally flows to regional financial processing
centers, and is routinely repatriated in large quantities. Thus, currency does not generally
recirculate in large amounts, most probably not in amounts any greater than is found in Federal
Reserve deposits from foreign sources. Further, it is quite unlikely that banks recirculate
counterfeits either to other banks or to their customers. While the bank pays no additional
penalty if another bank or the Federal Reserve finds a counterfeit, its reputation can suffer if
customers find the bank giving out counterfeits.
In sum, we find it unlikely that counterfeits can circulate for long outside the banking
system, and thus outside reasonably sophisticated counterfeit detection, for very long. These
figures thus suggest that notes are unlikely to circulate outside banks for much more than a year.
7 Conclusion
We develop upper and lower bound estimates for the quantity of counterfeit dollars in
circulation. Processing data from the Federal Reserve Bank of New York suggest a lower bound
of $12 to $14 million in value terms. Using denomination-specific weights to scale up the lower-
34
bound estimate to account for the counterfeits passed outside the Federal Reserve yields an
upper-bound estimate of $67 to $108 million, or about $1 to $1.50 per $10,000 in circulation.
We believe that an estimate in the neighborhood of $40 to $50 million, or 60 to 80 cents per
$10,000 in circulation, is the most plausible, and is consistent with a relatively short average
lifespan for a given counterfeit note. These figures are relatively small, but for U.S. consumers,
the threat from high-quality counterfeits is even smaller: for the $20 and smaller denominations,
counterfeiting losses are tiny, at $7 million in 2002, of which less than $220,000 were notes that
could not be detected by users with minimal hand inspection.
We further find that while it is indeed possible that a large number of counterfeits could
be injected into the financial system, it is quite unlikely that they would remain there in use and
undetected. We find the close correlation between the country distribution of the counterfeits
detected by the Federal Reserve and the Secret Service particularly intriguing; we believe it is
strong evidence that both counterfeit detection and incidence fall within a small range of about
one note in 10,000 throughout countries where dollars are in circulation.
35
References
Allison, Theodore E. and Rosanna S. Pianalto, "The Issuance of Series-1996 $100 Federal Reserve Notes: Goals, Strategies, and Likely Results," Federal Reserve Bulletin 83:7 (July 1997), pp. 557-564.
American Bankers Association. “ABA Deposit Account Fraud Survey Report 2002.” Washington, D.C.: American Bankers Association, 2002.
Board of Governors of the Federal Reserve System, "Report to Congress on Funds Availability Schedules and Check Fraud at Depository Institutions", October 1996.
Economic Report of the President. Washington, D.C.: United States Government Printing Office, 2003.
Feige, Edgar L., "Overseas Holdings of U.S. Currency and the Underground Economy," in Susan Pozo, ed., Exploring the Underground Economy: Studies of Illegal and Unreported Activity (Kalamazoo, Michigan: W.E. Upjohn Institute for Employment Research, 1996), pp. 5-62.
Green, Edward J., and Warren E. Weber, "Will the New $100 Bill Decrease Counterfeiting?" Federal Reserve Bank of Minneapolis Quarterly Review, Summer 1996, pp. 3-10.
Judson, Ruth A., and Richard D. Porter, “Overseas Dollar Holdings: What Do We Know?” Wirtschaftspolitische Blatter 4 /2001.
Lengwiler, Yvan, "A Model of Money Counterfeits," Journal of Economics 65:2 (1997), pp. 123-132.
Parke, Darrel, and Laura Parker Gilles, A Comprehensive Assessment of U.S. Currency Quality, Age, and Cost Relationships (Washington, D.C.: Federal Reserve System), September 1991.
Porter, Richard D. and Ruth A. Judson, "The Location of U.S. Currency: How Much is Abroad?" Federal Reserve Bulletin 82:10 (October 1996), pp. 883-903. Addendum to the Treasury Audit Plan on the Uses and Counterfeiting of U.S. Currency, April 1997, Department of the Treasury.
Porter, Richard D., “Estimates of Foreign Holdings of U.S. Currency—An Approach Based on Relative Cross-Country Seasonal Variations,” in Nominal Income Targeting with the Monetary Base as Instrument: An Evaluation of McCallum’s Rule, Finance and Economics Discussion Series Working Study 1 (Board of Governors of the Federal Reserve System, March 1993).
36
37
————, “Foreign Holdings of U.S. Currency,” International Economic Insights (November/December 1993), p. 5.
————, and Ruth A. Judson, “The Location of U.S. Currency: How Much is Abroad?” Federal Reserve Bulletin 82:10 (October 1996), pp. 883–903.
Porter, Richard D., and Gretchen C. Weinbach, “Currency Ratios and U.S. Underground Activity,” Economics Letters 63:3 (June 1999), pp. 355-361.
U.S. Department of the Treasury, The Use and Counterfeiting of U.S. Currency Abroad (February 2000).
U.S. Department of the Treasury, The Use and Counterfeiting of U.S. Currency Abroad, part 2 (March 2003).