This article was downloaded by: [Moskow State Univ Bibliote] On: 15 February 2014, At: 22:16 Publisher: Taylor & Francis Informa Ltd Registered in England and Wales Registered Number: 1072954 Registered office: Mortimer House, 37-41 Mortimer Street, London W1T 3JH, UK International Journal of Remote Sensing Publication details, including instructions for authors and subscription information: http://www.tandfonline.com/loi/tres20 Estimating tropical forest biomass more accurately by integrating ALOS PALSAR and Landsat-7 ETM+ data Tyas Mutiara Basuki ab , Andrew K. Skidmore b , Yousif A. Hussin b & Iris Van Duren b a Forestry Research Institute of Solo, Jl. A. Yani, Pabelan, Solo, Indonesia b ITC – Geo-Information Science and Earth Observation, University of Twente, 7500 AA, Enschede, The Netherlands Published online: 05 Apr 2013. To cite this article: Tyas Mutiara Basuki, Andrew K. Skidmore, Yousif A. Hussin & Iris Van Duren (2013) Estimating tropical forest biomass more accurately by integrating ALOS PALSAR and Landsat-7 ETM+ data, International Journal of Remote Sensing, 34:13, 4871-4888, DOI: 10.1080/01431161.2013.777486 To link to this article: http://dx.doi.org/10.1080/01431161.2013.777486 PLEASE SCROLL DOWN FOR ARTICLE Taylor & Francis makes every effort to ensure the accuracy of all the information (the “Content”) contained in the publications on our platform. However, Taylor & Francis, our agents, and our licensors make no representations or warranties whatsoever as to the accuracy, completeness, or suitability for any purpose of the Content. Any opinions and views expressed in this publication are the opinions and views of the authors, and are not the views of or endorsed by Taylor & Francis. The accuracy of the Content should not be relied upon and should be independently verified with primary sources of information. Taylor and Francis shall not be liable for any losses, actions, claims, proceedings, demands, costs, expenses, damages, and other liabilities whatsoever or howsoever caused arising directly or indirectly in connection with, in relation to or arising out of the use of the Content. This article may be used for research, teaching, and private study purposes. Any substantial or systematic reproduction, redistribution, reselling, loan, sub-licensing, systematic supply, or distribution in any form to anyone is expressly forbidden. Terms &
Transcript
This article was downloaded by: [Moskow State Univ Bibliote]On: 15 February 2014, At: 22:16Publisher: Taylor & FrancisInforma Ltd Registered in England and Wales Registered Number: 1072954 Registeredoffice: Mortimer House, 37-41 Mortimer Street, London W1T 3JH, UK
International Journal of RemoteSensingPublication details, including instructions for authors andsubscription information:http://www.tandfonline.com/loi/tres20
Estimating tropical forest biomass moreaccurately by integrating ALOS PALSARand Landsat-7 ETM+ dataTyas Mutiara Basukiab, Andrew K. Skidmoreb, Yousif A. Hussinb &Iris Van Durenb
a Forestry Research Institute of Solo, Jl. A. Yani, Pabelan, Solo,Indonesiab ITC – Geo-Information Science and Earth Observation, Universityof Twente, 7500 AA, Enschede, The NetherlandsPublished online: 05 Apr 2013.
To cite this article: Tyas Mutiara Basuki, Andrew K. Skidmore, Yousif A. Hussin & Iris VanDuren (2013) Estimating tropical forest biomass more accurately by integrating ALOS PALSARand Landsat-7 ETM+ data, International Journal of Remote Sensing, 34:13, 4871-4888, DOI:10.1080/01431161.2013.777486
To link to this article: http://dx.doi.org/10.1080/01431161.2013.777486
PLEASE SCROLL DOWN FOR ARTICLE
Taylor & Francis makes every effort to ensure the accuracy of all the information (the“Content”) contained in the publications on our platform. However, Taylor & Francis,our agents, and our licensors make no representations or warranties whatsoever as tothe accuracy, completeness, or suitability for any purpose of the Content. Any opinionsand views expressed in this publication are the opinions and views of the authors,and are not the views of or endorsed by Taylor & Francis. The accuracy of the Contentshould not be relied upon and should be independently verified with primary sourcesof information. Taylor and Francis shall not be liable for any losses, actions, claims,proceedings, demands, costs, expenses, damages, and other liabilities whatsoever orhowsoever caused arising directly or indirectly in connection with, in relation to or arisingout of the use of the Content.
This article may be used for research, teaching, and private study purposes. Anysubstantial or systematic reproduction, redistribution, reselling, loan, sub-licensing,systematic supply, or distribution in any form to anyone is expressly forbidden. Terms &
International Journal of Remote Sensing, 2013Vol. 34, No. 13, 4871–4888, http://dx.doi.org/10.1080/01431161.2013.777486
Estimating tropical forest biomass more accurately by integratingALOS PALSAR and Landsat-7 ETM+ data
Tyas Mutiara Basukia,b*, Andrew K. Skidmoreb, Yousif A. Hussinb, and Iris Van Durenb
aForestry Research Institute of Solo, Jl. A. Yani, Pabelan, Solo, Indonesia; bITC – Geo-InformationScience and Earth Observation, University of Twente, 7500 AA, Enschede, The Netherlands
(Received 7 July 2011; accepted 21 December 2012)
Integration of multisensor data provides the opportunity to explore benefits emanatingfrom different data sources. A fusion between fraction images derived from spectralmixture analysis of Landsat-7 ETM+ and phased array L-band synthetic aperture radar(PALSAR) is introduced. The aim of this fusion is to improve the estimation accu-racy of above-ground biomass (AGB) in lowland mixed dipterocarp forest. Spectralmixture analysis was applied to decompose a mixture of spectral components ofLandsat-7 ETM+ into vegetation, soil, and shade fractions. These fraction images wereintegrated with PALSAR data using the discrete wavelet transform (DWT) and Broveytransform. As a comparison, spectral reflectance of Landsat-7 ETM+ was fused directlywith PALSAR data. Backscatter of horizontal–horizontal and horizontal–vertical polar-izations was also used to estimate AGB. Forest inventory was carried out in 77 randomlydistributed plots, the data being used for either model development or validation.A local allometric equation was applied to calculate AGB per plot. Regression mod-els were developed by integrating field measurements of 50 sample plots with remotelysensed data, e.g. fraction images, reflectance of Landsat-7 ETM+, and PALSAR data.The models developed were validated using 27 independent sample plots. The resultsshowed that not all fused images significantly improved the accuracy of AGB estima-tion. The model based on Brovey transform using the reflectance of Landsat-7ETM+and PALSAR produced an R2 of only 0.03–0.10. By contrast, fusion between PALSARdata and fraction images using Brovey transform improved the accuracy of R2 to0.33–0.46. Further improvement in the accuracy of estimating AGB was observed whenDWT was applied to integrate PALSAR with the reflectance of Landsat-7ETM+ (R2 =0.69–0.72) and PALSAR with fraction images (R2 = 0.70–0.75).
1. Introduction
Biomass estimation in tropical forests has become a topic of great interest because itscarbon stock forms part of the global carbon cycle. Forests can exchange carbon withthe atmosphere through forest degradation and deforestation (Luckman et al. 1998; Phat,Knorr, and Kim 2004) and forest regrowth (Luckman et al. 1998; Schimel et al. 2001). Theuse of optical and microwave remote sensing in combination with field measurements mayprovide a method to improve estimation of forest biomass over large areas (Rauste 2005).However, in biomass assessment, data derived from these sensors have both advantages anddisadvantages.
Optical sensors with medium spatial resolution, such as Landsat-7 ETM+, have multi-spectral bands in the visible, near infrared, middle infrared, and thermal infrared. Syntheticaperture radar (SAR) penetrates through surficial materials and vegetation canopies andcan provide information on surface roughness, volume, and mass of objects, as well asmoisture content. Optical sensors collect reflected solar energy which cannot penetrate intovegetation canopies, cloud, haze, and fog. Another disadvantage of optical medium spatialresolution imagery is that reflectance recorded by a sensor within a single pixel may bea combination of the reflectance by pure components on the ground surface in that pixel.Decomposition of pixels into their separate components followed by quantification of thevegetation fraction is a crucial step before employing these data for biomass estimation(Lu, Batistella, and Moran 2005). In tropical forests, the complex forest structure causescanopy shading, influencing vegetation reflectance captured by a sensor. This could havean affect on biomass estimation (Gemmell 1995; Steininger 2000).
The application of SAR to assess biomass offers opportunities for biomass estimation intropical regions where high cloud cover often occurs. Radar is an active microwave systemthat can work during both day and night, independent of solar energy. It can penetrate cloudsand record energy returned from surface features. Besides these advantages, SAR also haslimitations, such as in hilly regions, where no information is recorded at all in radar shadowareas (Trevett 1986).
SAR has been employed to assess biomass in different regions. For instance, it hasbeen applied in Australia to estimate biomass of eucalyptus forests (Austin, Mackey, andvan Nief 2003) and woody vegetation in the Southern Brigalow Belt, Central Queensland(Liang et al. 2005; Lucas et al. 2006), in Canada’s western sub-arctic and low arctic region(Chen et al. 2009), in pine forests in the USA (Hyde et al. 2007), and in the HuvsgulLake Basin, Mongolia, on taiga species (Tsolmon, Tateishi, and Tetuko 2002). In tropicalAmazon forests in Brazil, Kuplich, Curran, and Atkinson (2005) and Santos et al. (2003)have employed SAR for estimating forest biomass. Regarding its application in these trop-ical forests, the above-ground biomass (AGB) can be estimated with reasonable accuracyusing cross-polarized L- and P-band SAR imagery. However, saturation in biomass esti-mation is an important issue when computation is directly derived from simple regressionbetween AGB and coefficient backscatter. The shorter the wavelength, the faster the pointof saturation is reached (Kellndorfer et al. 2003; Lu 2006; Lucas et al. 2006). Luckmanet al. (1998) observed that backscatter of JERS-1 SAR through horizontal–horizontal (HH)polarization saturated at an AGB of around 60 t ha−1 in tropical forest. The point of satura-tion in biomass estimation is affected by wavelength (e.g. C, L, and P bands), polarization(e.g. HH, horizontal–vertical (HV), and vertical–vertical), incidence angle, and the charac-teristics of vegetation structure and ground conditions (Lu 2006; Lucas, Moghaddam, andCronin 2004; Rosenqvist et al. 2003; Saatchi et al. 2011). Fusion between remotely senseddata derived from optical and radar sensors may reduce the problems mentioned above andimprove the accuracy of biomass estimation in tropical forests (Lu, Batistella, and Moran2005; Rauste 2005).
Fusion uses an algorithm to integrate two or more different images to form a newimage (Pohl and Genderen 1998). The aim of fusion is to integrate spatial and spectralinformation (Acerbi-Junior, Clevers, and Schepmna 2006) and to provide complementaryinformation about a surface (Chibani 2006; Pajares and de la Cruz 2004). Fusion is alsoused to obtain better visual analysis and more accurate classification of land cover (Pradhanet al. 2006). Chavez, Sides, and Anderson (1991) highlighted some points to consider whenintegrating information from different sensors: digital images from both sensors should begeometrically corrected to match one another, the method applied to fuse the images should
Dow
nloa
ded
by [
Mos
kow
Sta
te U
niv
Bib
liote
] at
22:
16 1
5 Fe
brua
ry 2
014
International Journal of Remote Sensing 4873
not distort the spectral characteristics of the multispectral image, and the resulting imageshould have a high spatial resolution and similar spectral properties to the original image.
Various methods have been employed to fuse images. Standard methods include inten-sity hue saturation, principle component analysis, and Brovey transforms (Hussin andShaker 1996; Li, Kwok, and Wang 2002; Musa, Hussin, and Weir 2004; Wang et al. 2005).The standard fusion methods mentioned above tend to distort colour information (Amolins,Zhang, and Dare 2007), and sometimes the resulting image cannot preserve the spec-tral characteristics of the original multispectral data (Kumar, Kartikeyan, and Majumdar2000). A relatively new approach to fusing images is wavelet transform (Alparone et al.2004; Amolins, Zhang, and Dare 2007; Li, Kwok, and Wang 2002; Pradhan et al. 2006;Yunhao et al. 2006). Ranchin and Wald (2000) demonstrated that fusion based on wavelettransform could improve spatial resolution with minimum distortion of spectral character-istics of the original image. The basic concept of wavelet decomposition is to analyse thesignal according to different scales or resolutions (Martínez and Gilabert 2009). Waveletfusion decomposes high spatial and multispectral resolution into the same spatial resolu-tion by means of wavelet transform. Detailed information on high spatial resolution datais injected into a multispectral image (Amolins, Zhang, and Dare 2007). To integrate thedata, corresponding wavelet coefficients are combined, and the fused image is obtained byperforming inverse wavelet transform (Canty 2010; Li, Kwok, and Wang 2002; Ranchinand Wald 2000).
Fusion using wavelet transform has usually been applied to optical remotely sensed data(Lemeshewsky 1999; Ranchin and Wald 2000). It integrates panchromatic images of highspatial resolution with multispectral resolution images of low spatial resolution (Li, Kwok,and Wang 2002; Núñez et al. 1999; Shi et al. 2003). Recently, SAR has been fused withimages derived from optical sensors using wavelet transform (Alparone et al. 2004; Chibani2005, 2006; Simone et al. 2002). Fusion with this transform is commonly employed toenhance features in urban areas and for land-cover classification. Chibani (2005) enhancedthe detection of lines, edges, and field boundaries on RADARSAT images by fusing thisradar with panchromatic images of SPOT based on wavelet transform. Classification accu-racy increased when Cakir et al. (1999) conducted wavelet transform to integrate SPOTXS with SAR imagery, and Huang, Zhang, and Li (2008) fused Quick Bird with IKONOS.Based on the reviewed literature, the potential use of image fusion has not been exploredsufficiently for quantitative purposes, such as quantifying of forest biomass.
Based on the weaknesses of data derived from optical and microwave sensors as men-tioned above, as well as the lack of potential use of image fusion, an innovative approachto quantification of AGB is proposed. The objective of the research is to improve the accu-racy in estimating AGB in dipterocarp forests by integrating phased array L-band syntheticaperture radar (PALSAR) with Landsat-7 ETM+. The reason for fusing these data is thatPALSAR has longer wavelengths, can penetrate deeper into canopies, and has a higherspatial resolution than Landsat-7 ETM+ data. On the other hand, since optical data havemultispectral bands, combining these data types has the potential to achieve higher accu-racy in biomass estimation. An innovative approach in this research was that the spectralreflectance of Landsat-7 ETM+ was not directly fused with PALSAR data. Before fusing,the mixture of spectral components present in the pixels of the Landsat-7 ETM+ imagewas decomposed into vegetation, soil, and shade fractions using spectral mixture analysis.Then, the fraction images resulting from the decomposition were integrated with PALSARdata using Brovey and discrete wavelet transforms. For comparison, the spectral reflectanceof Landsat-7 ETM+ was directly fused with PALSAR data, and AGB was estimated usingbackscatter from HH and HV polarizations only.
Dow
nloa
ded
by [
Mos
kow
Sta
te U
niv
Bib
liote
] at
22:
16 1
5 Fe
brua
ry 2
014
4874 T.M. Basuki et al.
2. Methods
2.1. Study area
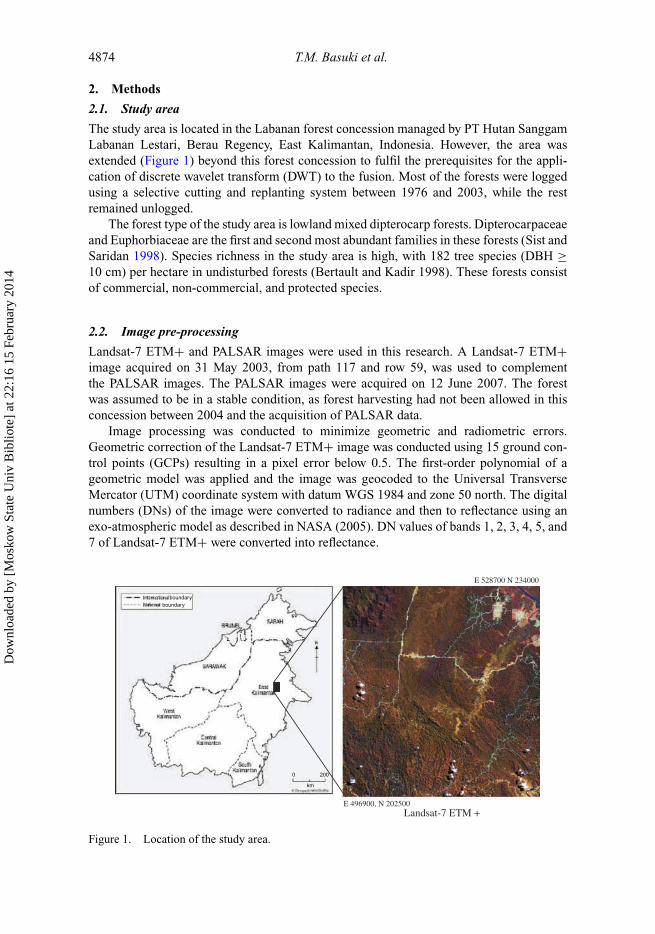
The study area is located in the Labanan forest concession managed by PT Hutan SanggamLabanan Lestari, Berau Regency, East Kalimantan, Indonesia. However, the area wasextended (Figure 1) beyond this forest concession to fulfil the prerequisites for the appli-cation of discrete wavelet transform (DWT) to the fusion. Most of the forests were loggedusing a selective cutting and replanting system between 1976 and 2003, while the restremained unlogged.
The forest type of the study area is lowland mixed dipterocarp forests. Dipterocarpaceaeand Euphorbiaceae are the first and second most abundant families in these forests (Sist andSaridan 1998). Species richness in the study area is high, with 182 tree species (DBH ≥10 cm) per hectare in undisturbed forests (Bertault and Kadir 1998). These forests consistof commercial, non-commercial, and protected species.
2.2. Image pre-processing
Landsat-7 ETM+ and PALSAR images were used in this research. A Landsat-7 ETM+image acquired on 31 May 2003, from path 117 and row 59, was used to complementthe PALSAR images. The PALSAR images were acquired on 12 June 2007. The forestwas assumed to be in a stable condition, as forest harvesting had not been allowed in thisconcession between 2004 and the acquisition of PALSAR data.
Image processing was conducted to minimize geometric and radiometric errors.Geometric correction of the Landsat-7 ETM+ image was conducted using 15 ground con-trol points (GCPs) resulting in a pixel error below 0.5. The first-order polynomial of ageometric model was applied and the image was geocoded to the Universal TransverseMercator (UTM) coordinate system with datum WGS 1984 and zone 50 north. The digitalnumbers (DNs) of the image were converted to radiance and then to reflectance using anexo-atmospheric model as described in NASA (2005). DN values of bands 1, 2, 3, 4, 5, and7 of Landsat-7 ETM+ were converted into reflectance.
Landsat-7 ETM + E 496900, N 202500
E 528700 N 234000
km
0 200
boundaryboundary
Figure 1. Location of the study area.
Dow
nloa
ded
by [
Mos
kow
Sta
te U
niv
Bib
liote
] at
22:
16 1
5 Fe
brua
ry 2
014
International Journal of Remote Sensing 4875
The PALSAR image was received in level 1.1, which is in a slant range projection. Itsspatial slant and azimuth resolutions were 9.50 m and 4.50 m, respectively. This L-bandimage had an incidence angle of 38.76◦, with like polarization (HH) and cross-polarization(HV). Conversion from slant range to ground projection was conducted using the AlaskaSatellite Facility (ASF) MapReady version 2.2.5. This free software (http://www.asf.alaska.edu/sardatacenter/softwaretools, accessed 8 November 2009) was also employed to correctterrain and radiometric distortions, as well as for geocoding. This image was radiomet-rically calibrated by converting amplitude values DNs into a power image in units of σ 0,which is the ratio between the power transmitted back from a patch of ground and that trans-mitted to it (Alaska Satellite Engineering Group, http://www.asf.alaska.edu/sardatacenter/softwaretools, accessed 8 November 2009). The conversion of DNs to σ 0 (in power scale)is given as
σ0 = a2(DN2 − a1Nr), (1)
where DN is the original pixel value, N r is the noise as a function of range, a1 is the noisescale factor, and a2 is the linear conversion determined during calibration of the processor.The σ 0 amplitude values act as independent variables in the prediction of AGB (Fransson,Walter, and Ulander 2000).
SAR is acquired in a lateral direction and induces distortions of rough terrain in theimage such as foreshortening, shadow, and layover. In this case, terrain correction was car-ried out to minimize these distortions. The image was corrected using heights obtained froma digital elevation model (DEM). The DEM had a 30 m spatial resolution and was derivedfrom ASTER data freely downloaded from http://www.gdem.aster.ersdac.or.jp (accessed10 November 2009). Radiometry of the PALSAR was corrected using local incidenceangles derived from the DEM. Kellndorfer, Pierce, and Dobson (1998) formulated thisas follows:
σcorr = σorig sin(αDEM)/ sin(αELL), (2)
where σ corr is the radar backscatter coefficient corrected for local incidence angle, σ orig isthe original backscatter coefficient, αELL is the incidence angle measured from the ellipsoid,and αDEM is the actual incidence angle calculated from the DEM.
The image was geocoded into the UTM coordinate system with datum WGS 1984 andzone 50 N. It was resampled using the nearest neighbour method to produce an image witha spatial resolution of 16 m. This was a requirement for the wavelet analysis, as explainedin the next section. In order to fuse the images, PALSAR was registered to LANDSAT-7 ETM+ by a second-order polynomial. The errors in the x and y directions were 4.71 and4.60 m, respectively, with a total root mean squared error (RMSE) of 6.58 m.
2.3. Spectral mixture analysis
For remotely sensed data with medium resolution such as Landsat-7 ETM+, a signal fromwithin a pixel recorded by the sensor could be a combination of the reflectance from allcomponent endmembers on the earth’s surface covered by that pixel. An endmember is apure spectral component (Adams and Gillespie 2006). Spectral mixture analysis decom-poses mixture endmembers. In spectral mixture analysis, it is assumed that a pixel in eachspectral band is linear combinations of multiple components weighted by relative surfaceabundance and is expressed as (Tompskins et al. 1997)
where Rb is the reflectance of a pixel at band b, fi is the fractional abundance of endmemberi (from a total of m endmembers), rib is the reflectance at band b of endmember i, and Eb isthe error in band b of the model fit.
Reflectance bands 1, 2, 3, 4, 5, and 7 of Landsat 7 ETM+ were transformed usingminimum noise fraction. The transformed image was used to determine the most spec-trally pure pixel, using the pixel purity index (Boardman, Kruse, and Green 1995). Pixelshaving high purity index values were used to identify the location of sample endmemberson the original image (Souza, Roberts, and Cocrane 2005). In addition, sample endmem-bers were also identified by their location on the extremes of the image feature space (Lu,Batistella, and Moran 2005). The sample endmembers selected were used to decomposethe mixed spectral reflectance of the original image and produce fraction images consistingof vegetation, soil, shade, and error fractions. All of the procedures for the spectral mix-ture analysis mentioned above were run using Environment for Visualizing Images (ENVI)4.7 and Interactive Data Language (IDL) 7.1 software (EXELIS 2013). Only forest areaswere used for further analysis, whereas water bodies, settlements, shrubs, and roads weremasked out.
2.4. The Brovey transform
The Brovey transform is intended to produce red, green, and blue images; therefore onlythree bands at a time should be merged from the input multispectral data (Leica Geosystem2008). To choose three bands for the Brovey transform, a correlation analysis betweeneach band of Landsat-7 ETM+ with AGB was carried out. The three bands of Landsat-7 ETM+ with the highest correlation to AGB were employed to fuse with the HH and HVpolarizations of the PALSAR images. In addition, the fraction images (vegetation, soil, andshade) resulting from spectral mixture analysis were also used as input in this fusion. Theformulas (modified from Leica Geosystem 2008) are
where B1, B2, and B3 are bands of the Landsat-7 ETM+ or fraction images, the high-resolution image is HH and HV polarization of PALSAR, and B1_new, B2_new, andB3_new are the bands resulting from Brovey transform. The algorithm of the Brovey trans-form is simple, and it can improve visual interpretation of images, although it may distortreflectance when applied to image fusion.
2.5. DWT and its application to image fusion
A wavelet is a local wavelike function and its transform is a convolution of the waveletfunction with a signal (Addison 2002). During decomposition, the wavelet may be moved
Dow
nloa
ded
by [
Mos
kow
Sta
te U
niv
Bib
liote
] at
22:
16 1
5 Fe
brua
ry 2
014
International Journal of Remote Sensing 4877
along the signal (translated) and be stretched or squeezed (dilated) (Addison 2002; Mallat1989). Basically, wavelet transform quantifies the matching of the wavelet with the signalat different locations and scales (Addison 2002; Pittiglio et al. 2012). A strongly positivewavelet coefficient will be produced if the wavelet matches the shape of the signal, whilein contrast a strongly negative coefficient will be obtained if the wavelet and signal areout of phase (Addison 2002; Pittiglio et al. 2012). In addition, the transform yields a lowcoefficient if the wavelet and signal do not coincide.
DWT transforms signals over a discrete set of scales, and the transforms can be realizedusing a variety of fast algorithms and customized hardware (Bruce, Morgan, and Larsen2001; Pu and Gong 2004). An application of DWT for image fusion can be illustrated asa bank of filters, where at every level of decomposition the signal is split into high- andlow-frequency components. Further decomposition can be applied to the low-frequencycomponents until the desired resolution is reached, as explained in detail by Mallat (1989),Strang and Nguyen (1997), Shensa (1992), and Amolins, Zhang, and Dare (2007). Theoriginal image can be reconstructed by inverse transformation of all of the componentsof each deconstructed level in turn, starting from the coarsest spatial resolution (Amolins,Zhang, and Dare 2007).
A prerequisite for the DWT is that the transform convolves the data by a factor of2n for the integer of n (Addison 2002; Canty 2010). Four quadrants are generated fromevery spatial resolution level of decomposition (Chibani and Houacine 2003; Canty 2010).These quadrants consist of one approximate image (low resolution and a reproduction ofthe original), and three detailed images (horizontal, vertical, and diagonal detail) (Chibaniand Houacine 2003; Pittiglio et al. 2012).
In image fusion, detailed information from one image (with high spatial resolution)can be extracted and injected into low spatial resolution or multispectral resolution images(Chibani 2005; Amolins, Zhang, and Dare 2007). The details of an image generally charac-terize different physical structures of the scene (Mallat 1989); therefore, the resulting fusedimage contains information complementary to the fine and coarse resolution images. In thisstudy, the PALSAR image is a high spatial resolution image and the Landsat-7 ETM+image, as well as the fraction images resulting from spectral mixture analysis, are multi-spectral images with low spatial resolution. The orthogonal wavelet transform was appliedto the PALSAR image, the original reflectance of the Landsat-7 ETM+ data, and to theimage resulting from spectral mixture analysis. PALSAR was downscaled twice and thedata from the optical remotely sensed data were decomposed once to achieve 64 m spatialresolution. Images from PALSAR were fused with the optical remotely sensed imagery.Finally, an inverse transform was applied to reconstruct a fused image with high spatialresolution. A weighted model was employed in the inverse transform (Amolins, Zhang,and Dare 2007; Canty 2010) using the equation
CZoptical = aZ × CZ
PALSAR + bZ , for Z = D, V, and H, (7)
where CZoptical is the optical remotely sensed imagery with information injected, CZ
PALSAR
is the detailed image of PALSAR, aZ is the mean of the optical remotely sensed data, bZ isthe standard deviation of the PALSAR data, and D, V, and H are the diagonal, vertical, andhorizontal directions, respectively.
The wavelet transform can be applied to describe and characterize spatial pattern inan ecological system, such as forest canopy structure (Bradshaw and Spies 1992). Anotheradvantage of this method is that the magnitude of the signal can be directly related to its
Dow
nloa
ded
by [
Mos
kow
Sta
te U
niv
Bib
liote
] at
22:
16 1
5 Fe
brua
ry 2
014
4878 T.M. Basuki et al.
position in the image (Pittiglio et al. 2012). Besides the advantages, however, the wavelettransform has one disadvantage: it cannot detect a dominant pattern smaller than theoriginal pixel size (Strand et al. 2006).
2.6. Forest inventory
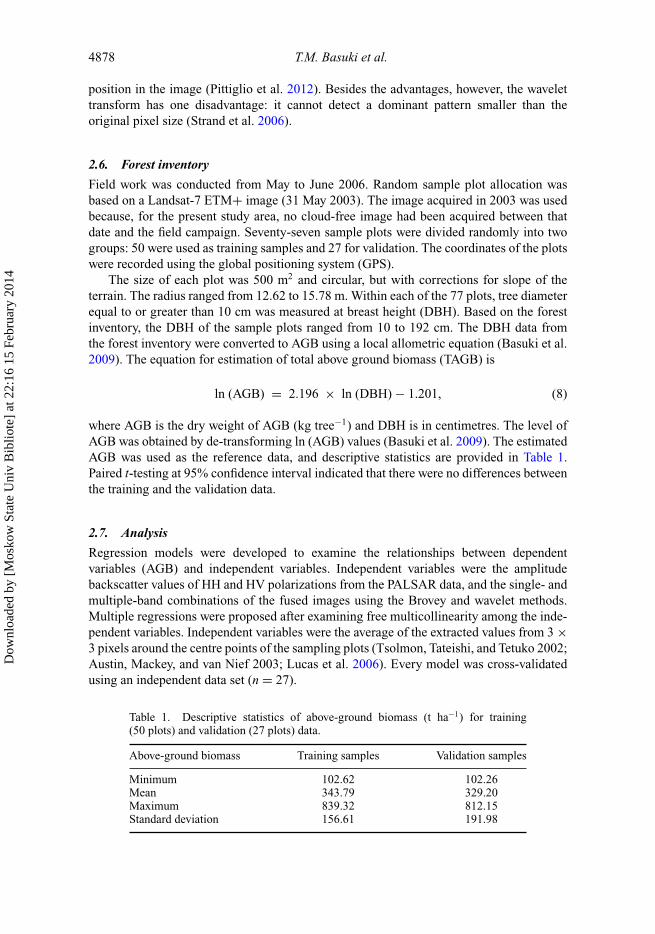
Field work was conducted from May to June 2006. Random sample plot allocation wasbased on a Landsat-7 ETM+ image (31 May 2003). The image acquired in 2003 was usedbecause, for the present study area, no cloud-free image had been acquired between thatdate and the field campaign. Seventy-seven sample plots were divided randomly into twogroups: 50 were used as training samples and 27 for validation. The coordinates of the plotswere recorded using the global positioning system (GPS).
The size of each plot was 500 m2 and circular, but with corrections for slope of theterrain. The radius ranged from 12.62 to 15.78 m. Within each of the 77 plots, tree diameterequal to or greater than 10 cm was measured at breast height (DBH). Based on the forestinventory, the DBH of the sample plots ranged from 10 to 192 cm. The DBH data fromthe forest inventory were converted to AGB using a local allometric equation (Basuki et al.2009). The equation for estimation of total above ground biomass (TAGB) is
ln (AGB) = 2.196 × ln (DBH) − 1.201, (8)
where AGB is the dry weight of AGB (kg tree−1) and DBH is in centimetres. The level ofAGB was obtained by de-transforming ln (AGB) values (Basuki et al. 2009). The estimatedAGB was used as the reference data, and descriptive statistics are provided in Table 1.Paired t-testing at 95% confidence interval indicated that there were no differences betweenthe training and the validation data.
2.7. Analysis
Regression models were developed to examine the relationships between dependentvariables (AGB) and independent variables. Independent variables were the amplitudebackscatter values of HH and HV polarizations from the PALSAR data, and the single- andmultiple-band combinations of the fused images using the Brovey and wavelet methods.Multiple regressions were proposed after examining free multicollinearity among the inde-pendent variables. Independent variables were the average of the extracted values from 3 ×3 pixels around the centre points of the sampling plots (Tsolmon, Tateishi, and Tetuko 2002;Austin, Mackey, and van Nief 2003; Lucas et al. 2006). Every model was cross-validatedusing an independent data set (n = 27).
Table 1. Descriptive statistics of above-ground biomass (t ha−1) for training(50 plots) and validation (27 plots) data.
Above-ground biomass Training samples Validation samples
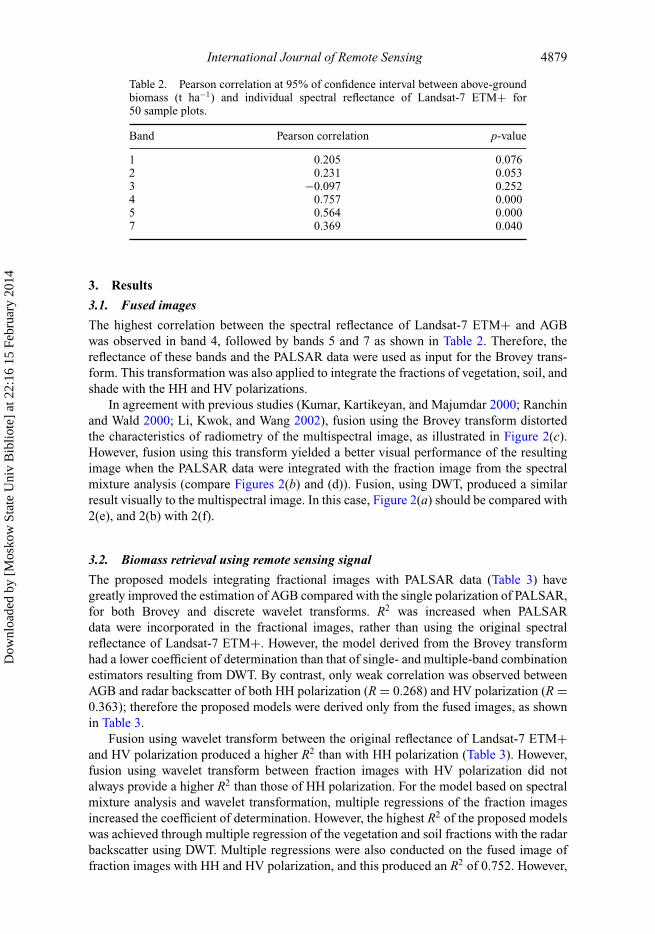
Table 2. Pearson correlation at 95% of confidence interval between above-groundbiomass (t ha−1) and individual spectral reflectance of Landsat-7 ETM+ for50 sample plots.
The highest correlation between the spectral reflectance of Landsat-7 ETM+ and AGBwas observed in band 4, followed by bands 5 and 7 as shown in Table 2. Therefore, thereflectance of these bands and the PALSAR data were used as input for the Brovey trans-form. This transformation was also applied to integrate the fractions of vegetation, soil, andshade with the HH and HV polarizations.
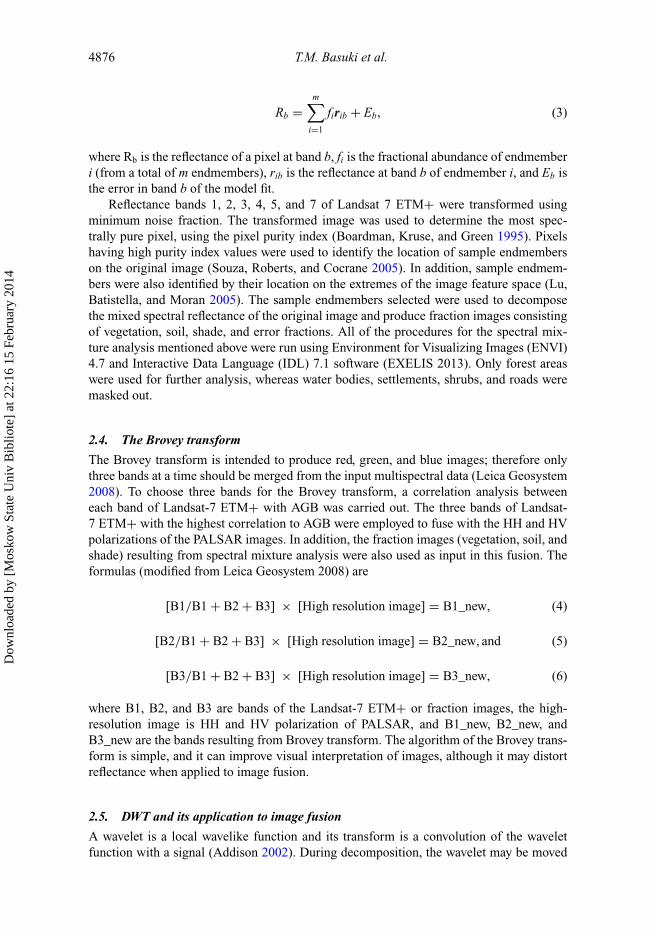
In agreement with previous studies (Kumar, Kartikeyan, and Majumdar 2000; Ranchinand Wald 2000; Li, Kwok, and Wang 2002), fusion using the Brovey transform distortedthe characteristics of radiometry of the multispectral image, as illustrated in Figure 2(c).However, fusion using this transform yielded a better visual performance of the resultingimage when the PALSAR data were integrated with the fraction image from the spectralmixture analysis (compare Figures 2(b) and (d)). Fusion, using DWT, produced a similarresult visually to the multispectral image. In this case, Figure 2(a) should be compared with2(e), and 2(b) with 2(f).
3.2. Biomass retrieval using remote sensing signal
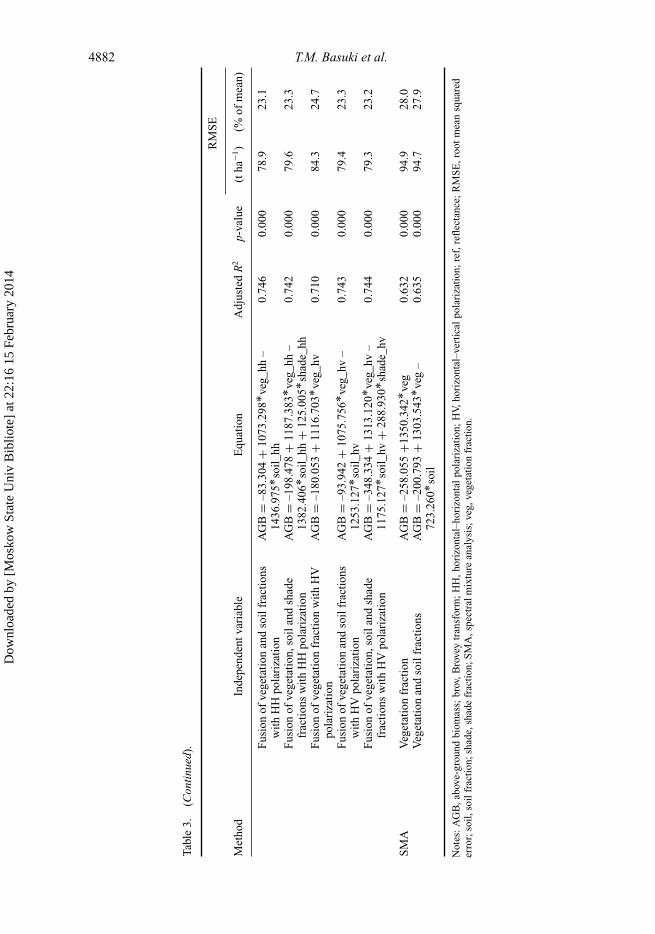
The proposed models integrating fractional images with PALSAR data (Table 3) havegreatly improved the estimation of AGB compared with the single polarization of PALSAR,for both Brovey and discrete wavelet transforms. R2 was increased when PALSARdata were incorporated in the fractional images, rather than using the original spectralreflectance of Landsat-7 ETM+. However, the model derived from the Brovey transformhad a lower coefficient of determination than that of single- and multiple-band combinationestimators resulting from DWT. By contrast, only weak correlation was observed betweenAGB and radar backscatter of both HH polarization (R = 0.268) and HV polarization (R =0.363); therefore the proposed models were derived only from the fused images, as shownin Table 3.
Fusion using wavelet transform between the original reflectance of Landsat-7 ETM+and HV polarization produced a higher R2 than with HH polarization (Table 3). However,fusion using wavelet transform between fraction images with HV polarization did notalways provide a higher R2 than those of HH polarization. For the model based on spectralmixture analysis and wavelet transformation, multiple regressions of the fraction imagesincreased the coefficient of determination. However, the highest R2 of the proposed modelswas achieved through multiple regression of the vegetation and soil fractions with the radarbackscatter using DWT. Multiple regressions were also conducted on the fused image offraction images with HH and HV polarization, and this produced an R2 of 0.752. However,
Dow
nloa
ded
by [
Mos
kow
Sta
te U
niv
Bib
liote
] at
22:
16 1
5 Fe
brua
ry 2
014
4880 T.M. Basuki et al.
(a) (b)
(c) (d)
(e) (f)
Figure 2. Original Landsat-7 ETM+ image (a); fraction image resulting from spectral mixtureanalysis (b); fusion of HV polarization of PALSAR with reflectance of bands 4, 5, and 7 of Landsat-7 ETM+ using the Brovey transform (c); fraction image resulting from spectral mixture analysisusing Brovey transform (d); reflectance of Landsat-7 ETM+ using discrete wavelet transform (e);and fraction image resulting from spectral mixture analysis using discrete wavelet transform (f ).
due to multicollinearity between those fractions, the model was excluded. Table 3 alsoshows the models based on fraction images derived from spectral mixture analysis. Thisis to provide a clearer comparison between models based on fusion and those based onnon-fusion images.
Validation was tested using 27 sample plots of independent data for the fused images.Although the model based on the fusion of fractional images with HV polarization usingthe Brovey transform has a fair correlation with AGB (R2 = 0.461), validation using theindependent data set yielded a high RMSE (Table 4). Compared with the models based onBrovey transform, those based on fraction images reduced the RMSE of the validation from28% to 35%.
Dow
nloa
ded
by [
Mos
kow
Sta
te U
niv
Bib
liote
] at
22:
16 1
5 Fe
brua
ry 2
014
International Journal of Remote Sensing 4881
Tabl
e3.
Reg
ress
ion
mod
els
at95
%of
confi
denc
ein
terv
albe
twee
nfu
sed
imag
es(s
pect
ralr
eflec
tanc
eof
Lan
dsat
-7E
TM
+or
frac
tion
imag
esan
dPA
LS
AR
data
)an
dab
ove-
grou
ndbi
omas
s(t
ha−1
)us
ing
50sa
mpl
epl
ots.
RM
SE
Met
hod
Inde
pend
entv
aria
ble
Equ
atio
nA
djus
ted
R2
p-va
lue
(tha
−1)
(%of
mea
n)
Bro
vey
tran
sfor
mF
usio
nof
refl
ecta
nce
band
s4,
5,an
d7
wit
hH
Hpo
lari
zati
on−
0.03
10.
220
154.
245
.2
Fus
ion
ofre
flec
tanc
eba
nds
4,5,
and
7w
ith
HV
pola
riza
tion
−0.
101
0.04
914
8.5
43.4
Fus
ion
ofve
geta
tion
,soi
l,an
dsh
ade
frac
tion
sw
ith
HH
pola
riza
tion
AG
B=
167.
654
+23
63.8
02br
ov_
veg_
soil
_sha
de_h
h0.
332
0.00
012
8.0
37.8
Fus
ion
ofve
geta
tion
,soi
l,an
dsh
ade
frac
tion
sw
ith
HV
pola
riza
tion
AG
B=
123.
910
+16
014.
500b
rov_
veg_
soil
_sha
de_h
v0.
461
0.00
011
4.9
33.9
Dis
cret
ew
avel
ettr
ansf
orm
Fus
ion
ofre
flec
tanc
eba
nd4
wit
hH
Hpo
lari
zati
onA
GB
=–1
352.
896
+71
62.0
91*
ref4
_hh
0.69
10.
000
87.1
25.5
Fus
ion
ofre
flec
tanc
eba
nds
4,5,
and
7w
ith
HH
pola
riza
tion
AG
B=
–143
9.98
4+7
683.
668*
ref4
hh+
1968
.451
*re
f5_h
h–
7439
.332
*re
f7_h
h0.
699
0.00
085
.925
.2
Fus
ion
ofre
flec
tanc
eba
nds
1,2,
3,4,
5,an
d7
wit
hH
Hpo
lari
zati
onA
GB
=–2
52.8
22–9
358.
546*
ref1
_hh
–39
10.3
56*
ref2
_hh
–82
60.8
23*
ref3
_hh
+80
05.9
90*
ref4
_hh
–65
53.9
68*
ref5
_hh
–50
97.6
23*
ref7
_hh
0.70
20.
000
85.5
25.1
Fus
ion
ofre
flec
tanc
eba
nd4
wit
hH
Vpo
lari
zati
onA
GB
=–1
353.
881
+71
43.9
04*
ref4
_hv
0.72
00.
000
82.8
24.3
Fus
ion
ofre
flec
tanc
eba
nds
4,5,
and
7w
ith
HV
pola
riza
tion
AG
B=
–132
.133
+82
01.9
65*
ref4
_hv
–23
56.0
26*
ref5
_hv
–18
16.3
64*
ref7
_hv
0.71
90.
000
83.0
24.3
Fus
ion
ofre
flec
tanc
eba
nds
1,2,
3,4,
5an
d7
wit
hH
Vpo
lari
zati
onA
GB
=–9
40.1
70–
(645
9.23
7*re
f1_h
v)+(
5211
.665
*re
f2_h
v)–(
5577
.381
*re
f3_h
v)+
8085
.999
*re
f4_h
v–1
687.
023*
ref5
_hv
–88
1.40
6*re
f7_h
v
0.71
10.
000
84.2
24.7
Fus
ion
ofve
geta
tion
frac
tion
wit
hH
Hpo
lari
zati
onA
GB
=–1
91.7
64+
1152
.929
*ve
g_hh
0.70
40.
000
85.3
25.0
(Con
tinu
ed)
Dow
nloa
ded
by [
Mos
kow
Sta
te U
niv
Bib
liote
] at
22:
16 1
5 Fe
brua
ry 2
014
4882 T.M. Basuki et al.
Tabl
e3.
(Con
tinu
ed).
RM
SE
Met
hod
Inde
pend
entv
aria
ble
Equ
atio
nA
djus
ted
R2
p-va
lue
(tha
−1)
(%of
mea
n)
Fus
ion
ofve
geta
tion
and
soil
frac
tion
sw
ith
HH
pola
riza
tion
AG
B=
–83.
304
+10
73.2
98*
veg_
hh–
1436
.975
*so
il_h
h0.
746
0.00
078
.923
.1
Fus
ion
ofve
geta
tion
,soi
land
shad
efr
acti
ons
wit
hH
Hpo
lari
zati
onA
GB
=–1
98.4
78+
1187
.383
*ve
g_hh
–13
82.4
06*
soil
_hh
+12
5.00
5*sh
ade_
hh0.
742
0.00
079
.623
.3
Fus
ion
ofve
geta
tion
frac
tion
wit
hH
Vpo
lari
zati
onA
GB
=–1
80.0
53+
1116
.703
*ve
g_hv
0.71
00.
000
84.3
24.7
Fus
ion
ofve
geta
tion
and
soil
frac
tion
sw
ith
HV
pola
riza
tion
AG
B=
–93.
942
+10
75.7
56*
veg_
hv–
1253
.127
*so
il_h
v0.
743
0.00
079
.423
.3
Fus
ion
ofve
geta
tion
,soi
land
shad
efr
acti
ons
wit
hH
Vpo
lari
zati
onA
GB
=–3
48.3
34+
1313
.120
*ve
g_hv
–11
75.1
27*
soil
_hv
+28
8.93
0*sh
ade_
hv0.
744
0.00
079
.323
.2
SM
AV
eget
atio
nfr
acti
onA
GB
=–2
58.0
55+1
350.
342*
veg
0.63
20.
000
94.9
28.0
Veg
etat
ion
and
soil
frac
tion
sA
GB
=–2
00.7
93+
1303
.543
*ve
g–
723.
260*
soil
0.63
50.
000
94.7
27.9
Not
es:
AG
B,a
bove
-gro
und
biom
ass;
brov
,Bro
vey
tran
sfor
m;
HH
,hor
izon
tal–
hori
zont
alpo
lari
zati
on;
HV,
hori
zont
al–v
erti
cal
pola
riza
tion
;re
f,re
flec
tanc
e;R
MS
E,r
oot
mea
nsq
uare
der
ror;
soil
,soi
lfra
ctio
n;sh
ade,
shad
efr
acti
on;S
MA
,spe
ctra
lmix
ture
anal
ysis
;veg
,veg
etat
ion
frac
tion
.
Dow
nloa
ded
by [
Mos
kow
Sta
te U
niv
Bib
liote
] at
22:
16 1
5 Fe
brua
ry 2
014
International Journal of Remote Sensing 4883
Table 4. Validation using an independent data set from 27 plots.
RMSE
Method Independent variable (t ha−1) mean (%)
Brovey transform Fusion of vegetation, soil, and shadefractions with HH polarization
200.92 59.3
Fusion of vegetation, soil, and shadefractions with HV polarization
188.39 55.6
Discrete wavelettransform
Fusion of reflectance band 4 with HHpolarization
123.5 36.5
Fusion of reflectance bands 4, 5, and7 with HH polarization
118.3 34.9
Fusion of reflectance bands 1, 2, 3, 4, 5,and 7 with HH polarization
117.3 34.6
Fusion of reflectance band 4 with HVpolarization
120.0 35.4
Fusion of reflectance bands 4, 5, and7 with HV polarization
119.0 35.1
Fusion of reflectance bands 1, 2, 3, 4, 5,and 7 with HV polarization
117.0 34.5
Fusion of vegetation fraction with HHpolarization
117.0 34.5
Fusion of vegetation and soil fractionswith HH polarization
122.7 36.2
Fusion of vegetation, soil, and shadefractions with HH polarization
122.9 36.3
Fusion of vegetation fraction with HVpolarization
118.6 35.0
Fusion of vegetation and soil fractionswith HV polarization
121.2 35.8
Fusion of vegetation, soil, and shadefractions with HV polarization
127.7 37.7
Spectral mixtureanalysis
Vegetation fraction 130.5 38.5
Vegetation and soil fractions 135.6 40.1
4. Discussion
Overall, the proposed regression models using the fusion of fraction images improved theestimation accuracy of AGB more than fused images using the original spectral reflectance.This shows that the proportion of mixed spectral components (e.g. vegetation, soil, andshade) should be computed before integration with the PALSAR data in order to achievehigher accuracy of AGB estimation. Separation of the mixed spectral component is essen-tial because most study areas are forests that have previously been logged. In selectivelylogged forests the ground is not totally covered by trees. Such logged forests are a mix ofvegetation, soil, and shade, and on medium-resolution imagery these spectral componentsare also mixed. For example, Vega (2005) found that felling a single tree in such forests cre-ated a gap ranging from 30% to 100% for pixels with a resolution of 15 m. Within this gap,reflectance from the soil may be mixed with that from the surrounding trees and recordedwithin a pixel by the sensor.
Fusion using DWT improves the estimation accuracy of AGB. This indicates that thedata from these two sensors complement each other and that their integration is beneficial.
Dow
nloa
ded
by [
Mos
kow
Sta
te U
niv
Bib
liote
] at
22:
16 1
5 Fe
brua
ry 2
014
4884 T.M. Basuki et al.
Landsat-7 ETM+, with its multispectral bands, provides information on different proper-ties of the Earth’s surface. For instance, the near-infrared band is useful to detect vegetationwith its high reflectance. The information from these multispectral bands is complementedby PALSAR data. The benefit of using the L- band of PALSAR is not only its ability topenetrate deeper into the canopy, but also the nature of SAR data showing multiple scatter-ing within the canopy. Penetration of microwave radiation into the canopy depends on thewavelength and type of polarization (Balzter et al. 2003).
In addition to the above explanation, the wavelet method preserves high- and low-frequency features during spectral decomposition, which means that variation in AGBdirectly causes change in spectral characteristics, i.e. change in the peaks and valleysalong the spectral curve (Pu and Gong 2004). The weaker relationship between total AGBand independent variables extracted from the fused image using the Brovey transform iscaused by the algorithm used to enhance the visual interpretation of the combination ofred, green, and blue (Wang et al. 2005). Colour distortion can occur if the Brovey trans-form is employed to fuse multisensor data with large differences in spectral range (Alparoneet al. 2004). With respect to the integration data, it can be seen that fusion does not alwaysimprove the resulting image as the AGB estimator: this depends on the method applied tointegrate data. In the present study, the Brovey transform was unable to properly integratethe advantages of PALSAR and Landsat-7 ETM+ to the fused image. Therefore, modelsbased on fusion between PALSAR and fraction images using the Brovey transform cannotproduce higher R2 compared with the model based only on fraction images.
Using data from single polarization, HV produced higher correlation with AGB thandid HH polarization. Most HH polarization responses consist of surface scattering, whileHV reflects volumetric multiple scattering. Therefore, cross-polarized data are respondingto volume and biomass, especially with the L-band, since they penetrate the forest canopy(Lucas et al. 2006).
Regarding the application of a single L-band from SAR data, Luckman et al. (1998)found that the HH-polarized L-band of JERS-1 SAR saturated at a total AGB of 60 t ha−1 inAmazon forests in Brazil. In woodland areas in Queensland, Australia, Lucas et al. (2006)observed that the maximum saturation level for HH and HV polarization of the L-bandwas 75–80 and 98 t ha−1, respectively. Higher levels of saturation were encountered byWang and Qi (2008) when applying a modified radiative transfer model using the L-bandof JERS-1 SAR in dense moist evergreen forests. By removing leaf contribution from thebackscattering coefficient, the saturation level increased. Using this model, the increase inwoody backscatter was not reduced until biomass reached 100 t ha−1. After that point, theincrease in woody backscatter was reduced but biomass still increased to around –8 dB atabout 500 t ha−1 of total AGB.
When applied to independent data, the RMSE of the proposed regression models basedon DWT ranged from 117 to 128 t ha−1 (35–38%) of mean AGB. The RMSE of the vali-dation data was higher than in the regression models, as shown in Tables 3 and 4; possibleexplanations are differences in species composition and stand density among sample plots.Those differences may have led to two sample plots with similar levels of AGB to demon-strate different reflectance. In comparison, Lefsky et al. (2005) also found an RMSE of118.5 t ha−1 when estimating AGB using a light detection and ranging image. Saachi et al.(2011) found that the estimation accuracy of AGB was affected by the size of sample plots,the type of wavelength and polarization, and the use of interferometric SAR (InSAR) tomeasure tree height. At a maximum AGB of 300 t ha−1, the RMSE of the validation usingthe L-band with full polarization (HH, HV, and VV) was 39.5 and 33.1 t ha−1 for sampleplots of 0.50 and 1.0 ha, respectively, and for the full polarization integrated with the InSAR
Dow
nloa
ded
by [
Mos
kow
Sta
te U
niv
Bib
liote
] at
22:
16 1
5 Fe
brua
ry 2
014
International Journal of Remote Sensing 4885
at the same plot size, RMSE was 30.8 and 29.0 t ha−1, respectively (Saachi et al. 2011).For the P-band with the same maximum AGB and 0.5 ha of the sample plot, the obtainedRMSEs were 26.6 and 20.2 ton ha−1 and for 1.0 ha of sample plot the RMSEs were 19.9 and15.1 ton ha−1 for full polarization and full polarization integrated with InSAR, respectively.For the current study area, further study to reduce the RMSE of estimated AGB could beconducted by increasing the size of sample plot, the use of P-bands, or integration with theInSAR.
5. Conclusions
The proposed model shows the potential use of PALSAR data when integrated withLandsat-7 ETM+ or fraction images. DWT qualitatively and quantitatively improved theperformance of the model. Fusion using DWT visually provides similar results to mul-tispectral images. The integration of radar and optical imagery increased the estimationaccuracy of AGB in mixed dipterocarp forest. The proposed models fused fraction imageswith PALSAR data, thereby significantly increasing the coefficient of determination com-pared with models based only on radar backscatter. The proposed regression modelsusing DWT have a lower RMSE (by 18–25%) compared with the Brovey transform whenapplied to the independent data set. The current regression models also reduced RMSE (by10–12%) compared with the model derived only from spectral mixture analysis.
AcknowledgementsWe thank B.T. Sasongko, Bogor Agriculture University, for helpful discussions on PALSAR. Theauthors are grateful to Dr M.J. Canty for the DWT script, W. Nieuwenhuis for technical assistance,and my colleague, Claudia Pittiglio, for an in-depth discussion on wavelet theory. This research wassupported by a grant from The Netherlands Fellowship Programme (NFP).
ReferencesAcerbi-Junior, F. W., J. G. P. Clevers, and M. E. Schepmna. 2006. “The Assessment of Multi-Sensor
Image Fusion Using Wavelet Transforms for Mapping the Brazilian Savanna.” InternationalJournal of Applied Earth Observation and Geoinformation 8: 278–288.
Adams, J. B., and A. R. Gillespie. 2006. Remote Sensing of Landscapes with Spectral Images: APhysical Modeling Approach, 126–164. London: Cambridge University Press.
Addison, P. S. 2002. The Illustrated Wavelet Transform Handbook. Introductory Theory andApplications in Science, Engineering, Medicine and Finance, 1–91. London: Institute of Physics.
Alparone, L., S. Baronti, A. Garzelli, and F. Nencini. 2004. “Landsat ETM+ and SAR Image FusionBased on Generalized Intensity Modulation.” IEEE Transactions on Geoscience and RemoteSensing 42: 2832–2839.
Amolins, K., Y. Zhang, and P. Dare. 2007. “Wavelet Based Image Fusion Techniques—anIntroduction, Review and Comparison.” ISPRS Journal of Photogrammetric and Remote Sensing62: 249–263.
Austin, J. M., B. G. Mackey, and K. P. van Nief. 2003. “Estimating Forest Biomass Using SatelliteRadar: An Exploratory Study in a Temperate Australian Eucalyptus Forest.” Forest Ecology andManagement 176: 5755–5783.
Balzter, H., L. Skinner, A. Luckman, and R. Brooke. 2003. “Estimation of Tree Growth in a ConiferPlantation over 19 Years from Multi-Satellite L-Band SAR.” Remote Sensing of Environment 84:184–191.
Basuki, T. M., P. E. van Laake, A. K. Skidmore, and Y. A. Hussin. 2009. “Allometric Equationsfor Estimating the Above-Ground Biomass in Tropical Lowland Dipterocarp Forests.” ForestEcology and Management 257: 1684–1694.
Bertault, J., and K. Kadir, K. 1998. Silvicultural Research in a Lowland Mixed Dipterocarp Forest ofEast Kalimantan: The Contribution of STREK Project. Bogor, Indonesia: CIRAD Forêt, FORDAand P.T. Inhutani I.
Boardman, J. M., F. A. Kruse, and R. O. Green. 1995. “Mapping Target Signature via PartialUnmixing of AVIRIS Data.” Summaries of the Fifth JPL Airborne Earth Science Workshop. JPL,95, 23–26.
Bradshaw, G. A., and T. Spies. 1992. “Characterizing Canopy Gap Structure in Forests Using WaveletAnalysis.” Journal of Ecological Society 80: 205–215.
Bruce, L. M., C. Morgan, and S. Larsen. 2001. “Automated Detection of Subpixel HyperspectralTargets with Continuous and Discrete Wavelet Transforms.” IEEE Transactions on Geoscienceand Remote Sensing 39: 2217–2226.
Canty, M. J. 2010. Image Analysis, Classification and Change Detection in Remote Sensing withAlgorithms for ENVI/IDL, 73–387. 2nd ed. New York: Taylor & Francis.
Chavez, P. S., S. C. Sides, and J. A. Anderson. 1991. “Comparison of Three Different Methodsto Merge Multiresolution and Multispectral Data: Landsat TM and SPOT Panchromatic.”Photogrammetric Engineering & Remote Sensing 57: 295–303.
Chen, W., D. Blain, J. Li, K. Keohler, R. Fraser, Y. Zhang, S. Leblanc, I. Olthof, J. Wang, andM. Mcgovern. 2009. “Biomass Measurements and Relationships with Landsat-7/ETM+ andJERS-1/SAR Data over Canada’s Western Sub-Arctic and Low Arctic.” International Journal ofRemote Sensing 30: 2355–2376.
Chibani, Y. 2005. “Selective Synthetic Aperture Radar and Panchromatic Image Fusion by Usingthe à Trouswavelet Decomposition.” EURASIP Journal on Applied Signal Processing 14:22072–22214.
Chibani, Y. 2006. “Additive Integration of SAR Features into Multispectral SPOT Images by Meansof the À Trous Wavelet Decomposition.” ISPRS Journal of Photogrammetric & Remote Sensing60: 306–314.
Chibani, Y., and A. Houacine. 2003. “Redundant Versus Orthogonal Wavelet Decomposition forMultisensory Image Fusion.” Pattern Recognition 36: 879–887.
EXELIS Visual Information Solutions. 2013. ENVITM Environment for Visualizing Images andIDLTM Interactive Data Language. Accessed March 20, 2013. http://www.exelisvis.com/ProductsServices/ENVI.aspx
Fransson, J. E. S., F. Walter, and L. M. H. Ulander. 2000. “Estimation of Forest Parameters UsingCARABAS-II VHF SAR Data.” IEEE Transaction on Geoscience and Remote Sensing 38:720–727.
Gemmell, F. M. 1995. “Effects of Forest Cover, Terrain, and Scale on Timber Volume Estimationwith Thematic Mapper Data in the Rocky Mountain Site.” Remote Sensing of Environment 51:291–305.
Huang, X., L. Zhang, and P. Li. 2008. “A Multiscale Feature Fusion Approach for Classification ofVery High Resolution Satellite Imagery Based on Wavelet Transform.” International Journal ofRemote Sensing 29: 5923–5941.
Hussin, Y. A., and S. R. Shaker. 1996. “Optical and Radar Satellite Image Fusion Techniques forMonitoring Natural Resources and Land Use Changes.” The German International Journal ofElectronic and Communications. AEU EUSAR’96 Special Issue, 169–176.
Hyde, P., R. Nelso, D. Kimes, and E. Levine. 2007. “Exploring LiDAR–RaDAR Synergy—PredictingAboveground Biomass in a Southwestern Ponderosa Pine Forest Using LiDAR, SAR andInSAR.” Remote Sensing of Environment 106: 28–38.
Kellndorfer, J. M., M. C. Dobson, J. D. Vona, and M. Clutter. 2003. “Toward Precision Forestry: Plot-Level Parameter Retrieval for Slash Pine Plantations with JPL IRSAR.” IEEE Transactions onGeoscience and Remote Sensing 41: 1571–1582.
Kellndorfer, J. M., L. E. Pierce, and M. C. Dobson. 1998. “Toward Consistent Regional-to-Global-Scale Vegetation Characterization Using Orbital SAR System.” IEEE Transactions onGeoscience and Remote Sensing 36: 1396–1411.
Kumar, A. S., B. Kartikeyan, and K. L. Majumdar. 2000. “Band Sharpening of IRS-MultispectralImagery by Cubic Spline Wavelets.” International Journal of Remote Sensing 21: 581–594.
Kuplich, T. M., P. J. Curran, and P. M. Atkinson. 2005. “Relating SAR Image Texture to the Biomassof Regenerating Tropical Forests.” International Journal of Remote Sensing 26: 4829–4854.
Lefsky, M. A., D. P. Turner, M. Guzy, and W. B. Cohen. 2005. “Combining Lidar Estimates ofAboveground Biomass and Landsat Estimates of Stand Age for Spatially Extensive Validationof Modeled Forest Productivity.” Remote Sensing of Environment 95: 549–558.
Leica Geosystem. 2008. ERDAS Field GuideTM, 335 pp. Atlanta, GA: ERDAS Inc.Lemeshewsky, G. P. 1999. “Multispectral Multisensor Image Fusion Using Wavelet Transforms.”
Proceedings of SPIE International Society for Optical Engineering, Visual Image ProcessingVIII , Orlando, USA, 3716: 214–222.
Li, S., J. T. Kwok, and Y. Wang. 2002. “Using the Discrete Wavelet Frame Transformation to MergeLandsat TM and SPOT Panchromatic Images.” Information Fusion 3: 17–23.
Liang, P., M. Moghaddam, L. Pierce, and R. M. Lucas. 2005. “Radar Backscatter Model for Multi-Layer Mixed Species Forests.” IEEE Transactions on Geoscience and Remote Sensing 43:2612–2626.
Lu, D. 2006. “The Potential and Challenge of Remote Sensing-Based Biomass Estimation.”International Journal of Remote Sensing 27: 1297–1328.
Lu, D., M. Batistella, and E. Moran. 2005. “Satellite Estimation of Aboveground Biomass andImpacts of Forest Stand Structure.” Photogrammetric Engineering & Remote Sensing 71:967–974.
Lucas, R. M., N. Cronin, A. Lee, M. Moghaddam, C. Witte, and P. Tickle. 2006. “EmpiricalRelationships Between AIRSAR Backscatter and LiDAR-Derived Forest Biomass, Queensland,Australia.” Remote Sensing of Environment 100: 407–425.
Lucas, R. M., M. Moghaddam, and N. Cronin. 2004. “Microwave Scattering From Mixed-SpeciesForests, Queensland, Australia.” IEEE Transactions on Geoscience and Remote Sensing 42:2142–2159.
Luckman, A., J. Baker, M. Honzák, and R. Lucas. 1998. “Tropical Forest Biomass Density EstimationUsing JERS-1 SAR: Seasonal Variation, Confidence Limits, and Application to Image Mosaic.”Remote Sensing of Environment 63: 126–139.
Mallat, S. G. 1989. “A Theory for Multiresolution Signal Decomposition: The WaveletRepresentation.” IEEE Transactions on Pattern Analysis and Machine Intelligence 11: 674–693.
Martinez, B., and M. A. Gilabert. 2009. “Vegetation Dynamics from NDVI Time Series AnalysisUsing the Wavelet Transform.” Remote Sensing of Environment 113: 1823–1842.
Musa, M. K., Y. A. Hussin, and M. C. Weir. 2004. “Multi-Data Fusion for Sustainable ForestManagement.” Asian Journal on Geoinformatics 4: 57–70.
Núnêz, J., X. Otazu, O. Fors, A. Prades, V. Palà, and R. Arbiol. 1999. “Multiresolution-base ImageFusion with Additive Wavelet Decomposition.” IEEE Transactions on Geoscience and RemoteSensing 37: 1204–1211.
Pajares, G., and J. M. de la Cruz. 2004. “A Wavelet-Based Image Fusion Tutorial.” PatternRecognition 37: 1855–1872.
Phat, N. K., W. Knorr, and S. Kim. 2004. “Appropriate Measures for Conservation of TerrestrialCarbon Stocks—Analysis of Trends of Forest Management in Southeast Asia.” Forest Ecologyand Management 191: 283–299.
Pittiglio, C., A. K. Skidmore, C. A. J. M. de Bie, and A. Murwira. 2012. “A Common DominantScale Emerges from Images of Diverse Satellite Platforms Using the Wavelet Transform.”International Journal of Remote Sensing 32: 3665–3687.
Pohl, C., and J. L. van Genderen. 1998. “Multisensor Image Fusion in Remote Sensing: Concepts,Methods, and Applications.” International Journal of Remote Sensing 19: 823–854.
Pradhan, P. S., R. L. King, N. H. Youman, and D. W. Holcom. 2006. “Estimation of the Number ofDecomposition Levels for a Wavelet-Based Multiresolution Multisensor Image Fusion.” IEEETransactions on Geoscience and Remote Sensing 44: 3674–3686.
Pu, R., and P. Gong. 2004. “Wavelet Transform Applied to EO-1 Hyperspectral Data for Forest LAIand Crown Closure Mapping.” Remote Sensing of Environment 91: 212–224.
Ranchin, T., and L. Wald. 2000. “Fusion of High Spatial and Spectral Resolution Images: The ARSISConcept and Its Implementation.” Photogrammetric Engineering and Remote Sensing 66: 49–61.
Rauste, Y. 2005. “Multi-Temporal JERS SAR Data in Boreal Forest Biomass Mapping.” RemoteSensing of Environment 97: 263–725.
Ronsenqvist, A., A. Milne, R. Lucas, M. Imhoff, and C. Dobson. 2003. “A Review of Remote SensingTechnology in Support of the Kyoto Protocol.” Environmental Science & Policy 6: 441–445.
Saatchi, S., M. Marlier, R. L. Chazdon, D. B. Clark, and A. E. Russell. 2011. “Impact of SpatialVariability of Tropical Forest Structure on Radar Estimation of Aboveground Biomass.” RemoteSensing of Environment 115: 2836–2849.
Dow
nloa
ded
by [
Mos
kow
Sta
te U
niv
Bib
liote
] at
22:
16 1
5 Fe
brua
ry 2
014
4888 T.M. Basuki et al.
Santos, J. R., C. C. Freitas, L. S. Araujo, L. V. Dutra, J. C. Mura, F. F. Gama, L. S. Soler, and S. J. S.Sant’Anna. 2003. “Airborne P-Band SAR Applied to the Aboveground Biomass Studies in theBrazilian Tropical Rainforest.” Forest Ecology and Management 87: 482–493.
Schimel, D. S., J. I. House, K. A. Hibbard, P. Bousquet, P. Ciais, P. Peylin, B. H. Braswell, M. J.Apps, D. Baker, A. Bondeau, J. Canadell, G. Churkina, W. Cramer, A. S. Denning, C. B. Field,P. Friedlingstein, C. Goodale, M. Heimann, R. A. Houghton, J. M. Melillo, B. Moore, III, D.Murdiyarso, I. Noble, S. W. Pacala, I. C. Prentice, M. R. Raupach, P. J. Rayner, R. J. Scholes,W. L. Steffen, and C. Wirth. 2001. “Recent Patterns and Mechanisms of Carbon Exchange byTerrestrial Ecosystems.” Nature 414: 169–172.
Shensa, M. J. 1992. “The Discrete Wavelet Transform: Wedding the  Trous and Mallat Algorithms.”IEEE Transactions and Signal Processing 40: 2464–2482.
Shi, W., C. Zhu, C. Zhu, and X. Yang. 2003. “Multi-Band Wavelet for Fusing SPOT Panchromaticand Multiband Images.” Photogrammetric Engineering & Remote Sensing 69: 513–520.
Simone, G., A. Farina, F. C. Morabito, S. B. Serpico, and L. Bruzzone. 2002. “Image FusionTechniques for Remote Sensing Applications.” Information Fusion 3: 3–15.
Sist, P., and A. Saridan. 1998. “Description of the Primary Lowland Forest of Berau.” In SylviculturalResearch in a Lowland Mixed Dipterocarp Forest of East Kalimantan, edited by J. Bertault andK. Kadir, 51–73. Montpellier: Cirad-Forêt.
Souza, C. M. Jr., D. A. Roberts, and M. A. Cocrane. 2005. “Combining Spectral and SpatialInformation to Map Canopy Damage from Selective Logging and Forest Fires.” Remote Sensingof Environment 98: 329–343.
Steininger, M. K. 2000. “Satellite Estimation of Tropical Secondary Forest Above-Ground BiomassData from Brazil and Bolivia.” International Journal of Remote Sensing 21: 1139–1157.
Strand, E. K., A. M. S. Smith, S. C. Bunting, L. A. Vierling, D. B. Hann, and P. E. Gessler.2006. “Wavelet Estimation of Plant Spatial Patterns in Multitemporal Aerial Photography.”International Journal of Remote Sensing 27: 2049–2054.
Strang, G., and T. Nguyen. 1997. Wavelets and Filter Banks, 103–52. New York: Wellesley-Cambridge Press.
Tompkins, S., J. F. Mustard, C. M. Pieters, and D. W. Forsyth. 1997. “Optimization of Endmembersfor Spectral Mixture Analysis.” Remote Sensing of Environment 59: 472–489.
Trevett, J. W. 1986. “Imaging Radar for Resources Surveys.” In Remote Sensing Application, editedby E. C. Barret and L. F. Curtis, 17–62. New York: Chapman and Hall.
Tsolmon, R., R. Tateishi, and J. S. S. Tetuko. 2002. “A Method to Estimate Forest Biomass and itsApplication to Monitor Mongolian Taiga Using JERS-1 SAR Data.” International Journal ofRemote Sensing 23: 4971–4978.
Vega, B. 2005. “Image Fusion of Optical and Microwave Data to Assess Criteria and Indicator (C&I)Related to Forest Encroachment, for Certification Process of Sustainable Forest Management(SFM).” 79 pp. Unpublished MSc thesis, ITC, Enschede.
Wang, C., and J. Qi. 2008. “Biophysical Estimation in Tropical Forests Using JERS-1 SAR andVNIR Imagery II. Above-Ground Woody Biomass.” International Journal of Remote Sensing29: 6827–6849.
Wang, Z., D. Ziou, C. Armenakis, L. Deren, and Q. Li. 2005. IEEE Transactions on Geoscience andRemote Sensing 43: 1391–1402.
Yunhao, C., D. Lei, L. Jing, L. Xiaobing, and S. Peijun. 2006. “A New Wavelet-Based Image FusionMethod for Remotely Sensed Data.” International Journal of Remote Sensing 27: 1465–1476.