Page 1
Estimating water and sediment transport through the soil at field and laboratory Ana Maria Mingot Soriano
Degree project in Environmental Science Examensarbeten, Institutionen för mark och miljö, SLU Uppsala 2013 2013:01
Page 3
SLU, Swedish University of Agricultural Sciences Faculty of Natural Resources and Agricultural Sciences Department of Soil and Environment Ana Maria Mingot Soriano Estimating water and sediment transport through the soil at field and laboratory Supervisor: Abraham Joel, Department of Soil and Environment, SLU Examiner: Ingrid Wesström, Department of Soil and Environment, SLU EX0433, Independent project/degree project in Environmental Science, 30 credits, A1E Series title: Examensarbeten, Institutionen för mark och miljö, SLU 2013:01 Uppsala 2013 Keywords: soil, erosion, drip infiltrometer, tension infiltrometer, Pinhole test, turbidity Online publication: http://stud.epsilon.slu.se
Page 5
Abstract
Soil erosion has been widely studied by many methods as a measure of loss of soil qual-
ity due to the importance of the conservation of the soil properties. However, these meth-
ods produce different results that are difficult to compare. In this thesis, rain simulations
with a drip infiltrometer and a revised pinhole test were used to study the soil response and
to quantify sediment transport. Simulated rain events in the field generated infiltration
through the upper soil profile that was directly related to the rain intensity. A tension infil-
trometer was used to estimate hydraulic conductivity in the soil before and after the simu-
lated rain events in the field to study the effect on the soil surface. Turbidity was measured
in the water samples from drainage water in the rain events and was used as a surrogate
parameter for suspended soil sediment concentration. Turbidity displayed similar pattern
regarding the rain intensity applied. The pinhole test methodology was developed for un-
disturbed soil samples and was amended by modifying the water content in the soil sam-
ples, in order to study the response at saturation and under drainage at 40 and 100 cm ten-
sion. The erosion process was studied by considering turbidity values together with out-
flow rate. Sediment discharge calculations were more accurate when both these parameters
included. Soil samples in the pinhole test showed similar patterns for turbidity, outflow
rate and sediment discharge. However, sediment transport was lower in saturated samples
than in drained samples and was highest for the samples drained at 100 cm tension. Fur-
thermore, topsoil proved to be more reactive with cavities sometimes developing in the soil
specimen. Our recommendation is to express the results as concentration of transported
sediment (mg/mL), as these numerical values are easier to understand and compare be-
tween different experiments. Regarding to the pinhole test, the recommendation is to use
samples from the soil depth of interest and drained at 100 cm tension.
Key words: soil, erosion, drip infiltrometer, tension infiltrometer, Pinhole test, turbidity.
Page 7
Index
1 Introduction 6
2 Objectives 8
3 Materials and methods 9 3.1 Rain simulator ................................................................................................................ 9
3.1.1 Pit preparation .................................................................................................. 10 3.1.2 Measurements .................................................................................................. 11 3.1.3 Analysis of drain water ..................................................................................... 12
3.2 Tension infiltrometer .................................................................................................... 13 3.2.1 Preparation ....................................................................................................... 14 3.2.2 Measurements .................................................................................................. 15
3.3 Pinhole test .................................................................................................................. 15 3.3.1 Specimen preparation test................................................................................ 16 3.3.2 Soil sample preparation .................................................................................... 18 3.3.3 Implementation of the pinhole methodology ..................................................... 18 3.3.4 Analysis of water samples ................................................................................ 19
4 Results and discussion 20 4.1 Rain simulator .............................................................................................................. 20 4.2 Tension infiltrometer .................................................................................................... 25 4.3 Pinhole test .................................................................................................................. 27
5 Conclusions 41
References 43
Acknowledgements 45
Page 9
6
1 Introduction
Soil conservation is a major concern worldwide. When a soil loses its inherent
properties, its structure changes and so its functions, i.e. its production capacity.
Soil aggregate stability is considered a major indicator of soil quality, since the
overall stability of the soil structure depends on this parameter. There are many
methods to calculate aggregate stability, which differ in terms of the methods used
for artificial destabilisation, the scale of the stability and the way in which the re-
sults are expressed. Thus it is difficult to compare the results obtained using dif-
ferent methods.
Soil erosion by water is considered to be one of the major causes of soil degra-
dation. Rain drops change the surface soil structure, breaking aggregates and com-
pacting the soil. Furthermore, infiltration of rain water may cause internal soil ero-
sion that changes the original composition and may thus be another pathway for
soil losses. The changes in the soil layers are very interesting, so many devices
have been developed for their study. Amézqueta (1999) proposed that for a com-
plete description of soil structural stability, it is necessary to study micro-
aggregates and macro-aggregates. For this reason, both scales are considered in
this thesis.
When studying aggregate stability, field measurements give the most reliable
results, but they are costly and time-consuming. Rain simulators have been used in
some studies, largely for field measurements of the effect of rain on the soil (Boers
et al., 1992). Tension infiltrometers have been used all around the world in order
to measure the soil hydraulic properties (Angulo-Jaramillo, 2000). Soil hydraulic
conductivity is the rate at which water moves through the soil, so it is a good pa-
rameter to reflect soil changes.
Laboratory tests are easier to carry out and to replicate, but the information ob-
tained refers to a small scale. The pinhole laboratory test is one such example. In
this test, the flow of water under hydraulic head through a hole in the soil accu-
Page 10
7
rately reproduces well soil conditions and water chemistry piping erosion potential
(Mitchell, 2005). The test was designed by Sherard et al. (1976) to classify disper-
sive clays. It is carried out using a compacted soil specimen in a cylinder, to which
different hydraulic heads are applied. The soil is classified according to the out-
flow rate of water and sediment for the different hydraulic head values applied and
the final hole size. This test has been widely used and over the years some modifi-
cations have been made to the initial design to improve the results. For example,
Nadal-Romero et al. (2011) studied its suitability for assessing the susceptibility of
loss soils to piping erosion. Many studies have used it mainly to classify the soil
for engineering purposes at different water contents, using distilled water and dif-
ferent hydraulic heads. The pinhole test has also been used in laboratory experi-
ments to study soil erodibility (Botschek et al., 2002; Fauzilah et al., 2008). How-
ever, few studies have examined the quantitative parameters used in the test to es-
timate erosion processes.
The overall objective of this Master´s thesis was therefore to develop methodol-
ogy to study internal soil erosion.
Page 11
8
2 Objectives
Specific objectives of the study were to:
- Quantify soil infiltration rates using a rain simulator under different rain
intensities,
- Estimate the effect of the rain splash on soil hydraulic conductivity using
the tension infiltrometer,
- Develop the pinhole laboratory test methodology for undisturbed soil
samples.
Page 12
9
3 Materials and methods
This work comprised a field study and laboratory analyses. The field study in-
cluded measurements of flow from rain simulations and measurements of hydrau-
lic conductivity using a tension infiltrometer. The laboratory analyses included
refinement of the pinhole test methodology and turbidity measurements.
The field study was carried at Vipängen, which is located near the city of Upp-
sala in central Sweden. The field belongs to the Swedish University of Agricultur-
al Sciences (SLU) and the soil at the site is a medium clay, around 38% clay in the
0-30 cm layer increasing to 55% at 30-40 cm depth.
The different measurements of soil hydraulic properties and macro-aggregate
stability were carried out from 15 October to 4 November, 2010. The rain simula-
tor was used to study soil behaviour at different rain intensities and the drainage
water was collected for subsequent analysis. The tension infiltrometer was used
before and after the rain simulation test in order to evaluate differences in the soil
hydraulic conductivity near saturation.
The laboratory analyses were carried out in the period February May 2011.
Turbidity was measured in the drainage water samples collected from the rain
simulator tests. The samples were then dried and the residue weighed to calculate
soil particle concentration. In addition, the pinhole test methodology was devel-
oped and tested in undisturbed soil samples from three different depths in the soil
profile, which were adjusted to three different water contents.
3.1 Rain simulator
The rain simulator used to measure surface runoff and infiltration rate was a
drip infiltrometer (Figure 1) developed by Joel (Joel and Messing, 2001) later
modified and used in several studies. The factors considered in the choice of
Page 13
10
equipment were that the instrument should provide accurate and uniform distribu-
tion of simulated rain events, be able to apply different rain intensities, and be able
to simulate the splash effect of rainfall.
The main components and functions of the drip infiltrometer were: (1) a peri-
staltic pump to regulate water flow between the water supply tank, via a plastic
tube, to (2) a drip plate that gave application rates equivalent to intensities of 15.5-
140 mm/hour. This drip plate measured 0.5 m by 0.5 m and had 481 drippers
(plastic tubes with 0.64 mm inner diameter) attached; (3) a stainless steel support
for the drip plate; and (4) an runoff collector to prevent lateral water losses from
the test surface (Figure 1). The support and the runoff collector were carefully
hammered into the soil.
The simulated rain-water passed through the 45 cm upper soil layer and the wa-
ter outflow was measured. The volume of outflow water was recorded regularly,
and when a steady water outflow was obtained the rain intensity was changed. The
rain intensity was modified in steps following two procedures. In the first proce-
dure, here referred to as high-intensity run or “High”, the rain intensity was altered
from high to low intensity. In the second procedure, here referred as low-intensity
run or “Low”, the rain intensity was modified from low to high intensity. In both
procedures, the rain intensity was varied between 15.5 mm/hour and 140
mm/hour, with 15.5 mm/hour being the lowest intensity the pump could supply.
3.1.1 Pit preparation
A pit of 1 m width, 3 m length and 1 m depth was excavated in the soil profile.
At 45 cm depth, a cavity measuring 40 cm high, 65 cm wide and 85 cm depth was
dug into one of the pit walls. Water and sediment that leached through the upper
soil profile were collected from the roof of this cavity. A 1-2 cm trench was cut
around the measurement area in order to limit the horizontal infiltration area and
to ensure that the water would only move vertically. The trenches were filled with
bentonite which was wetted to seal the cut (Figure 2).
Page 14
11
Figure 1. Rain simulator positioned on the support in the soil and with the run-
off collector visible.
Figure 2. a) Initial pit. b) Side cavity and runoff collector.
3.1.2 Measurements
The volume of outflow water collected was measured at 5 to10 minute intervals
due to different discharge rates. Water samples (100 mL approximately) were tak-
a) b)
Page 15
12
en in bottles and transported to the laboratory for measurements of turbidity and
determination of sediment concentration.
3.1.3 Analysis of drain water
Water turbidity was measured with the Hach Model 2100N Laboratory Turbi-
dimeter which uses Nephelometric Turbidity Units (NTU). The measurements
were made with the following configuration: automatic range, signal average on
(i.e. the instrument microprocessor compiled a number of readings and averaged
the results), and ratio on.
The procedure specified in the manufacturer’s instruction manual for the Hach
Laboratory Turbidimeter Model 2100N (HACH Company, 1996) was followed.
First, the bottles containing the water samples from the rain simulation event were
shaken to give homogeneous samples. Then, 30 mL were taken with a pipette
from each bottle and transferred to the measuring cell of the turbidimeter. During
preparation, care was taken to ensure that the sample never touched the walls of
the cell. The top of the cell was then closed, it was spun and turned upside down
twice and immediately placed in the instrument. The reading appeared within a
few seconds but was rather unstable, with a variation of ±5 NTU. The procedure
adopted was to record the highest value observed, because decrease in value was
due to the sedimentation of the particles.
A small modification to the method for cleaning the cell was made compared
with the instructions in the manual. Since the cell was used repeatedly for meas-
urements during the day, the cleaning step was reduced from cleaning after each
measurement (as specified in the manual) to cleaning only at the beginning of the
working day. In order to check that the cell was clean, deionised water was used to
measure turbidity at the start of the working day. With turbidity reading between
0.00 and 0.02 NTU over a period of 10-20 seconds the cell was considered clean.
When higher readings were obtained, the cleaning operation was performed.
The same cell was used for all measurements in order to reduce variability
caused by cell properties. It proved to be advisable to wait at least 10-20 seconds
to see how the readings changed when performing the turbidity measurements on
samples and, as in the cleaning process, the highest value was chosen. After each
turbidity measurement, each water sample was transferred to a metal crucible. The
crucibles were weighed, oven-dried for more than 12 hours at 105°C and weighed
again once they had cooled in order to determine the weight of soil particles in the
water samples. The real water volume was calculated by subtracting the weight of
the dried crucible from the weight of the filled crucible:
Page 16
13
Soil particle mass = Mass of dried crucible –Crucible mass
Water mass = Mass of filled crucible – Mass of dried crucible
The soil particle concentration (mg/mL) was then plotted against the turbidity
(NTU) of each water sample to determine the relationship between turbidity and
sediment concentration.
3.2 Tension infiltrometer
The tension infiltrometer (Soil Measurement Systems, 200 mm diameter disc)
(Figure 3) was used to characterise the hydraulic conductivity (k) of the soil on the
measurement plots before rain simulation (here called Reference) and after rain
simulation (called High and Low, according to the rain simulation treatment) in
three series. The hydraulic conductivity was measured using four different ten-
sions: -5 cm, -3 cm, -1 cm and 0 cm.
The tension infiltrometer consisted of: (1) A bubble tower; (2) a water reservoir;
(3) the disc; (4) a tube connecting the disc and the water tower; (5) an air entry
tube and (6) the bubbling tube with a clamp. The bubble tower and the air entry
tube controlled the tension applied at the soil surface, while the water reservoir
provides the water for the experiment. The disc was used to establish the hydraulic
continuity with the soil.
Page 17
14
Figure 3. Tension infiltrometer in use in the field.
3.2.1 Preparation
The infiltrometer was filled with water before being placed in the measurement
area. To prevent air entering the water reservoir, the procedure followed was to fill
the water reservoir to 5 cm from the top from the disc under water, making the
water flow in the opposite direction to that under normal operation. By applying
suction to the pipe at the top of the water reservoir, bubbles in the water circuit
were removed. This procedure was only carried out when first working with the
instrument in each plot.
When the water reservoir had insufficient water to perform the next measure-
ment and was already in place on the measurement area, a different procedure was
used: The valve between the disc and the water reservoir was closed and then the
top of the water reservoir was removed and it was filled with water to a level of 5
cm from the top.
The next step was to fill the bubble tower, while the valve still had to be kept
closed. The top was removed, water was introduced to 7 cm from the top and the
top was closed again. The air entry tube was used to control the water tension in
Page 18
15
the soil. The lower end of this tube had to be 4 cm + X cm from the water level,
where X is the tension to be applied for the measurement (-5 cm, -3 cm, -1 cm or
0 cm). Between measurements, the position of the air entry tube had to be adjusted
to set the tension.
The disc was placed on a flat surface with a thin layer of wet sand to improve
the contact with the soil. The sand was wetted to an optimum water content and
spread over a surface of the same size as the disc. The disc was placed on top and
some weight was applied in order to improve the contact with the soil.
3.2.2 Measurements
The water volume in the water reservoir was recorded every 15 seconds at the
beginning (between 10-30 minutes) and later every 30 seconds, until steady flow
for each tension was reached. The duration of measurements at -5 cm tension was
around 40 minutes, for -3 cm 30 minutes, for -1 cm 20 minutes and for 0 cm 15
minutes. The last values with a constant increase were then used to calculate the
infiltration rate in the soil. The hydraulic conductivity was then calculated with the
model described by Messing and Jarvis (1993), based on theories of Wooding
(1968) for infiltration from a circular source and the Gardner (1958) exponential
function for k. This model calculates k values for intermediate tensions to better
describe the equation, in this case for -4 and -2 cm tension.
3.3 Pinhole test
The pinhole laboratory test was initially designed to identify dispersive clays
(Sherard et al., 1976). It involves passing distilled water under a controlled hy-
draulic head through a 1 mm diameter hole made in a recompacted clay. The soil
is classified according to the turbidity of the water outflow from the soil specimen,
the hydraulic head applied, the state of flow and the final diameter of the hole
(American Society for Testing Materials, D4647-93). The test is run during five
minutes and then if the water and the flow have the established requirements (tur-
bid water) the test is finished. Otherwise the hydraulic head is increased and the
test continues. There are four standard hydraulic heads at which to run the test: 5,
18, 38 and 102 cm. Furthermore, the soil specimen can be disturbed or undis-
turbed.
In this thesis, the methodology was refined for undisturbed soil samples, which
required some changes from the initial test. Only the 18, 38 and 102 hydraulic
Page 19
16
heads were used, all the water was collected and its turbidity was measured and
some water samples were dried to determine the relationship between turbidity
and soil particle concentration in the water. The aim of these modifications was to
allow the soil erosion susceptibility to be determined on undisturbed soil samples.
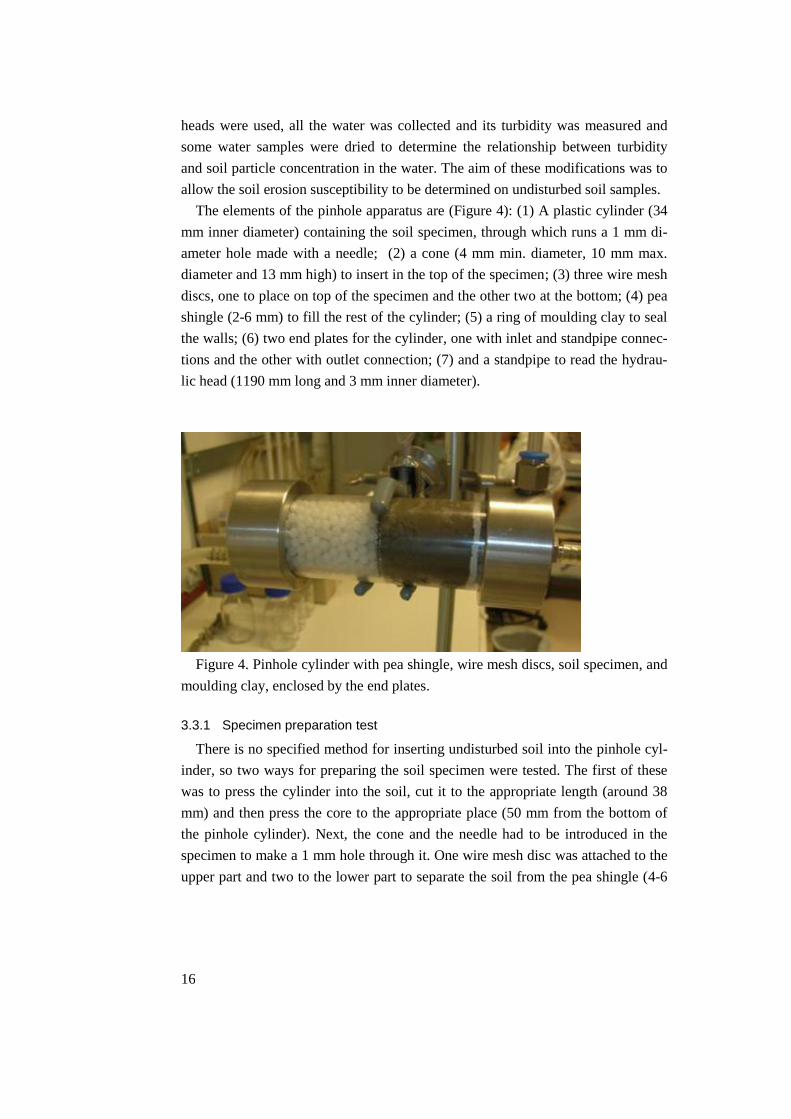
The elements of the pinhole apparatus are (Figure 4): (1) A plastic cylinder (34
mm inner diameter) containing the soil specimen, through which runs a 1 mm di-
ameter hole made with a needle; (2) a cone (4 mm min. diameter, 10 mm max.
diameter and 13 mm high) to insert in the top of the specimen; (3) three wire mesh
discs, one to place on top of the specimen and the other two at the bottom; (4) pea
shingle (2-6 mm) to fill the rest of the cylinder; (5) a ring of moulding clay to seal
the walls; (6) two end plates for the cylinder, one with inlet and standpipe connec-
tions and the other with outlet connection; (7) and a standpipe to read the hydrau-
lic head (1190 mm long and 3 mm inner diameter).
Figure 4. Pinhole cylinder with pea shingle, wire mesh discs, soil specimen, and
moulding clay, enclosed by the end plates.
3.3.1 Specimen preparation test
There is no specified method for inserting undisturbed soil into the pinhole cyl-
inder, so two ways for preparing the soil specimen were tested. The first of these
was to press the cylinder into the soil, cut it to the appropriate length (around 38
mm) and then press the core to the appropriate place (50 mm from the bottom of
the pinhole cylinder). Next, the cone and the needle had to be introduced in the
specimen to make a 1 mm hole through it. One wire mesh disc was attached to the
upper part and two to the lower part to separate the soil from the pea shingle (4-6
Page 20
17
mm diameter) filling the remaining space above and below. The last step was to
put on the caps, place the cylinder horizontally, install the standpipe for measuring
hydraulic head and connect the top cap to the water supply to start the test.
For the first experiment on soil specimens, the samples were prepared as de-
scribed above and then the test was run for 5 minutes with 31, 50 and 110 cm hy-
draulic head. The hydraulic head in the test was the height between the central axis
of the cylinder and the water level in the tank supplying the water. The head was
controlled by changing the position of the cylinder and the water level in the water
tank.
The second way to prepare the soil specimen for the test involved following the
instructions for compacted specimens (American Society for Testing Materials,
D4647-93). First of all, the lower cap was filled with 5 cm pea shingle, two discs
were placed on top and the soil was introduced. To keep the samples undisturbed
in this step, a second cylinder was used to hold the specimen intact and it was then
pressed through to the test cylinder. Once the specimen was in position in the test
cylinder, cone and needle were inserted and one disc, pea shingle and the upper
cap were placed on top. The test was run with the same hydraulic heads (31, 50,
110 cm) and the outflow water collected.
There was no difference in the turbidity of the outflow water between these two
methods for sample preparation. Therefore since the first method was easier and
the soil sample was not compacted, it was chosen for the experiment.
The next variable tested in the method development was the use of moulding
clay to seal and prevent flow between the soil and the walls of the cylinder. While
no consistent results were obtained in tests with or without moulding clay, it was
decided to use moulding clay in the experiments to avoid possible flow between
the cylinder and the specimen. The chosen material was a kind of moulding clay
that was easier to work because it did not stick and did not colour the water.
The last variable was the pea shingle. The material available were small stones
(4-6 mm diameter) and white plastic beads (4 mm diameter). These gave similar
effects and neither coloured the water, but plastic beads were chosen because it
was easier to check whether they were clean. However, they had the disadvantage
of being so small that a single bead could block the outlet hole. The solution was
to put a fourth wire mesh between the beads and the lower cap.
During the tests some important details were observed. For instance, when per-
forating the specimen with the needle, it was important to clean the needle before
extracting it by it turning slowly. Sometimes there was no flow because the hole
was blocked, and the top cap had to be removed and the hole had to be made
Page 21
18
again. It was also observed that the use of a turning valve to avoid bubbles in the
stand pipe made it easier to read the actual hydraulic head.
3.3.2 Soil sample preparation
Undisturbed soil samples were taken from the field with cylinders of 72 mm di-
ameter and 50 mm height. The samples were taken from three different depths: the
topsoil (10-15 cm), the plough pan (22-27 cm) and the subsoil (35-40 cm).
The soil samples were stored at 4ºC until testing. Before the test commenced, all
the samples were saturated for 2 weeks. Then some samples were drained in sand-
boxes to alter the water content. The sandbox, an airtight chamber, allowed the
water tension in the sand to be controlled, and thereby the water content of the
sample in contact with the sand inside the box. The tensions used in the boxes
were 40 cm and 100 cm, in order to study the effect of different water contents
(Nadal-Romero et al., 2011). Those authors reported that different antecedent
moisture content in samples before the pinhole test influenced sediment discharge.
Furthermore, Watts (1996) concluded that different soils have different stability
depending on the water content, e.g. clay has a different response to mechanical
disruption according to the water content, becoming sensitive above the plastic
limit.
3.3.3 Implementation of the pinhole methodology
The test was run on four soil samples from each of the three depths at three dif-
ferent initial water contents (Table 1). For each soil sample the pinhole test was
run at three hydraulic heads: 18 cm, 38 cm and 102 cm, in that order, with 6
minutes at each hydraulic. All the outflow water was collected in glass bottles to
measure the volume and the turbidity of the water. In the 18 cm run, 6 bottles were
used, with the water collected every minute, because the flow was low and 30 mL
of sample were required for turbidity measurements. The bottles were numbered 1
to 6. For the 38 and 102 cm runs the water flow was higher than for 18 cm, so the
water was collected every 30 seconds, using 12 bottles for each hydraulic head
(bottles 1 to 12).
Page 22
19
Table 1. Soil depth, water content and soil sample number.
Soil sample number
Soil depth Saturated 40 cm 100 cm
Topsoil 1383, 1384, 1385, 1386 161, 163, 164 167, 170, 175
Plough pan 1390, 1391, 1392, 1393 165, 168, 169 172, 173, 178
Subsoil 1394, 1395, 1396, 1397 179, 180, 181 188, 192, 196
3.3.4 Analysis of water samples
The turbidity of all the water samples from the pinhole test was measured with
the Hach Model 2100N Laboratory Turbidimeter used previously for the water
from the rain simulation test. The same procedure for measurements was followed.
The next step was to dry the water samples after measuring the turbidity. It was
not possible to dry all the samples because it was time-consuming. Therefore, bot-
tles number 1, 3 and 6 from the 18 cm test and bottles 1, 5, 8 and 12 from the 38
cm and 102 cm tests were selected for drying. Dying was carried out in the same
metal crucibles as were used for the water from the rain simulator and following
the same procedure to calculate the soil sediment concentration in the water.
The data obtained were used to calculate a linear equation to estimate sediment
concentration from turbidity. This equation was applied to estimate the concentra-
tion in samples that were not dried. The sediment concentration was then multi-
plied by the outflow volume to calculate the sediment discharge for every pinhole
test. Turbidity can be a good indicator of soil particles in the water and is easy and
fast to read. However, it does not take into account the water volume that has
passed through the sample. For this reason, total sediment discharge is a better
indicator of the total erosion produced in the sample.
Page 23
20
4 Results and discussion
The results from the field measurements with the rain simulator and the tension
infiltrometer and the laboratory analyses using the pinhole test are presented be-
low.
4.1 Rain simulator
The rain simulation runs in the field were carried out in three plots and the se-
ries were designated L1, L2, H1, H2 and H3, where H and L are high and low in-
tensity, as described earlier.
The first set of measurements with the rain simulator, low-intensity run 1 (L1),
started with a rain intensity of 41 mm/hour and took about 40 minutes from the
start of the simulation until outflow began. After few minutes, the rain intensity
was decreased to 31 mm/hour and it took 30 minutes to get a steady outflow, after
which the intensity was decreased to 15.5 mm/hour. Next, the intensity was in-
creased to 140 mm/hour and a rapid increase in water flow was observed. Within
10 minutes the outflow increased to 100 mm/hour and was about 71% of input.
The second set of measurements, low-intensity run 2 (L2), started with intensity
of 140 mm/hour for 23 minutes to wet the soil. When the outflow was initiated,
the rain intensity was reduced to 31 mm/hour. The flow response was fast, with it
taking 13 minutes to get a steady outflow of 21 mm/hour. The rain intensity ap-
plied was then decreased to 15 mm/hour for 10 minutes and the outflow decreased
considerably, to an average value of 4.2 mm/hour. After that, an intensity of 31
mm/hour was applied again and an outflow rate of 20 mm/hour was reached in 20
minutes. The last intensity tested was 140 mm/hour, the response was fast and
reached steady outflow of 75 mm/hour. The results of outflow and turbidity meas-
urements for L2 are presented in Figure 5.
Page 24
21
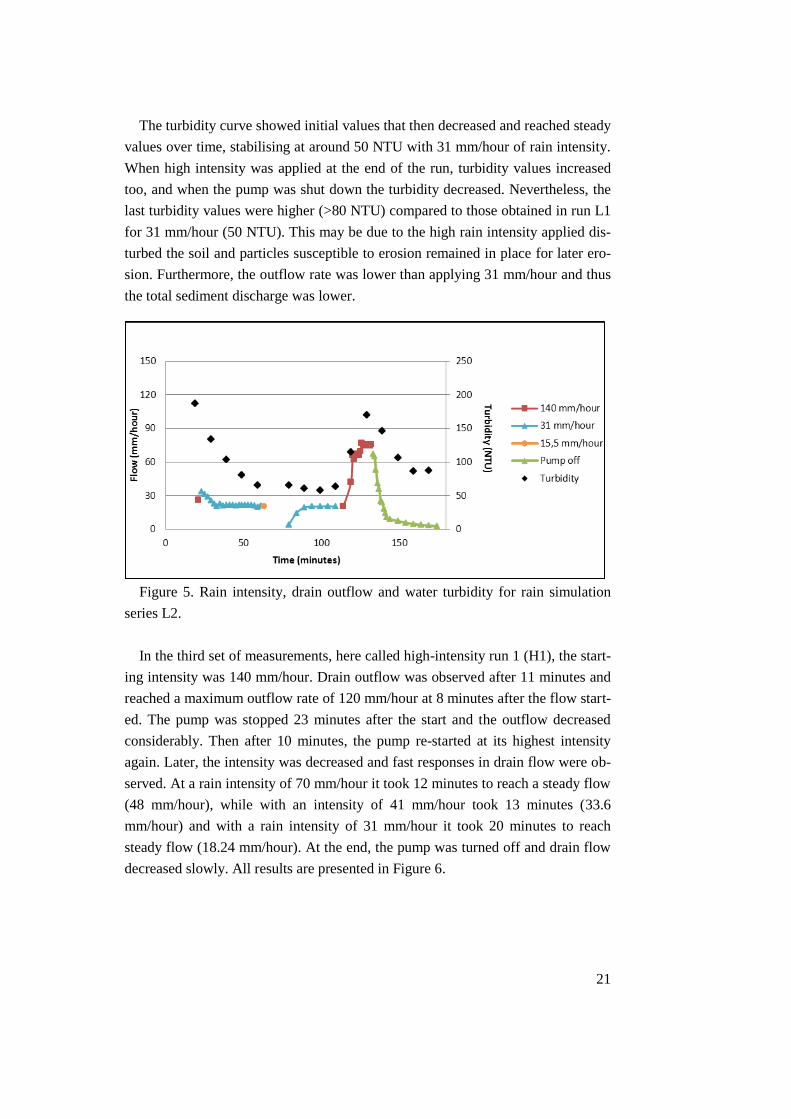
The turbidity curve showed initial values that then decreased and reached steady
values over time, stabilising at around 50 NTU with 31 mm/hour of rain intensity.
When high intensity was applied at the end of the run, turbidity values increased
too, and when the pump was shut down the turbidity decreased. Nevertheless, the
last turbidity values were higher (>80 NTU) compared to those obtained in run L1
for 31 mm/hour (50 NTU). This may be due to the high rain intensity applied dis-
turbed the soil and particles susceptible to erosion remained in place for later ero-
sion. Furthermore, the outflow rate was lower than applying 31 mm/hour and thus
the total sediment discharge was lower.
Figure 5. Rain intensity, drain outflow and water turbidity for rain simulation
series L2.
In the third set of measurements, here called high-intensity run 1 (H1), the start-
ing intensity was 140 mm/hour. Drain outflow was observed after 11 minutes and
reached a maximum outflow rate of 120 mm/hour at 8 minutes after the flow start-
ed. The pump was stopped 23 minutes after the start and the outflow decreased
considerably. Then after 10 minutes, the pump re-started at its highest intensity
again. Later, the intensity was decreased and fast responses in drain flow were ob-
served. At a rain intensity of 70 mm/hour it took 12 minutes to reach a steady flow
(48 mm/hour), while with an intensity of 41 mm/hour took 13 minutes (33.6
mm/hour) and with a rain intensity of 31 mm/hour it took 20 minutes to reach
steady flow (18.24 mm/hour). At the end, the pump was turned off and drain flow
decreased slowly. All results are presented in Figure 6.
Page 25
22
The turbidity values for some samples of the outflow are also shown in Figure
6. The turbidity proved be directly related to the rain intensity, with decreasing
input rate decreasing both the outflow and the turbidity. With a rain intensity of 31
mm/hour, the turbidity values were over 50 NTU.
Figure 6. Rain intensity, drain outflow and water turbidity for rain simulation
series H1.
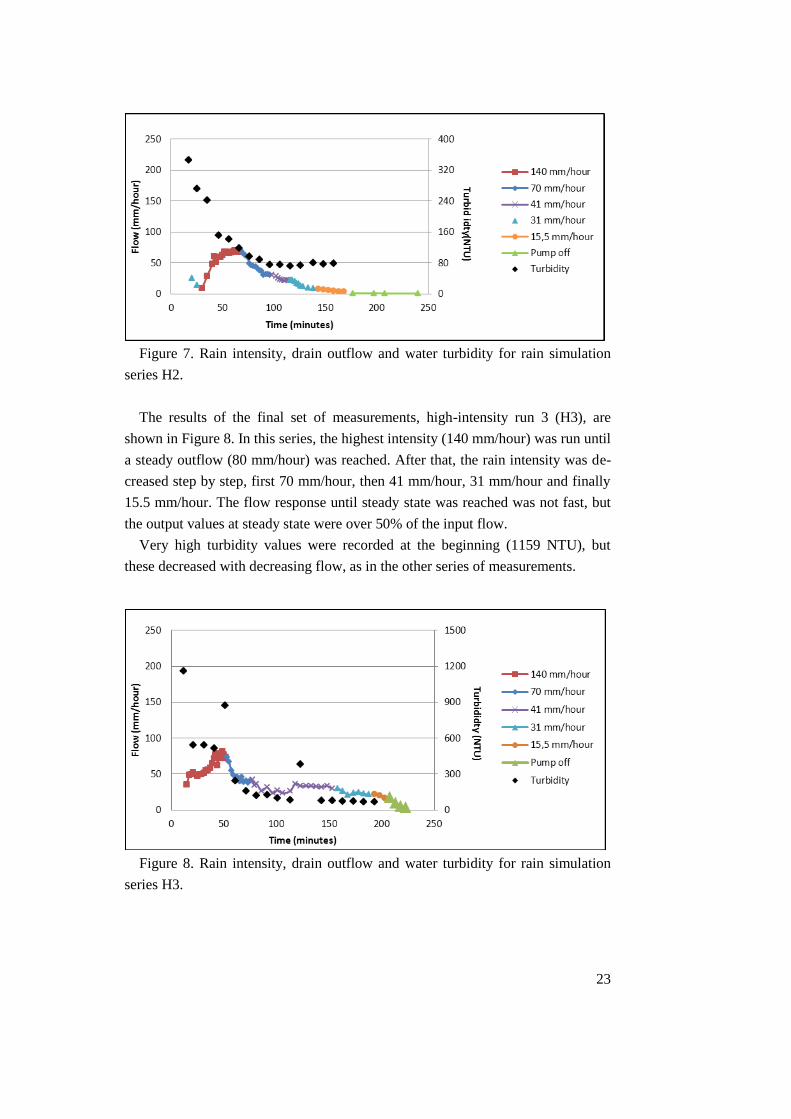
The results of the fourth series of measurements, high-intensity run 2 (H2), are
shown in Figure 7. An intensity of 140 mm/hour was applied for 15 minutes to wet
the soil and then changed to 31 mm/hour for few minutes and back to the highest
intensity again. The second time the highest rain intensity was applied it took 28
minutes to reach a steady flow, of approximately 67 mm/hour. Each of the next set
of decreasing rain intensities (70, 41, 31 and 15.5 mm/hour) took 20 minutes to
stabilise, but only in the last two intensities the outflow reached 50% of the input
flow.
The turbidity values were similar to those observed in series H1, but at the end
of the run they stabilised at around 80 NTU, instead of 50 NTU as in H1.
Page 26
23
Figure 7. Rain intensity, drain outflow and water turbidity for rain simulation
series H2.
The results of the final set of measurements, high-intensity run 3 (H3), are
shown in Figure 8. In this series, the highest intensity (140 mm/hour) was run until
a steady outflow (80 mm/hour) was reached. After that, the rain intensity was de-
creased step by step, first 70 mm/hour, then 41 mm/hour, 31 mm/hour and finally
15.5 mm/hour. The flow response until steady state was reached was not fast, but
the output values at steady state were over 50% of the input flow.
Very high turbidity values were recorded at the beginning (1159 NTU), but
these decreased with decreasing flow, as in the other series of measurements.
Figure 8. Rain intensity, drain outflow and water turbidity for rain simulation
series H3.
Page 27
24
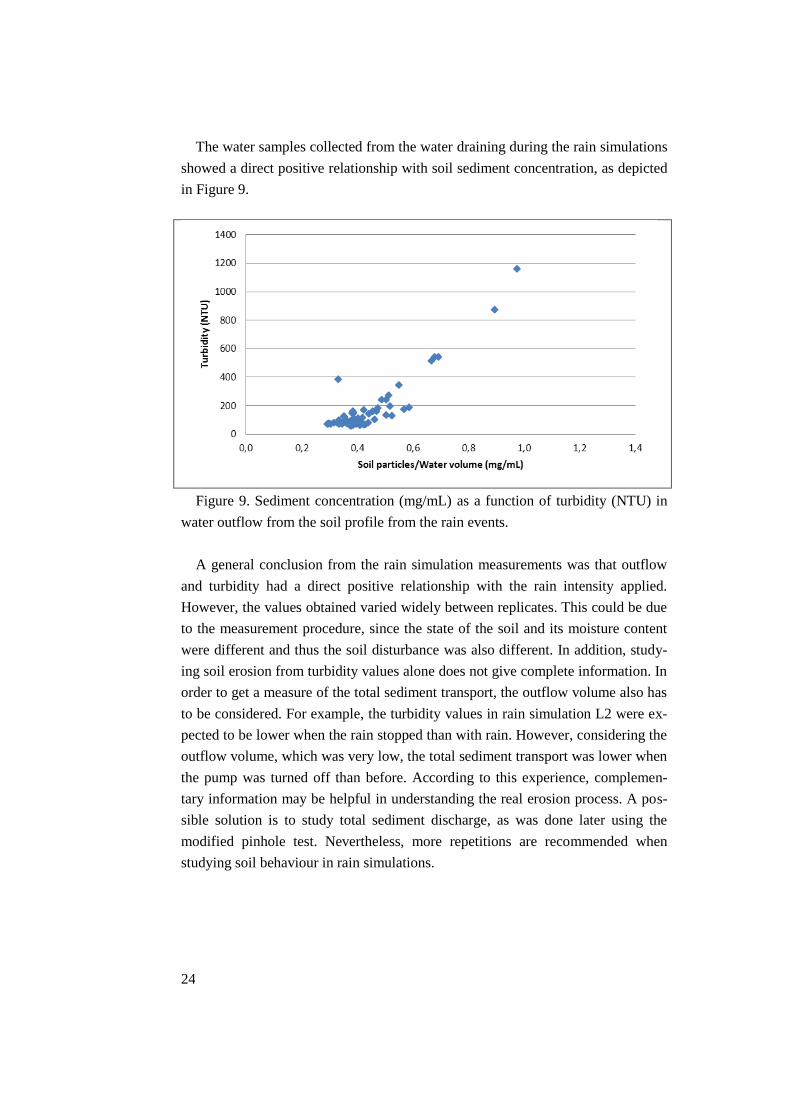
The water samples collected from the water draining during the rain simulations
showed a direct positive relationship with soil sediment concentration, as depicted
in Figure 9.
Figure 9. Sediment concentration (mg/mL) as a function of turbidity (NTU) in
water outflow from the soil profile from the rain events.
A general conclusion from the rain simulation measurements was that outflow
and turbidity had a direct positive relationship with the rain intensity applied.
However, the values obtained varied widely between replicates. This could be due
to the measurement procedure, since the state of the soil and its moisture content
were different and thus the soil disturbance was also different. In addition, study-
ing soil erosion from turbidity values alone does not give complete information. In
order to get a measure of the total sediment transport, the outflow volume also has
to be considered. For example, the turbidity values in rain simulation L2 were ex-
pected to be lower when the rain stopped than with rain. However, considering the
outflow volume, which was very low, the total sediment transport was lower when
the pump was turned off than before. According to this experience, complemen-
tary information may be helpful in understanding the real erosion process. A pos-
sible solution is to study total sediment discharge, as was done later using the
modified pinhole test. Nevertheless, more repetitions are recommended when
studying soil behaviour in rain simulations.
Page 28
25
Concerning surface runoff, at all rain intensities there was no runoff from the
soil surface. For this process to occur, a higher rain intensity would be required.
4.2 Tension infiltrometer
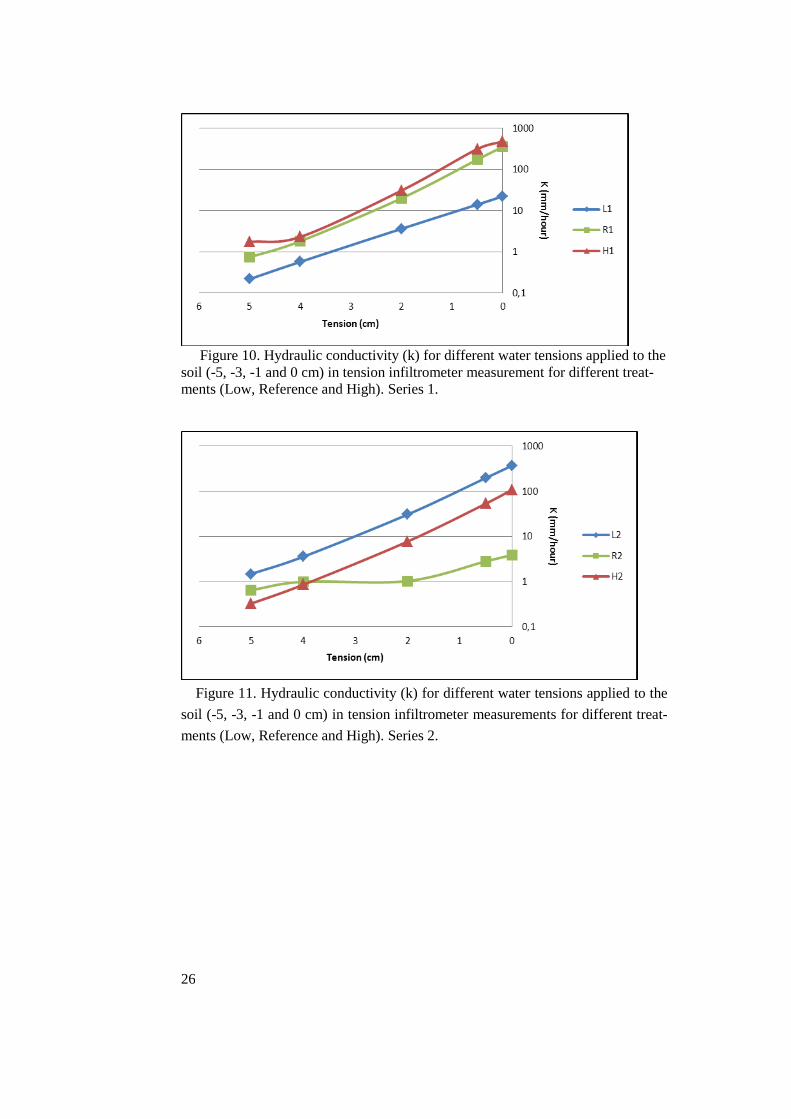
As expected from the principle of the method, at high negative tension values in
the tension infiltrometer, the water moved slowly from the device into the soil and
k values were low. When the tension was lowered (decreasing negative values),
movement of the water was faster and k values increased (Figures 10, 11 and 12).
The values of k obtained for the different tensions are similar to those reported by
Messing and Jarvis (1993) for the same soil. However, there was no pattern be-
tween the simulated rain treatments and hydraulic conductivity in the soil. Fur-
thermore, the presented results disagree with the conclusions by Messing and Jar-
vis (1993) about that the rain impact decreases k values, since the results for the
undisturbed (Reference) soil where always lower values (except 0 cm tension for
R3) than for the series after the rain events. This could be due to spatial variability
in the soil and the sensitivity of the parameter (k). Furthermore, it was sometimes
not possible to obtain measurements with the tension infiltrometer just after the
simulated rain event and in some cases days had to elapse before measurement
was possible. The rain area was covered, but the water content in the soil could
still change, affecting the results. Apart from this, there were some difficulties in
finding an appropriate area for the apparatus because the soil had an irregular sur-
face, and a lot of sand was sometimes needed to keep the contact between the disc
and the soil. These complications could also have had some impact on the results.
Page 29
26
Figure 10. Hydraulic conductivity (k) for different water tensions applied to the
soil (-5, -3, -1 and 0 cm) in tension infiltrometer measurement for different treat-
ments (Low, Reference and High). Series 1.
Figure 11. Hydraulic conductivity (k) for different water tensions applied to the
soil (-5, -3, -1 and 0 cm) in tension infiltrometer measurements for different treat-
ments (Low, Reference and High). Series 2.
Page 30
27
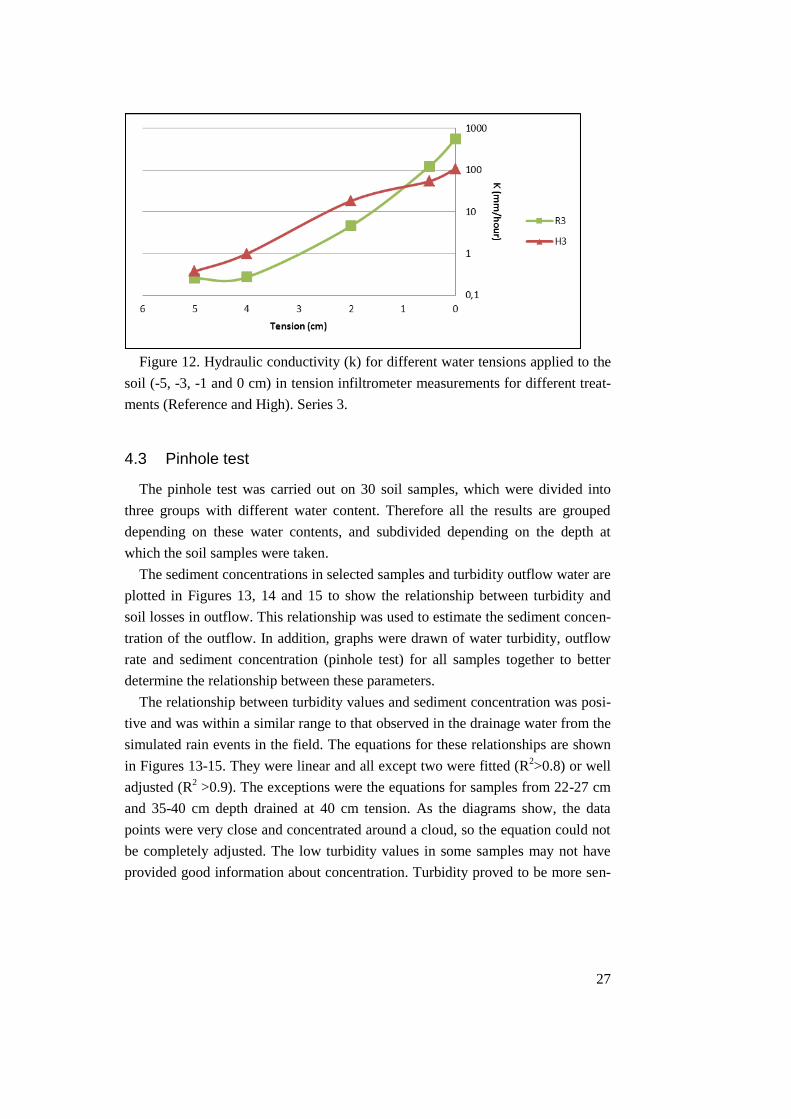
Figure 12. Hydraulic conductivity (k) for different water tensions applied to the
soil (-5, -3, -1 and 0 cm) in tension infiltrometer measurements for different treat-
ments (Reference and High). Series 3.
4.3 Pinhole test
The pinhole test was carried out on 30 soil samples, which were divided into
three groups with different water content. Therefore all the results are grouped
depending on these water contents, and subdivided depending on the depth at
which the soil samples were taken.
The sediment concentrations in selected samples and turbidity outflow water are
plotted in Figures 13, 14 and 15 to show the relationship between turbidity and
soil losses in outflow. This relationship was used to estimate the sediment concen-
tration of the outflow. In addition, graphs were drawn of water turbidity, outflow
rate and sediment concentration (pinhole test) for all samples together to better
determine the relationship between these parameters.
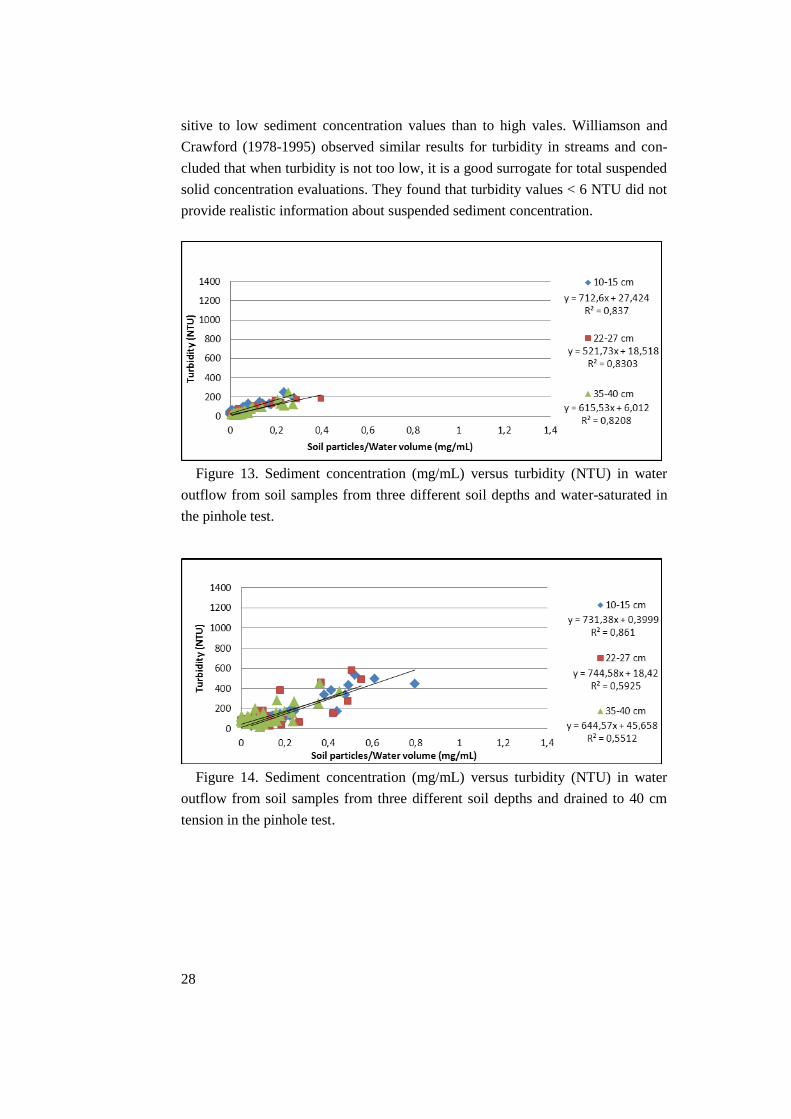
The relationship between turbidity values and sediment concentration was posi-
tive and was within a similar range to that observed in the drainage water from the
simulated rain events in the field. The equations for these relationships are shown
in Figures 13-15. They were linear and all except two were fitted (R2>0.8) or well
adjusted (R2 >0.9). The exceptions were the equations for samples from 22-27 cm
and 35-40 cm depth drained at 40 cm tension. As the diagrams show, the data
points were very close and concentrated around a cloud, so the equation could not
be completely adjusted. The low turbidity values in some samples may not have
provided good information about concentration. Turbidity proved to be more sen-
Page 31
28
sitive to low sediment concentration values than to high vales. Williamson and
Crawford (1978-1995) observed similar results for turbidity in streams and con-
cluded that when turbidity is not too low, it is a good surrogate for total suspended
solid concentration evaluations. They found that turbidity values < 6 NTU did not
provide realistic information about suspended sediment concentration.
Figure 13. Sediment concentration (mg/mL) versus turbidity (NTU) in water
outflow from soil samples from three different soil depths and water-saturated in
the pinhole test.
Figure 14. Sediment concentration (mg/mL) versus turbidity (NTU) in water
outflow from soil samples from three different soil depths and drained to 40 cm
tension in the pinhole test.
Page 32
29
Figure 15. Sediment concentration (mg/mL) versus turbidity (NTU) in water
outflow from soil samples from three different soil depths and drained to 100 cm
tension in the pinhole test.
An example of the results for a pinhole test for an individual soil sample is
shown in Figure 16, where turbidity, outflow rate and sediment discharge are de-
picted as a function of time. At 18 cm hydraulic head turbidity was low, while at
38 cm hydraulic head it had higher values at the beginning of the run but these
then decreased, reaching steady lower values. For the last hydraulic head applied
(102 cm), the response was similar to that for the 38 cm hydraulic head. However,
for some soil samples the initial turbidity values for 102 cm hydraulic head were
sometimes lower than for 38 cm. For calculated total sediment discharge, the
curve had the same shape as the turbidity curve, but the initial values for 38 cm
hydraulic head were always lower than those for 102 cm head showing better the
soil erosion process.
Page 33
30
Figure 16. (a) Outflow water turbidity, (b) outflow rate and (c) sediment dis-
charge as a function of time for soil sample 172 (drained at 100 cm and from 22-
27 cm depth) under 18, 38 and 102 cm hydraulic head.
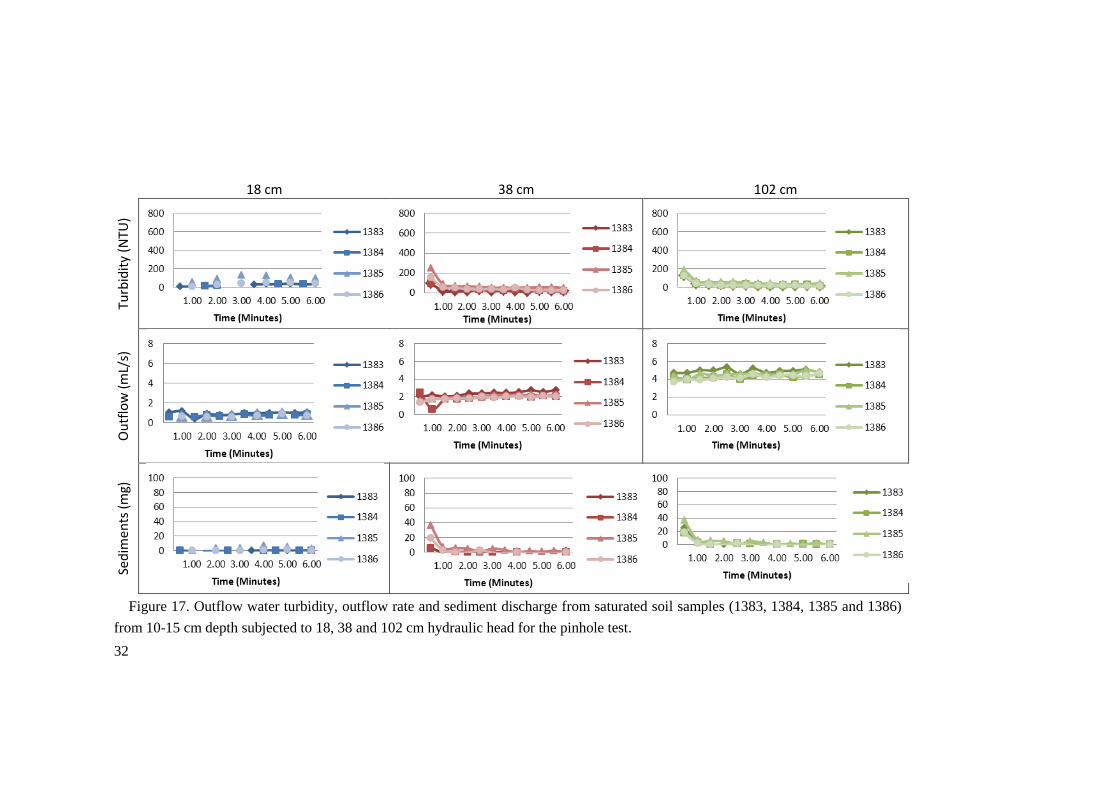
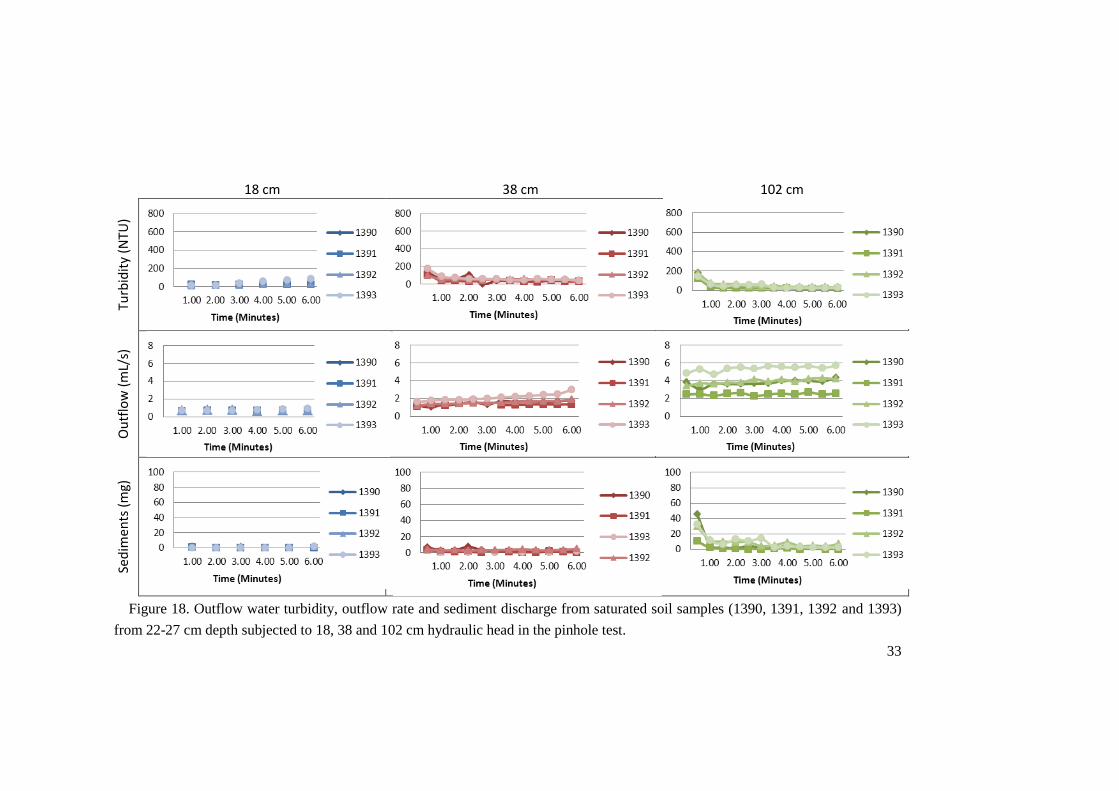
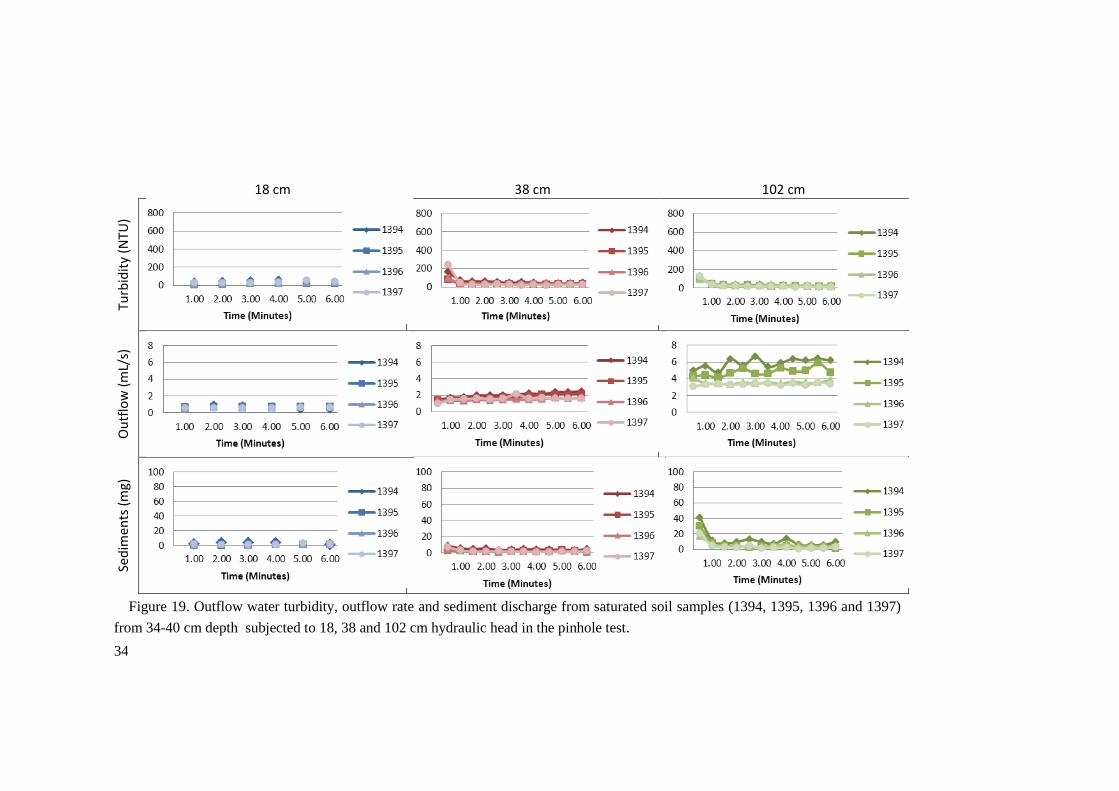
The results of all pinhole tests are presented in Figures 17-25. They are divided
according to water content and soil depth, and subdivided into the three hydraulic
heads used at the test. All tests showed the same pattern: Turbidity values had a
wide range of values between replicates, but the shape of the curves was always
the same for all tests.
In the outflow, more similar values were observed. At 18 cm hydraulic head the
flow was around 0.5-1 mL/s, for 38 cm head 2-3 mL/s and for 102 cm head 4-5
mL/s. However, there were some exceptions where the soil specimen broke and
the outflow reached very high values.
Calculation of sediment concentration had some difficulties. For saturated soil
samples, the equation used to estimate sediment concentration was adjusted
(R2>0.8) but the regression gave unrealistic results, with many resulting in nega-
tives values. In these cases the sediment discharge was not considered. These cal-
culated sediment concentrations were lower than the values calculated from the
dried samples, creating an unrealistic curve going up and down. However, this
happened only for some samples. In general, sediment outflow curves had the
same shape as the turbidity curves, with low, steady values for 18 cm hydraulic
0
20
40
60
80
100
120
1.00 2.00 3.00 4.00 5.00 6.00
Sed
ime
nts
(m
g)
Time (Minutes)
18 cm
38 cm
102 cm
c)
Page 34
31
head and a high initial value and then steady values for 38 and 102 cm hydraulic
head.
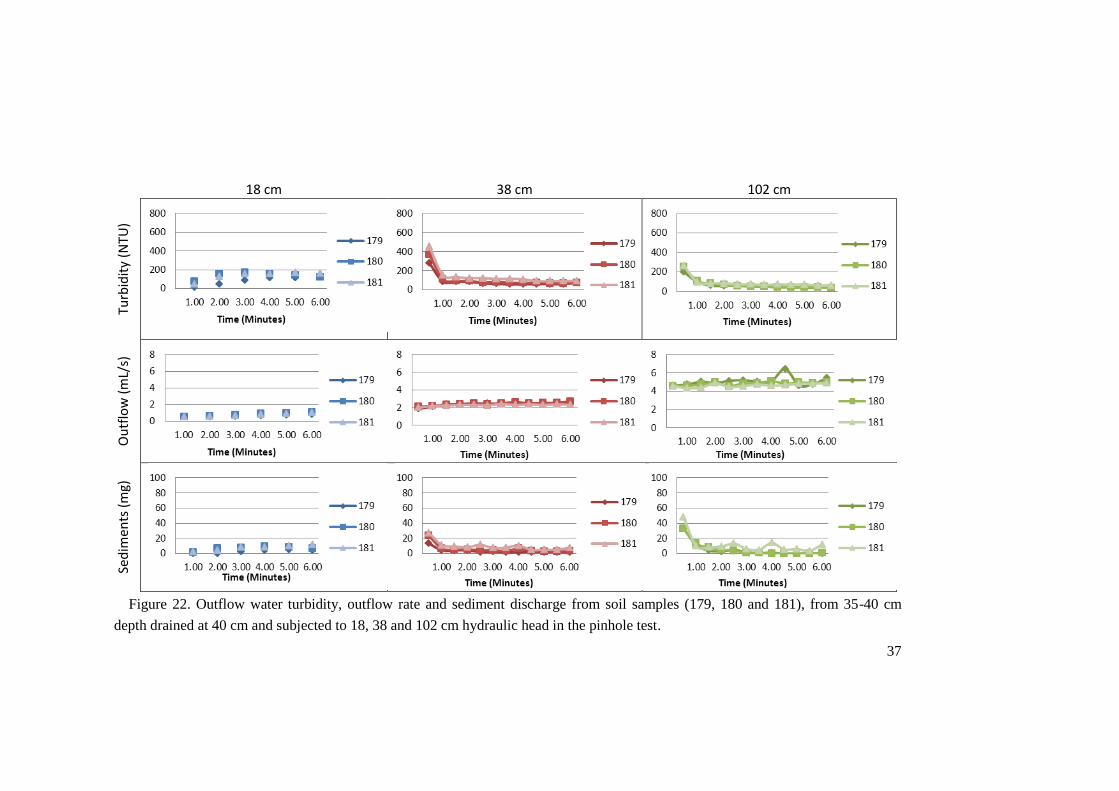
There were small differences between samples with different water contents.
Saturated samples had lower sediment outflow than partially drained samples for
both the high initial values at the beginning of the test and the steady final values.
The samples drained in the sandbox (40 and 100 cm tension) showed higher val-
ues of sediment outflow. This agrees with Nadal-Romero et al. (2011), who found
that higher soil water content gave less sediment discharge.
There were exceptions to this finding for the hydraulic head applied, especially
in some soil samples from the surface layer (10-15 cm depth). During the pinhole
test, some small cavities were created in some samples (161, 164, 167 and 175)
due to the roughness of the surface and thus soil density appeared lower (less
compacted). Due to this, the turbidity and the water flow were higher in these
samples than in other corresponding samples, as shown in Figures 20 and 23.
In spite of these difficulties, the modified pinhole test was simple and easy to
reproduce. The recommendations for this test are to drain clayey soil samples at
100 cm and to calculate soil sediment discharge in the outflow in order to study
the soil response to the different hydraulic heads. For a complete view of the soil
specimen response during the pinhole test, cumulative sediment discharge may
better reflect the response to the three hydraulic heads applied.
Page 35
32
18 cm 38 cm 102 cm
Turb
idit
y (N
TU)
Ou
tflo
w (
mL/
s)
Sed
imen
ts (
mg)
Figure 17. Outflow water turbidity, outflow rate and sediment discharge from saturated soil samples (1383, 1384, 1385 and 1386)
from 10-15 cm depth subjected to 18, 38 and 102 cm hydraulic head for the pinhole test.
Page 36
33
18 cm 38 cm 102 cm
Turb
idit
y (N
TU)
Ou
tflo
w (
mL/
s)
Sed
imen
ts (
mg)
Figure 18. Outflow water turbidity, outflow rate and sediment discharge from saturated soil samples (1390, 1391, 1392 and 1393)
from 22-27 cm depth subjected to 18, 38 and 102 cm hydraulic head in the pinhole test.
Page 37
34
18 cm 38 cm 102 cm
Turb
idit
y (N
TU)
Ou
tflo
w (
mL/
s)
Sed
imen
ts (
mg)
Figure 19. Outflow water turbidity, outflow rate and sediment discharge from saturated soil samples (1394, 1395, 1396 and 1397)
from 34-40 cm depth subjected to 18, 38 and 102 cm hydraulic head in the pinhole test.
Page 38
35
18 cm 38 cm 102 cm
Turb
idit
y (N
TU)
Ou
tflo
w (
mL/
s)
Sed
imen
ts (
mg)
Figure 20. Outflow water turbidity, outflow rate and sediment discharge from soil samples (161, 163 and 164) from 10-15 cm depth
drained at 40 cm tension and subjected to 18, 38 and 102 cm hydraulic head in the pinhole test.
Page 39
36
18 cm 38 cm 102 cm
Turb
idit
y (N
TU)
Ou
tflo
w (
mL/
s)
Sed
imen
ts (
mg)
Figure 21. Outflow water turbidity, outflow rate and sediment discharge from soil samples (165, 168, 169) from 22-27 cm depth
drained at 40 cm tension and subjected to 18, 38 and 102 cm hydraulic head in the pinhole test.
Page 40
37
18 cm 38 cm 102 cm
Turb
idit
y (N
TU)
Ou
tflo
w (
mL/
s)
Sed
imen
ts (
mg)
Figure 22. Outflow water turbidity, outflow rate and sediment discharge from soil samples (179, 180 and 181), from 35-40 cm
depth drained at 40 cm and subjected to 18, 38 and 102 cm hydraulic head in the pinhole test.
Page 41
38
18 cm 38 cm 102 cm
Turb
idit
y (
NT
U)
Outf
low
(m
L/s
)
Sed
imen
ts (
mg)
Figure 23. Outflow water turbidity, outflow rate and sediment discharge from soil samples (167, 170 and 175) from 10-15 cm depth
drained at 100 cm and subjected to 18, 38 and 102 cm hydraulic head in the pinhole test.
Page 42
39
18 cm 38 cm 102 cm
Turb
idit
y (
NT
U)
Outf
low
(m
L/s
)
Sed
imen
ts (
mg)
Figure 24. Outflow water turbidity, outflow rate and sediment discharge from soil samples (172, 173 and 178) from 22-27 cm
depth drained at 100 cm and subjected to 18, 38 and 102 cm hydraulic head in the pinhole test.
Page 43
40
18 cm 38 cm 102 cm
Turb
idit
y (
NT
U)
Outf
low
(m
L/s
)
Sed
imen
ts (
mg)
Figure 25. Outflow water turbidity, outflow rate and sediment discharge from soil samples (188, 192 and 193) from 35-40 cm depth
drained at 100 cm and subjected to 18, 38 and 102 cm hydraulic head in the pinhole test.
Page 44
41
5 Conclusions
Applying different rain intensities to soil using the rain simulator produced di-
rectly related flow rates, i.e. with increasing rain intensity giving increasing out-
flow volume. The actual outflow rates were determined by rain intensity and soil
conditions, i.e. soil water content. However, when a high rain intensity was ap-
plied first the outflow reached more than 50% of the input flow, while when low
intensity rain was applied at the beginning, the outflow was less than 50% of the
input flow.
The tension infiltrometer did not show the expected differences between treat-
ments because there was great variation between replicates. This may have been
due to the spatial variability in the soil or to difficulties in measurements. Use of a
greater number of replicates is recommended to overcome the problem of variabil-
ity in the soil.
Different variables were tested in method development for the pinhole test. The
hydraulic head showed a positive relationship with outflow rate and turbidity val-
ues of the water collected during the test. Specimen preparation proved to be easi-
er and the sample was not so compacted when pressing the pinhole cylinder into
the soil. A moulding clay that was easy to work and did not stick or colour the wa-
ter was used to seal and prevent flow between the soil specimen and the walls of
the cylinder. Instead of pea shingle, white plastic beads (4 mm diameter) used be-
cause was easy to check for cleanness. In addition to this, it was found to be im-
portant to extract the needle by turning it slowly when perforating the soil speci-
men in order to avoid blocking the hole, while use of a turning valve to avoid bub-
bles in the stand pipe made it easier to read the actual hydraulic head.
Analysis of water collected from soil samples during the pinhole tests proved
that turbidity is a good surrogate parameter for soil sediment discharge. A linear
relationship was found between the two in the pinhole tests, but this relationship
must be verified since the low turbidity values found here may not be representa-
Page 45
42
tive. Furthermore, for erodibility analysis turbidity values must be considered to-
gether with outflow rates. Our recommendation is to express the results as trans-
ported sediment (mg) or cumulative sediment discharge, as these numerical values
are easier to understand and compare between different experiments. In the soil
samples tested here, topsoil proved to be more reactive than lower layers, and
samples drained at 100 cm had higher sediment transport. Therefore, our recom-
mendation is to use samples from the soil depth of interest and drained at 100 cm.
Page 46
43
References
American Society for Testing Materials, 1998, Standard Test Method for Identification and Classifi-
cation of Dispersive Clay Soils by the Pinhole Test, D4647
Amézketa, E., 1999, Soil Aggregate Stability: A review, Journal of Sustainable Agriculture, 14:2-3,
83-151
Boers, Th. M., van Deurzen, F. J. M. P., Eppink, L. A. A. J., Ruytenberg, R. E., 1992, Comparison of
infiltration rates measured with an infiltrometer, a rainulator and a permeameter for erosion re-
search in SE Nigeria, Soil Technology, 5: 1, pp. 13-26
Craig, R. F., 1997, Soil Mechanics, Spon Press, pp. 39
Davies-Colley, R. J., Smith, D. G., 2001, Turbidity suspended sediment, and water clarity: A Review,
Journal of the American Water Association, American Water Association, 37: 5
Gardner, W. R., 1958, Some steady-State Solutions of the Unsaturated Moisture Flow Equation With
Application to Evaporation From A Water Table, Soil Science, 85: 4, pp. 228-232
HACH Company, 1996, Laboratory Turbidimeter Model 2100N, Instruction Manual (2nd Edition)
Joel, A., Messing, I., 2001, Infiltration Rate and Hydraulic Conductivity Measured with Rain Simu-
lator and Disc Permeameter on Sloping Arid Land, Arid Land Research and Management, 15: 4,
pp. 371-384
Lockeretz, W., 1994, Soil and Water Quality: An agenda for Agriculture, Environment, 36: 5, pp.
189-309
Messing, I., Jarvus, N. J., 1993, Temporal variation in the hydraulic conductivity of a tilled clay soil
as measured by tension infiltrometers, Journal of Soil Science, 44: 1
Nadal-Romero, E., Verachtert, E., Maes, R., Poesen, J., 2011, Quantitative assessment of the piping
erosion susceptibility of loess-derived soil horizons using the pinhole test, Geomorphology, 135:
1-2
Pavanelli, D., Bigi, A., 2005, Indirect Methods to Estimate Suspended Sediment Concentration: Re-
liability and Relationship of Turbidity and Settleable Solids, Biosystems Engineering, 90
Sherard, J. L., Decker, R. S., Dunnigan, L. P., Steele, E. F, 1976, ., Pinhole test for identifying dis-
persive soils, Journal of the Geotechnical Engineering Division, 102: 1, pp. 69-85
Smith, K. A., Mullins, C. E., 2000, Soil and Environmental Analysis: Physical Methods (2nd Edi-
tion)
Soil Measurement Systems, 2008, Tension Infiltrometer, Users Manual, Tucson, Arizona, USA
Watts, C. W., Dexter, A. R., Dumitru, E., Arvidsson, J., 1996, An assessment of the vulnerability of
soil structure to destabilisation during tillage, Part I, A laboratory test, Soil & Tillage Research
37: 161-174
Page 47
44
Williamson, T. N., Crawford, C. G., 1978-1995, Estimation of suspended-sediment concentration
from total suspended soils and turbidity data for Kentucky, Journal of the American Water Re-
sources Association, 47: 4
Wooding, R. A., 1968, Steady infiltration from a shallow circular pond, Water Resources Research
4, pp. 1259-1273
Page 48
45
Acknowledgements
I thank Abraham Joel for being my supervisor for this thesis at SLU, Ingrid
Wesström for her help in the corrections and comments, Ingmar Messing for his
help with the tension infiltrometer, and Mary McAfee for her corrections. I also
thank Anders Larsson and Maria Sandin for their help during the work. From
Spain, I thank Antonio Dámaso del Campo for his support from UPV. Finally, I
really thank my family and friends for their support during my studies.