29
Estimation Kline Chapter 7 (skip 160-176, appendices)
| Date post: | 03-Jan-2016 |
| Category: |
Documents |
| Upload: | lionel-stephens |
| View: | 219 times |
| Download: | 1 times |

Estimation
Kline Chapter 7(skip 160-176, appendices)

Estimation
• Estimation = the math that goes on behind the scenes to give you parameter numbers
• Common types:– Maximum Likelihood (ML)– Asymptotically Distribution Free (ADF)– Unweighted Least Squares (ULS)– Two stage least squares (TSLS)

Max Like
• Estimates are the ones that maximize the likelihood that the data were drawn from the population– Seems very abstract no?
Max Like
• Normal theory method – Multivariate normality is assumed to use ML– Therefore it’s important to check your normality
assumption – other types of estimations may work better for non-normal DVs (endogenous variables)

Max Like
• Full information method – estimates are calculated all at the same time– Partial information methods calculate part, then
use those to calculate the rest

Max Like
• Fit function – the relationship between the sample covariances and estimated covariances– We want our fit function to be:• High if we are measuring how much they match
(goodness of fit)• Low if we are measuring how much they mismatch
(residuals)

Max Like
• ML is an iterative process – The computer calculates a possible start solution,
and then runs several times to create the largest ML match.
• Start values – usually generated by the computer, but you can enter values if you are having problems converging to a solution

Max Like
• Inadmissable solutions – you get numbers in your output but clearly parameters are not correct– You will get a warning on the notes for model page

Max Like
• Heywood cases– Parameter estimates are illogical (huge)– Negative variance estimates • Just variances, covariances can be negative
– Correlation estimates over 1 (SMCs)

Max Like
• What’s happening?– Specification error– Nonidentification– Outliers– Small samples– Two indicators per latent (more is always better)– Bad start values (especially for errors)– Very low or high correlations (empirical under
identification)

Max Like
• Scale free/invariant– Means that if you change the scale with a linear
transform, the model is still the same– Assumes unstandardized start variables• Otherwise you’d have standardized standardized
estimates, weird.
Max Like
• Interpretation of Estimates– Loadings/path coefficients – just like regression
coefficients• Remember you can click the estimate to get help!
– Error variances tell you how much variance is not accounted for by the model (so you want to be small)• The reverse is SMCs – tell you how much variance
Other Methods
• For continuous variables with normal distributions– Generalized Least Squares (GLS)– Unweighted Least Squares (ULS)– Fully Weighted Least Squares (WLS)

Other Methods
• ULS – Pros: • Does not require positive definite matrices• Robust initial estimates
– Cons:• Not scale free• Not as efficient• All variables in the same scale

Other Methods
• GLS– Pros:• Scale free• Faster computation time
– Cons:• Not commonly used? If this runs so does ML.

Other Methods
• Nonnormal data– In ML, estimates might be accurate, but SEs will be
large (eek).– Model fit tends to be overestimated

Other Methods
• Corrected normal method – uses ML but then adjusts the SEs to be normal (robust SE).
• Satorra-Bentler statistic– Adjusts the chi square value from standard ML by
the degree of kurtosis/skew– Corrected model test statistic

Other Methods
• Bootstrapping!– We will cover this section later.

Other Methods
• Asymptotically distribution free – ADF– (in the book he calls it arbitrary) – Estimates the skew/kurtosis in the data to
generate a model– May not converge because of number of
parameters to estimate– I’ve always found this to not be helpful.

Other Methods
• Non continuous data– You can estimate some with non-continuous data,
but you are better off switching to Mplus, which has robust (and automatic!) estimators for categorical data.
– (so blah on page 178-182, as you can’t really do this in Amos easily).

Analysis Properties
• Click on the abacus with buttons button to get started


Estimation
• You can pick the type of estimation on the left.• You can pick estimate means and intercepts
on the right (must select for multigroup and models with missing data).
• Look! You can turn off the output for the independence and saturated models.

Output
• Here you want to select (pretty much always):– Standardized estimates– Multiple correlations– Modification indices (won’t run with estimate
means and intercepts on).– The rest of the options we’ll talk about as we go.

Entering Correlation Matrices
If you have means, the last row is label mean.

Teacher Example

Mother example
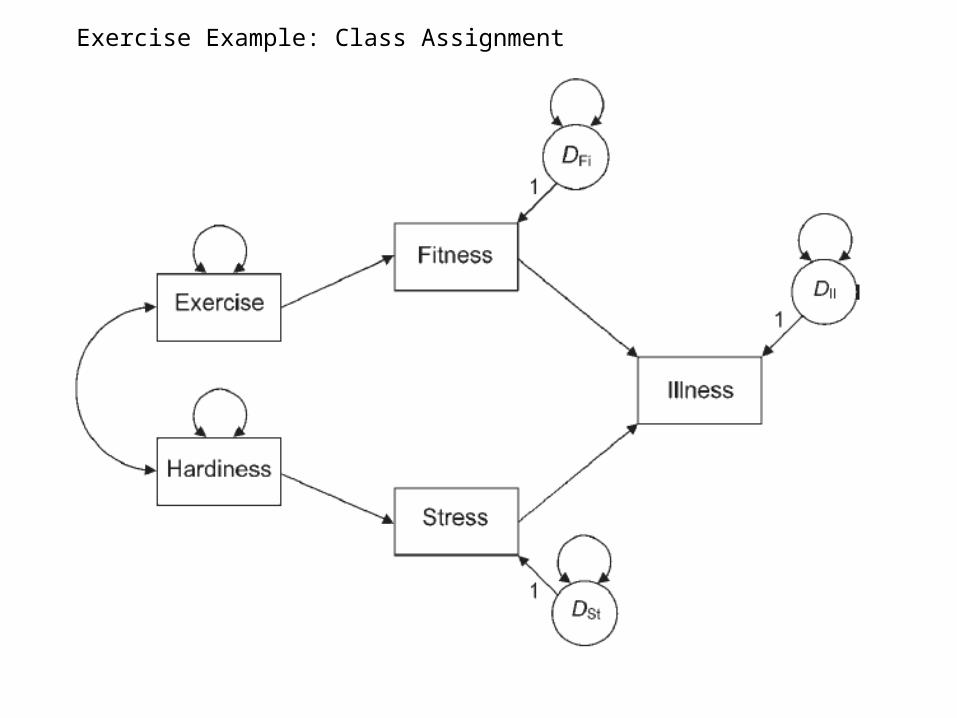
Exercise Example: Class Assignment


