U. S. DEPARTMENT OF COMMERCE NATIONAL BUREAU OF STANDARDS RESEARCH PAPER RP1432 Part of Jou.rnal of Research of the lXational Bureau. of Standards, Volume 27, lXovember 1941 ESTIMATION OF ALDEHYDE GROUPS IN HYDROCELLULOSE FROM COTTON By Albert R. Martin,l Leonard Smith,l Roy L. Whistler,l and Milton Harris 1 ABSTRACT The aldehyde content of hydro cellulose may be readily estimated by titration with iodine in alkaline solu tion. Investigation of the rate of oxidation of hydro- cellulose by iodine at 0° C and pH 10.6 showed that there is an initial rapid r eaction in the first hour accompanied by a side reaction. This latter r eaction continues after the rapid r eaction has ceased and consumes iodine slowly at a constant rate. Purified cotton cellulose shows an initial reaction with iodine and after 1 hour exhibits a side reaction of the same rate as the hydrocellulose. By applying a correction for the amount of iodine consumed in the side reaction, it is possible to estimate the iodine utilized in the oxidation of aldehyde groups. Since iodine utiliz ed in this way converts alde hyde to carboxyl groups, an, independent check on the value obtained with iodine is readily obtained by estimation of the car- boxyl groups thus formed by titration with silver o-nitrophenolate. It is shown that the extent of hydrolytic degradation as determined by this method compared well with similar measurements by the viscosity method. CONTENTS Page I. Introduction _________________ ______ _____________________________ 449 II. Experimental procedure _ _ __ _ ___ __ _ _ _____ _ __ _ ___ ___ _ __ _ _ _ ___ _ _ __ __ 450 1. Materials __ _ _ __ __ __ __ __ ____ ___ __ _ ___ _ ____ __ __ _ _ _ __ _ _ _ __ __ 450 2. Analytical methods _________________________ ______ ___ ___ ___ 451 3. Description of the iodine titration ____________ _ ___ ___ ________ 451 III. Results and discussion _____________ ____________ __ ________________ 451 1. Effect of temperature and pH on the rate of oxidation of glucose by iodine ______________________________ ______ ___ _____ __ 451 2. Application of the method to cotton cellulose _________________ 452 3. Estimation of the carboxyl groups in the cellulose after oxidation with iodine _________ _____ _________ _______ _______________ 454 4. Application of the method to a series of hydrocelluloses __ ____ __ 455 5. Es timation of molecular weights ______ _____________________ _ 456 IV. References ___ ___ ____ _____ __________________ ___ ____ __ __ _____ _____ 457 I. INTRODUCTION A number of methods have been proposed at various times for the estimation of the aldehyde content of degraded cellulosic materials. Probably the most widely used among these has been the copper num- ber method. The disadvantages of most of the methods have fre- quently been discussed and reviewed in the lit 'eratur e [1, 2, 3, 4, 5] 2 and need not be furth er considered here. 1 Research Associates at the National Bureau of Standards, repr esenting the Textile Foundation. , Figures in brackets indicate literature references at the end of this paper. 449
Transcript
U. S. DEPARTMENT OF COMMERCE NATIONAL BUREAU OF STANDARDS
RESEARCH PAPER RP1432
Part of Jou.rnal of Research of the lXational Bureau. of Standards, Volume 27, lXovember 1941
ESTIMATION OF ALDEHYDE GROUPS IN HYDROCELLULOSE FROM COTTON
By Albert R. Martin,l Leonard Smith,l Roy L. Whistler,l and Milton Harris 1
ABSTRACT
The aldehyde content of hydro cellulose may be readily estimated by titration with iodine in alkaline solution. Investigation of the rate of oxidation of hydrocellulose by iodine at 0° C and pH 10.6 showed that there is an initial rapid reaction in the first hour accompanied by a side reaction. This latter reaction continues after the rapid reaction has ceased and consumes iodine slowly at a constant rate. Purified cotton cellulose shows an initial reaction with iodine and after 1 hour exhibits a side reaction of the same rate as the hydrocellulose. By applying a correction for the amount of iodine consumed in the side reaction, it is possible to estimate the iodine utilized in the oxidation of aldehyde groups. Since iodine utilized in this way converts aldehyde to carboxyl groups, an, independent check on the value obtained with iodine is readily obtained by estimation of the carboxyl groups thus formed by titration with silver o-nitrophenolate. It is shown that the extent of hydrolytic degradation as determined by this method compared well with similar measurements by the viscosity method.
III. Results and discussion _____________ ____________ __ ________________ 451 1. Effect of temperature and pH on the rate of oxidation of glucose
by iodine ______________________________ ______ ___ _____ __ 451 2. Application of the method to cotton cellulose _________________ 452 3. Estimation of the carboxyl groups in the cellulose after oxidation
with iodine _________ _____ _________ _______ _______________ 454 4. Application of the method to a series of hydrocelluloses __ ____ __ 455 5. Estimation of molecular weights ______ _____________________ _ 456
A number of methods have been proposed at various times for the estimation of the aldehyde content of degraded cellulosic materials. Probably the most widely used among these has been the copper number method. The disadvantages of most of the methods have frequently been discussed and reviewed in the lit'erature [1, 2, 3, 4, 5] 2
and need not be further considered here. 1 Research Associates at the National Bureau of Standards, representing the Textile Foundation. , Figures in brackets indicate literature references at the end of this paper.
449
450 Journal of Research of the National Bureau of Standards Vol. 17
The method of Bergmann and Machemer [6], which involves the use of iodine in alkaline solution, seemed to offer considerable promise even though it has been rather severely criticized by a number of workers [7, 8, 9]. This method is based on the ability of iodine in alkaline solution to oxidize aldehyde groups to carboxyl groups [23], and is used in somewhat the same manner as earlier methods for the oxidation of glucose and other aldehyde sugars [10, 11]. It has been shown that aldoses are quantitatively oxidized to the corresponding aldonin 9.cids by iodine in alkaline solution [10, 23].
The claims of Bergmann and Machemer that the iodine consumed by cellulose is selectively confined to the oxidation of free aldehyde groups to carboxyl groups and that the reaction is of a stoichiometric nature have been disputed, especially by Hess and his coworkers [7], Brissaud [8], and Sakurada [9]. The principal criticisms have been that the consumption of iodine does not cease at any given time but proceeds more or less indefinitely, and accordingly that the reaction is not stoichiometric.
In the present investigation, a study was made of the factors which influence the consumption of iodine by glucose and by cotton cellulose. Preliminary experiments indicated that the above-mentioned criticisms were valid and that the results were erratic when the procedure described by Bergmann and Machemer was followed. The values obtained for the content of reducing groups in a given sample of degraded cellulose depended on a number of conditions; for example, the length of time the reaction was allowed to proceed, the temperature, and the pH values of the iodine solutions. The experiments further indicated that more than one reaction was taking place. This, however, was not surprising since in practically all methods which have been devised for the estimation of reactive or functional chemical groups in natural products, such as the proteins or cellulosic materials, this same difficulty has been encountered. An explanation for such behavior is found in the fact that these materials are extremely complex and contain so many reactive groups that the elimination of side reactions is practically impossible.
It is shown in the present paper, that the extent of the side reaction can be determined and accordingly a correction can be made for the amount of iodine consumed in this way. The remainder of the iodine is used to oxidize aldehyde groups to carboxyl groups, as shown by direct estimation of the carboxyl groups thus formed.
II. EXPERIMENTAL PROCEDURE 1. MATERIALS
Raw cotton was dewaxed by extraction with hot alcohol for 24 hours and then washed thoroughly with cold distilled water. The cotton was further purified by boiling with a I-percent solution of sodium hydroxide for 8 hours. The procedure was essentially the same as that described by Corey and Gray [12] except that the apparatus of Worner and Mease [13] was used.
A series of hydrocelluloses of different fluidities were prepared by steeping samples of the purified cotton in hydrochloric acid solutions, ranging in concentrations from 0.5 to 5.0 N, for 24 hours. The temperature of the solutions was 21°C. The samples were finally washed with distilled water until the wash waters were neutral to litmus.
Martin, Smith, ] Whistler, Harris Aldehyde Groups in Hydrocellulose
2. ANALYTICAL METHODS
451
The fluidities of dispersions of purified cellulose and of the hydrocelluloses in cuprammonium hydroxide reagent were determined by the method of Clibbons and Geake [14], as modified by Mease [15].
Carboxyl contents were determined by measuring the amount of silver bound by the fiber from a solution of silver o-nitrophenolate, according to the procedure described by 8001me and Harris [16].
3. DESCRIPTION OF THE IODINE TITRATION
The amount of iodine consumed by the materials used in this work was determined as follows: 100 ml of a buffer solution at approximately pH 10.6, prepared by mixing 15 parts of 0.2M sodium carbonate and 1 part of 0.2M sodium bicarbonate, was pipetted into a 500-ml glass-stoppered Erlenmeyer flask and then cooled to 00 C in a thermostat. 25 ml of a 0.0500 N iodine solution coutaining 40 g of potassium iodide per liter, previously cooled to 00 C, was then added and the sample to be titrated immediately introduced. In the experiments with glucose, 0.05 g of the sugar was used; with cotton, about 1-g samples were used. .At the end of a specified time interval, 10 ml of 5 N Hel was added and the iodine remaining in the solution was measured by titration with standard sodium thiosulfate to the starch end point.
When analyses were made on cotton, the mixture was swirled during addition of thiosulfate. N ear the end point the solution became very nearly colorless although the sample still contained some iodine, as indicated by the brown color of the fiber. .At this point, addition of the thiosulfate was stopped, the stopper replaced in the flask, and the mixture vigorously shaken. Care was taken to release the stopper of the flask frequently during this operation, since carbon dioxide was released from the solution. .After the mixture was shaken, the titration was completed to the point where both the solution and sample were colorless.
Blank determinations on identical solutions which did not contain either glucose or cotton were made for each time period. This is necessary since it has been shown [17] that the recovery of iodine from alkaline solution is not quantitative. From the difference in amount of thiosulfate required by the blank solution and by the solution containing the sample, the number of milliequivalents of iodine consumed per gram of dry sample was calculated.
III. RESULTS AND DISCUSSION
1. EFFECT OF TEMPERATURE AND pH ON THE RATE OF OXIDATION OF GLUCOSE BY IODINE
In order to obtain information on the effect of temperature and pH on the rate of oxidation of aldehyde groups with iodine, a few preliminary experiments were made with glucose. While it is recognized that the conditions which are optimum for the oxidation of aldehyde groups in soluble sugars may not necessarily be optimum for similar oxidation of aldehyde groups in cellulosic materials, the assumption was made that they are probably not greatly different.
L
452 Journal oj Research oj the National Bureau oj Standards Vol. 21
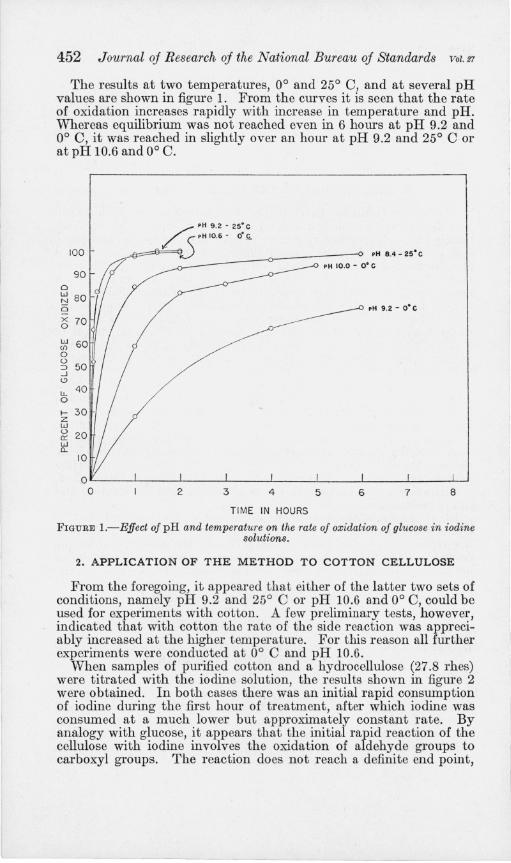
The results at two temperatures, 0° and 25° 0, and at several pH values are shown in figure 1. From the curves it is seen that the rate of oxidation increases rapidly with increase in temperature and pH. Whereas equilibrium was not reached even in 6 hours at pH 9.2 and 0° 0, it was reached in slightly over an hour at pH 9.2 and 25° 0 or at pH 10.6 and 0° O.
FIGURE I.-Effect of pH and temperature on the rate of oxidation of glucose in iodine solutions.
2. APPLICATION OF THE METHOD TO COTTON CELLULOSE
From the foregoing, it appeared that either of the latter two sets of conditions, namely pH 9.2 and 25° 0 or pH 10.6 and 0° 0, could be used for experiments with cotton. A few preliminary tests, however, indicated that with cotton the rate of the side reaction was appreciably increased at the higher temperature. For this reason all further experiments were conducted at 0° C and pH 10.6.
When samples of purified cotton and a hydrocellulose (27.8 rhes) were titrated with the iodine solution, the results shown in figure 2 were obtained. In both cases there was an initial rapid consumption of iodine during the first hour of treatment, after which iodine was consumed at a much lower but approximately constant rate. By analogy with glucose, it appears that the initial rapid reaction of the cellulose with iodine involves the oxidation of aldehyde groups to carboxyl groups. The reaction does not reach a definite end point,
Martin, Smith, ] Whistler, Harris Aldehyde Groups in Hydrocellulose 453
however, and the slower side r eaction (straight-line portions of the curves) involves the consumption of iodine presumably in some other way. Support is lent to this idea by the fact that the straight-line portions of both curves are closely parallel and that the only difference then is the extent of the primary reaction, which would be expected to be greater for the hydrocellulose. The difference between the parallel curves would then be a measure of the aldehyde groups formed in the hydrolytic degradation of the purified cotton.
::;; « a::: C>
a:: ~ 0.04 (/)
f-Z W ...J
~ 0 .03 ::; a w ::J ...J
~ 0.02 ::; a w ::;; ::> (/)
5 0.01 u w z a Q
Q HYDROCELLULOSE
() HYOROCELLULOSE - PRETREATED WITH IODINE
o PURIFIED COTTON
• PURIFIED COTTON - PRETREATED WITH IODINE"
TIME IN HOURS
FIGURE 2.-Rates of consumption of iodine by purified cotton and by a sample of hydrocellulose (27.8 rhes) from solutions at pH 10.6 and 0 0 C.
Attention is now directed to the curve for the pUl'ified cotton. It would appear from the rapid initial consumption of iodine that there was an appreciable number of reducing groups in the purified cotton. Indeed, this was assumed to be the case until measurements were made of the carboxyl contents of the samples which had been oxidized with iodine. When this was done (as shown in the following section), no increase in the carboxyl content comparable to the initial increase in iodine consumed was noted. This immediately led to the conclusion that the amount of iodine initially taken up by the pUl'ified cotton was not utilized in oxidation of aldehyde to carboxyl groups but was used up in some unidentified manner. Further evidence supporting this view was obtained from the following experiments. Samples of the purified cotton and the hydrocellulose were pretreated with iodine for 2 hours by the method previously described except that the reaction mixture was not acidified. Instead, the samples were thoroughly washed with distilled water until the wash waters showed no reaction with litmus or to starch solution. Samples of these materials were
454 Journal oj Research oj the National Bureau oj Standards Vol. t7
then subjected to the regular iodine titration, the results bein~ shown in figure 2. Pretreatment of the purified cotton did not significantly alter the amount of iodine consumed. On the other hand, the pretreated hydro cellulose consumed iodine at very nearly the same rate as the purified cotton, indicating that the aldehyde groups of the hydro cellulose had been oxidized during the pretreatment. From these results, it appears that the purified cotton does not contain a measurable number of aldehyde groups. However, the possibility that aldehyde groups may have been in the cellulose before purification of the fiber cannot be overlooked, although some arguments against this possibility have already been presented elsewhere [18, 19,20].
On the basis of the foregoing, it is seen that the content of aldehydic reducing groups in the hydro cellulose is obtained from the difference between the straight-line portions of the curves in figure 2. The average of the differences, obtained by subtracting the amount of iodine consumed by the purified cotton from that consumed by the hydrocellulose for each time interval between 2 and 8 hours, is 0.023 milliequivalent of iodine per gram. Since 2 equivalents of iodine are required to oxidize each aldehyde group to a carboxyl group, it follows that the content of aldehydic reducing groups of the hydro cellulose is one-half of this value, or 0.0115 millimole per gram.
In using this method for the examination of an "unknown" sample of hydrocellulose, it is necessary to have available a blank determination on undegraded cellulose of the same kind. If it appears that the sample was obtained from cotton, then the blank determination can be made on a sample of raw cotton purified by the ACS method, or the curve for purified cotton as given in this paper could be used.
A method of more general applicability is the "pretreatment" method described above. By this method, the first treatment with iodine gives a result corresponding to the aldehyde groups plus the blank. A second treatment of the same sample gives a result corresponding to the blank only.
3. ESTIMATION OF THE CARBOXYL GROUPS IN THE CELLULOSE AFTER OXIDATION WITH IODINE
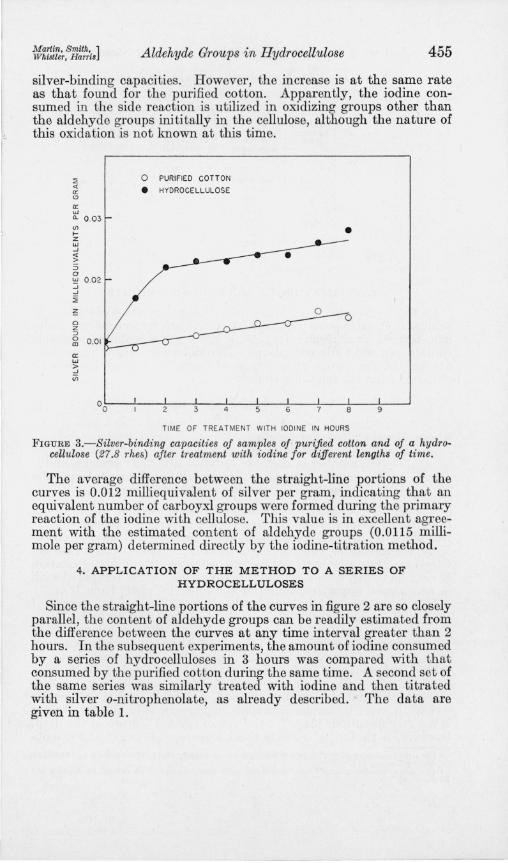
It has been assumed in the foregoing section that the iodine consumed in the primary reaction is utilized in the oxidation of aldehyde to carboxyl groups. As a check on this assumption, the carboxyl contents of the purified cotton and hydrocellulose, after oxidation with iodine, were determined by titration with silver o-nitro.phenolate [16]. In these experiments, the samples were first treated WIth iodine solutions for varying periods of time, as previously described, except that the solutions were not acidified, the iodine being carefully washed from the fiber with distilled water. The results are shown in figure 3.
As seen from the lower curve, the carboxyl content of the purified cotton increased slowly and at an ap:proximately constant rate. As pointed out previously, there is no mitial rapid rise in the curve equivalent to that found in the iodine-titration curve for the same material (fig. 2).
On the other hand, the amount of silver bound by the oxidized hydro cellulose is considerably higher. Treatment of the hydrocellulose with iodine for periods longer than 2 hours resulted in still higher
Martin, Smith, ] Whistler, Harris Aldehyde Groups in Hydrocellulose 455
silver-binding capacities. However, the increase is at the same rate as that found for the purified cotton. Apparently, the iodine consumed in the side reaction is utilized in oxidizing groups other than the aldehyde groups inititally in the cellulose, although the nature of this oxidation is not known at this time.
::; « a: <.0
a: w Q. 0 .03 U> >-Z W ...J « > ::; a '=' 0 .02 ...J ...J
~
~ 0 z :> 0 0.01 OJ
a: w > ...J iii
o PURIFIED COTTON
• HYDROGELLULOSE
•
TIME OF TREATMENT WITH IODINE IN HOURS
FIGURE 3.-Silver-binding capacities of samples of purified cotton and of a hydrocellulose (27.8 rhes) after treatment with iodine for diffel'ent lengths of time.
The average difference between the straight-line portions of the curves is 0.012 milliequivalent of silver per gram, indicating that an equivalent number of carboyxl groups were formed during the primary reaction of the iodine with cellulose. This value is in excellent agreement with the estimated content of aldehyde groups (0.0115 millimole per gram) determined directly by the iodine-titration method.
4. APPLICATION OF THE METHOD TO A SERIES OF HYDROCELLULOSES
Since the straight-line portions of the curves in figure 2 are so closely parallel, the content of aldehyde groups can be readily estimated from the difference between the curves at any time interval greater than 2 hours. In the subsequent experiments, the amount of iodine consumed by a series of hydrocelluloses in 3 hours was compared with that consumed by the purified cotton during the same time. A second set of the same series was similarly treated with iodine and then titrated with silver o-nitrophenolate, as ah'eady described. The data are given in table 1.
456 Journal of Research of the National Bureau oj Standards Vol. 17
TABLE I.-Aldehyde contents of a series of hydrocelluloses
Aldehyde content
Fluidity of hydrocel- From silver-
lulose From titration binding capac_ with iodine ity after oxida-
In the hydrolytic degradation of cellulose, an aldehyde group is produced at each point ruptured-that is, each hydro cellulose molecule formed as a result of splitting the original cellulose molecule contains an aldehyde end-group. The molecular weight 3 (numberaverage) of the system at any stage of degradation may therefore be obtained from the following equation:
W M=--, n+a
where M=the molecular weight, W = the weight of cellulose,
(1)
n=the number of moles of cellulose originally present, and a=the number of moles of hydro cellulose formed during the
hydrolysis = the number of aldehyde groups.
a is readily estimated by the iodine-titration method, but since the cellulose molecules in the purified cotton apparently do not contain free aldehyde groups, n cannot be determined in this way. Accordingly, the molecular weights cannot be directly estimated from iodinetitration data except in the special case where the degree of degradation is very high. In such a system n becomes very small compared with a, and a good approximation of M is obtained directly from W/a.
If n is determined independently, then the molecular weight of the system at any stage of degradation is determined by eq 1. Thus the molecular weights of the series of hydrocelluloses referred to in the previous section have been calculated, using a value of n obtained from fluidity measurements of purified cotton. These are shown in table 2 and compared with molecular weights obtained by the fluidity method. Since the iodine method gives a number-average 4 molecular weight and the fluidity method, a weight-average 4 molecular weight, it must be emphasized that the agreement in absolute values is entirely fortuitous [21, 22, 24]. An important feature of the data, however, is that they indicate good agreement between the extents
3 The term "molecular weight" is used here with the same meaning that has been given it by Staudinger [25) and by Kraemer [26).
'The terms "number-average" and "weight·average" used here have been defined by Lansing and Kraemer [24).
Martin, Smith, ] Whistler, HarTis Aldehyde Groups in Hydrocellulose 457
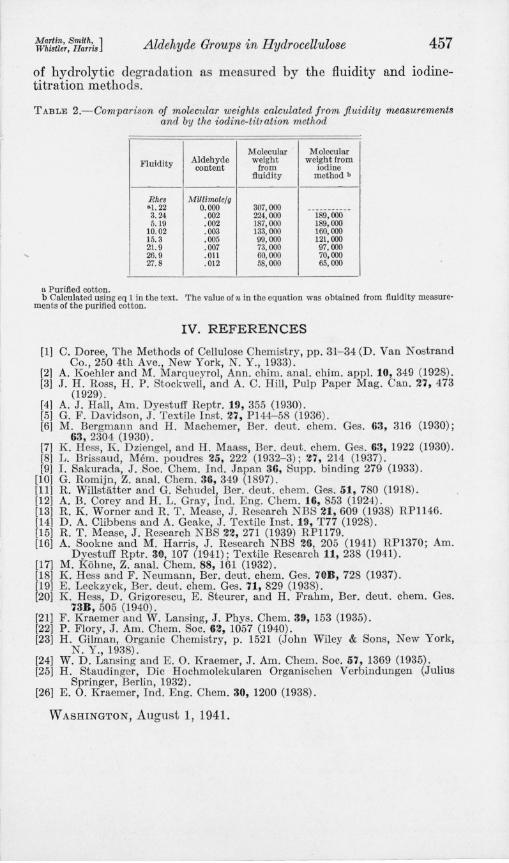
of hydrolytic degradation as measured by the fluidity and iodinetitration methods.
TABLE 2.-Comparison of molecular weights calculated from fluidity measurements and by the iodine-titl ation method
Molecular Molecular Fluidity Aldehyde weight weight from
a Purified cotton. b Calculated using eq 1 in the text. The value ofn in the equation was obtained from fluidity measure
ments of the purified cotton.
IV. REFERENCES
[1] C. Doree, The Methods of Cellulose Chemistry, pp. 31-34 (D. Van Nostrand Co., 250 4th Ave., New York, N. Y., 1933).
[2] A. Koehler and M. Marqueyrol, Ann. chim. anal. chim. app!. 10, 349 (1928). [3] J. H. Ross, H. P. Stockwell, and A. C. Hill, Pulp Paper Mag. Can. 27,473
(1929) . [4] A. J. Hall, Am. Dyestuff Reptr. 19,355 (1930). [5] G. F. Davidson, J. Textile lust. 27, P144-58 (1936). [6] M. Bergmann and H. Machemer, Bel'. deut. chern. Ges. 63, 316 (1930);
63, 2304 (1930). [7] K. Hess, Ie Dziengel, and H. Maass, Ber. deut. chem. Ges. 63, 1922 (1930). [8] L. Brissaud, Mem. poudres 25, 222 (1932- 3); 27, 214 (1937). [9] 1. Sakurada, J . . Soc. Chern. Ind. Japan 36, Supp. binding 279 (1933).
[10] G. Romijn, Z. anal. Chern. 36, 349 (1897). [11] R. Willstatter and G. Schudel, Ber. deut. chern. Ges. 51, 780 (1918). [12] A. B. Corey and H. L. Gray, Ind. Eng. Chern. 16,853 (1924). [13] R. K. Worner and R. T. Mease, J. Research NBS 21, 609 (1938) RP1146. [14] D. A. Clibbens and A. Geake, J . Textile Inst. 19, T77 (1928). [15] R. T. Mease, J. Research NBS 22, 271 (1939) RP1179. [16] A. Sookne and M. Harris, J. Research NBS 26, 205 (1941) RP1370; Am.
Dyestuff Rptr. 30, 107 (1941); Textile Research 11, 238 (1941). [17] M. Kohne, Z. anal. Chem. 88,161 (1932). [18] Ie Hess and F. Neumann, Bel'. deut. chern. Ges. 70B, 728 (1937). [19] E. Leckzyck, Bel'. deut. chern. Ges. 71, 829 (1938). [20] K. H ess, D. Grigorescu, E. Steurer, and H. Frahm, Bel'. deut. chem. Ges.
7aB, 505 (1940). [21] F. Kraemer and W. Lansing, J. Phys. Chern. 39, 153 (1935). [22] P. Flory, J . Am. Chern. Soc. 62, 1057 (1940). [23] H. Gilman, Organic Chemistry, p. 1521 (John Wiley & Sons, New York,
N. Y., 1938). [24] W. D. Lansing and E. O. Kraemer, J . Am. Chern. Soe. 57, 1369 (1935). [25] H. Staudinger, Dic Hochmolekularen Organischen Verbindungen (Julius
Springer, Berlin, 1932). [26] E. O. Kraemer, Ind. Eng. Chern. 30, 1200 (1938).