Estimation of BMP Impact on Chesapeake Bay Program Management Strategies Photo by Lynda Richardson, USDA Natural Resources Conservation Service PREPARED BY: PREPARED FOR: Tetra Tech, Inc. 10306 Eaton Place, Suite 340 Fairfax, VA 22030-2201 Phone: 703-385-6000 www.tetratech.com Chesapeake Bay Trust 60 West Street, Suite 405 Annapolis, MD 21401 Phone: 410-974-2941 www.cbtrust.org April 28, 2017
Transcript
Estimation of BMP Impact on Chesapeake Bay
Program Management Strategies
Photo by Lynda Richardson, USDA Natural Resources Conservation Service
5.3 NRCS CPPE Data (Agriculture BMPs Only) ....................................................................................... 13 5.4 Quality Assurance/Quality Control of Scores from Literature and Expert Panel Reports ................... 15
6 Analysis and Results .................................................................................................................................. 16 6.1 Results ................................................................................................................................................. 16
6.1.1 Score Review and Processing ..................................................................................................... 16 6.1.2 Final Scores ................................................................................................................................. 16
6.2 Considerations for Applying Scores to Specific BMP Implementation ................................................ 17 6.2.1 Aggregating Scores ..................................................................................................................... 17 6.2.2 Comparing Scores across Sectors and Management Strategies ................................................ 17 6.2.3 Adjusting Scores Based on BMP Location and Scale ................................................................. 17 6.2.4 Adjusting Scores Based on Management Strategy Priorities ...................................................... 18
Tables Table 1. Original Management Strategies and Status in BMP Impact Scoring Project .............................................2 Table 2. Example Narrative Scoring Guideline for Blue Crab Abundance Management Strategy ............................6 Table 3. Summary of Contaminant Group Concerns .............................................................................................. 12 Table 4. Priority Management Strategy Score Weighting Example ........................................................................ 19
Estimation of BMP Impact on Chesapeake Bay Program Management Strategies
1
1 Project Background and Purpose
The Chesapeake Bay Trust awarded a contract to Tetra Tech to quantify the effects the Chesapeake Bay
Model’s (CBM’s) best management practices (BMPs) have on each of the Chesapeake Bay Program’s
(CBP’s) management strategies. The results of the project will enable jurisdictions, localities, and others
to assess the impact the BMPs contained in their watershed implementation plans (WIPs) will have on
CBP’s management strategies. This analysis is intended to capture both the co-benefits and unintended
consequences, if applicable, for each BMP. The objective of the project is to create a simple matrix that
assigns an impact score to each BMP (or BMP group) for each management strategy or outcome. These
values are not a quantification of results, but show the BMP’s relative impact. The matrix is not intended
as a method to evaluate WIPs or other restoration plans and is not a requirement for WIP development,
nor is it a quantitative tool for performing rigorous evaluations of BMPs.
The matrix can be used by jurisdictions to help them decide on which BMPs to include in their WIP or
other restoration plan if other BMP selection criteria (e.g., nutrient and sediment load reductions, cost,
implementability) are equally satisfied by the candidate BMPs. It should help them develop WIPs that
achieve the primary goal of reducing nutrient and sediment loads to the Chesapeake Bay, while also
achieving additional goals that are important to them. The matrix considers a typical BMP’s potential for
affecting those additional goals; however, its actual impact could be affected by many factors, which are
not explored in this document. For instance, matrix values could be different for BMPs near the Bay and
upstream in the watershed.
This document has been designed for jurisdictions and others developing WIPs to use as a guide to
understanding how their implementation activities affect the management strategies and additional
goals. It does not look at economic benefits or considerations, except where noted (e.g., the property
value goal). It is anticipated that this information will be included in the Chesapeake Assessment
Scenario Tool (CAST). This document describes the management strategies and additional goals; the
BMPs/BMP groups that Tetra Tech evaluated; the impact scoring guidelines for each management
strategy and additional goal; and the results of BMP scoring for the individual management strategies.
Estimation of BMP Impact on Chesapeake Bay Program Management Strategies
2
2 Management Strategies
Management strategies are specific focus areas developed by the CBP goal implementation teams
(GITs) to describe what is necessary to achieve the Chesapeake Bay Watershed Agreement vision:
…an environmentally and economically sustainable Chesapeake Bay watershed with clean
water, abundant life, conserved lands, and access to the water, a vibrant cultural heritage, and a
diversity of engaged citizens and stakeholders” (CBP 2014)
Each management strategy outlines its goal, outcome(s), and baseline; relevant partners; factors
influencing its success; current efforts and gaps in action, resources, or data; management approaches
that are being used or will be used to achieve the outcome(s) of the strategy; and how progress will be
monitored and assessed.
Tetra Tech reviewed the 29 management strategies with James Davis-Martin of the Virginia Department
of Environmental Quality, the project technical lead for this project and the chair of the Water Quality
Goal Implementation Team (WQGIT). Based on those discussions, 10 management strategies were
removed from the project because they are not applicable (e.g., some management strategies are policy-
oriented and could not be addressed through BMPs). The inapplicable management strategies were
replaced with 10 additional goals not explicitly addressed by the existing management strategies. The
additional goals were identified as representing issues important to local governments and capturing the
co-benefits of BMPs during the Chesapeake Scientific and Technical Advisory Committee Optimization
Workshop and subsequent conversations.
Table 1 lists the original 29 management strategies Tetra Tech reviewed with Mr. Davis-Martin and the
actions agreed upon for each one (i.e., remove or keep). This review resulted in a final list of 19
management strategies and goals for inclusion in the analysis. To aid in understanding the additional
goals, Tetra Tech drafted goal descriptions to mirror the management strategies. Mr. Davis-Martin
reviewed the descriptions, as did Ms. Mary Gattis, who is the coordinator for the Local Government
Advisory Committee. Each description includes a definition, goals, outcomes, and factors influencing
success and is provided in appendix A. Full descriptions of the original management strategies are
available at http://www.chesapeakebay.net/managementstrategies. The Urban Workgroup also suggested
including cost-effectiveness as a category for BMP scoring. Tetra Tech and Mr. Davis-Martin agreed
that cost-effectiveness information already is available in CAST and did not fit the description of a
management strategy or an additional goal/co-benefit.
Table 1. Original Management Strategies and Status in BMP Impact Scoring Project
Goal Strategy Action
Sustainable Fisheries Goal Blue Crab Abundance and Management Kept abundance only
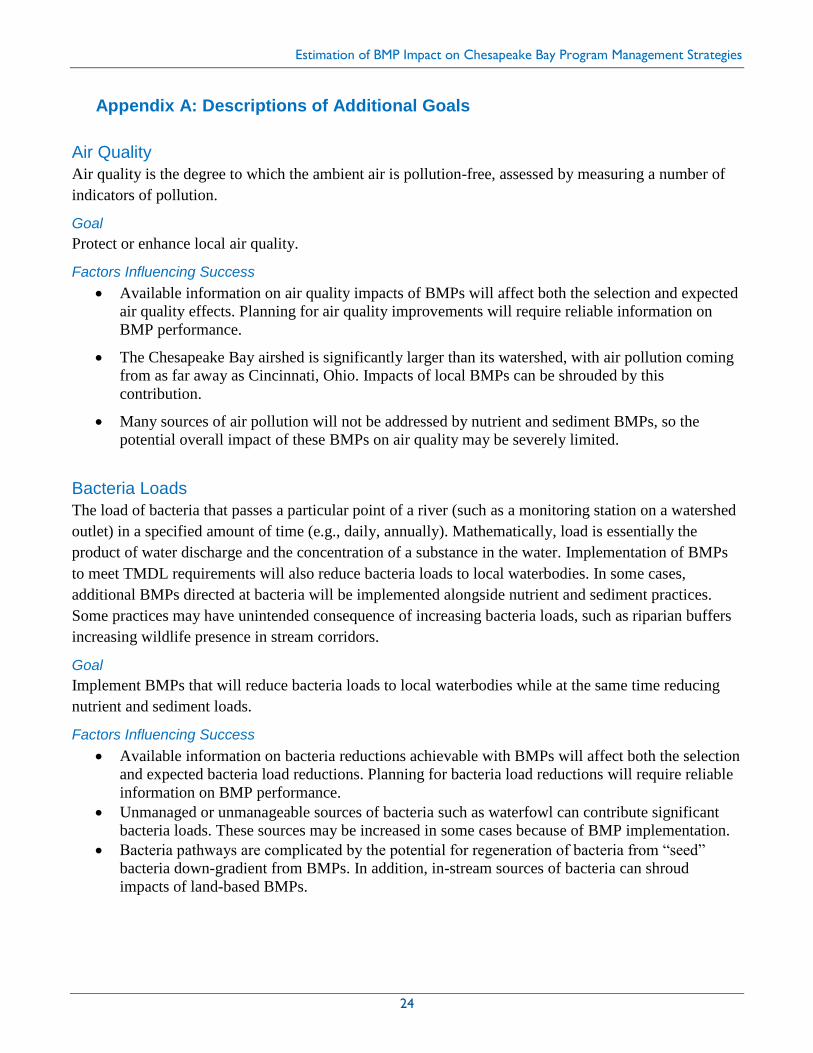
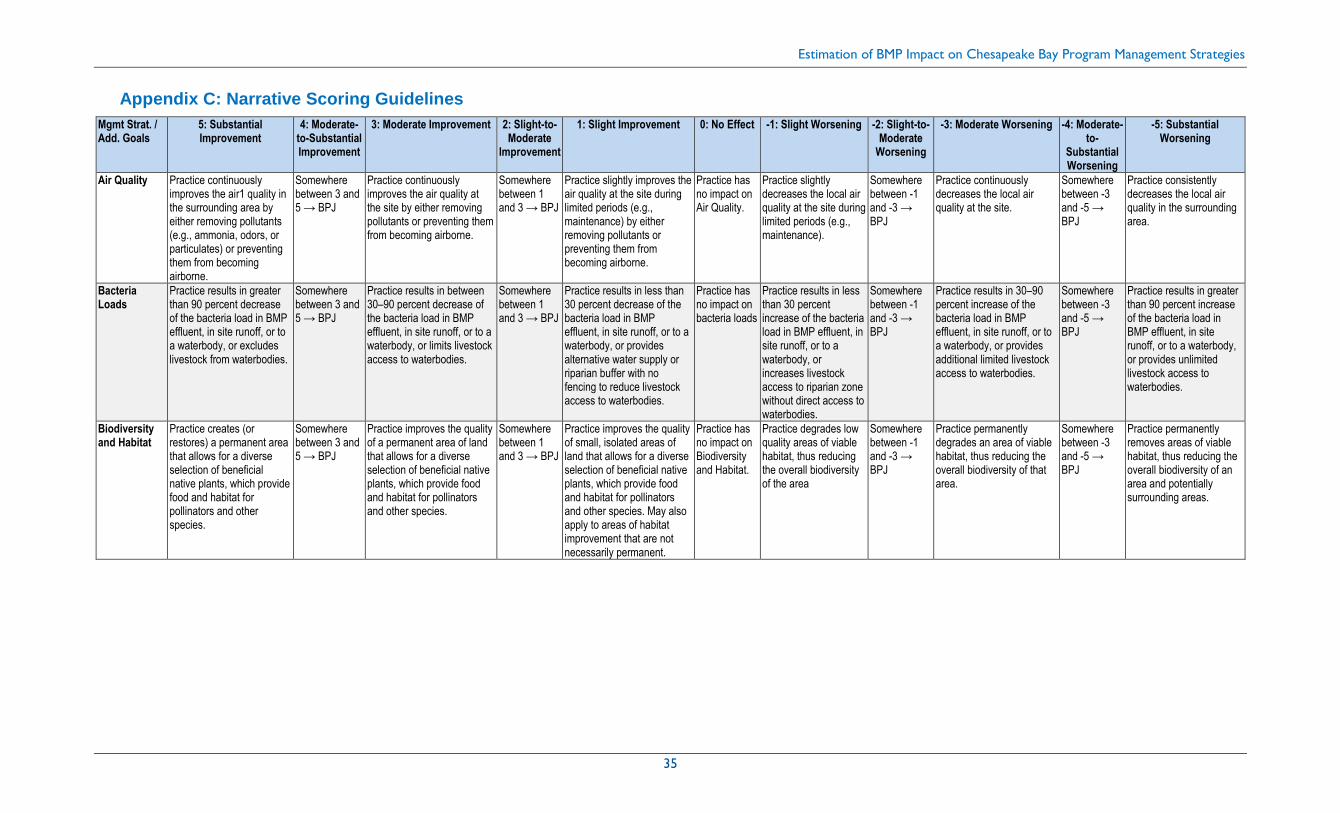
Air Quality Practice continuously improves the air1 quality in the surrounding area by either removing pollutants (e.g., ammonia, odors, or particulates) or preventing them from becoming airborne.
Somewhere between 3 and 5 → BPJ
Practice continuously improves the air quality at the site by either removing pollutants or preventing them from becoming airborne.
Somewhere between 1 and 3 → BPJ
Practice slightly improves the air quality at the site during limited periods (e.g., maintenance) by either removing pollutants or preventing them from becoming airborne.
Practice has no impact on Air Quality.
Practice slightly decreases the local air quality at the site during limited periods (e.g., maintenance).
Somewhere between -1 and -3 → BPJ
Practice continuously decreases the local air quality at the site.
Somewhere between -3 and -5 → BPJ
Practice consistently decreases the local air quality in the surrounding area.
Bacteria Loads
Practice results in greater than 90 percent decrease of the bacteria load in BMP effluent, in site runoff, or to a waterbody, or excludes livestock from waterbodies.
Somewhere between 3 and 5 → BPJ
Practice results in between 30–90 percent decrease of the bacteria load in BMP effluent, in site runoff, or to a waterbody, or limits livestock access to waterbodies.
Somewhere between 1 and 3 → BPJ
Practice results in less than 30 percent decrease of the bacteria load in BMP effluent, in site runoff, or to a waterbody, or provides alternative water supply or riparian buffer with no fencing to reduce livestock access to waterbodies.
Practice has no impact on bacteria loads
Practice results in less than 30 percent increase of the bacteria load in BMP effluent, in site runoff, or to a waterbody, or increases livestock access to riparian zone without direct access to waterbodies.
Somewhere between -1 and -3 → BPJ
Practice results in 30–90 percent increase of the bacteria load in BMP effluent, in site runoff, or to a waterbody, or provides additional limited livestock access to waterbodies.
Somewhere between -3 and -5 → BPJ
Practice results in greater than 90 percent increase of the bacteria load in BMP effluent, in site runoff, or to a waterbody, or provides unlimited livestock access to waterbodies.
Biodiversity and Habitat
Practice creates (or restores) a permanent area that allows for a diverse selection of beneficial native plants, which provide food and habitat for pollinators and other species.
Somewhere between 3 and 5 → BPJ
Practice improves the quality of a permanent area of land that allows for a diverse selection of beneficial native plants, which provide food and habitat for pollinators and other species.
Somewhere between 1 and 3 → BPJ
Practice improves the quality of small, isolated areas of land that allows for a diverse selection of beneficial native plants, which provide food and habitat for pollinators and other species. May also apply to areas of habitat improvement that are not necessarily permanent.
Practice has no impact on Biodiversity and Habitat.
Practice degrades low quality areas of viable habitat, thus reducing the overall biodiversity of the area
Somewhere between -1 and -3 → BPJ
Practice permanently degrades an area of viable habitat, thus reducing the overall biodiversity of that area.
Somewhere between -3 and -5 → BPJ
Practice permanently removes areas of viable habitat, thus reducing the overall biodiversity of an area and potentially surrounding areas.
Estimation of BMP Impact on Chesapeake Bay Program Management Strategies
Black Duck Practice directly creates, enhances, or restores wetland habitats or increases or enhances connectivity of breeding, foraging, migrating, and wintering habitats (upland areas; lowland salt marshes; nontidal marshes; fresh/brackish emergent, forested, or scrub/shrub wetlands; mudflats; SAV; large bodies of open water) for black ducks.
Somewhere between 3 and 5 → BPJ
Practice protects against (e.g., conservation easements, buffers) or reverses shoreline disturbance (e.g., dredging, marina/housing development) adjacent to wetlands, or increases cover or food sources in areas adjacent to wetlands.
Somewhere between 1 and 3 → BPJ
Practice restores, enhances, or preserves native species in or near wetlands or other black duck habitat types, or reduces impacts of climate change (e.g., large storm events, flooding, sea level rise, salinity changes).
Practice has no impact on wetlands
Practice reduces native species in or near wetlands or other black duck habitat types, or increases impacts of climate change (e.g., large storm events, flooding, sea level rise, salinity changes).
Somewhere between -1 and -3 → BPJ
Practice increases shoreline disturbance (e.g., dredging, marina/housing development) adjacent to wetlands, or decreases cover or food sources in areas adjacent to wetlands.
Somewhere between -3 and -5 → BPJ
Practice directly removes wetlands or increases black duck habitat fragmentation.
Blue Crab Abundance
Practice directly improves SAV or other nearshore habitat or water quality conditions in localized area to the benefit of blue crab abundance
Somewhere between 3 and 5 → BPJ
Practice decreases nutrient loads from tributaries
Somewhere between 1 and 3 → BPJ
Practice decreases thermal load from tributaries and/or contributes to optimal water quality contributions from tributaries
Practice has no impact on blue crab abundance
Practice increases thermal load from tributaries and/or contributes to undesirable water quality contributions from tributaries
Somewhere between -1 and -3 → BPJ
Practice increases nutrient loads from tributaries
Somewhere between -3 and -5 → BPJ
Practice directly worsens SAV or other nearshore habitat or water quality conditions in localized area to the detriment of blue crab abundance
Brook Trout Practice creates riparian shade where there was none previously, removes a high temperature direct discharge source or removes invasive/nonnative species that directly impacts native brook trout.
Somewhere between 3 and 5 → BPJ
Practice improves riparian shade conditions, decreases a high temperature direct discharge source or improves access to spawning or seasonally important habitat.
Somewhere between 1 and 3 → BPJ
Practice reduces impervious surface or increases other nonriparian practices to reduce runoff temperature/quantity or improve runoff quality.
Practice has no impact on brook trout.
Practice increases impervious surface or otherwise increases runoff temperature/quantity or degrades runoff quality.
Somewhere between -1 and -3 → BPJ
Practice decreases riparian shade conditions, increases a high temperature direct discharge source or creates a barrier to spawning or seasonally important habitat.
Somewhere between -3 and -5 → BPJ
Practice removes riparian shade, introduces a high temperature direct discharge source or introduces invasive/nonnative species that directly impact native brook trout.
Citizen Stewardship
Practice and required O&M is fully implementable by citizens [Citizens do not include government agencies, nonprofit organizations, or professionals (business or individual)] without assistance (technical or financial).
Somewhere between 3 and 5 → BPJ
Practice is fully implementable by citizens [Citizens do not include government agencies, nonprofit organizations, or professionals (business or individual)], but O&M requires assistance (technical or financial).
Somewhere between 1 and 3 → BPJ
Practice can be implemented by citizens [Citizens do not include government agencies, nonprofit organizations, or professionals (business or individual)] with assistance (technical or financial) from local governments or organizations.
Practice has no impact on citizen stewardship or not applicable to citizen stewardship.
Estimation of BMP Impact on Chesapeake Bay Program Management Strategies
Practice directly increases the protection of living resources and habitats from the impacts of coastal erosion, coastal flooding, more intense and more frequent storms and sea level rise.
Somewhere between 3 and 5 → BPJ
Practice directly increases the protection of public infrastructure and communities from the impacts of coastal erosion, coastal flooding, more intense and more frequent storms and sea level rise.
Somewhere between 1 and 3 → BPJ
Practice indirectly increases the protection of living resources, habitats, public infrastructure, or communities from the impacts of coastal erosion, coastal flooding, more intense and more frequent storms and sea level rise.
Practice has no impact on climate adaptation.
Practice indirectly decreases the protection of living resources, habitats, public infrastructure, or communities from the impacts of coastal erosion, coastal flooding, more intense and more frequent storms and sea level rise.
Somewhere between -1 and -3 → BPJ
Practice directly decreases the protection of public infrastructure and communities from the impacts of coastal erosion, coastal flooding, more intense and more frequent storms and sea level rise.
Somewhere between -3 and -5 → BPJ
Practice directly decreases the protection of living resources and habitats from the impacts of coastal erosion, coastal flooding, more intense and more frequent storms and sea level rise.
Drinking Water Protection/ Security
Practice eliminates toxic contaminants from entering drinking water supplies.
Somewhere between 3 and 5 → BPJ
Practice eliminates traditional pollutants (e.g., nutrients, metals, sediment) from entering drinking water supplies.
Somewhere between 1 and 3 → BPJ
Practice reduces traditional pollutants (e.g., nutrients, metals, sediment) from entering drinking water supplies.
Practice has no impact on Drinking Water Protection/ Security.
Practice introduces small amounts of traditional pollutants into drinking water supplies.
Somewhere between -1 and -3 → BPJ
Practice introduces large amounts of traditional pollutants into drinking water supplies.
Somewhere between -3 and -5 → BPJ
Practice introduces toxic contaminants into drinking water supplies.
Economic Development/Job Creation
Practice gives rise to a new business to aid in practice implementation/maintenance or creates full-time permanent staff positions. OR Practice stimulates local economy.
Somewhere between 3 and 5 → BPJ
Practice increases demand for existing businesses that support practice implementation/maintenance OR creates a new part-time permanent staff positions.
Somewhere between 1 and 3 → BPJ
Practice creates temporary jobs for practice installation/implementation or O&M.
Practice has no impact on Economic Development/ Job Creation.
Practice removes the need for temporary jobs for practice installation/ implementation or O&M.
Somewhere between -1 and -3 → BPJ
Practice decreases demand for existing businesses that support practice implementation/maintenance OR removes a new part-time permanent staff positions.
Somewhere between -3 and -5 → BPJ
Practice causes closing of a new business or removes a full-time permanent staff positions. OR Practice inhibits local economy.
Energy Efficiency
Practice creates natural shade from newly planted trees (e.g., tree planting) in a developed area creating shade to reduce energy needed for cooling. OR creates a positive net production of energy over its design lifetime (implementation and post-implementation); energy is captured and used.
Somewhere between 3 and 5 → BPJ
Practice actively enhances natural shade from existing trees in a developed area increasing shade to reduce energy needed for cooling. OR increases productivity (e.g., crop yield) with no net increase in energy consumption versus baseline (i.e., previous surface or no practice) over its design lifetime (implementation and post-implementation). OR Practice eliminates existing need for energy spent on O&M.
Somewhere between 1 and 3 → BPJ
Practice passively protects or preserves natural shade from existing trees in a developed area to prevent increase in energy needed for cooling. OR Practice reduces existing need for energy spent on O&M.
Practice has no impact on energy efficiency.
Practice has potential to harm existing trees in a developed area which increases energy needed for cooling. OR Practice increasing existing need for energy spent on O&M.
Somewhere between -1 and -3 → BPJ
Practice harms trees providing natural shade. OR decreases productivity (e.g., crop yield) with no net increase in energy consumption versus baseline (i.e., previous surface or no practice) over its design lifetime. OR Practice creates need for energy spent on O&M.
Somewhere between -3 and -5 → BPJ
Practice reduces natural shade by removing trees. OR either increases energy consumption or reduces energy efficiency versus baseline over its design lifetime (e.g., pumped dispersals for septic systems).
Estimation of BMP Impact on Chesapeake Bay Program Management Strategies
Fish Habitat Practice creates riparian shade, wetlands or SAV where there was none previously; removes a high temperature direct discharge source; or removes hardened shoreline.
Somewhere between 3 and 5 → BPJ
Practice improves riparian shade conditions, wetlands or SAV; decreases a high temperature direct discharge source or otherwise directly improves stream water quality (e.g., DO, nutrients, turbidity); or directly prevents sea level rise.
Somewhere between 1 and 3 → BPJ
Practice reduces impervious surface or increases other nonriparian practices to reduce runoff temperature/quantity or improve runoff quality.
Practice has no impact on fish habitat.
Practice increases impervious surface or otherwise increases runoff temperature/quantity or degrades runoff quality.
Somewhere between -1 and -3 → BPJ
Practice decreases riparian shade, wetlands or SAV; increases a high temperature direct discharge source or otherwise directly worsens stream water quality (e.g., DO, nutrients, turbidity); or directly contributes to sea level rise.
Somewhere between -3 and -5 → BPJ
Practice removes riparian shade, wetlands or SAV; introduces a high temperature direct discharge source; or creates a hardened shoreline.
Fish Passage Practice directly removes barriers, retrofits culverts, or installs passage structures
Somewhere between 3 and 5 → BPJ
Practice improves fish habitat for target fish species (e.g., Alewife, Brook Trout)
Somewhere between 1 and 3 → BPJ
Practice reduces the need for privately owned dams (e.g., reduces flooding probability, increases water supply or use efficiency)
Practice has no impact on fish passage
Practice increases the need for privately owned dams (e.g., increases flooding probability, decreases water supply or use efficiency)
Somewhere between -1 and -3 → BPJ
Practice worsens fish habitat for target fish species (e.g., Alewife, Brook Trout)
Somewhere between -3 and -5 → BPJ
Practice directly creates barriers or hinders fish passage
Flood Control/ Mitigation
Practice prevents runoff to streams. OR improves stormwater drainage or channel condition to prevent flooding.
Somewhere between 3 and 5 → BPJ
Practice increases the floodplain, delays peak flow, and/or reduces flashiness. OR replaces flood prone impervious areas with pervious cover.
Somewhere between 1 and 3 → BPJ
Practice slightly reduces runoff to streams.
Practice has no impact on Flood Control/ Mitigation
Practice slightly increases runoff to streams.
Somewhere between -1 and -3 → BPJ
Practice reduces the floodplain, expedites peak flow, and/or increases flashiness. OR replaces flood prone pervious areas with impervious cover.
Somewhere between -3 and -5 → BPJ
Practice diverts all runoff to streams. OR degrades stormwater drainage or channel condition to prevent flooding.
Forage Fish Practice directly improves fish habitat quality or amount (including through removal of shoreline modifications, protection/establishment of SAV, or directly improving the production of benthic organisms or the distribution and productivity of plankton) or improves access to upriver spawning areas.
Somewhere between 3 and 5 → BPJ
Practice directly improves water quality (e.g., removes or reduces direct discharges, in-stream sources, etc.) or protects shorelines.
Somewhere between 1 and 3 → BPJ
Practice improves water quality through watershed BMPs, reducing impervious surfaces, etc.
Practice has no impact on forage fish.
Practice worsens water quality through watershed land use and development.
Somewhere between -1 and -3 → BPJ
Practice directly worsens water quality (e.g., adds or increases direct discharges, in-stream sources, etc.) or develops shorelines.
Somewhere between -3 and -5 → BPJ
Practice directly worsens fish habitat quality or amount (including shoreline hardening or other modifications, removal of SAV, or directly worsening the production of benthic organisms or the distribution and productivity of plankton), or worsens access to upriver spawning areas.
Estimation of BMP Impact on Chesapeake Bay Program Management Strategies
Practice maximizes infiltration at a hardened site (e.g., replaces impervious surface area with pervious surface or captures and infiltrates runoff from urban or hardened sites).
Somewhere between 3 and 5 → BPJ
Practice increases infiltration at a hardened site (e.g., replaces impervious surfaces with semi-pervious surfaces).
Somewhere between 1 and 3 → BPJ
Practice reduces runoff and increases infiltration at an unhardened site (e.g., change in tillage that increases infiltration).
Practice has no impact on groundwater recharge/ infiltration than without the practice.
Practice increases runoff and decreases infiltration at an unhardened site (e.g., change in tillage that decreases infiltration).
Somewhere between -1 and -3 → BPJ
Practice directly decreases infiltration at a = hardened site (e.g., replaces pervious surfaces with semi-pervious surfaces).
Somewhere between -3 and -5 → BPJ
Practice prevents infiltration at a hardened site (e.g., adds impervious surface area without runoff capture and infiltration) or uses/removes groundwater.
Healthy Watersheds
Practice directly restores or conserves nonurban lands
Somewhere between 3 and 5 → BPJ
Practice protects or improves stream flow regimes or channel stability
Somewhere between 1 and 3 → BPJ
Practice improves water quality or reduces impervious surfaces
Practice has no impact on healthy watersheds
Practice worsens water quality or increases impervious surfaces
Somewhere between -1 and -3 → BPJ
Practice worsens stream flow regimes or channel stability
Somewhere between -3 and -5 → BPJ
Practice directly increases urbanization
Land Use Methods and Metrics Development
Practice creates wetlands or forest areas.
Somewhere between 3 and 5 → BPJ
Practice conserves existing forest, wetlands., or agriculture land or converts crop land to pasture, forage production, perennial grass, etc.
Somewhere between 1 and 3 → BPJ
Practice creates limited area (<0.5 acre) of vegetation or trees.
Practice has no impact on land use methods and metrics development
Practices removes existing vegetation (<0.5 acres) and replaces with impervious surface or turf.
Somewhere between -1 and -3 → BPJ
Practice removes agriculture fields.
Somewhere between -3 and -5 → BPJ
Practice removes wetlands of forested areas.
Oyster Restoration
Practice directly restores and/or protects native oyster habitat or populations
Somewhere between 3 and 5 → BPJ
Practice improves water quality (e.g., decreases nutrient loads and/or reduces sediment) in targeted oyster restoration tributaries
Somewhere between 1 and 3 → BPJ
Practice reduces runoff that would decrease salinity in targeted oyster restoration tributaries
Practice has no impact on oyster restoration
Practice increases runoff that would decrease salinity in targeted oyster restoration tributaries
Somewhere between -1 and -3 → BPJ
Practice worsens water quality (e.g., increases nutrient loads and/or increases sediment) in targeted oyster restoration tributaries
Somewhere between -3 and -5 → BPJ
Practice directly reduces and/or harms native oyster habitat or populations
Property Values
Practice has potential to significantly improve the property value of the surrounding properties/neighborhood by reducing a threat (e.g. flood reduction) and providing an amenity to the community (e.g. recreational opportunities).
Somewhere between 3 and 5 → BPJ
Practice has potential to slightly improve the property value of the surrounding properties/neighborhood through aesthetic improvement and/or the reduction in a threat. OR practice increases property value through improved soil health/increased crop yields.
Somewhere between 1 and 3 → BPJ
Practice has potential to improve the property value of the land it is situated on.
Practice has no impact on Property Values.
Practice has potential to reduce the property value of the land it is situated on.
Somewhere between -1 and -3 → BPJ
Practice has potential to slightly reduce the property value of the surrounding properties/neighborhood by degrading the aesthetics and/or increasing or causing a threat. OR practice decreases property value through degraded soil health/decreased crop yields.
Somewhere between -3 and -5 → BPJ
Practice has potential to significantly reduce the property value of the surrounding properties/neighborhood by increasing a threat and removing an amenity.
Protected Lands
Practice directly protects/creates highest value wetlands and forestland for maintaining water quality.
Somewhere between 3 and 5 → BPJ
Practice reduces new development pressures, including transportation and energy infrastructure, new housing, and commercial development.
Somewhere between 1 and 3 → BPJ
Practice creates area with native vegetation or removes nonnative vegetation.
Practice has no impact on protected lands
Practice removes area of native vegetation or introduces nonnative vegetation.
Somewhere between -1 and -3 → BPJ
Practice increases new development pressures, including transportation and energy infrastructure, new housing, and commercial development.
Somewhere between -3 and -5 → BPJ
Practice directly degrades or removes highest value wetlands and forestland that maintained water quality.
Estimation of BMP Impact on Chesapeake Bay Program Management Strategies
Recreation Practice creates addition opportunities for recreational use of the water. Practice removes water pollution to waterbodies that have direct-contact recreation (e.g., wading, swimming). Practices eliminate reduce harmful algal blooms.
Somewhere between 3 and 5 → BPJ
Practice creates opportunities for recreational use of the adjacent land or improves the conditions for existing water recreation. Practice reduces water pollution to waterbodies that have direct-contact recreation (e.g., wading, swimming). Practices helps reduce harmful algal blooms.
Somewhere between 1 and 3 → BPJ
Practice enhances a neighborhood by providing opportunities for passive recreation (e.g., wildlife viewing, walking, biking).
Practice has no impact on Recreation.
Practice creates an environment that discourages passive recreational use to surrounding area.
Somewhere between -1 and -3 → BPJ
Practice creates an environment that discourages direct contact recreation in the waterbody.
Somewhere between -3 and -5 → BPJ
Practice removes or prevents all opportunities for recreational use of the water. Practice increases likelihood of algal blooms.
Riparian Forest Buffer
Directly improves the practice, protection, and/or maintenance of riparian forest buffers (35’ or wider).
Somewhere between 3 and 5 → BPJ
Facilitates the practice, protection, and/or maintenance of riparian forest buffers.
Somewhere between 1 and 3 → BPJ
Potential to directly improve the restoration, maintenance, or conservation of riparian forest buffers, or their functionality.
Practice has no impact on riparian forest buffers.
Potential to directly impact the restoration, maintenance, or conservation of riparian forest buffers, or their functionality.
Somewhere between -1 and -3 → BPJ
Indirectly impacts the restoration, maintenance, or conservation of riparian forest buffers, or their functionality.
Somewhere between -3 and -5 → BPJ
Practice directly impacts the restoration, maintenance, or conservation of riparian forest buffers, or their functionality.
Stream Health Practice directly improves within the stream channel and floodplain factors that impact stream health (e.g., in-stream sediment and nutrients, channel alterations/pipes, riparian areas) OR restores natural flow conditions (e.g., improves baseflow)
Somewhere between 3 and 5 → BPJ
Practice directly improves watershed-based factors that reduce the volume and rate of stormwater entering streams (e.g., impervious cover, hydrology, flow alteration).
Somewhere between 1 and 3 → BPJ
Practice improves watershed-based factors that reduce pollutant loads to streams (e.g., nutrients, salt, thermal, toxic).
Practice has no impact on stream health.
Practice worsens watershed-based factors that reduce pollutant loads to streams (e.g., nutrients, salt, thermal, toxic).
Somewhere between -1 and -3 → BPJ
Practice directly worsens watershed-based factors that reduce the volume and rate of stormwater entering streams (e.g., impervious cover, hydrology, flow alteration).
Somewhere between -3 and -5 → BPJ
Practice directly worsens within the stream channel and floodplain factors that impact stream health (e.g., in-stream sediment and nutrients, channel alterations/pipes, riparian areas) OR removes natural flow conditions (e.g., reduces baseflow)
Submerged Aquatic Vegetation
Somewhere between 3 and 5 → BPJ
Somewhere between 1 and 3 → BPJ
Practice has no impact on SAV
Somewhere between -1 and -3 → BPJ
Somewhere between -3 and -5 → BPJ
Toxic Contaminants Policy and Prevention
Practice has potential to substantially decrease the delivery of toxic contaminants to waterbodies.
Somewhere between 3 and 5 → BPJ
Practice has potential to moderately decrease the delivery of toxic contaminants to waterbodies.
Somewhere between 1 and 3 → BPJ
Practice has potential to slightly decrease the delivery of toxic contaminants to waterbodies.
Practice has no impact on toxic contaminants policy and prevention.
Practice has potential to slightly increase the delivery of toxic contaminants to waterbodies.
Somewhere between -1 and -3 → BPJ
Practice has the potential to moderately increase the delivery of toxic contaminants to waterbodies.
Somewhere between -3 and -5 → BPJ
Practice has the potential to significantly increase the delivery of toxic contaminants to waterbodies
Estimation of BMP Impact on Chesapeake Bay Program Management Strategies
Tree Canopy Directly restores or conserves tree canopy, or leads directly to establishment of policies, regulations, ordinances, or program priorities that will result in increased tree canopy.
Somewhere between 3 and 5 → BPJ
Likely to directly or indirectly restore or conserve tree canopy, or leads to establishment of policies, regulations, ordinances, or program priorities that will likely result in increased tree canopy.
Somewhere between 1 and 3 → BPJ
May indirectly result in more tree canopy.
Practice has no impact on tree canopy
May indirectly result in less tree canopy.
Somewhere between -1 and -3 → BPJ
Likely to directly or indirectly impact tree canopy (restoration or conservation), or leads to establishment of policies, regulations, ordinances, or program priorities that will likely result in decreased tree canopy.
Somewhere between -3 and -5 → BPJ
Directly removes trees or hampers restoration or conservation of tree canopy.
Wetlands Practice directly creates or re-establishes tidal or nontidal wetlands
Somewhere between 3 and 5 → BPJ
Practice directly enhances both the water quality and habitat functions of wetlands
Somewhere between 1 and 3 → BPJ
Practice directly prevents degradation through enhancing either the water quality or habitat functions of wetlands OR practice reduces sediment delivery to the wetland
Practice has no impact on wetlands
Practice directly degrades either the water quality or habitat functions of wetlands OR practice increases sedimentation of the wetland
Somewhere between -1 and -3 → BPJ
Practice directly degrades both the water quality and habitat functions of wetlands
Somewhere between -3 and -5 → BPJ
Practice directly removes tidal or nontidal wetlands
Estimation of BMP Impact on Chesapeake Bay Program Management Strategies
42
Appendix D: Literature Listing
This appendix is a separate Excel file (Appendix D-Literature List.xlsx).
Estimation of BMP Impact on Chesapeake Bay Program Management Strategies
43
Appendix E: Final Impact Scores
This appendix is a separate Excel file (Appendix E-Final Impact Scores.xlsx).
Estimation of BMP Impact on Chesapeake Bay Program Management Strategies
44
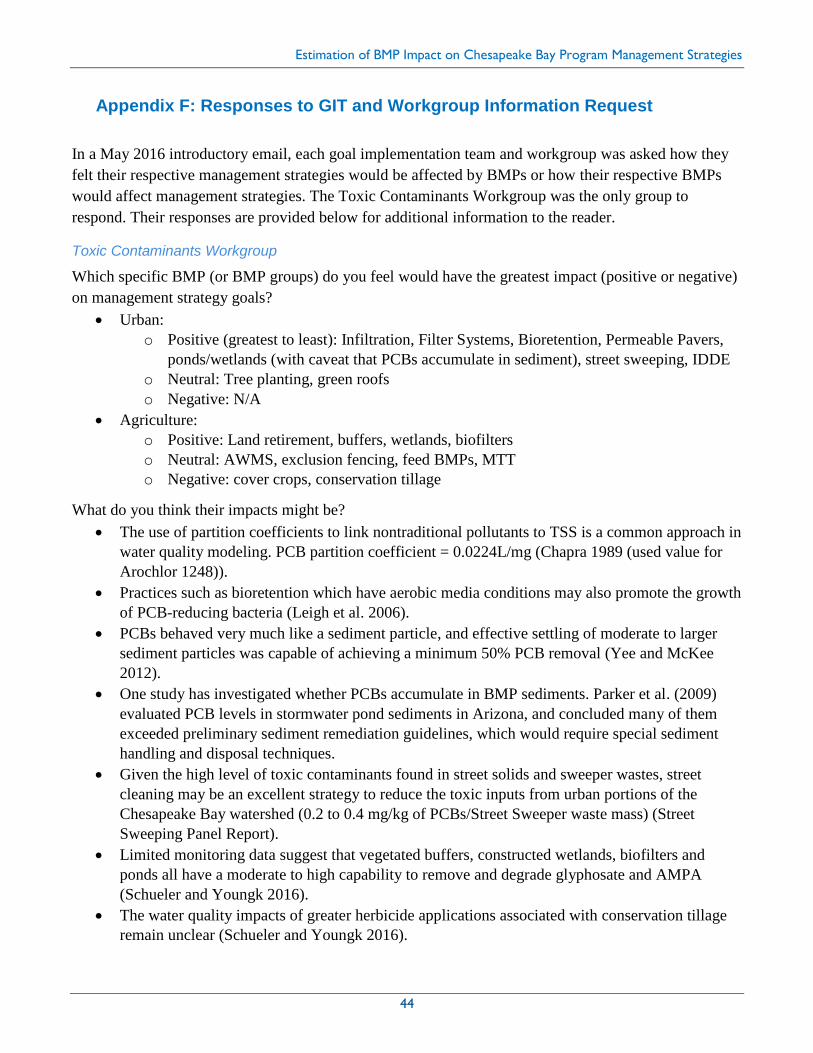
Appendix F: Responses to GIT and Workgroup Information Request
In a May 2016 introductory email, each goal implementation team and workgroup was asked how they
felt their respective management strategies would be affected by BMPs or how their respective BMPs
would affect management strategies. The Toxic Contaminants Workgroup was the only group to
respond. Their responses are provided below for additional information to the reader.
Toxic Contaminants Workgroup
Which specific BMP (or BMP groups) do you feel would have the greatest impact (positive or negative)
on management strategy goals?
Urban:
o Positive (greatest to least): Infiltration, Filter Systems, Bioretention, Permeable Pavers,
ponds/wetlands (with caveat that PCBs accumulate in sediment), street sweeping, IDDE
o Neutral: Tree planting, green roofs
o Negative: N/A
Agriculture:
o Positive: Land retirement, buffers, wetlands, biofilters
o Neutral: AWMS, exclusion fencing, feed BMPs, MTT
o Negative: cover crops, conservation tillage
What do you think their impacts might be?
The use of partition coefficients to link nontraditional pollutants to TSS is a common approach in
water quality modeling. PCB partition coefficient = 0.0224L/mg (Chapra 1989 (used value for
Arochlor 1248)).
Practices such as bioretention which have aerobic media conditions may also promote the growth
of PCB-reducing bacteria (Leigh et al. 2006).
PCBs behaved very much like a sediment particle, and effective settling of moderate to larger
sediment particles was capable of achieving a minimum 50% PCB removal (Yee and McKee
2012).
One study has investigated whether PCBs accumulate in BMP sediments. Parker et al. (2009)
evaluated PCB levels in stormwater pond sediments in Arizona, and concluded many of them
exceeded preliminary sediment remediation guidelines, which would require special sediment
handling and disposal techniques.
Given the high level of toxic contaminants found in street solids and sweeper wastes, street
cleaning may be an excellent strategy to reduce the toxic inputs from urban portions of the
Chesapeake Bay watershed (0.2 to 0.4 mg/kg of PCBs/Street Sweeper waste mass) (Street
Sweeping Panel Report).
Limited monitoring data suggest that vegetated buffers, constructed wetlands, biofilters and
ponds all have a moderate to high capability to remove and degrade glyphosate and AMPA
(Schueler and Youngk 2016).
The water quality impacts of greater herbicide applications associated with conservation tillage
remain unclear (Schueler and Youngk 2016).
Estimation of BMP Impact on Chesapeake Bay Program Management Strategies
45
What are the top impacts that concern you?
Cover crop usage and conservation tillage are both of greatest potential concern because of
possible association with higher herbicide application.
Do you have any information sources that you can provide us or direct us to for this project?
Potential Benefits of Nutrient and Sediment Practices to Reduce Toxic Contaminants in the
Chesapeake Bay Watershed: Urban Toxic Contaminants
Potential Benefits of Nutrient and Sediment Practices to Reduce Toxic Contaminants in the
Chesapeake Bay Watershed: Agriculture and Wastewater Sectors