Estimation of coastal populations exposed to 26 December 2004 Tsunami CIESIN Deborah Balk, Yuri Gorokhovich, Marc Levy 1 31 January 2005 (this is a revision to a 7 January 2005 estimate) Summary This note constitutes a preliminary estimate of the numbers of people exposed to the tsunami of 26 December 2004. The scope of the estimate was the Bay of Bengal/ Indian Ocean littoral regions of Indonesia, Malaysia, Thailand, Myanmar, Bangladesh, India, Sri Lanka and Maldives. These regions are portrayed visua lly in Figure 1. The estimate relies on data sets already available and on simple methods that can be executed quickly. This should be treated as a first approximation. 2 We estimate that at the time of the tsunami, about 10.4 million people lived within one kilometer of the affected coastal area, and that 18.9 million lived within two kilometers (see Table 1). For areas known to have major impacts, where relief effort is now concentrated, the population estimates are 1.9 million and 3.7 million, respectively. Data For population data we used a recently completed 1km estimate of spatial population distribution from the Global Rural-Urban Mapping Project (GRUMP) at CIESIN. 3 This data set will be made available to the public during January, and is available at present upon request. It has completed peer review under the auspices of the Millennium Ecosystem Assessment. Population density from this data set in the affected regions is shown in Figure 2. (Because of known problems with data for Aceh Province from the 2000 Indonesian census, estimates in Table 1 for Aceh were calculated using data from the 2000 village potential census (PODES) by Piet Buys at the World Bank. These estimates are now incorporated into the GRUMP dataset.) For delineating coastal zones we utilized the collection of national census geographies used to produce GRUMP. Although we have requested permission to disseminate these spatial data sets publicly, our current license arrangements do not permit that. 1 Thanks to Bridget Anderson for assisting in the preparation of maps and to Art Lerner-Lam for geophysical guidance. Please contact: [email protected]2 The initial estimates provided on 29 December were much more preliminary as they relied on the somewhat crude ESRI administrative boundary dataset which omits many persons along the coastline. In this estimate, that data set was substituted with the native, census-based administrative boundary data which are a near match for the population grid. 3 Center for International Earth Science Information Network (CIESIN), Columbia University; International Food Policy Research Institute (IPFRI), the World Bank; and Centro Internacional de Agricultura Tropical (CIAT), 2004. Global Rural -Urban Mapping Project (GRUMP): Gridded Population of the World, version 3, with Urban Reallocation (GPW-UR). Palisades, NY: CIESIN, Columbia University.
Transcript
Estimation of coastal populations exposed to 26 December 2004 Tsunami
CIESIN Deborah Balk, Yuri Gorokhovich, Marc Levy1
31 January 2005 (this is a revision to a 7 January 2005 estimate)
Summary
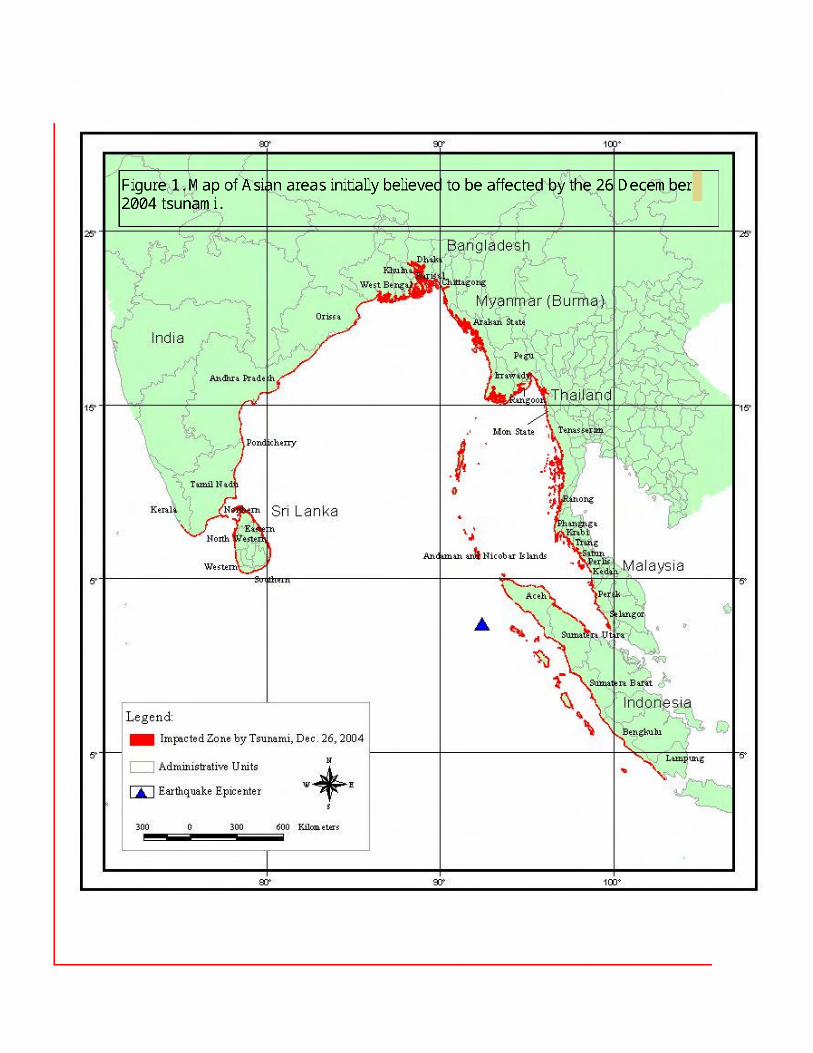
This note constitutes a preliminary estimate of the numbers of people exposed to the tsunami of 26 December 2004. The scope of the estimate was the Bay of Bengal/ Indian Ocean littoral regions of Indonesia, Malaysia, Thailand, Myanmar, Bangladesh, India, Sri Lanka and Maldives. These regions are portrayed visua lly in Figure 1. The estimate relies on data sets already available and on simple methods that can be executed quickly. This should be treated as a first approximation. 2
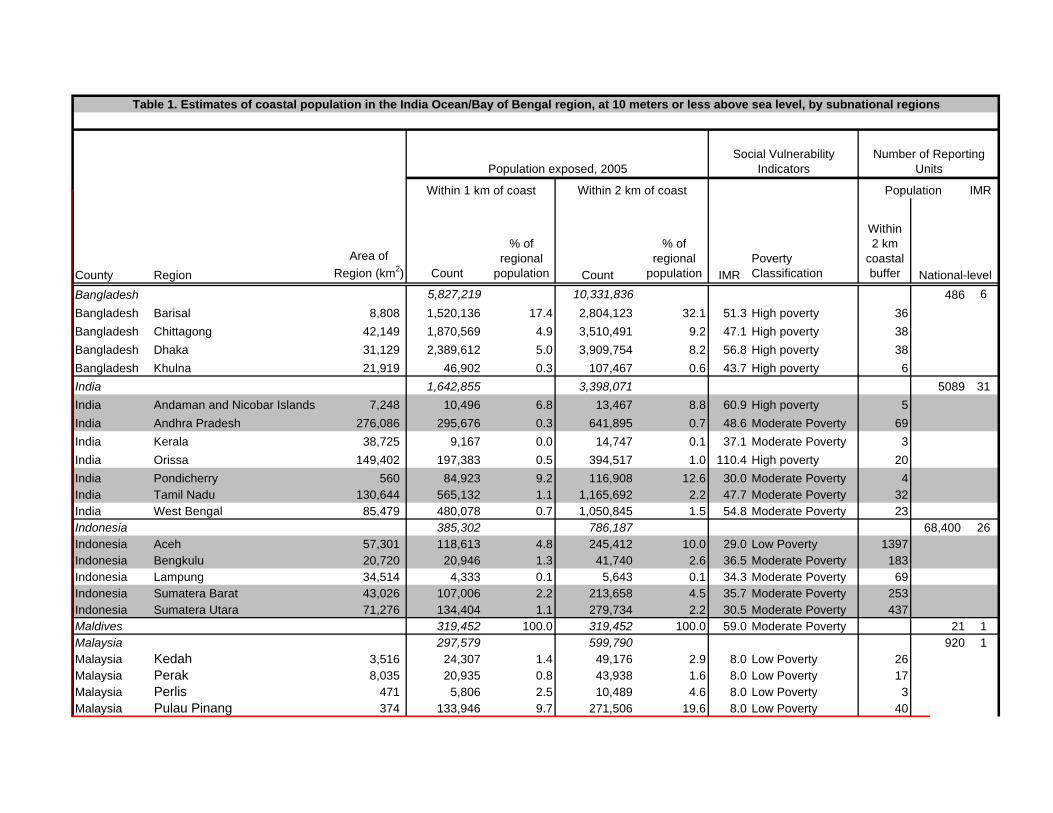
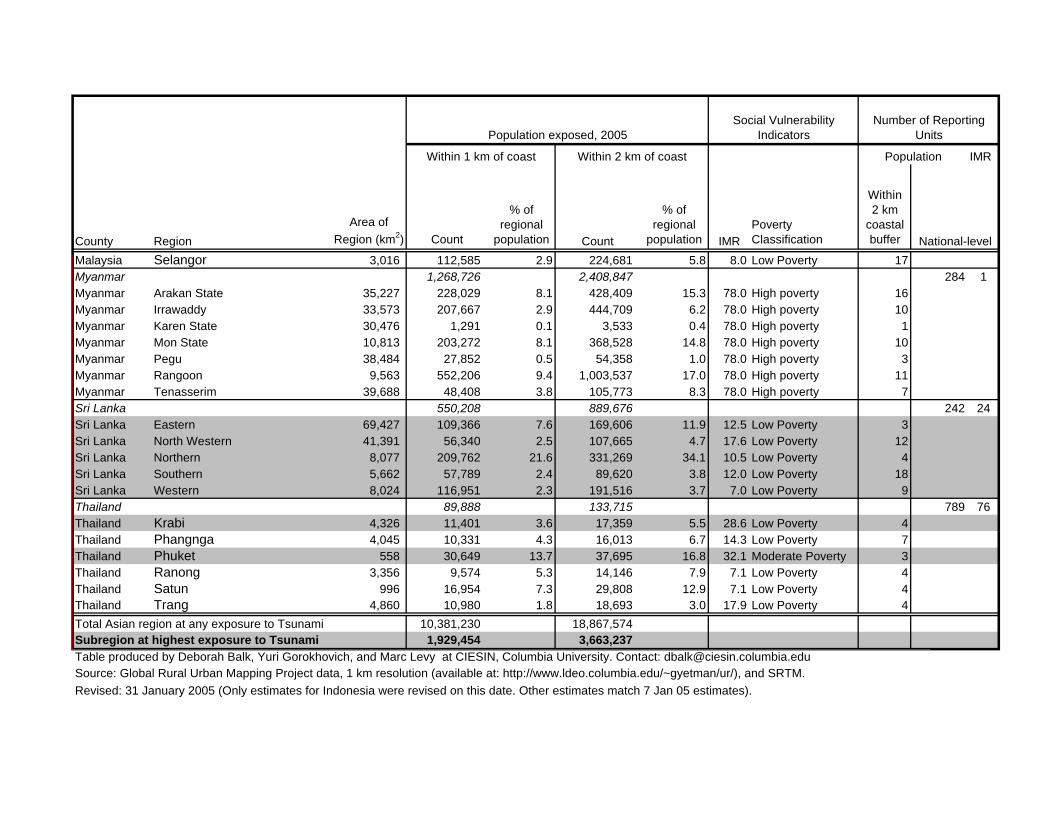
We estimate that at the time of the tsunami, about 10.4 million people lived within one kilometer of the affected coastal area, and that 18.9 million lived within two kilometers (see Table 1). For areas known to have major impacts, where relief effort is now concentrated, the population estimates are 1.9 million and 3.7 million, respectively.
Data
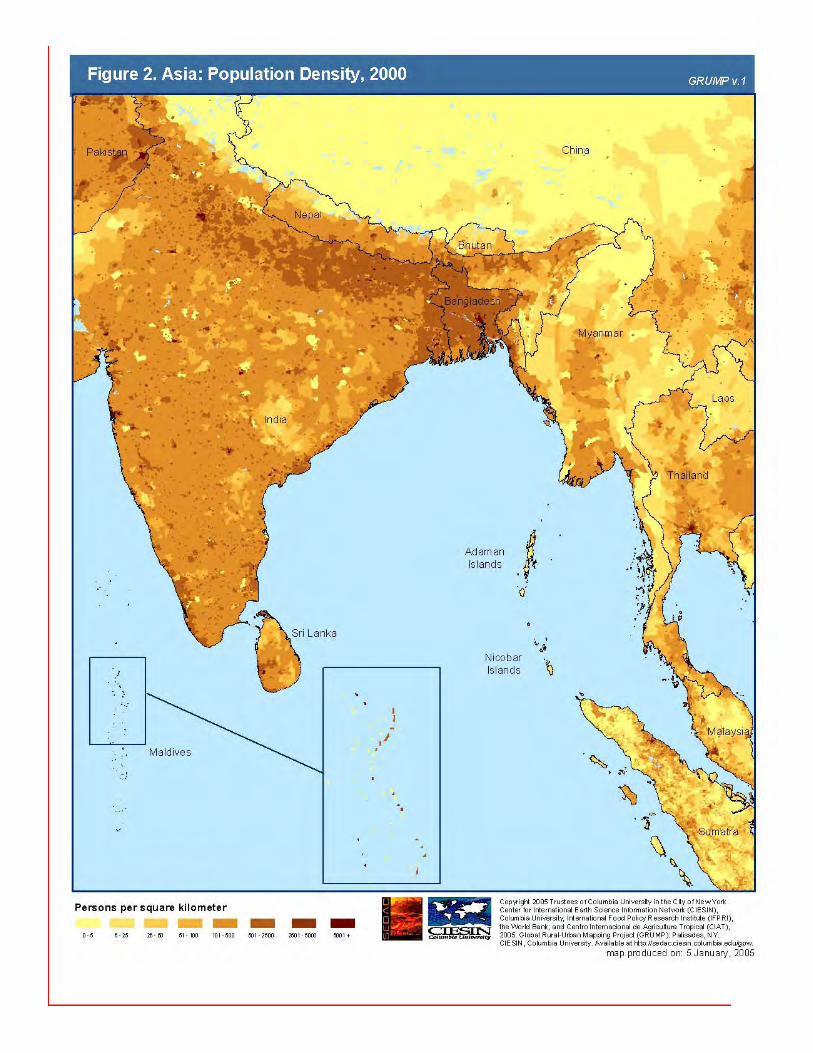
For population data we used a recently completed 1km estimate of spatial population distribution from the Global Rural-Urban Mapping Project (GRUMP) at CIESIN.3 This data set will be made available to the public during January, and is available at present upon request. It has completed peer review under the auspices of the Millennium Ecosystem Assessment. Population density from this data set in the affected regions is shown in Figure 2. (Because of known problems with data for Aceh Province from the 2000 Indonesian census, estimates in Table 1 for Aceh were calculated using data from the 2000 village potential census (PODES) by Piet Buys at the World Bank. These estimates are now incorporated into the GRUMP dataset.)
For delineating coastal zones we utilized the collection of national census geographies used to produce GRUMP. Although we have requested permission to disseminate these spatial data sets publicly, our current license arrangements do not permit that.
1 Thanks to Bridget Anderson for assisting in the preparation of maps and to Art Lerner-Lam for geophysical guidance. Please contact: [email protected] The initial estimates provided on 29 December were much more preliminary as they relied on the somewhat crude ESRI administrative boundary dataset which omits many persons along the coastline. In this estimate, that data set was substituted with the native, census-based administrative boundary data which are a near match for the population grid. 3 Center for International Earth Science Information Network (CIESIN), Columbia University; International Food Policy Research Institute (IPFRI), the World Bank; and Centro Internacional de Agricultura Tropical (CIAT), 2004. Global Rural -Urban Mapping Project (GRUMP): Gridded Population of the World, version 3, with Urban Reallocation (GPW-UR). Palisades, NY: CIESIN, Columbia University.
For elevation we used the Shuttle Radar Topography Mission (SRTM) 90-meter data.
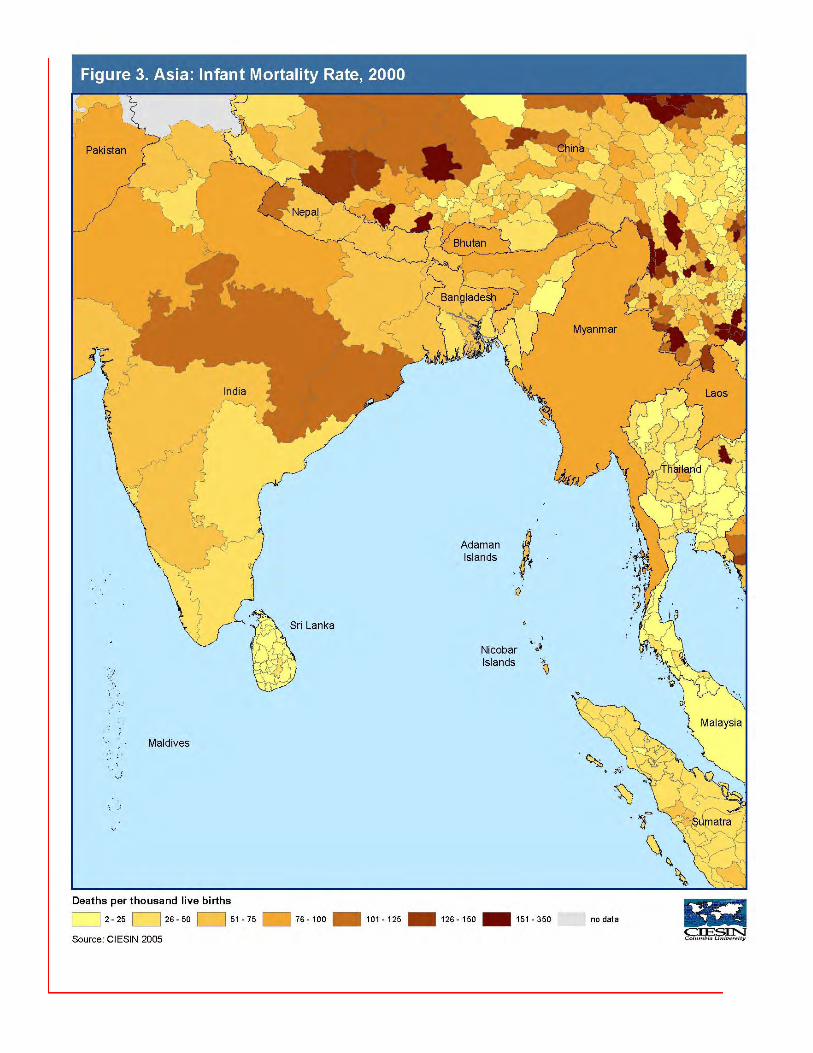
For the purpose of providing a rough gauge of poverty levels in these regions, we used CIESIN’s 2004 global infant mortality database, which has infant mortality rates for 10,271 global reporting units, and is shown in Figure 3. This data set will also be released to the public in January and likewise has already completed peer review through the Millennium Ecosystem Assessment. Table 1 also indicates the number of reporting units in each of the countries in the tsunami-affected region.
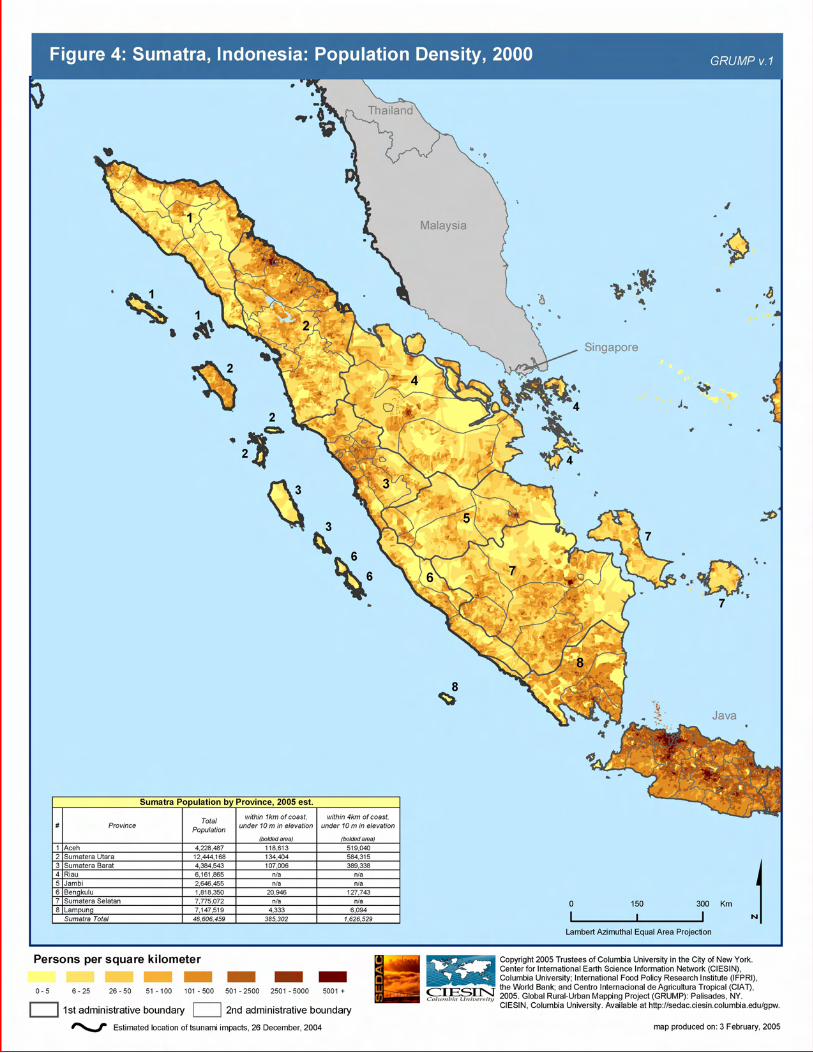
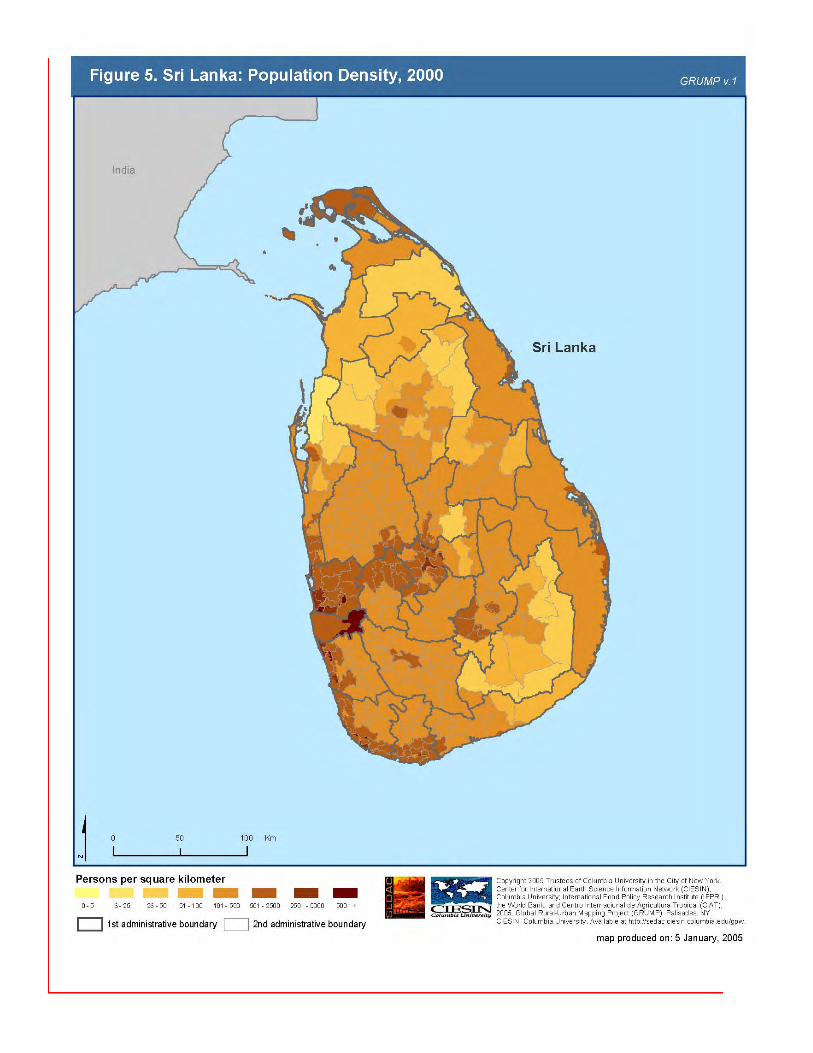
Additional maps show close-ups of the population distributions of Sumatra and Sri Lanka (in Figures 4 and 5). In Sumatra, the population exposed up to 4 kilometers was also estimated.
Method
We created buffers of 1km and 2km, at elevation of 10 meters or lower.4 We used zonal statistics to calculate year 2000 population sums within these buffers, for each of the first administrative regions of each country. The population totals were extrapolated to the year 2005 using UN World Population Prospects estimated 2000-2005 population growth rates. Table 1 shows the resulting estimates.
Discussion
These numbers are rough; estimating population at 1 or 2 km is an error-prone process. Our confidence is higher where the resolution of the input data is best (e.g., in Indonesia). For a country such as Myanmar our confidence is lower, because the estimates rely on fairly old census data with poor spatial resolution. Because the method relies heavily on census data, it does not take into account dynamics such as seasonal migration patterns, short-term migration flows that may have occurred since the last census, or flows of nonresident populations such as tourists.
For many of the affected countries higher resolution estimates could be calculated than those reported here. Instead of roughly province- level estimates we could generate district- level estimates or better for most of the region. For example, in Aceh alone we used population data for 1397 sub-provincial regions lying within the coastal zone.
Lack of quantitative data on the extent of inland intrusion or on wave height at landfall make it impossible for us to make these exposure estimates more precise at present. We applied a 10-meter elevation threshold within our 1-km and 2-km coastal zones, because 10 meters is consistent with news reports of 25-30 feet waves. But we know that the wave’s force was not uniform across this region. Models (Ward 2005) suggest that the first impact did not get as far north as Orissa, West Bengal, Bangladesh and Myanmar. Further, bathymetry suggests that part of Sri Lanka’s NorthWestern province may not
4 The vertical accuracy in the SRTM data is stated as +/- 16 m at the 90% confidence level. Future estimates will delineate coastal zones at alternative elevation thresholds to account for the uncertainties. For Aceh only, the 1-km figure is simply half the 2-km figure.
have been a strongly affected as the rest of the island (because shallowing defracts the tsunami away from that coast, but leaves edge effects). On the other hand, the affected distance from coast is believed to have been greatest in Sumatra, implying that a 4 or 5 kilometer buffer would be more appropriate there; wave heights may have been much lower in the Bay of Bengal reducing the eventual impact in those regions. Further revisions will attempt to account for new data as they become available. As we refine our understanding of the wave’s physical impact across the region, we may include parts of Somalia, Tanzania and other Africa nations.
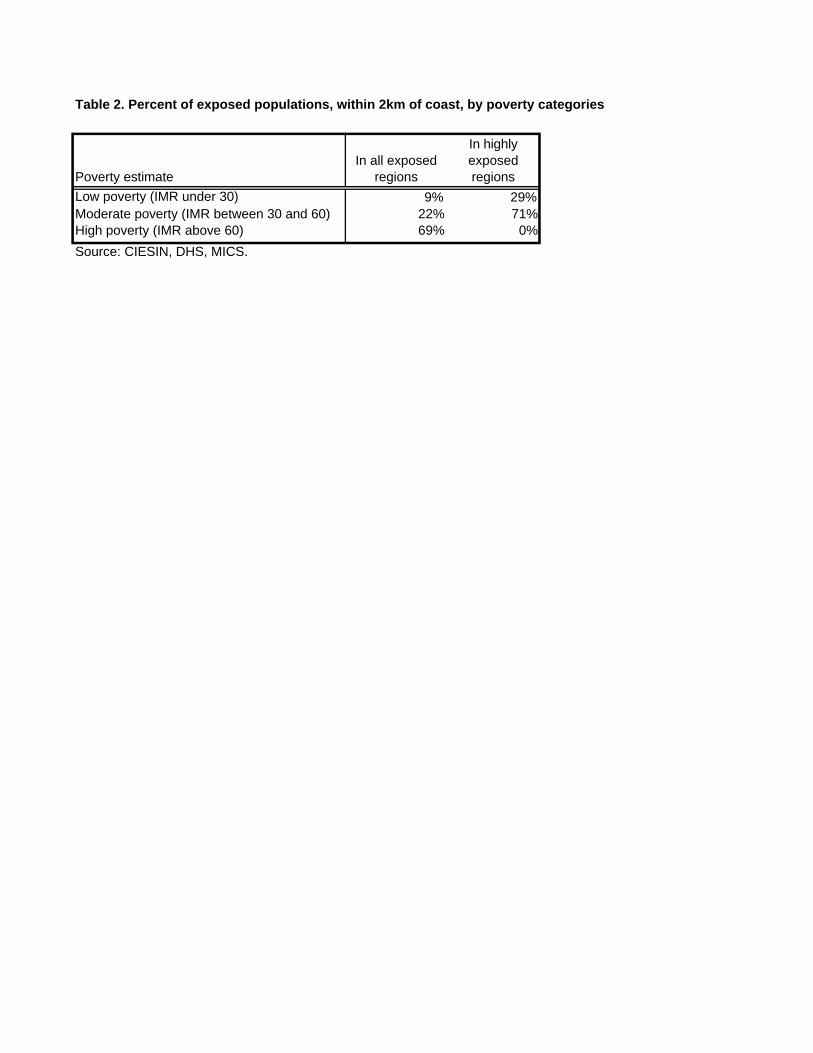
The consideration of the IMR data as a proxy for poverty is potentially instructive. Table 2 shows that although there were many very poor people exposed, the more poor populations were largely outside of the heaviest brunt of the wave.
dbalk
Figure 1. Map of Asian areas initially believed to be affected by the 26 December 2004 tsunami.
Alfonse
Text that does not map to Unicode reliably may be incorrectly interpreted by assistive technologies.
Alfonse
When non-text elements do not have text equivalents, their content is lost to screen readers and environments with limited graphics capabilities.
India Andaman and Nicobar Islands 7,248 10,496 6.8 13,467 8.8 5
India Andhra Pradesh 276,086 295,676 0.3 641,895 0.7 69
India Kerala 38,725 9,167 0.0 14,747 0.1 3
India Orissa 149,402 197,383 0.5 394,517 1.0 20
India Pondicherry 560 84,923 9.2 116,908 12.6 4 India Tamil Nadu 130,644 565,132 1.1 1,165,692 2.2 32 India West Bengal 85,479 480,078 0.7 1,050,845 1.5 23 Indonesia 385,302 786,187 68,400 26 Indonesia Aceh 57,301 118,613 4.8 245,412 10.0 1397 Indonesia Bengkulu 20,720 20,946 1.3 41,740 2.6 183 Indonesia Lampung 34,514 4,333 0.1 5,643 0.1 69 Indonesia Sumatera Barat 43,026 107,006 2.2 213,658 4.5 253 Indonesia Sumatera Utara 71,276 134,404 1.1 279,734 2.2 437 Maldives 319,452 100.0 319,452 100.0 21 1 Malaysia 297,579 599,790 920 1 Malaysia Kedah 3,516 24,307 1.4 49,176 2.9 26 Malaysia Perak 8,035 20,935 0.8 43,938 1.6 17 Malaysia Perlis 471 5,806 2.5 10,489 4.6 3 Malaysia Pulau Pinang 374 133,946 9.7 271,506 19.6 40
Table 1. Estimates of coastal population in the India Ocean/Bay of Bengal region, at 10 meters or less above sea level, by subnational regions
Social Vulnerability IndicatorsPopulation exposed, 2005
Table produced by Deborah Balk, Yuri Gorokhovich, and Marc Levy at CIESIN, Columbia University. Contact: [email protected] Source: Global Rural Urban Mapping Project data, 1 km resolution (available at: http://www.ldeo.columbia.edu/~gyetman/ur/), and SRTM. Revised: 31 January 2005 (Only estimates for Indonesia were revised on this date. Other estimates match 7 Jan 05 estimates).
Alfonse
When non-text elements do not have text equivalents, their content is lost to screen readers and environments with limited graphics capabilities.
Alfonse
When non-text elements do not have text equivalents, their content is lost to screen readers and environments with limited graphics capabilities.
Alfonse
When non-text elements do not have text equivalents, their content is lost to screen readers and environments with limited graphics capabilities.
Alfonse
When non-text elements do not have text equivalents, their content is lost to screen readers and environments with limited graphics capabilities.
Alfonse
When non-text elements do not have text equivalents, their content is lost to screen readers and environments with limited graphics capabilities.
Table 2. Percent of exposed populations, within 2km of coast, by poverty categories
In highly In all exposed exposed
Poverty estimate regions regions Low poverty (IMR under 30) 9% 29% Moderate poverty (IMR between 30 and 60) 22% 71% High poverty (IMR above 60) 69% 0%