Keywords: Fire frequency; Fire cycle; Fire regime; Sampling design
www.elsevier.com/locate/ecolmodel
1. Introduction
Forest dynamics, especially in the boreal regionof western Canada, have been historically shapedby natural disturbance regimes such as fire (e.g.Weber and Flannigan, 1997; Weber and Stocks,1998). As a result, studies of local fire history andfire regimes are important for understandingforest dynamics as a whole. Thus, fire disturbancehas become one of the important components in
forest dynamics models that account for the influ-ence of a fire disturbance regime (e.g. Baker et al.,1991; Keane et al., 1996; Li and Apps, 1996; Li etal., 1997; He and Mladenoff, 1999; Li, 2000a).Fire frequency, cycle, size distribution, season,intensity, and severity are among the descriptors(Weber and Flannigan, 1997) of a fire regime.Fire occurrence and burned area related descrip-tors, such as fire frequency and fire cycle, arecommonly simulated in forest dynamics models.In this section, the concepts and usefulness of firefrequency and fire cycle will be described first, andfollowed by a review of how the concepts areimplemented in existing fire models.
C. Li / Ecological Modelling 154 (2002) 103–120104
1.1. Concepts and usefulness of fire frequency andfire cycle
Fire frequency is perhaps the most frequentlyused terminology for describing a fire regime.However, it has been used to address differentquestions under various situations. Fire frequencyis originally defined in a point-based manner as‘the average number of fires that occur per unittime at a given point’ (Merrill and Alexander,1987), FFp, but it is also applied to a specific area(Agee, 1993) and referred to as ‘fire incidence’ or‘fire occurrence’ (e.g. Heinselman, 1981; Johnsonand Van Wagner, 1985; Food and AgricultureOrganization of the United Nations, 1986). Thereciprocal of fire frequency is defined as fire inter-val: ‘the average number of years between theoccurrence of fires at a given point’ (Merrill andAlexander, 1987). The sizes of fires, nevertheless,are not taken into account in the original firefrequency concept.
Fire cycle, on the other hand, is originallydefined in an area-based sense as the number ofyears required to burn over an area equal to theentire area of interest, although some sites couldbe burned more often than other sites within thearea, FCa, (e.g. Johnson and Van Wagner, 1985;Merrill and Alexander, 1987; Turner and Romme,1994). The fire cycle is also equivalent to ‘firerotation’ (Agee, 1993) and ‘return period’ (Hein-selman, 1973; Food and Agriculture Organizationof the United Nations, 1986), as well as ‘firereturn interval’ (e.g. Apps et al., 2000; Bhatti etal., 2001). The other definition of fire cycle byAgee (1993) is that ‘the average stand age offorest whose age distribution fits a mathematicaldistribution (negative exponential or Weibull)’;however, this definition will not be discussed inthis paper. The reciprocal of fire cycle is definedas percentage of annual area burned, PAAB, andthe total area burned is the main focus in the firecycle concept:
FCa=1/PAAB (1)
In one special case, however, total area reducedto only one site, the fire cycle is equal to the fireinterval, and the reciprocal of it is equal to firefrequency (note that the calculation method also
applies to area-based fire frequency, FFa,estimation):
FC=1/FF (2)
Fire frequency can be used to indicate up tothree situations. One, how often a given site couldbe burned, or how often a fire would recur on agiven site. Second, how many fire incidents couldoccur per unit time on a given region underinvestigation, or the density of fire incidents forthe region. Third, how often the cumulatedburned area could reach the total area of theregion under investigation, or the relative degreeof damage that fire could cause for the region.
In the first situation, fire frequency is concernedwith a particular site and hence it is considered asa point-based representation. This fire frequencycan be described by one of the following descrip-tors: (a) the average number of fires per year FNp,usually less than 1; (b) the fire frequency FFp orits reciprocal of FCp; and (c) the distribution ofintervals between two successive fire events at thesite under investigation. The data structure re-quired for calculating FFp and FCp is the presenceor absence of a fire event in any given year over aperiod of time. These events are usually consid-ered as independent of each other, and not corre-lated with the events that occur in theirsurroundings.
The second situation is an expansion of the firstsituation in which the spatial concern in size of astudy area is enlarged from a particular site to agiven region. Thus the average annual fire numberfor the region could then describe the fire fre-quency. Defined in this way, the number of fireincidents in a single year might be more than one.This fire frequency concept should also be consid-ered as point-based because the sizes of burnedareas are not taken into account. From both theforest dynamics and fire management perspec-tives, however, this definition of fire frequencymerely counts the number of fire incidents anddoes not provide useful information, either in firelocations or fire sizes. Therefore, it will not be thefocus of this paper.
In the third situation, the meaning of fire fre-quency refers to the total area burned. Thus thedefinition of fire frequency can be considered as
C. Li / Ecological Modelling 154 (2002) 103–120 105
area-based. This fire frequency can be describedby one of following descriptors: (a) the fire cycleFCa; (b) the FFa or PAAB, which is the reciprocalof FCa; and (c) the fire size distribution. The datastructure required for calculating FCa is the an-nual fire maps over a period of time for the regionunder investigation.
With these diverse meanings of fire frequency,one question could be raised: what are the distin-guishable features among different fire frequencyconcepts? The question can be addressed in termsof bias estimation from a computational perspec-tive. This paper examines this question by com-paring different fire frequencies with regard to anideal historical fire data set.
1.2. Implementation of fire frequency concept infire models
There are different methods of simulating firefrequency and fire cycle in forest dynamics mod-els. For example, in small area or point-basedforest dynamics models, fire is represented as arandom event, which follows one of the followingthree probability distributions. The first is a com-plete random probability distribution in which theprobability of fire is the reciprocal of a predeter-mined fire cycle. It applies the same fire probabil-ity to each unit of a landscape, while discountingthe interactions among units (Van Wagner, 1978;Keane et al., 1989). The second uses a uniformfire probability distribution in which the firewould occur at either a fixed interval, or a ran-dom interval with a mean value equal to a prede-termined interval (e.g. Apps et al., 2000; Bhatti etal., 2001). The third uses a forest age-dependentfire probability distribution in which the probabil-ity of fire is a function of forest age or time sincelast burn (e.g. Clark, 1989; Prentice et al., 1993;McCarthy et al., 2001). In these models, a com-mon hypothesis that forest dynamics of largeregions can be represented by forest dynamics ofpoint-based sites was assumed, so that forest fireprocesses that usually operating at a large spatialscale were simplified as random events at a smallspatial scale. Such treatment might be reasonablefor investigating forest dynamics under intensivemanagement such as in Scandinavian boreal
forests; however, it might not be suitable for thesituations in the boreal forests of Canada becauseof the observed irregular sizes and shapes ofburned areas (Li and Apps, 1996).
In large area or area-based forest dynamicsmodels, however, fire frequency and fire cycle areneeded to run simulation models (e.g. inDISPITCH of Baker et al., 1991, LANDIS of Heand Mladenoff, 1999, and FLEP-X of Boychuk etal., 1997). These models are usually linked withavailable geographical information system (GIS)data sets, and represent a forested area (i.e. aforest landscape) in either a vector or a rasterformat. The models simulate the temporal andspatial dynamics of forest stand mosaic patternsthrough the creation of new stands by fires anddissolution of old stands through forest growthand subsequent decline and decay. The most com-mon model design is to treat fire frequency andfire size distribution separately, i.e. fire frequencyrepresents the annual fire number without consid-ering their associated fire sizes, and thus the firesize distribution is independent of fire frequency.Therefore, two independent random numberswere required to run these models. Once the sizeof a fire was determined, the fire would spread tothis size regardless of the landscape and weatherconditions. However, different algorithms havebeen employed in different models to realize thepredetermined fire sizes. The identification of thetwo probability distributions from which the tworandom numbers are drawn is then consequentlyvital in determining the simulation results. Whilethe spatial correlation among burned forest areaswere taken into account in these large area orarea-based forest dynamics models, a pre-require-ment for running these models is that users musthave a good understanding of the fire regimes inorder to determine the annual fire number andsizes for each of the fires to be simulated. Thesemodels were mainly designed and used for provid-ing quick answers to what-if type of questions.
Other area-based forest dynamics models deter-mine fire sizes according to landscape structureand weather conditions. The Manitoba model(Peterson, 1994; Holling et al., 1996) was devel-oped based on cellular automata algorithm wherea fixed rule of fire spread (i.e. forest age-depen-
C. Li / Ecological Modelling 154 (2002) 103–120106
dent) and a fixed number of fires per season wereapplied. The ON-FIRE model (e.g. Li et al., 1997;Li, 2000b) simulates fire size as a result of interac-tions among fuel type, landscape topography, andforest age. The annual fire number is a function ofthe number of fire ignition sources and the siteconditions where the fire ignition sources werepresented. In the SEM-LAND model (e.g. Li,2000a; Li et al., 2000; Li and Barclay, 2001), bothfire initiation and spread probabilities are also afunction of weather conditions, and the relation-ships summarized in the Canadian Fire WeatherIndex System (FWI) (Van Wagner, 1987) and FireBehavior Prediction System (FBP) (ForestryCanada Fire Danger Group, 1992; Hirsch, 1996)were employed to calculate these probabilities.Consequently, the simulated fire numbers and firesizes may or may not be the same as model input,thus the fire frequency and fire cycle are theoutput of the models. These models followed asystems analysis approach to investigate forestdynamics at a particular forest landscape as awhole. The models attempt to incorporate con-temporary knowledge and information about theinteractions among fire events and forest ecosys-tem components from published results of firesciences. Due to the detailed simulation of fireprocesses, applications of these models usuallyrequire more computing power. However,emerged properties from the forest dynamics atthe landscape scale such as self-organization offorest dynamics (Holling et al., 1996) could bedemonstrated, and hence natural fire regimescould be simulated (Li, 2000a).
The diverse model implementation of fire im-pact on forest dynamics results from, amongother factors, the different concepts of fire fre-quency and fire cycle employed by model design-ers and developers. Thus, a theoretical question israised: are fire frequency and fire cycle possiblyrelated to each other? The answer to this questionmay be important in improving the simulations ofhow fire influences forest dynamics. Van Wagner(1978) discussed the relationship through a theo-retical negative exponential probability distribu-tion that links fire cycle and forest agedistribution. This paper examines a hypothesisthat point-based fire frequency and fire interval
concepts are the special case of area-based PAABand fire cycle concepts from a computationalperspective.
This paper starts with the derivation of firefrequency and fire cycle concepts, followed by thepresentation of empirical fire data structure andthe structure of the ideal data set of fire historyfrom a computational point of view. One suchideal fire data set is therefore, generated by usinga generic spatially explicit model for landscapedynamics (SEM-LAND) on a study area in west-central Alberta. This data set is then used toexamine the hypothesis stated above and the ac-curacy of different methods of estimating firefrequency and fire cycle. A general discussion onmethodology of fire frequency and fire cycle esti-mation, and a number of suggestions on simulat-ing fire regimes will close the paper.
2. Derivation and estimation of fire frequency andfire cycle
As mentioned in the previous section, fire oc-currence and burned area related fire regime de-scriptors such as fire frequency and fire cycle arecommonly used to characterize a fire regime. Theconcepts of fire frequency and fire cycle are funda-mentally derived from the structure of availableempirical fire data. In this section, the structuresof historical fire data shall be reviewed, and thederivation of the concepts of fire frequency andfire cycle shall be described.
2.1. Structure of empirical fire data
Historical fire data can be categorized into thefollowing five categories according to theirsources:
Category 1 comprises the point-based fire scardata obtained from the dendrographical analysisof fire scar records. In fire history studies, this isthe most common method of collecting field sam-ples to determine when fires occurred at the sam-pling sites. The fire scar data usually represent theoccurrence history of non-stand replacement fires(Johnson and Gutsell, 1994; Johnson et al., 1999;Weir et al., 2000), but the sampled tree could also
C. Li / Ecological Modelling 154 (2002) 103–120 107
be right on the edge of a historical stand-replace-ment fire. Examples of such fire data are illus-trated in Fig. 1c.
Category 2 comprises the sediment pollen andcharcoal data, which are mainly point-based with
influences from surrounding conditions. Differentfrom fire scar records, the pollen and charcoalrecords collected from lake-sediment represent theoccurrence of historical fires around the samplinglocations, i.e. indirect evidence. It can be the
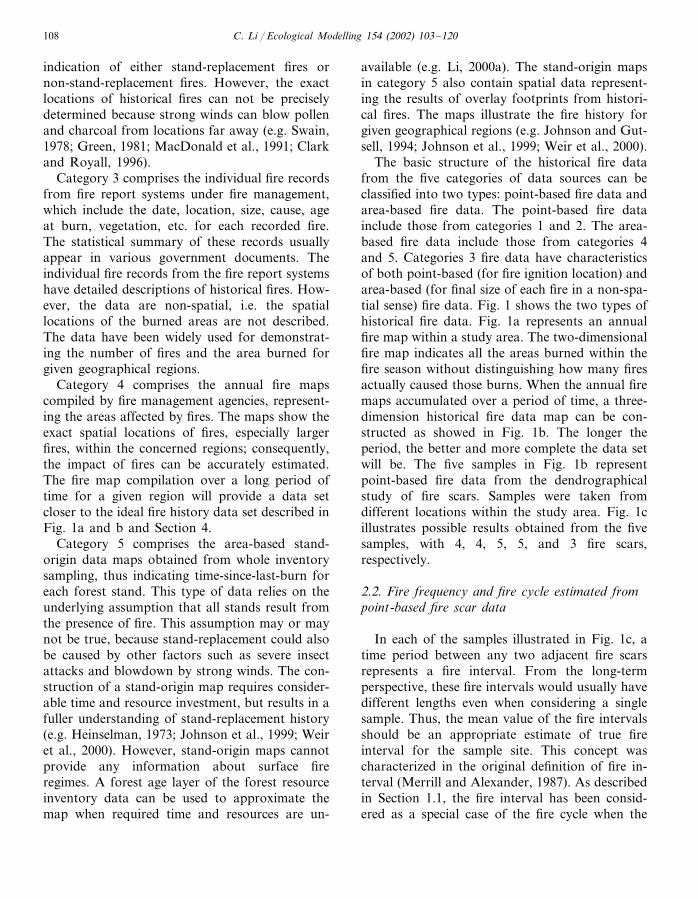
Fig. 1. Fire history data structure. (a) A yearly fire map shows the burned area within a study area under investigation. (b) A seriesof yearly fire maps collected over time. The samples 1 to 5 indicate the random samples located within the study area. (c) Fireincidences identified from the random samples.
C. Li / Ecological Modelling 154 (2002) 103–120108
indication of either stand-replacement fires ornon-stand-replacement fires. However, the exactlocations of historical fires can not be preciselydetermined because strong winds can blow pollenand charcoal from locations far away (e.g. Swain,1978; Green, 1981; MacDonald et al., 1991; Clarkand Royall, 1996).
Category 3 comprises the individual fire recordsfrom fire report systems under fire management,which include the date, location, size, cause, ageat burn, vegetation, etc. for each recorded fire.The statistical summary of these records usuallyappear in various government documents. Theindividual fire records from the fire report systemshave detailed descriptions of historical fires. How-ever, the data are non-spatial, i.e. the spatiallocations of the burned areas are not described.The data have been widely used for demonstrat-ing the number of fires and the area burned forgiven geographical regions.
Category 4 comprises the annual fire mapscompiled by fire management agencies, represent-ing the areas affected by fires. The maps show theexact spatial locations of fires, especially largerfires, within the concerned regions; consequently,the impact of fires can be accurately estimated.The fire map compilation over a long period oftime for a given region will provide a data setcloser to the ideal fire history data set described inFig. 1a and b and Section 4.
Category 5 comprises the area-based stand-origin data maps obtained from whole inventorysampling, thus indicating time-since-last-burn foreach forest stand. This type of data relies on theunderlying assumption that all stands result fromthe presence of fire. This assumption may or maynot be true, because stand-replacement could alsobe caused by other factors such as severe insectattacks and blowdown by strong winds. The con-struction of a stand-origin map requires consider-able time and resource investment, but results in afuller understanding of stand-replacement history(e.g. Heinselman, 1973; Johnson et al., 1999; Weiret al., 2000). However, stand-origin maps cannotprovide any information about surface fireregimes. A forest age layer of the forest resourceinventory data can be used to approximate themap when required time and resources are un-
available (e.g. Li, 2000a). The stand-origin mapsin category 5 also contain spatial data represent-ing the results of overlay footprints from histori-cal fires. The maps illustrate the fire history forgiven geographical regions (e.g. Johnson and Gut-sell, 1994; Johnson et al., 1999; Weir et al., 2000).
The basic structure of the historical fire datafrom the five categories of data sources can beclassified into two types: point-based fire data andarea-based fire data. The point-based fire datainclude those from categories 1 and 2. The area-based fire data include those from categories 4and 5. Categories 3 fire data have characteristicsof both point-based (for fire ignition location) andarea-based (for final size of each fire in a non-spa-tial sense) fire data. Fig. 1 shows the two types ofhistorical fire data. Fig. 1a represents an annualfire map within a study area. The two-dimensionalfire map indicates all the areas burned within thefire season without distinguishing how many firesactually caused those burns. When the annual firemaps accumulated over a period of time, a three-dimension historical fire data map can be con-structed as showed in Fig. 1b. The longer theperiod, the better and more complete the data setwill be. The five samples in Fig. 1b representpoint-based fire data from the dendrographicalstudy of fire scars. Samples were taken fromdifferent locations within the study area. Fig. 1cillustrates possible results obtained from the fivesamples, with 4, 4, 5, 5, and 3 fire scars,respectively.
2.2. Fire frequency and fire cycle estimated frompoint-based fire scar data
In each of the samples illustrated in Fig. 1c, atime period between any two adjacent fire scarsrepresents a fire interval. From the long-termperspective, these fire intervals would usually havedifferent lengths even when considering a singlesample. Thus, the mean value of the fire intervalsshould be an appropriate estimate of true fireinterval for the sample site. This concept wascharacterized in the original definition of fire in-terval (Merrill and Alexander, 1987). As describedin Section 1.1, the fire interval has been consid-ered as a special case of the fire cycle when the
C. Li / Ecological Modelling 154 (2002) 103–120 109
size of the study area is reduced to a single site.Therefore, the fire interval is referred to as apoint-based estimate of fire cycle, FCp, and itsreciprocal as a point-based estimate of fire fre-quency, FFp.
The FCp is usually estimated by using the for-mula (3) with two exceptions. The usual situa-tion for fire scar data sets is that no fire scar, islocated at either end of the data set, such as thesamples 1, 3, and 5 illustrated in the Fig. 1c. Inthis case, three full FCp and two incomplete FCp
would appear, and the best estimate of FCp canbe represented as:
FCp=T/No. of fire scar (3)
where T is the total time period.The first exception is that of two fire scars
located at both ends of the data set (e.g. sample4 in Fig. 1c), hence only three full FCp are pre-sented. Thus, the estimate of FCp would be:
FCp=T/(No. of fire scar−1) (4)
The second exception is that of one fire scarlocated at one end of the data set (e.g. sample 3in Fig. 1c), hence there are three full FCp andone incomplete FCp in the data set, so the FCp
estimate would be between the Eqs. (3) and (4):
FCp=T/(No. of fire scar−0.5) (5)
It is worth noting that a reliable estimate ofFCp requires long-term observations covering aperiod of several FCp. In the Fig. 1c, assumethat the total time period is 200 years, then theFCp calculated from the samples 1, 3, and 5 are50, 40, and 66.7 years (with 4, 5, and 3 firescars), respectively. If the three samples are theonly data available for the study area, then theFCp estimated for the study area would be 55.2years, which is the average of the three fire cy-cles:
FCp=1
SN�SN
i=1
� TNo. of fire scar
�i
(6)
where SN is the total number of samples, andthe subscript i indicates the ith sample. How-ever, if all five samples are taken into account,the estimated FCp for the study area would be
47.6 years. This also indicated that the FCp esti-mate depending upon the criteria of determiningthe sample sizes. In reality, point-based fire scardata are biased because only trees that surviveda past fire will be available today to give data.At a given location, one can only look back asfar as the time when the previous tree at the sitewas killed by fire.
2.3. Fire frequency and fire cycle estimated fromarea-based fire maps
From a fire map illustrated in Fig. 1a, annualtotal area burned can be calculated, so that anarea-based fire cycle, FCa, can be estimated fromany start year until the year when a cumulativeburned area equals the total area under investi-gation (see Fig. 1b). Assume the data set ex-pressed in the Fig. 1b last T years that cover thelength of several FCa, then the FCa can be cal-culated as:
FCa=T×A
B(7)
where B indicates total area burned during the Tyears, and A is the size of the area under inves-tigation. The reciprocal of FCa is the PAAB,which is an area-based estimate of fire frequencyFFa indicating how fast the total area could beburned once.
2.4. Fire frequency and fire cycle estimated fromrecords contained in fire report systems
Government fire agencies in Canada have kepthistorical individual fire event records in fire re-port systems in an effort to improve future firemanagement. The records are a summation ofnon-spatial annual fire maps and numeroussmall fire records that are usually not shown onannual fire maps.
The summation of sizes of these fires is the B,thus the FCa and FFa can be calculated fromEqs. (7) and (2). The data provided in theserecords is not as detailed as those used in firescar analysis, and consequently the FCp cannotbe adequately estimated.
C. Li / Ecological Modelling 154 (2002) 103–120110
2.5. Fire frequency and fire cycle estimated fromgo�ernment statistics
Forest fire statistics from government reportsoften contain information on annual total numberof fires FN and the total area burned B. Theinformation is usually organized by province orregion (Canadian Council of Forest Ministers,1997). Thus, FCa and FFa can be estimated fromthe Eqs. (7) and (2) for different provinces orregions.
Fire size can be ideally represented by its distri-bution. The sizes associated with individual firesare generally available from these governmentstatistics. There is a mean fire size (MFS) that canbe calculated as
MFS=B/FN (8)
Caution should be used when calculating MFS.The accuracy of the FN could change over timedue to the increasing human capacity to detect firein remote areas, and B could be underestimatedbecause of undetected fires. The uncertainty asso-ciated with estimating FN would have a relativelylarge influence in calculating MFS, but less effecton FCa and FFa calculation because undetectedfires are usually small. For example, if 100 fires(FN) burned a total area of 10 000 ha (B) over100 years (T) within a landscape of 10 000 ha (A),then the MFS will be 100 ha and the FCa is 100years. However, if five fires were unreported, thenthe FN is actually 105, and the MFS should be95.24 ha. Consequently, the relative error is about5%. Assuming the five unreported fires were small(such as 20 ha each), then estimated FCa would be99.01 years, and this leads to about 1% relativeerror. This example also suggests that area-basedfire descriptors FCa and FFa might be less sensi-tive to possible instrumental errors in detectingfire incidence.
In addition to the mathematical concern indi-cated above, some theoretical issues need to beresolved for the MFS. Statistical MFS is usuallymeaningful if the fire size distribution follows aNormal probability distribution. In reality, firesize distributions are not even close to such adistribution, and a negative exponential probabil-ity distribution is usually assumed for fire size
distributions (e.g. Van Wagner, 1978; Baker,1995). This assumption might be expected ifenough natural (i.e. without human intervention)fire records (i.e. over a long period) are includedin the fire size distribution. Therefore, the MFSmight be meaningful when it serves as a parame-ter of the theoretical negative exponential fire sizedistribution (Li et al., 1999).
A mathematical description for different firefrequency and fire cycle concepts from an idealdata set shall be presented in the next section.
3. Mathematical description for fire frequencyconcepts from an ideal data set
Let a forest landscape be represented by a gridof cells (the size of a cell can be determined by therepresentation of a single sample) with m rowsand n columns. The fire occurrence for each cellcan then be expressed as xij(k) in a three-dimen-sional array, which indicates whether a fire occursat the ith row, jth column, and kth year. Thexij(k) is defined as follows:
xij(k)=�1 (if a fire occurs)
0 (if no fire occurs)(9)
The combination of ith row and jth columndetermines a location within the area under inves-tigation. For a fixed combination of i and j, xij(k)is a time series of fire incident (see Fig. 1c)suitable for estimating point-based FFp and FCp
(similar to historical fire data sources in categories1 and 2 in the Section 2.1). They can be calculatedas
FFp=1/FCp=1T
�T
k=1
xij(k) (10)
For a fixed k, xij(k) is a fire map indicating thelocations burned by fires during the year k (seeFig. 1a). Therefore, the summation of these loca-tions is the annual area burned in year k. Acollection of such fire maps constitutes an idealfire history data set (Fig. 1b). The area-based firefrequency, FFa, which can be expressed as PAAB,can be estimated by the mean value of annualsummations over the period of investigation. The
C. Li / Ecological Modelling 154 (2002) 103–120 111
FCa is the cumulated area burned from year 1until it reaches the total area under investigation.Due to its dynamic properties, the FCa for a givenarea should be represented by its long-term aver-age, i.e. over a period that may contain a numberof FCa. Thus, the FCa and FFa can also becalculated as
FCa=1/FFa=m×n×T/ �m
i=1
�n
j=1
�T
k=1
xij(k) (11)
The hypothesis that point-based fire frequencyand fire interval concepts are the special case ofarea-based PAAB and fire cycle concepts, isequivalent to the hypothesis that point-based FFp
and FCa are the special case of area-based FFa
and FCa when m and n are equal to 1, from acomputational perspective. To test this hypothe-sis, an ideal fire data set needs to be prepared. Themethod of generating such an ideal fire data setshall be described in the next section, and thestatistical results of the data set shall be used asthe true value of FCa for comparison from acomputational perspective.
4. Generation of an ideal data set
A data set with a structure illustrated in Fig. 1bwas constructed by running the SEM-LANDmodel. The model was designed to perform de-tailed temporal and spatial simulation of forestlandscape dynamics subjected to natural distur-bance regimes (primarily fire). A forest landscapeis simulated as a grid of rectangular cells, andeach cell represents a forest stand with homoge-neous site condition, vegetation cover type, andtree age. The raster-based model uses currentlandscape conditions such as GIS data layers ofland and vegetation cover type, forest age, siteindex, terrain, as well as fire and weather condi-tions as input. The model outputs simulated indi-vidual fire records and fire regime statistics, aswell as forest conditions over time and space suchas forest age, volume, basal area, and height.
Forest growth without disturbance is describedby standard forest growth formulas for Alberta,Canada (Alberta Forest Service, 1984). The for-mulas describe the basal area and volume ofmajor tree species as a function of their ages.
A forest fire process was simulated in twostages: initiation and spread. The annual fire igni-tion sources were randomly allocated within thestudy area. The presence of a fire ignition sourcemay cause a fire initiation (most of the trees in a1 ha forest are killed) depending on a fire initia-tion probability, which is a function of forest age,forest type hence fuel type, and weather condi-tions. Once a fire is initiated, it will have thepotential to spread to adjacent forest stands de-pending on a fire spread probability, which is afunction of forest age, forest type, terrain, andweather conditions. The relationships summarizedin the FWI (Van Wagner, 1987) and FBP(Forestry Canada Fire Danger Group, 1992) sys-tems describe how weather conditions will influ-ence the moisture code in different types of fuel,and how the fuel moisture code will affect the rateof fire spread. Based on an assumption that fireinitiation and spread probabilities are propor-tional to the rate of fire spread, the relationshipsare used in the SEM-LAND model to simulatedetailed fire spread process at the landscape scale.
The fire is allowed to spread until it is stoppedin all its directions or reaches the boundary of thestudy area. In yearly time steps, forest stands age1 year if not burned, or are reset to zero if theyare burned. A self-replacement of forest cover wasassumed in the model. The detailed model de-scription can be found in Li (2000a,b), Li et al.(2000), and Li and Barclay (2001).
The Athabasca Working Circle Compartments28, 29, 31, and 32 of Weldwood of Canada (Hin-ton Division) in west-central Alberta, Canada waschosen as the study area for current researchpurposes. The study area has 31 444 ha in totaland forest covered 30 974 ha. Within this area,more than half of the forest (50.4%) is dominatedby lodgepole pine (Pinus contorta Dougl. ExLoud. var. latifolia Engelm.), and the rest of thearea is covered by black spruce (Picea mariana(Mill.) B. S. P.) (13.73%), white spruce (Piceaglauca (Moench) Voss) (10.42%), aspen (Populustremuloides Michx.) (12.99%), and non-productiveland (12.47%). A total of 10 000 ha within thearea were selected as the base for the data setgeneration. The GIS data layers of land andvegetation cover type, forest age, site index, as
C. Li / Ecological Modelling 154 (2002) 103–120112
Fig. 2. Simulated annual fire number (a), area burned (b), and mean forest age (c) of the constructed ideal fire data set.
well as weather conditions for the study area wereused as SEM-LAND model input. The fire andforest dynamics were simulated for a period of500 years, and the simulated fire maps for the last300 years were used as the ideal fire data set.
Fig. 2a and b show the simulated annual firenumber and area burned over the 300 years.While the mean annual fire number was almostconstant, the annual area burned fluctuated sig-nificantly. There were 12 years (4% of the 300years) that had an annual area burned larger than500 ha, which is 5% of the total area. The largestannual area burned was 7141 ha in year 36, thesecond largest was 5156 ha in year 100. Theannual area burned in all the rest of the years wassmall. The irregular fire sizes and annual areaburned over time demonstrated in this data set aretypical in Canadian boreal forests.
The constructed data set consists of 300 years’fire maps. Each fire map is a grid of 100 by 100cells, and each cell represents an area 1 ha in size.Burned cells are denoted as 1 and unburned cellshave a value of 0. Therefore, the summation of afire map is the total area burned in the particular
year, and the summation of the whole data set isthe total area burned in 300 years. The fire cycleFCa, which can be calculated by using Eq. (7), isabout 131.3313 years, i.e. the total area burnedduring the 300 years is equal to 2.2843 times ofthe total size of the area. This FCa shall be treatedas the true value for this data set.
The SEM-LAND model also outputs foreststand age mosaic maps at the end of each year’ssimulation, in order to be compatible with themodel output of fire maps. Fig. 2c shows thedynamics of mean forest age under such a fireregime. The mean forest age sharply decreasedafter the large fires at the year 36 and the year100, as well as after a period of relatively largefires from year 169 to year 172.
In the next three sections, estimates of FCa
from fire maps, stand-origin maps, and point-based sampling designs, are presented. The resultsare compared with the true value of FCa, and thusthe hypothesis that point-based fire frequency andfire interval concepts are the special case of area-based PAAB and fire cycle concepts is tested froma computational perspective.
C. Li / Ecological Modelling 154 (2002) 103–120 113
5. Fire map-based FCa estimate
There are 300 continuous fire maps in the gen-erated ideal fire data set, and each fire map con-tains fire records in 100 by 100 cells, eitherburned or unburned. If all 300 fire maps aretaken into account, then the mean value of the300 annual area burned would provide sufficientinformation to estimate FCa according to Eq.(11), and the result would be equal to the truevalue of 131.3313 years exactly (see description inSection 4). In reality, no such long period of firemaps is available. Therefore, the question is howmany fire maps would be sufficient for a satisfac-tory estimation of FCa? Two issues need to beconsidered in answering this question: (1) influ-ence of different lengths of data sets on the FCa
estimation; and (2) influence of the starting yearof compiling fire maps on the FCa estimation.
For the first issue, one could expect that oncethe number of fire maps (i.e. data length) reachesa certain threshold, the estimated FCa would tendto be stable and closer to the true value of FCa.For the second issue, one could expect that whenfire maps are compiled from different startingyears, i.e. different times during a fire cycle, theestimated FCa would still tend to be stabilizedand closer to the true value of FCa, as long as thedata set is long enough. Furthermore, the varia-tion associated with FCa estimates would changewith different data lengths.
To examine these two issues, FCa values werecalculated using different numbers of fire mapsfor three different starting years. The first startingyear is year 1 of the data set, so that 300 FCa
values could be obtained by using the first year’sfire map, the first 2 years’ fire maps, the first 3years’ fire maps, etc. Fig. 3 shows the resultswhere an overestimate of FCa appeared before thefirst large fire in year 36, an underestimate of FCa
appeared after that large fire, and the estimates ofFCa thereafter were gradually approaching thetrue value of FCa. For this particular data set, lessthan 34 years of data would generate a FCa
estimate that could be more than four times thetrue value of FCa.
The second starting year is year 40 (see Fig. 3),which is after the first large fire in year 36. Thus,only 260 FCa estimates were produced. Althougha relatively stable FCa estimate could be reached,after the overestimate of FCa for the first 60 years(i.e. before the second large fire occurred at year100), the required number of fire maps hasincreased.
The third starting year is year 105 (see Fig. 3),which is after the second large fire in year 100. Inthis case, 195 FCa values can be estimated. Therewas no large fire during this period, and theestimated FCa gradually approached a relativelystable value of FCa. The required number of firemaps is reduced to about 25.
The results suggested that the number of firemaps required to obtain a relatively stable FCa
might not be constant, and it could be influencedby the fire history of the region under investiga-tion. Furthermore, fewer fire maps might be re-quired if less extreme fire behavior occurredduring the past two to three decades.
The results presented in this section clearlyindicate that the length of a set of fire maps orthe starting point of compiling fire maps cansignificantly influence the estimate of FCa. Thisexplains that different FCa estimates for the sameregion could be obtained if different continuousnumbers of fire maps are used for FCa estimation.The very large number of fire maps may alsoneeded in some cases, which will not generally beavailable.
Fig. 3. The FCa estimated from different numbers of fire mapsand three different starting years.
C. Li / Ecological Modelling 154 (2002) 103–120114
Fig. 4. The FCa estimated from stand-origin maps at 10-yearintervals by a non-linear curve fitting procedure.
probability that a stand survives to time t, S(t),can be described by a negative exponential prob-ability distribution:
S(t)=exp(−�t) (12)
where � is the parameter of the exponentialprobability distribution, defined as the reciprocalof its mean value. Consequently, FCa can becalculated as:
FCa=1/� (13)
A non-linear curve fitting procedure was ap-plied to every 10-year interval of stand-originmaps (SAS Institute Inc., 1989). The curvefitting was performed for determining the best fitof � value for the cumulative percentage of areaburned against forest age, in order to calculatethe FCa. The estimated FCa values at differentyears were showed in Fig. 4.
The results in Fig. 4 suggest that the FCa
estimated from the stand-origin maps might alsonot be constant over time. In other words, thetime for constructing the stand-origin mapwould have a significant influence on estimatedFCa. The reason for such an unstable estimateof FCa is probably due to the changes in forestage structure, and the forest age structure is inturn determined by the fire regime (Li and Bar-clay, 2001). However, the estimate could be im-proved by mapping stand age on a larger area.
The results also suggest that the standardmethod might generally overestimate the fire cy-cle. This phenomenon can be explained by thehistorical overlapping of burned areas. With theincreased degree of overlapping, the observedpatch sizes (which are used as the estimatedsizes of burned areas in the standard method),especially the sizes of old patches, will be de-creased. Consequently, the estimated � valuewould be decreased, hence the increased fire cy-cle estimate.
The results presented in Fig. 4 also suggestthat the FCa estimated from a stand-origin mapmight or might not be stable, depending on thefire history. Therefore, estimation of FCa usingthis standard method should be done with cau-tion.
6. Stand-origin map-based FCa estimate
A stand-origin map represents a snapshot ofthe forest patch age mosaic, which results fromoverlapping stand-replacement fires in the past.The method of constructing a stand-origin mapusually requires air photo interpretation of standboundaries combined with sampling each standwithin the whole region to determine stand age.This means that considerable time and resourcesare required to perform such analysis. However,the map of forest stand age in forest inventorydata can approximate the stand-origin map (Li,2000a). The focus of investigation here iswhether a reliable estimate of FCa can be ob-tained by constructing such a stand-origin map,in other words, whether a stable FCa can beobtained if the stand-origin map were con-structed at different years. To address this issue,an analysis of forest age mosaic maps, anotherSEM-LAND model output from the same simu-lation, was carried out.
The estimation of FCa based on such a stand-origin map is to perform a survival analysis forestimating the expected length of standlongevity. A standard method for such analysishas been described in detail (e.g. Johnson andVan Wagner, 1985; Johnson, 1992; Johnson andGutsell, 1994; Reed et al., 1997), based on anassumption that forest age across a landscapefollows a negative exponential probability distri-bution under a constant fire hazard. Thus, the
C. Li / Ecological Modelling 154 (2002) 103–120 115
7. Point-sample-based FCa estimate
In the created fire data set, there are 10 000possible point-based samples, each with a recordlength of 300 years. Fire cycle estimated fromeach sample can be obtained by using Eq. (3) orEq. (2). Fig. 5 shows the frequency of fire num-bers (A) and their spatial distribution across thelandscape (B), with different levels of darknessindicating different fire numbers.
If all 10 000 samples were taken into account,then the mean value of the 10 000 estimated FCa
would equal the true value of 131.3313 yearsexactly. In reality, however, only a small percent-age of samples could be taken (Johnson andGutsell, 1994). Therefore, the issues are: (1) howmany samples are needed to obtain a satisfactoryestimate of FCa; and furthermore, (2) what sam-pling design is the best for achieving this purposewith the least sample size needed? In this section,these issues shall be explored by comparing differ-ent sampling designs and sample sizes.
7.1. Under a random sampling design
Simple random sampling is designed to selectsamples from a universe where every possiblesampling unit has an equal chance of selection
(Cochran, 1977). In the current study, the Fig. 5Bis the universe that contains 10 000 possible sam-pling units. Each sample unit contains the infor-mation regarding how many times it has beenburned during the 300 years. A true value FFa canbe estimated by Eq. (10) as 2.2843. In statistics,the randomness is vital for obtaining an unbiasedestimate of FFa.
A computer sampling experiment was carriedout to evaluate the possible biased estimate of FFa
involved with this sampling design. Differentnumbers of units (5, 10, 20, 50, 100, 150, and 200representing 0.05, 0.1, 0.2, 0.5, 1, and 2% of thetotal possible sampling units, respectively) weresampled, and each sample size was repeated 20times. The position of a sample unit is selected onthe basis of two random numbers that define aunique location within the landscape. This sam-pling design is called unrestricted random samplerepresenting the simplest form of random sam-pling (Cochran 1977).
Mean FCa values and their associated standarderrors for these sample sizes were calculated andshowed in Fig. 6. The results suggest that whenthe sample sizes are small, relative to the totalnumber of possible sample units, the FCa could beoverestimated with larger variations. When thesample size becomes larger, the FCa could be
Fig. 5. Point-based sampling units distributions: (a) frequency distribution; and (b) spatial distribution.
C. Li / Ecological Modelling 154 (2002) 103–120116
Fig. 6. The FCa estimated from a random sampling designwith different sample sizes. The horizontal dished line indi-cates the true value of FCa.
can be mechanically spaced at uniform intervalsthroughout the landscape.
Four different spatial intervals were used in thecomputer simulation of this sampling design onthe landscape. The first interval was a distance of10 units; therefore, 100 sample units were selectedstarted at the upper left corner. A total of 100possible designs could be implemented, when thecoordination of the initial sample unit changedacross the landscape. The second interval was adistance of 15 units, thus the sample size of 49could be selected in each sampling design, and themaximum possible designs totaled 100. The thirdinterval was a distance of 20 units, with a simplesize of 25 for each design, and a total of 400possible designs could be determined. The fourthinterval was a distance of 30 units and 16 sampleunits in total is selected in each sampling design.A total of 100 sampling designs could be imple-mented. Table 1 shows the estimated FCa andtheir associated standard errors for different spa-tial intervals.
Results in Table 1 also suggested that with theincrease of sample size, the estimated FCa wouldbe closer to the true value, and the associatedvariations could become smaller. However, thesampled spatial data cannot be analyzed statisti-cally in general (Southwood and Henderson,2000), because it might coincide with some unsus-pected systematic distribution pattern. However,some studies have shown that the resulting statis-tics could be ‘at least as good, if not rather better’than those obtained from random sampling (e.g.Miline, 1959). From a cost-related perspective, itcould be an advantage for the systematic sam-pling design because it may be carried out morequickly than the random method. In this particu-lar data set, the systematic sampling design might
underestimated with smaller variations. Neverthe-less, the range of estimated FCa is not very large.In reality, the randomness was not implementedfully, with a higher probability to sample on olderforest stands than that on younger stands. Conse-quently, an overestimated FCa might appear be-cause older forest stands tend to have burnedfewer times during the 300 years.
7.2. Under a systematic sampling design
The systematic sampling design is to take sam-ples at a fixed interval in space. It is easier tolocate and execute the sampling without mistakes,and intuitively, it seems likely to be more preciseor representative than simple random sampling(Cochran, 1977). This method has been popularfor assessing timber and range conditions (Averyand Burkhart, 1994). Under this sampling design,once the initial sample unit is selected, other units
Table 1FCa and associated standard errors estimated from a systematic sampling design
Sample sizeSpatial interval Replications Fire cycle (year) Standard error
16 10030 134.53 1.594002520 0.70132.74
49 10015 130.08 0.8910010 100 132.13 0.71
C. Li / Ecological Modelling 154 (2002) 103–120 117
be seen as equally good as the simple randomdesign, because 16–20 samples could provide asimilar estimate on FCa.
8. Discussion
The results presented in this paper confirmedthat: (1) the hypothesis that point-based fire fre-quency and fire interval concepts are the specialcase of area-based PAAB and fire cycle concepts;(2) despite the theoretical confirmation of thehypothesis, biased estimates of fire frequency andfire cycle could arise from existing methods ofestimation; and (3) the biased estimates can be aresult of sampling design, sample size, and distur-bance history of the study area under investiga-tion. Therefore, to obtain an accurate estimate offire frequency and fire cycle for a particular areaneeds to consider the stand-replacement distur-bance history of the area. There are minimumrequirements of data quality that are needed toderive unbiased estimates.
FCa and FFa estimations from area-based fireand landscape data such as fire maps and stand-origin maps might be significantly influenced byrecent fire history, especially by large and extremefire disturbances (see Figs. 3 and 4). At least35–40 continuous annual fire maps would berequired to obtain relatively stable FCa and FFa
estimates for this particular data set. The stand-origin map would provide overestimates of FCa
and FFa in general, but a significant estimationbias could arise if the map is constructed shortlyafter a large or extreme fire year (see Fig. 4). Thearea-based data, especially stand-origin maps,usually describe the effect of stand-replacementfires. Therefore, the estimated FCa and FFa are forcrown fire regimes. For fire maps that includesevere surface fire effect, the estimated FCa andFFa could represent a mixture of crown and sur-face fire regimes.
FCa and FFa estimations from point-based sam-pling data require at least 0.16–0.20% of the totalpossible samples, i.e. 16–20 samples for this par-ticular data set. A simple random sampling designand a systematic sampling design demonstrated asimilar result for this particular data set (see Fig.
6 and Table 1). The point-based sampling data(e.g. from fire scar records) mainly describe theeffect of non-stand-replacement fires; thus, theestimated FCa and FFa are for surface fireregimes. The fires in this particular data set wereassumed to have a stand-replacement effect, andthus the estimations are still for a crown fireregime.
The results presented in this paper suggest thatthe estimates of fire frequency and fire cycle arenot static, but change over time (see Figs. 2–4).This is consistent with the contemporary under-standing of fire regimes. Many factors may influ-ence the dynamics of fire regimes. For example,weather or climate is apparently a major factorthat determines the fire behavior in any specificfire event, thus the final fire size and in turn thefire cycle. Vegetation type is also important indetermining fuel type and the succession of vege-tation may lead to a different fuel type, corre-sponding to a different development stage ofvegetation. In the FBP systems, for example, im-mature and mature jack pine forests have beenrecognized with different fuel types. Different fueltypes may indicate different fire behavior and thusdifferent probabilities of fire. Landscape structuremay also play a notable role in determining finalfire sizes and shapes, through the spatial configu-ration of physical fire barriers and different fuels.Topography can influence fire-spread process,hence the final fire sizes and shapes (Van Wagner,1977, 1988). Finally, the patterns of fire ignitionsources, such as level of fire ignition sources andspatial-temporal presence within the area underinvestigation, also influence fire dynamics (Li,2000c). Considering the interactions among thesefactors over time and space, it may be unrealisticto expect a static estimate for either fire frequencyor fire cycle.
The estimated fire frequency and fire cyclecould vary for the same geographical region, ifdifferent data sets representing different time peri-ods are used (Fig. 3). The time periods thatavailable fire data sets covered are usually muchshorter than a fire cycle, thus a reliable estimate offire cycle is unlikely to be obtained. Therefore, itwould be appropriate to reaffirm that long-termobservations are needed to obtain reliable esti-mates of fire cycles.
C. Li / Ecological Modelling 154 (2002) 103–120118
The fact that different estimates of fire fre-quency and fire cycle could be obtained for thesame geographical region has raised a concernabout the usefulness of the fire cycle concept (S.Cumming, Boreal Ecosystems Research Ltd., per-sonal communication, April 2001). While a reli-able estimate of fire cycle cannot be obtainedfrom available methods, it is suggested that theconcept of fire cycle might still be useful, e.g.serving as statistics in making comparisons amongdifferent geographical regions or different vegeta-tion types, if the same methods are applied todifferent data sets for a given time period.
The results presented in this paper also sug-gested that considerations on designing fire regimemodels are needed. In the models of forest dy-namics, the modelling purpose determined modelstructure for either a small area or a large area.Although the concepts of fire frequency and firecycle may be apparent to model developers, it isstrongly recommended that definitions be in-cluded in model documentation. This could pre-vent any possible confusion or misinterpretationof results.
While incorporating the fire regime effect inforest dynamics models is important, the method-ology of the incorporation is crucial to ensure thefire regime effect be represented reasonably. Aforest fire event is a meso-scale spatial process,and a fire regime is the result of long-term interac-tions among fire events, weather or climate, vege-tation, topography, landscape structure, and fuelconditions. Every representation of fire regimes inforest dynamics models is a simplification of realfire regimes, however, to what extent the simplifi-cation can be referred to as appropriate is of greatinterest to forest dynamics modelers.
There could be a spectrum of levels of fireregime simplification, from the simplest one inwhich a fire regime were represented as a periodicdestruction of a forest stand in non-spatial simu-lation models (e.g. Apps et al., 2000; Bhatti et al.,2001), to the most complex one in which a fireregime were simulated as a series of spatial pro-cesses occurring within a forest landscape whereweather and fuel conditions interacted with land-scape structure according to the relationships de-veloped in fire sciences (e.g. Keane et al., 1996; Li,2000a).
The results presented in this paper suggest thatit might be appropriate for both model developersand users to evaluate the reasonableness of fireregime effect in forest dynamics models. Despitedifficulties in model validation due to theavailability of suitable empirical data (Rykiel,1996), some qualitative indications of a fire regimebased on current understanding can be used toevaluate the reasonableness of the level of fireregime effect simplification. The qualitative indi-cations may include spatial pattern formation anddissolution, irregular fire shape, remnants within aburned area, fire size distribution, and so on. Theevaluation could help to avoid misleading conclu-sions on forest dynamics and fire regimes.
For non-spatial models, especially site basedmodels, it is recommended that the evaluation ofrepresentative individual sampling sites might alsobe required, in order to obtain a reasonable esti-mate of fire regime effect. This is because theprobability of fire for a specific unit could beinfluenced by whether it is adjacent to a burningsite, i.e. a function of its distance to fire ignitionlocations (Li and Apps, 1996; McCarthy et al.,2001). This simplification of fire disturbances inforest dynamics models of isolated units does nottake into account the adjacency fire effect. It alsodoes not consider the effect of hierarchical struc-ture of forest ecosystems (Allen and Starr, 1982).A representative of individual sampling sitescould be evaluated from a sampling designconsideration.
Acknowledgements
The Alberta Vegetation Inventory data wereprovided by the Weldwood of Canada Limited(Hinton Division); weather data were from MikeFlannigan of the Canadian Forest Service. Theauthor thanks Yonghe Wang for help on curvefitting with non-linear procedure for generatingFig. 4 and Harinder Hans for GIS assistance. Themanuscript was improved from the critical read-ing and helpful comments from Ian Corns, MartyAlexander, Mike Flannigan, Brenda Laishley, andtwo anonymous reviewers on an earlier version ofthis manuscript. The encouragement from Ian
C. Li / Ecological Modelling 154 (2002) 103–120 119
Corns is much appreciated. Funding for this re-search was partially contributed from the ClimateChange Impact on Energy Sector (CCIES) pro-gram of the Federal Panel on Energy Researchand Development (PERD).
References
Agee, J.K., 1993. Fire Ecology of Pacific Northwest Forests.Island Press, Washington, D.C.
Alberta Forest Service, 1984. Alberta Phase 3 Forest Inventory:Single Tree Volume Tables, Appendix 1, Alberta Energy andNatural Resources, Edmonton, Alberta, Canada.
Allen, T.F.H., Starr, T.B., 1982. Hierarchy: Perspectives forEcological Complexity. The University of Chicago Press,Chicago.
Apps, J.J., Bhatti, J.S., Halliwell, D., Jiang, H., Peng, C.H.,2000. Simulated carbon dynamics in the boreal forest ofcentral Canada under uniform and random disturbanceregimes. In: Lal, R., Kimble, J., Stewart, B.A. (Eds.), GlobalClimate Change and Cold Ecosystems. Lewis Publishers,Boca Raton, FL, pp. 107–122.
Avery, T.E., Burkhart, H.E., 1994. Forest Measurements,Fourth Edition. McGraw-Hill Series in Forest Resources,Boston, MA.
Baker, W.L., 1995. Long-term response of disturbance land-scapes to human intervention and global change. Land.Ecol. 10, 143–159.
Baker, W.L., Egvert, S.L., Frazier, G.F., 1991. A spatial modelfor studying the effects of climatic change on the structureof landscapes subject to large disturbances. Ecol. Model. 56,109–125.
Bhatti, J.S., Apps, M.J., Jiang, H., 2001. Examining the carbonstocks of boreal forest ecosystems at stand and regionalscales. In: Lai, R., Kimble, J.M., Follett, R.F., Stewart, B.A.(Eds.), Assessment Methods for Soil Carbon. Lewis Publish-ers, Boca Raton, FL, pp. 513–532.
Boychuk, D., Perera, A.H., Ter-Mikaelian, M.T., Martell, D.L.,Li, C., 1997. Modelling the effect of spatial scale andcorrelated fire disturbances on forest age distribution. Ecol.Model. 95, 145–164.
Canadian Council of Forest Ministers, 1997. Compendium ofCanadian Forestry Statistics: National Forestry Database1996. National Forestry Database Program, Natural Re-sources Canada, Ottawa, Ontario, p. 234.
Clark, J.D., 1989. Ecological disturbance as a renewal process:theory and application to fire history. Oikos 56, 17–30.
Clark, J.S., Royall, P.D., 1996. Local and regional sedimentcharcoal evidence for fire regimes in presettlement north-eastern North America. J. Ecol. 84, 365–382.
Cochran, W.G., 1977. Sampling Techniques, Third Edition.Wiley, New York.
Food and Agriculture Organization of the United Nations.1986. Wildland fire management terminology. Forestry
Paper No. 70. Rome, Italy: Food and Agriculture Organiza-tion of the United Nations, p. 257.
Forestry Canada Fire Danger Group, 1992. Development andstructure of the Canadian Forest Fire Behaviour PredictionSystems. Inf. Rep. ST-X-3. Ottawa: Forestry Canada, Sci-ence and Sustainable Development Directorate, p. 63.
Green, D.G., 1981. Time series and postglacial forest ecology.Quat. Res. 15, 265–277.
He, H.S., Mladenoff, D.J., 1999. Dynamics of fire disturbanceand succession on a heterogeneous forest landscape: aspatially explicit and stochastic simulation approach. Ecol-ogy 80, 80–99.
Heinselman, M.L., 1973. Fire in the virgin forest of theBoundary Waters Canoe Area, Minnesota. Quat. Res. 3,329–382.
Heinselman, M.L., 1981. Fire intensity and frequency as factorsin the distribution and structure of northern ecosystems. In:H.A. Mooney, T.M. Bonnicksen, N.L. Christensen, J.E.Lotan, and W.A. Reiners (technical coordinators). Proceed-ings of the Conference on Fire Regimes and EcosystemProterties, December 11–15, 1978, Honolulu, Hawaii. Gen.Tech. Rep. WO-26. Washington, DC: USDA For. Serv. pp.7–57.
Hirsch, K.G., 1996. Canadian Forest Fire Behaviour Prediction(FBP) System: User’s Guide. Special Rep. No. 7. Edmonton,Alberta: Canadian Forest Service. p. 121.
Holling, C.S., Peterson, G., Marples, P., Sendzimir, J., Redford,K., Gunderson, L., Lambert, D., 1996. Self-organization inecosystems: lumpy geometries, periodicities, and morpholo-gies. In: Walker, B.H., Steffen, W.L. (Eds.), Global Changeand Terrestrial Ecosystems. Cambridge University Press,Cambridge, UK, pp. 346–384.
Johnson, E.A., 1992. Fire and Vegetation Dynamics: Studiesfrom the North American Boreal Forest. Cambridge Univer-sity Press, Cambridge, UK.
Johnson, E.A., Gutsell, S.L., 1994. Fire frequency models,methods, and interpretations. Adv. Ecol. Res. 25, 239–287.
Johnson, E.A., Van Wagner, C.E., 1985. The theory and use oftwo fire history models. Can. J. For. Res. 15, 214–220.
Johnson, E.A., Miyanishi, K., O’Brien, N., 1999. Long-termreconstruction of the fire season in the mixedwood borealforest of Western Canada. Can. J. Bot. 77, 1185–1188.
Keane, R.E., Arno, S.F., Brown, J.K., 1989. FIRESUM—anecological process model for fire succession in Westernconifer forests. Interm. Res. St., For. Serv., USDA, Gen.Tech. Rep. INT-266, p. 76.
Keane, R.E., Morgan, P., Running, S.W., 1996. Fire-BGC—amechanistic ecological process model for simulating firesuccession on coniferous forest landscapes of the northernRocky Mountains. USDA For. Serv., Res. Pap. INT-RP-484.
Li, C., 2000a. Reconstruction of natural fire regimes throughecological modelling. Ecol. Model. 134, 129–144.
Li, C., 2000b. Fire regimes and their simulation with referenceto Ontario. In: Perera, A., Euler, D., Thompson, I. (Eds.),Ecology of A Managed Terrestrial Landscape: Patterns andProcesses of Forest Landscapes in Ontario. The Universityof British Columbia Press, British Columbia, pp. 115–140.
C. Li / Ecological Modelling 154 (2002) 103–120120
Li, C., 2000. Modeling the influence of fire ignition sourcepatterns on fire regimes of west-central Alberta. In: Pro-ceedings of the 4th International Conference on IntegratingGIS and Environmental Modeling (GIS/EM4): Problems,Prospects and Research Needs. Banff, Alberta, Canada,September 2–8, 2000. (To be on CD-ROM) Available nowon web: http://www.Colorado.edu/research/cires/banff/up-load/92 [latest access date: July 9, 2001]
MacDonald, G.M., Larsen, C.P.S., Szeicz, J.M., Moser, K.A.,1991. The reconstruction of boreal forest fire history fromlake sediments: a comparison of charcoal, pollen, sedimen-tological, and geochemical indices. Quat. Sci. Rev. 10,53–71.
McCarthy, M.A., Gill, A.M., Bradstock, R.A., 2001. Theoret-ical fire-interval distributions. Intern. J. Wildl. Fire 10,73–77.
Merrill, D.F., Alexander, M.E. (Ed.), 1987. Glossary of ForestFire Management Terms. Fourth Edition. National Re-search Council of Canada, Canadian Committee on ForestFire management, Ottawa, Ontario. Publication NRCCNo. 26516.
Miline, A., 1959. The centric systematic area-sample treated asa random sample. Biometrics 15, 270–297.
Peterson, G.D., 1994. Spatial modelling of fire dynamics in theManitoba boreal forest. University of Florida, Gainsville,FL.M.Sc. thesis.
Prentice, I.C., Sykes, M.T., Cramer, W., 1993. A simulation
model for the transient effects of climate change on forestlandscapes. Ecol. Model. 65, 51–70.
Reed, W.J., Larsen, C.P.S., Johnsoln, E.A., MacDonald,G.M., 1997. Estimation of temporal variations in historicalfire frequency from time-since-fire map data. For. Sci. 44,465–475.
Rykiel, E.J., 1996. Testing ecological models: the meaning ofvalidation. Ecol. Model. 90, 229–244.
SAS Institute Inc., 1989. SAS/STAT* User’s Guide, Version 6,Fourth Edition, Volume 2, Cary, NC: SAS Institute Inc.,p. 846.
Swain, A.M., 1978. Environmental changes during the past2000 years in north-central Wisconsin: analysis of pollen,charcoal and seeds from varved lake sediments. Quat. Res.10, 55–68.
Van Wagner, C.E., 1977. Effects of slope on fire spread rate.Environ. Can. Can. For. Serv. Bi-Monthly Res. Notes 33,7–8.
Van Wagner, C.E., 1978. Age-class distribution and the forestfire cycle. Can. J. For. Res. 8, 220–227.
Van Wagner, C.E., 1987. Development and structure of theCanadian Forest Fire Weather Index System. For. Tech.Rep. No. 35. Ottawa: Canadian Forestry Service, p. 36.
Van Wagner, C.E., 1988. Effect of slope on fires spreadingdownhill. Can. J. For. Res. 18, 818–820.
Weber, M.G., Flannigan, M.D., 1997. Canadian boreal forestecosystem structure and function in a changing climate:impact on fire regimes. Environ. Rev. 5, 145–166.
Weber, M.G., Stocks, B.J., 1998. Forest fires in the borealforests of Canada. In: Moreno, J.S. (Ed.), Large ForestFires. Backbuys Publishers, Leiden, The Netherlands, pp.215–233.
Weir, J.M.H., Johnson, E.A., Miyanishi, K., 2000. Fire fre-quency and the spatial age mosaic of the mixed-woodboreal forest in Western Canada. Ecol. Appl. 10, 1162–1177.