Page 1
60 Ahmad et al.
Int. J. Biosci. 2016
RESEARCH PAPER OPEN ACCESS
Estimation of genetic variation and traits contributing to grain
yield in advance lines of rice (Oryza sativa L.) using agro-
morphological characters
Fayaz Ahmad*, Fida Muhammad Abbasi, Habib Ahmad
Department of Genetics, Hazara University, Mansehra, Pakistan
Key words: Oryza sativa, genetic variation, yield contributing traits.
http://dx.doi.org/10.12692/ijb/8.5.60-74 Article published on May 18, 2016
Abstract
Genetic diversity is fundamentally essential in plant breeding and its assessment in the available genetic stock
provides valued information about its possible utilization in rice breeding program for improvement of yield and
quality. The present study was carried out with the objectives to assess the genetic variation in 56 rice advance
lines and six control varieties i.e.JP-5, Basmati-385, IR-24, Fakhr–e-Malakand, IRBB-59 and Swat-1 on the basis
of 18 economically important quantitative and qualitative agro-morphological traits. The experiment was
conducted under the climatic conditions of Mansehra, Pakistan using a randomized complete block design with
three replications. ANOVA estimated a considerable amount of variation (CV %) ranging from 0.64 for days to
maturity to 19.07 for dry weight of top three leaves, whereas significant differences (p< 0.05) were recorded for
15 evaluated quantitative traits. Cluster analysis separated the genotypes into six distinct groups at Euclidean
distance of 7. The principal component analysis explained 82.206% cumulative variability in quantitative traits
with the formation of five independent components. Among the loadings of patterns of PCA number of tillers
revealed highest contribution to grain yield per plant. The analysis estimated high genetic variations for the
evaluated traits in the advance lines of rice and could serve in future as potential donor parents in breeding for
rice improvement.
* Corresponding Author: Fayaz Ahmad [email protected]
International Journal of Biosciences | IJB |
ISSN: 2220-6655 (Print), 2222-5234 (Online)
http://www.innspub.net
Vol. 8, No. 5, p. 60-74, 2016
Page 2
61 Ahmad et al.
Int. J. Biosci. 2016
Introduction
Rice (Oryza sativa L.) is a staple food for more
than half of the global population (Chakravarthi
and Naravaneni, 2006). The diversity in rice crop
varieties is essential for increasing food
production, poverty alleviation and promoting
economic growth. Studies of genetic divergence
among the plant materials facilitate rice breeders
to efficiently select diverse parents for objective
use in breeding program (Kwon et al. 2002). The
diverse nature of Oryza sativa is distinguished by
its adaptation to different agro climatic
conditions, growth habit, height, shapes, size,
color of the culms, leaf, panicle and grain
characters (Takahashi, 1984). Use of agro-
morphological traits is the most common
approach utilized to estimate relationships
between genotypes (Bajracharya et al. 2006). This
characterization was employed to assess diversity
in rice populations (Ilhamuddin et al.1988, Caldo
et al 1996, Ashfaq et al. 2012).
The grain yield is a complex trait and quantitative
in nature being influenced by various factors.
Selection for yield per se may not be much
satisfying unless other yield component traits are
taken into consideration (Satheesh and
Saravanan, 2012). Estimation of variation in
morphological traits play important role in the
production of promising cultivars for increased
rice production (Yang et al., 2007; Yang and Hwa,
2008).
The phonological properties of rice are associated
with the yield potential of rice varieties. The cultivars
those start flowering earlier score higher filled grain
percentages exhibiting higher sink efficiency than the
panicles start flowering late in the season, there by
reduces dry matter accumulation in grains
(Mohapatra et al., 1993).
Similarly, the plant leaves being the organ of
photosynthesis are considered to be the important
determinant and characterized for higher
photosynthetic capacities (Asana, 1968). Grain filling
is sustained by photosynthesis of the upper parts of
the plant (Tambussi et al., 2007). The top th4ree
leaves play important roles in biomass production
and grain yield of rice (Oryza sativa L.) crop since the
three leaves not only assimilate majority of carbon for
grain filling during ripening phase, but also provide
large proportion of remobilized-nitrogen for grain
development (Zhang, 2003). The top three leaves
contribute most to grain yield (Yoshida, 1981). The
top three leaves of rice plants contribute most to grain
yield because the top three leaves (a) have the largest
leaf area; (b) have the longest life span; and (c) their
functional period coincides with panicle development
and grain filling (Ray et al., 1983). Li et al., (1998)
reported that at least 50% of photosynthetic products
for grain are provided by flag leaf, the most important
organ for photosynthesis.
The Plant height is another main determining factor
of plant architecture which directly affects the final
grain yield. Hitaka (1969) reported that plant height,
a major factor in lodging resistance in rice. Lodging is
one of the major factors limiting the yield potential of
rice cultivars. Many studies have shown that the culm
characteristics contributing to lodging resistance
include basal internode length and thickness, plant
height, culm wall thickness, and leaf sheath wrapping
and thickness (Matsuda et al., 1983). Lodging
resistance is positively correlated with the culm
diameter and wall thickness of the basal internodes
(Li et al., 2000). Wu et al., (2011) have shown that
large culm rice varieties have a higher number of
grains per panicle and a longer spike length. Other
than the plant height number of tillers per plant,
number of grains per panicle and grain weight has
direct influence on grain yield per plant of rice
(Selvaraj et al., 2011; Babu et al., 2012).
Understanding correlation between yield and yield
components are basic and fore most effort to find out
strategies for plant selection (Hasan et al., 2013).
Habib et al., (2005) reported that extent and
significance of association of yield with yield
components should be considered, while determining
the selection criteria of germplasm on the basis of
Page 3
62 Ahmad et al.
Int. J. Biosci. 2016
available genetic variations. Bagheri et al. (2011)
reported that there was significant linear relationship
between yield and panicle length and the number of
panicle per plan and the number of filled grain per
panicle in rice (Oryza sativa L.) genotypes. Positive
phenotypic and genotypic correlation coefficient
between grain yield and number of filled grains per
panicle, panicle length and number of grains per
panicle was recorded in rice (Hairmansis et al., 2010,
Idris, 2012:). Azarpour (2013) reported that grain
yield in rice had significant and positive correlation
with panicle weight and biological yield. Moosavi et
al., (2015) reported the highest correlation between
grain yield per plant and number of panicles. The
study of path analysis for yield related traits revealed
that number of productive tillers per plant, number of
spikelets per panicle, number of grains per panicle
and days to maturity had positive direct effect on
grain yield per plant (Imad et al., 2014).
The genetic variations and agronomic characters
are useful in breeding of rice. The aim of the
present study was to estimate the genetic
variation and traits that contribute to grain yield
in advance line of rice based on qualitative and
quantitative agro-morphological characters.
Materials and methods
Plant material
This study was conducted at National Tea and High
Value Crops Research Institute (NTHRI) Shinkiari,
Mansehra-Pakistan (latitude 34°20' & 34° 30' N and
longitude 73° 05' & 73° 20)' at an altitude of 1000 m
from sea level) during 2011. Fifty six rice advance
lines (Line-3, Line-4, Line-11, Line-12, Line-15, Line-
16, Line-19, Line-20, Line-21, Line-22, Line-25, Line-
28, Line-29, Line-31, Line-37, Line-46,, Line-48,
Line-49, Line-50,, Line-53, Line-55, Line-57, Line-
60, Line-64, Line-73, Line-74, Line-78, Line-80,
Line-95, Line-99, Line-106, Line-128, Line-129, Line-
130, Line-134, Line-140, Line-146, Line-151, Line-152,
Line-168, Line-180, Line-181, Line-182, Line-404, ,
NPT-1, NPT-22, NPT-54, NPT-86, NPT-146, NPT-
156, NPT-160, NPT-174, LB-2, LB-3, LB-4, M-2)
developed by Department of Genetics, Hazara
University, Mansehra-Pakistan having different
crossing backgrounders along with six control
cultivars (JP-5, Basmati-385, IR-24, Fakhr-e-
Malakand, IRBB-59, Swat-1) were evaluated to
estimate the genetic variation and yield contributing
traits.
Raising nurseries
Before sowing, seeds of all the rice genotypes were
treated with fungicide (2 g Benlate/kg). Nursery beds
were thoroughly prepared and seeds of each genotype
were sown separately in different blocks.
Recommended rice nursery management practices
were carried out till transplantation of genotypes in
the field.
Soil analysis
Soil was analyzed at Soil & Environmental. Science
Department, Agricultural University Peshawar-
Pakistan and Physico-chemical characteristics of the
soil are reported in Table 1.
Meteorological data
The mean minimum and maximum temperature
during the experiment period (April-October) was
15.31°C and 31.00 °C respectively while the average
relative humidity was 62.42% and 787.00 mm rainfall
was received during the crop period (NTHRI, 2011).
Field layout
Four weeks old seedlings were transplanted (two
plants/hill) in the experimental field according to
Randomized Complete Block Design with three
replicates. Each replicate consisted of two lines and
each line consisted of twenty plants with 15 cm X 20
cm spacing.
Crop management
The recommended agronomical practices and plant
protection measures were awarded uniformly to each
genotype to obtain normal plants growth.
Recording data
The genotypes were characterized at various growth
stages for estimation of diversity according to
Page 4
63 Ahmad et al.
Int. J. Biosci. 2016
descriptors established by the International Rice
Research Institute (IRRI, 1996). The quantitative
descriptors were days to flowering, days to maturity,
Plant height, leaf length, leaf width, flag leaf length,
flag leaf width, fresh weight of top three leaves, dry
weight of top three leaves, culm basal internode
diameter, number of productive tillers per plant,
panicle length. number of primary branches per
panicle, number of secondary branches per panicle,
number of grains per panicle spikelet fertility,1000
grains weight and grains yield per plant, While the
qualitative descriptors were lodging resistance,
panicle shattering and panicle threshability.
Statistical analysis
Data were analyzed by two-way analysis of variance
(ANOVA) and was subsequently followed by LSD test
using software Statistix 8.1. Custer analysis and
principal Component analysis was also performed by
using SPSS.V16 to determine genetic variability for
agro-morphological traits in rice genotypes
Results and discussion
The recorded and analyzed data for rice genotypes
showed considerable variations for various important
agro-morphological Characters.
Table 1. Soil analysis of experimental field.
Depth Cm pH
EC
Textural Class AB-DTPA extractable (ug/g soil) Lime (%) Total Mineral N
mg N/g soil
Organic Matter (%)
P K Zn Cu Fe Mn
0-15 6.70 0.11 Loam 3.67 64 1.21 4.34 10.18 6.86 0.73 61.25 1.69
16-30 6.72 0.09 Loam* 1.50 57 0.96 3.80 8.36 2.98 2.78 40.25 1.10
31-45 7.02 0.10 Loam* 1.62 59 1.17 3.87 7.98 2.76 2.85 12.25 0.97
*Close to Sandy Loam.
Flowering and maturation cycle are the most efficient
traits in the characterization and classification of
genotypes. Rice advance lines evaluated in the current
study showed significant variations (p> 0.05) for days
to flowering and maturity. Days to flowering ranged
from 88.00 (Line-16) to 123 days (JP-5) with grand
mean of 104.08 days and 0.79 % coefficient of
variation. Crop maturation cycle also showed
significant variations among the rice genotypes. JP-5
took maximum days (164.33) to reach grain maturity
and was followed by Fakhr-e-Malakand (161.33 days),
Line-64 (157.67 days), Line-130 (157.33 days), Swat-1
(156.67 days), Line-48 (154.67 days), IR-24 (154.67
days) and M-2 (153.67 days). Among the early
maturing genotypes, Line-49 took minimum days to
maturity (125.67) and was followed by Line-134
(126.67 days), Line-29 (130.33 days), Line-16 (130.67
days), Line-20 (131.33 days), Line-28 (133.00 days)
and Line-19 (134.67 days) period to reach crop
maturity stage (Table 2). Early or late maturing
potential is a genetically controlled character
influenced by weather conditions. The significant
difference in the flowering and grain maturation
periods among the different evaluated rice genotypes
reflects their genetic diversity. The mean values
(Table 3 and 4) show that the early maturing
genotypes have high proportion of filled grains than
late maturing accessions. The early maturity give rise
to enhanced sink efficiency while the late flowering
diminishes the accumulation of dry matter content
involved in the filling of the grains (Mohapatra et al.,
1993). Ashfaq et al., (2012) also reported significant
genetic variability among rice genotypes for days to
heading and days to maturity.
Significant variations were recorded in culm traits i.e.
plant height, number of productive tillers per plant,
basal culm diameter and lodging resistance. Plant
height ranged from 87.93 cm (IR-24) to 160.77 cm
(Line-129). The other tallest advance lines were Line-
48 (155.53 cm), Line-130 (146.06 cm), Line-64
(145.53 cm) Line-99 (143.78 cm) and Line-60 (141.51
cm). The dwarf rice genotypes were IR-24, IRBB-59,
M-2, NPT-146, Line-34 and Line-16 with production
of 87.93, 89.29, 93.07, 95.59, 97.83 and 101.82 cm
tall plants respectively (Table 2). Plant height is the
main determining factor of plant architecture which
directly affects the productivity.
Page 5
64 Ahmad et al.
Int. J. Biosci. 2016
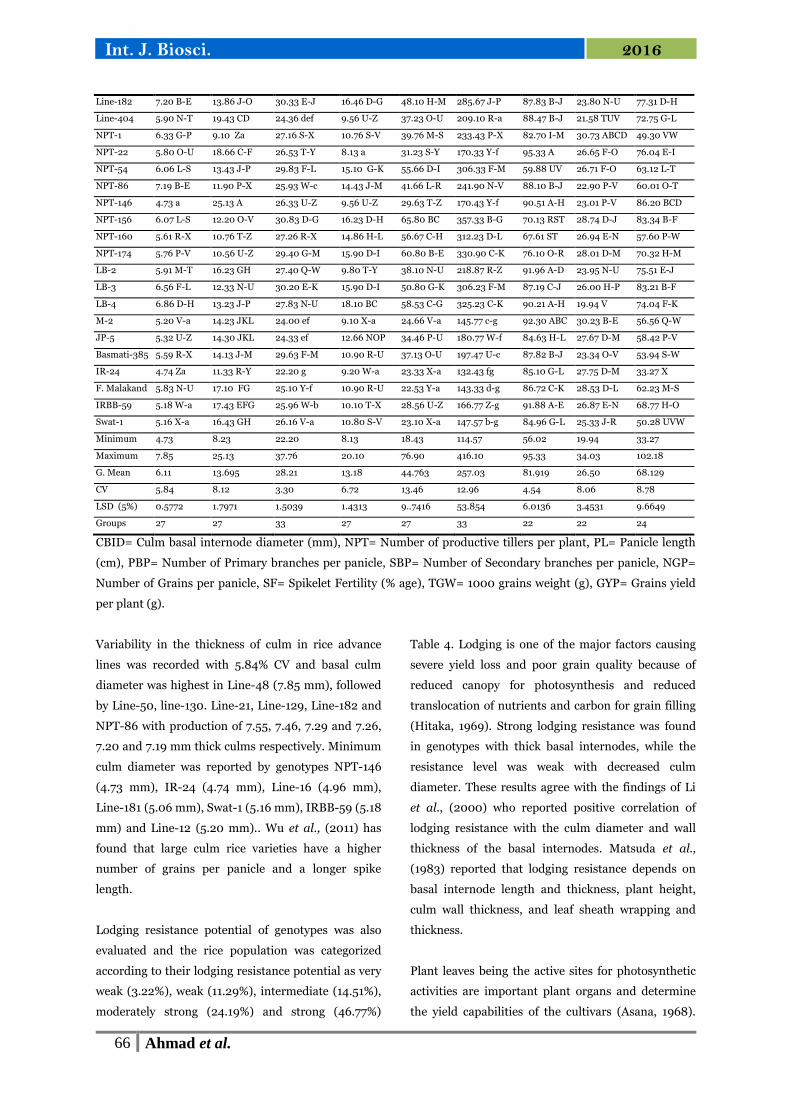
Table 2. Estimates of genetic variation in quantitative agro-morphological traits in rice advance lines.
Genotypes DF DM PH LL LW FLL FLW FWTTL DWTTL
Line-3 97.33 X 144.33 RST 111.20 T-W 34.45 S-W 1.45 LMN 32.76 F-P 1.81 L-Q 2.69 J-S 0.82 H-S
Line-4 102.67 PQR 145.00 QRS 104.78 a-d 34.84 S-W 1.63 D-I 32.11 G-R 1.93 E-M 3.59 A-H 1.07 A-H
Line-11 95.67 Y 141.33 VW 105.02 Z-d 28.37 XY 1.05 VWX 23.80 WXY 1.23 fg 2.60 L-T 0.91 E-O
Line-12 102.33 QR 137.67 X 109.93 U-X 45.99 DEF 1.52 I-M 33.96 E-N 1.71 P-V 1.81 U-X 0.61 P-W
Line-15 109.33 EF 151.33 FGH 113.45 STU 43.52 F-J 1.25 Q-T 36.11 B-H 1.58 V-Y 3.10 E-N 0.95 B-M
Line-16 88.00 b 130.67 a 101.82 d 35.56 R-V 1.16 R-W 29.23 P-U 1.44 Y-d 1.83 U-X 0.57 S-W
Line-19 98.00 WX 134.67 Y 106.75 X-b 31.65 WX 0.91 X 22.74 XY 1.19 g 2.69 J-S 0.85 H-R
Line-20 95.00 Y 131.33 a 134.86 HI 34.20 S-W 1.59 F-L 26.35 T-X 1.80 M-Q 2.91 H-P 0.85 H-R
Line-21 105.67 JK 147.00 MNO 136.34 GH 52.17 ABC 1.68 C-H 34.10 E-M 2.00 C-H 3.49 A-I 1.15 A-F
Line-22 102.33 QR 145.67 O-R 108.05 W-a 36.94 P-T 1.46 K-N 36.82 B-F 1.86 H-O 3.48 A-I 1.02 B-J
Line-25 104.33 LMN 146.33 N-Q 111.29 T-W 46.03 DEF 1.77 A-D 36.07 B-H 2.13 BC 3.77 A-G 1.07 A-H
Line-28 92.00 Z 133.00 Z 116.90 QRS 49.36 CDE 1.34 N-Q 46.05 A 1.84 J-P 3.23 A-M 0.93 C-O
Line-29 95.33 Y 130.33 b 108.12 W-a 35.30 R-W 1.23 Q-U 29.97 M-T 1.46 X-c 1.65 VWX 0.54 T-W
Line-31 107.00 I 145.33 P-S 108.93 WXY 45.56 F 1.12 T-W 34.70 C-K 1.48 X-c 2.20 P-W 0.72 K-V
Line-37 108.67 FG 152.67 EF 126.22 KL 43.97 F-I 1.91 A 28.03 R-W 2.07 B-E 2.73 I-S 0.81 H-T
Line-46 107.67 GHI 149.00 JKL 124.71 LMN 51.04 BC 1.47 J-N 38.58 BCD 1.77 N-S 3.02 G-N 1.03 A-J
Line-48 117.33 B 154.67 D 155.53 B 55.72 A 1.51 I-M 34.52 C-K 1.73 O-U 3.95 A 1.196 ABC
Line-49 90.00 a 125.67 b 119.22 OPQ 44.71 FGH 1.11 T-W 35.70 B-J 1.41 Z-d 1.89 T-X 0.66 O-W
Line-50 102.67 PQR 140.67 W 138.94 EFG 40.04 J-P 1.11 T-W 28.35 Q-V 1.32 d-g 2.56 M-U 0.88 F-P
Line-53 102.33 QR 133.67 YZ 124.94 KLM 38.77 M-R 1.14 S-W 31.08 K-S 1.35 c-f 2.37 N-V 0.70 L-V
Line-55 99.67 UV 143.00 TU 117.45 PQR 32.33 UVW 1.14 S-W 26.43 T-X 1.38 a-e 1.87 T-X 0.64 P-W
Line-57 101.00 ST 144.33 RST 103.67 bcd 35.91 R-V 1.33 N-Q 28.81 P-V 1.47 X-c 2.22 O-W 0.683 N-V
Line-60 100.33 TU 145.00 QRS 141.51 DE 45.95 DEF 1.15 R-W 38.89 BC 1.52 W-a 2.63 K-T 0.83 H-S
Line-64 110.00 DE 157.67 C 145.53 C 43.46 F-K 1.41 M-P 33.68 E-O 1.60 U-X 3.08 F-N 1.04 A-I
Line-73 105.67 JK 140.67 W 134.934 HI 50.45 BC 1.54 G-M 32.70 F-Q 2.15 AB 3.11 E-N 1.07 A-H
Line-74 101.67 RS 148.33 KLM 109.29 V-Y 32.19 VW 1.41 M-P 31.64 I-R 1.64 R-W 3.33 A-L 1.01 B-J
Line-78 104.00 L-O 147.33 MN 106.62 X-b 35.16 R-W 1.61 E-K 38.52 BCD 1.98 D-I 3.23 A-M 0.98 B-K
Line-80 103.67 M-P 147.33 MN 105.92 Y-c 36.44 P-T 1.67 C-H 37.01 B-F 2.00 C-H 3.95 A 1.19 A-D
Line-95 104.67 KLM 148.33 KLM 103.71 bcd 34.82 S-W 1.61 E-K 36.35 B-G 1.98 D-I 2.79 I-R 0.79 I-U
Line-99 107.67 GHI 142.33 UV 143.78 CD 50.75 BC 1.11 T-W 31.61 I-R 1.78 N-R 2.69 J-S 0.86 G-Q
Line-106 108.33 FGH 150.67 GHI 121.51 MNO 53.17 AB 1.54 G-M 36.87 B-F 1.97 D-J 3.18 C-M 1.02 B-J
Line-128 103.00 OPQ 149.33 IJK 126.88 KL 44.09 F-I 1.33 N-Q 29.27 P-U 1.62 T-W 2.81 I-R 0.92 D-O
Line-129 101.00 ST 150.00 HIJ 160.77 A 50.90 BC 1.34 N-Q 38.74 BCD 1.62 T-W 2.97 H-O 1.04 A-I
Line-130 111.00 D 157.33 C 146.06 C 49.62 BCD 1.45 LMN 44.67 A 1.82 K-P 3.83 A-F 1.30 A
Line-134 90.33 a 126.67 b 97.83 e 32.45 UVW 1.10 UVW 24.70 V-Y 1.26 efg 1.49 WX 0.54 T-W
Line-140 104.67 KLM 151.33 FGH 137.43 FGH 39.69 L-Q 1.34 N-Q 31.77 H-R 1.51 W-b 3.39 A-K 1.08 A-H
Line-146 101.67 RS 145.33 P-S 109.45 V-Y 36.03 Q-U 1.613 E-J 34.36 D-L 1.92 F-M 3.28 A-M 0.93 C-O
Line-151 103.00 OPQ 144.67 RS 108.40 W-a 33.64 T-W 1.63 D-I 33.81 E-N 1.89 G-N 3.93 ABC 1.20 6 AB
Line-152 104.67 KLM 144.67 RS 108.05 W-a 36.61 P-T 1.71 B-F 35.82 B-J 2.04 B-F 3.16 D-M 0.92 D-O
Line-168 103.33 N-Q 147.33 MN 123.40 LMN 46.05 DEF 1.35 N-Q 32.69 F-Q 1.67 Q-V 3.04 G-N 0.97 B-L
Line-180 92.67 Z 131.00 a 118.03 OPQ 26.85 Y 1.28 P-S 20.81 Y 1.52 W-Z 1.39 X 0.40 W
Line-181 99.00 VW 136.33 X 107.39 X-b 37.29 O-T 1.45 LMN 32.03 G-R 1.45 Y-d 2.13 R-X 0.71 K-V
Line-182 108.33 FGH 144.00 ST 136.02 GH 50.05 BC 1.83 AB 26.92 S-X 2.29 A 3.27 A-M 1.05 A-I
Line-404 98.33 WX 140.67 W 102.29 cd 40.72 I-O 1.43 MNO 24.93 U-Y 1.75 N-T 1.52 WX 0.49 VW
NPT-1 111.00 D 153.33 DE 113.85 RST 45.30 FG 1.22 Q-U 38.90 BC 1.58 V-Y 3.74 A-G 1.12 A-G
NPT-22 100.67 STU 145.00 QRS 141.27 DE 37.47 N-S 1.42 M-P 29.37 O-T 1.73 O-U 2.24 O-W 0.77 J-U
NPT-54 105.00 KL 142.33 UV 109.17 V-Y 34.64 S-W 1.60 E-L 35.95 B-I 1.85 I-O 3.43 A-J 0.98 B-K
NPT-86 105.00 KL 144.33 RST 138.21 E-H 42.56 F-L 1.52 I-M 27.05 S-X 1.78 N-R 2.90 H-Q 0.86 G-Q
NPT-146 108.33 FGH 146.33 N-Q 95.59 ef 34.14 S-W 1.30 O-R 28.26 R-V 1.53 W-Z 1.58 WX 0.53 UVW
NPT-156 107.33 HI 147.67 LMN 112.76 TUV 39.78 K-P 1.74 B-E 34.43 D-K 1.94 E-L 3.86 A-E 1.16 A-E
NPT-160 109.00 EF 151.33 FGH 106.69 X-b 35.00 S-W 1.55 G-M 34.60 1.88 G-N 3.89 A-D 1.13 A-G
NPT-174 104.33 LMN 150.67 GHI 108.94 WXY 36.01 Q-U 1.69 B-G 35.79 B-J 2.05 B-F 3.34 A-L 0.95 B-M
LB-2 95.33 Y 137.33 X 121.07 NOP 45.72 EF 1.53 H-M 37.91 B-E 1.85 I-P 2.24 O-W 0.73 K-V
LB-3 104.67 KLM 141.00 VW 135.27 GHI 44.12 F-I 1.60 E-L 29.64 N-T 1.95 E-K 3.37 A-K 1.02 B-J
LB-4 112.33 C 151.33 FGH 131.97 IJ 50.76 BC 1.64 D-I 31.52 J-R 2.01 C-G 3.78 A-G 1.20 ABC
M-2 110.00 DE 153.67 DE 93.07 fg 42.33 F-M 1.80 ABC 32.74 F-P 2.11 BCD 3.49 A-I 1.02 B-J
JP-5 123.00 A 164.33 A 140.17 DEF 50.08 BC 1.11 T-W 39.53 B 1.37 b-e 3.18 B-M 1.04 A-I
Basmati-385 108.67 FG 151.67 FG 136.07 GH 43.68 F-J 1.03 WX 36.21 B-G 1.32 d-g 2.14 Q-X 0.686 M-V
IR-24 116.67 B 154.67 D 87.93 h 41.14 H-N 1.42 M-P 30.00 L-T 1.63 S-W 1.92 T-X 0.60 Q-W
F. Malakand 117.33 B 161.33 B 108.70 W-Z 41.74 G-M 1.23 Q-U 30.33 K-T 1.41 Z-d 2.08 R-X 0.72 K-V
IRBB-59 106.67 IJ 146.67 NOP 89.30 gh 41.20 H-M 1.13 S-W 33.81 E-N 1.42 Z-d 2.00 S-X 0.69 M-V
Swat-1 116.33 B 156.67 C 128.60 JK 44.01 F-I 1.18 R-V 30.61 K-T 1.43 Z-d 1.81 U-X 0.58 R-W
Minimum 88.00 125.67 87.93 26.85 0.91 20.81 1.19 1.39 0.40
Maximum 123.00 164.33 160.77 55.72 1.91 46.05 2.29 3.95 1.30
G. Mean 104.08 145.22 119.06 41.171 1.41 32.756 1.70 2.8237 0.88
CV 0.79 0.64 1.96 5.59 6.43 8.27 5.18 16.75 19.07
LSD (5%) 1.3280 1.4927 3.7782 3.7201 0.1469 4.3777 0.1431 0.7646 0.2732
Croups 28 28 34 25 24 25 33 24 23
DF= Days to Flowering, DM= Days to Maturity, PH= Plant Height (cm), LL= Leaf length (cm), LW = Leaf width (cm),, FLL=Flag leaf length
(cm), FLW= Flag leaf width (cm), FWTTL= Fresh weight of top three leaves (g), DWTTL= Dry weight of top three leaves (g).
Page 6
65 Ahmad et al.
Int. J. Biosci. 2016
Tillers production capability of a genotype is one of
the high yielding attribute in rice. Maximum count for
productive tillers per plant was given by NPT-146
(25.13), Line-53 (23.20), Line-28 (23.13), Line-134
(19.53), Line-404 (19.43), Line-31 (19.10) and NPT-22
(18.66), while Line-20, NPT-1, Line-78 and Line-48
produced the least number of productive tillers per
plant in the order of 8.23, 9.10, 9.30 and 9.76
respectively. Selvaraj et al., (2011) and Babu et al.,
(2012) attributed the final yield in rice largely to the
number of tillers per plant. Imad et al., (2014) also
reported that that number of productive tillers per
plant had a positive direct effect on grain yield per
plant.
Table 3. Estimates of genetic variation in quantitative agro-morphological traits in rice advance lines.
Genotypes CBID NPT PL PBP SBP NGP SF TGW GYP
Line-3 6.24J-Q 14.10 J-N 27.83 N-U 13.70 K-N 46.63 I-O 238.10 O-W 85.79 F-K 26.72 F-O 74.16 F-K
Line-4 6.10 K-R 9.90 YZa 30.76 D-H 15.10 G-K 59.70 B-G 359.13 B-F 68.58 ST 29.90 B-G 69.73 H-N
Line-11 5.79 O-U 13.10 L-R 26.36 T-Z 8.20 Za 21.43 Za 137.23 efg 80.44 L-O 26.55 G-O 36.07 X
Line-12 5.20 V-a 14.90 HIJ 24.60 b-f 10.13 T-X 33.33 Q-V 186.67 W-e 83.48 I-L 21.83 S-V 48.23 W
Line-15 6.35 G-O 12.90 K-R 27.76 O-U 12.43 N-Q 47.20 H-N 254.43 M-S 85.37 F-L 27.01 E-N 70.82 H-M
Line-16 4.96 YZa 17.70 D-G 24.90 Z-f 8.56 YZa 20.56 Za 129.77 fg 91.89 A-E 28.53 D-L 55.97 R-W
Line-19 6.41 G-N 11.43 Q-Y 27.66 P-V 12.66 NOP 52.46 E-J 314.77 C-L 88.11 B-J 20.89 UV 62.69 M-T
Line-20 7.11 B-F 8.23 a 28.30 M-S 14.76 I-L 50.90 F-L 294.30 H-N 81.02 K-O 33.91 A 63.33 L-S
Line-21 7.29 A-D 14.33 IJK 31.36 DE 16.56 DEF 51.43 E-K 308.77 F-L 84.98 G-L 25.22 K-S 90.89 B
Line-22 5.90 N-T 13.23 J-P 29.16 I-P 15.33 F-J 55.10 D-I 304.33 G-M 60.57 UV 26.71 F-O 60.08 N-T
Line-25 5.94 M-T 13.00 K-R 29.30 H-N 16.23 D-H 60.66 B-E 367.67 ABC 68.12 ST 26.85 E-N 81.70 B-G
Line-28 5.75 Q-W 23.13 B 27.86 N-T 9.86 T-Y 38.43 M-T 226.33 Q-X 90.43 A-H 22.51 Q-V 102.18 A
Line-29 5.50 S-Y 14.10 J-N 24.76 a-f 9.43 V-a 33.20 Q-W 187.57 W-e 85.89 E-L 25.59 I-Q 53.57 T-W
Line-31 5.60 R-X 19.10 CDE 28.33 L-S 10.80 S-V 32.76 Q-X 204.80 S-a 90.44 A-H 22.92 P-V 77.18 D-H
Line-37 6.71 D-J 12.86 K-S 25.10 Y-f 13.56 L-O 42.23 K-Q 250.13 N-U 80.66 L-O 34.03 A 86.14 BCD
Line-46 6.90 C-G 10.20 XYZ 36.43 A 17.23 CD 68.76 AB 393.77 AB 82.51 J-N 28.67 D-K 91.16 B
Line-48 7.85 A 9.76 YZa 31.50 DE 20.10 A 63.23 BCD 364.57 A-E 84.72 G-L 29.23 C-H 83.84 B-E
Line-49 5.80 O-U 13.33 J-P 25.23 Y-f 10.90 R-U 33.90 P-V 193.90 V-d 88.59 B-I 28.98 D-I 62.54 M-T
Line-50 7.55 AB 16.10 GHI 25.86 X-d 15.23 F-J 56.53 C-H 311.23 E-L 88.63 B-I 20.64 UV 86.34 BCD
Line-53 5.75 Q-W 23.20 B 25.50 Y-e 9.10 Y-a 18.43 a 114.57 g 93.67 AB 30.03 B-F 77.02 D-H
Line-55 5.94 M-T 16.10 GHI 25.20 Y-f 10.46 S-X 34.46 P-U 209.33 R-a 88.26 B-J 27.77 D-M 76.45 E-H
Line-57 5.96 M-T 12.76 K-S 23.73 f 14.80 I-L 38.43 M-T 223.87 R-Y 56.02 V 25.14 L-S 36.41 X
Line-60 5.47 T-Y 12.23 O-V 29.20 I-O 10.56 S-W 23.56 W-a 160.23 a-g 80.57 L-O 27.21 E-N 35.45 X
Line-64 7.26 BCD 11.10 S-Y 34.40 B 11.76 P-S 48.10 H-M 261.10 L-R 90.41 A-H 33.05 AB 81.87 B-G
Line-73 6.83 D-I 13.13 J-Q 28.86 J-Q 15.33 F-J 56.23 C-I 338.53 C-J 90.71 A-G 21.42 TUV 82.30 B-G
Line-74 6.40 G-N 10.23 XYZ 30.16 E-K 15.13 G-J 58.56 C-G 331.33 C-K 67.90 ST 27.43 D-M 57.14 P-W
Line-78 5.84 N-U 9.30 Za 31.03 DEF 15.86 D-I 60.33 B-G 344.67 B-H 70.83 Q-T 28.81 D-I 59.91 O-U
Line-80 6.16 J-R 12.43 M-T 31.60 DE 16.86 CDE 62.76 BCD 393.67 AB 65.53 TU 26.16 H-P 78.08 D-H
Line-95 5.82 O-U 10.36 W-Z 30.13 E-K 15.90 D-I 60.56 B-F 342.47 B-I 65.51 TU 29.17 C-H 63.21 L-T
Line-99 6.67 E-K 12.13 O-W 29.83 F-L 15.76 E-J 35.10 P-U 214.20 R-Z 91.36 A-F 23.83 N-U 58.55 P-V
Line-106 5.98 M-T 13.46 J-P 29.50 G-M 16.56 DEF 51.43 E-K 311.23 E-L 85.36 F-L 20.81 UV 76.09 E-H
Line-128 6.29 H-Q 10.46 V-Z 28.76 K-R 14.86 H-L 59.76 B-G 324.80 C-K 76.04 O-R 32.48 ABC 77.98 D-H
Line-129 7.25 BCD 12.53 L-T 31.96 CD 12.23 O-R 34.66 P-U 200.43 T-b 86.12 D-L 25.86 H-Q 54.32 R-W
Line-130 7.46 ABC 10.20 XYZ 37.76 A 19.20 AB 76.90 A 416.10 A 77.16 M-P 28.38 D-L 88.90 BC
Line-134 5.41 T-Y 19.53 C 24.86 Z-f 9.90 T-Y 28.86 T-Z 170.57 Y-f 83.64 I-L 22.03 R-V 58.48 P-V
Line-140 6.63 E-L 12.33 N-U 33.26 BC 13.13 M-P 48.10 H-M 277.77 K-Q 83.01 I-M 28.43 D-L 80.87 C-G
Line-146 5.84 N-U 10.13 XYZ 30.56 D-I 15.63 E-J 64.23 BCD 365.10 A-D 75.50 O-R 28.56 D-L 75.53 E-J
Line-151 6.16 J-R 11.33 R-Y 30.16 E-K 15.76 E-J 68.43 AB 364.23 A-E 68.96 ST 27.89 D-M 74.36 E-K
Line-152 6.26 I-Q 12.10 O-W 29.70 F-M 14.56 I-L 56.66 C-H 290.47 I-O 72.16 P-S 27.46 D-M 66.38 I-P
Line-168 6.48 G-M 11.33 R-Y 28.23 M-S 13.56 L-O 43.10 J-P 252.87 M-T 76.67 N-Q 30.49 A-D 63.88 L-R
Line-180 6.11 K-R 12.13 O-W 24.43 c-f 11.10 Q-T 38.20 N-U 228.13 Q-X 87.42 C-J 29.26 C-H 66.15 J-Q
Line-181 5.06 X-a 17.23 FG 26.53 T-Y 9.90 T-Y 32.10 R-Y 190.43 V-e 86.32 C-L 24.82 M-T 65.80 K-Q
Page 7
66 Ahmad et al.
Int. J. Biosci. 2016
Line-182 7.20 B-E 13.86 J-O 30.33 E-J 16.46 D-G 48.10 H-M 285.67 J-P 87.83 B-J 23.80 N-U 77.31 D-H
Line-404 5.90 N-T 19.43 CD 24.36 def 9.56 U-Z 37.23 O-U 209.10 R-a 88.47 B-J 21.58 TUV 72.75 G-L
NPT-1 6.33 G-P 9.10 Za 27.16 S-X 10.76 S-V 39.76 M-S 233.43 P-X 82.70 I-M 30.73 ABCD 49.30 VW
NPT-22 5.80 O-U 18.66 C-F 26.53 T-Y 8.13 a 31.23 S-Y 170.33 Y-f 95.33 A 26.65 F-O 76.04 E-I
NPT-54 6.06 L-S 13.43 J-P 29.83 F-L 15.10 G-K 55.66 D-I 306.33 F-M 59.88 UV 26.71 F-O 63.12 L-T
NPT-86 7.19 B-E 11.90 P-X 25.93 W-c 14.43 J-M 41.66 L-R 241.90 N-V 88.10 B-J 22.90 P-V 60.01 O-T
NPT-146 4.73 a 25.13 A 26.33 U-Z 9.56 U-Z 29.63 T-Z 170.43 Y-f 90.51 A-H 23.01 P-V 86.20 BCD
NPT-156 6.07 L-S 12.20 O-V 30.83 D-G 16.23 D-H 65.80 BC 357.33 B-G 70.13 RST 28.74 D-J 83.34 B-F
NPT-160 5.61 R-X 10.76 T-Z 27.26 R-X 14.86 H-L 56.67 C-H 312.23 D-L 67.61 ST 26.94 E-N 57.60 P-W
NPT-174 5.76 P-V 10.56 U-Z 29.40 G-M 15.90 D-I 60.80 B-E 330.90 C-K 76.10 O-R 28.01 D-M 70.32 H-M
LB-2 5.91 M-T 16.23 GH 27.40 Q-W 9.80 T-Y 38.10 N-U 218.87 R-Z 91.96 A-D 23.95 N-U 75.51 E-J
LB-3 6.56 F-L 12.33 N-U 30.20 E-K 15.90 D-I 50.80 G-K 306.23 F-M 87.19 C-J 26.00 H-P 83.21 B-F
LB-4 6.86 D-H 13.23 J-P 27.83 N-U 18.10 BC 58.53 C-G 325.23 C-K 90.21 A-H 19.94 V 74.04 F-K
M-2 5.20 V-a 14.23 JKL 24.00 ef 9.10 X-a 24.66 V-a 145.77 c-g 92.30 ABC 30.23 B-E 56.56 Q-W
JP-5 5.32 U-Z 14.30 JKL 24.33 ef 12.66 NOP 34.46 P-U 180.77 W-f 84.63 H-L 27.67 D-M 58.42 P-V
Basmati-385 5.59 R-X 14.13 J-M 29.63 F-M 10.90 R-U 37.13 O-U 197.47 U-c 87.82 B-J 23.34 O-V 53.94 S-W
IR-24 4.74 Za 11.33 R-Y 22.20 g 9.20 W-a 23.33 X-a 132.43 fg 85.10 G-L 27.75 D-M 33.27 X
F. Malakand 5.83 N-U 17.10 FG 25.10 Y-f 10.90 R-U 22.53 Y-a 143.33 d-g 86.72 C-K 28.53 D-L 62.23 M-S
IRBB-59 5.18 W-a 17.43 EFG 25.96 W-b 10.10 T-X 28.56 U-Z 166.77 Z-g 91.88 A-E 26.87 E-N 68.77 H-O
Swat-1 5.16 X-a 16.43 GH 26.16 V-a 10.80 S-V 23.10 X-a 147.57 b-g 84.96 G-L 25.33 J-R 50.28 UVW
Minimum 4.73 8.23 22.20 8.13 18.43 114.57 56.02 19.94 33.27
Maximum 7.85 25.13 37.76 20.10 76.90 416.10 95.33 34.03 102.18
G. Mean 6.11 13.695 28.21 13.18 44.763 257.03 81.919 26.50 68.129
CV 5.84 8.12 3.30 6.72 13.46 12.96 4.54 8.06 8.78
LSD (5%) 0.5772 1.7971 1.5039 1.4313 9..7416 53.854 6.0136 3.4531 9.6649
Groups 27 27 33 27 27 33 22 22 24
CBID= Culm basal internode diameter (mm), NPT= Number of productive tillers per plant, PL= Panicle length
(cm), PBP= Number of Primary branches per panicle, SBP= Number of Secondary branches per panicle, NGP=
Number of Grains per panicle, SF= Spikelet Fertility (% age), TGW= 1000 grains weight (g), GYP= Grains yield
per plant (g).
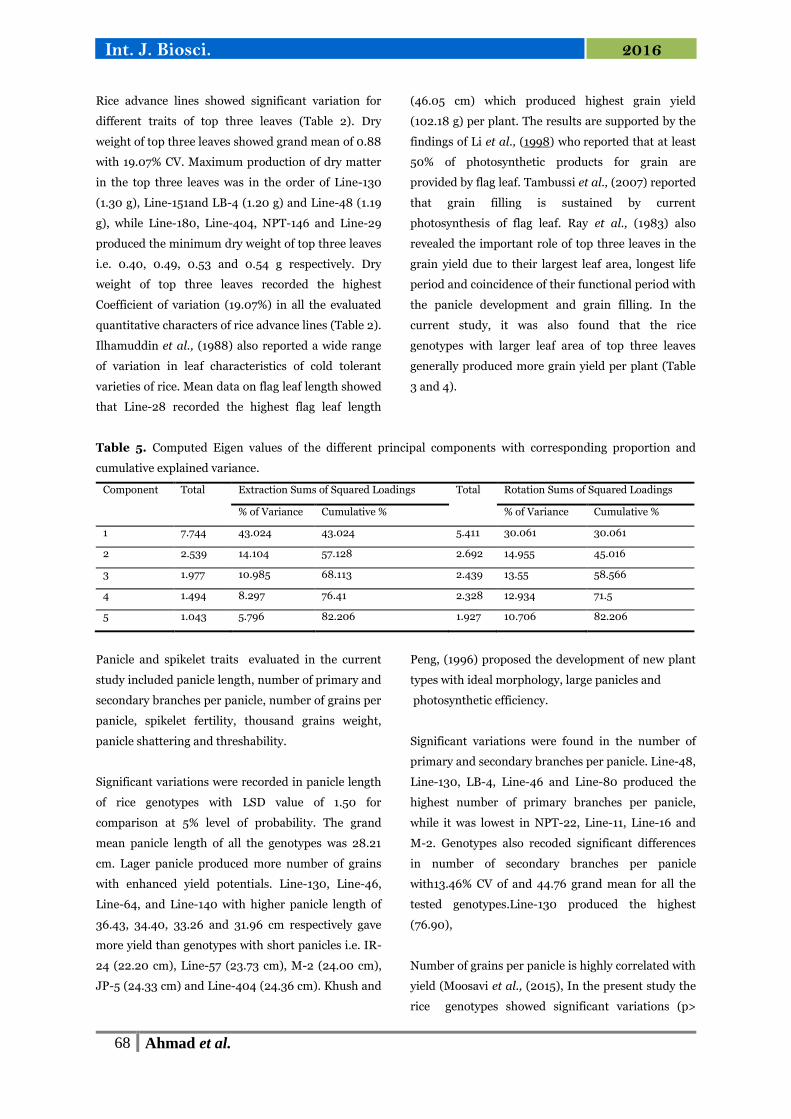
Variability in the thickness of culm in rice advance
lines was recorded with 5.84% CV and basal culm
diameter was highest in Line-48 (7.85 mm), followed
by Line-50, line-130. Line-21, Line-129, Line-182 and
NPT-86 with production of 7.55, 7.46, 7.29 and 7.26,
7.20 and 7.19 mm thick culms respectively. Minimum
culm diameter was reported by genotypes NPT-146
(4.73 mm), IR-24 (4.74 mm), Line-16 (4.96 mm),
Line-181 (5.06 mm), Swat-1 (5.16 mm), IRBB-59 (5.18
mm) and Line-12 (5.20 mm).. Wu et al., (2011) has
found that large culm rice varieties have a higher
number of grains per panicle and a longer spike
length.
Lodging resistance potential of genotypes was also
evaluated and the rice population was categorized
according to their lodging resistance potential as very
weak (3.22%), weak (11.29%), intermediate (14.51%),
moderately strong (24.19%) and strong (46.77%)
Table 4. Lodging is one of the major factors causing
severe yield loss and poor grain quality because of
reduced canopy for photosynthesis and reduced
translocation of nutrients and carbon for grain filling
(Hitaka, 1969). Strong lodging resistance was found
in genotypes with thick basal internodes, while the
resistance level was weak with decreased culm
diameter. These results agree with the findings of Li
et al., (2000) who reported positive correlation of
lodging resistance with the culm diameter and wall
thickness of the basal internodes. Matsuda et al.,
(1983) reported that lodging resistance depends on
basal internode length and thickness, plant height,
culm wall thickness, and leaf sheath wrapping and
thickness.
Plant leaves being the active sites for photosynthetic
activities are important plant organs and determine
the yield capabilities of the cultivars (Asana, 1968).
Page 8
67 Ahmad et al.
Int. J. Biosci. 2016
Table 4. Qualitative analysis of lodging resistance, panicle shattering and panicle threshability in advance lines
of rice.
S,No Genotypes Lodging resistance Panicle shattering, Panicle threshability
1 Line-3 Mod. Strong Low M difficult
2 Line-4 Strong Low M difficult
3 Line-11 Intermediate M.High Loose
4 Line-12 Weak M. high Loose
5 Line-15 Strong V. Low M difficult
6 Line-16 Weak Moderate Loose
7 Line-19 Strong Low Intermediate
8 Line-20 Strong Low M difficult
9 Line-21 Strong Low Intermediate
10 Line-22 Strong V. Low M difficult
11 Line-25 Mod. Strong V. Low M difficult
12 Line-28 Mod. Strong M. High Loose
13 Line-29 Intermediate Moderate Intermediate
14 Line-31 Intermediate Moderate Loose
15 Line-37 Strong Low Intermediate
16 Line-46 Strong Moderate Loose
17 Line-48 Strong Low Intermediate
18 Line-49 Mod. Strong V. Low M difficult
19 Line-50 Strong Low Intermediate
20 Line-53 Intermediate Moderate Loose
21 Line-55 Weak Moderate Intermediate
22 Line-57 Intermediate Low Intermediate
23 Line-60 Mod. Strong Moderate Loose
24 Line-64 Strong Moderate Intermediate
25 Line-73 Strong Low Intermediate
26 Line-74 Mod. Strong V. Low Intermediate
27 Line-78 Mod. Strong V. Low M difficult
28 Line-80 Strong V. Low M difficult
29 Line-95 Strong Low M difficult
30 Line-99 Strong Low Intermediate
31 Line-106 Strong Low Intermediate
32 Line-128 Mod. Strong Low Intermediate
33 Line-129 Mod. Strong Moderate Loose
34 Line-130 Strong Low Intermediate
35 Line-134 Weak M .High Loose
36 Line-140 Strong Moderate Intermediate
37 Line-146 Strong V. Low M difficult
38 Line-151 Strong Low M difficult
39 Line-152 Strong Low M difficult
40 Line-168 Strong V. Low M difficult
41 Line-180 Intermediate Moderate Intermediate
42 Line-181 Weak M. high Easy
43 Line-182 Strong Low Intermediate
44 Line-404 Intermediate M. high Easy
45 NPT-1 Mod. Strong V. Low Difficult
46 NPT-22 Very weak M high Easy
47 NPT-54 Strong V. Low M difficult
48 NPT-86 Strong Low Intermediate
49 NPT-146 Intermediate Moderate Easy
50 NPT-156 Strong V. Low M diff+icult
51 NPT-160 Strong V. Low M difficult
52 NPT-174 Strong V. Low M difficult
53 LB-2 Mod. Strong Moderate Easy
54 LB-3 Mod. Strong Low Intermediate
55 LB-4 Strong Low M difficult
56 M-2 Mod. Strong Low Intermediate
57 JP-5 V. Weak Moderate Intermediate
58 Basmati-385 Weak M. High Intermediate
59 IR-24 Mod. Strong Moderate Loose
60 F. Malakand Intermediate Moderate Intermediate
61 IRBB-59 Mod. Strong Moderate Easy
62 Swat-1 Weak Moderate Intermediate
Page 9
68 Ahmad et al.
Int. J. Biosci. 2016
Rice advance lines showed significant variation for
different traits of top three leaves (Table 2). Dry
weight of top three leaves showed grand mean of 0.88
with 19.07% CV. Maximum production of dry matter
in the top three leaves was in the order of Line-130
(1.30 g), Line-151and LB-4 (1.20 g) and Line-48 (1.19
g), while Line-180, Line-404, NPT-146 and Line-29
produced the minimum dry weight of top three leaves
i.e. 0.40, 0.49, 0.53 and 0.54 g respectively. Dry
weight of top three leaves recorded the highest
Coefficient of variation (19.07%) in all the evaluated
quantitative characters of rice advance lines (Table 2).
Ilhamuddin et al., (1988) also reported a wide range
of variation in leaf characteristics of cold tolerant
varieties of rice. Mean data on flag leaf length showed
that Line-28 recorded the highest flag leaf length
(46.05 cm) which produced highest grain yield
(102.18 g) per plant. The results are supported by the
findings of Li et al., (1998) who reported that at least
50% of photosynthetic products for grain are
provided by flag leaf. Tambussi et al., (2007) reported
that grain filling is sustained by current
photosynthesis of flag leaf. Ray et al., (1983) also
revealed the important role of top three leaves in the
grain yield due to their largest leaf area, longest life
period and coincidence of their functional period with
the panicle development and grain filling. In the
current study, it was also found that the rice
genotypes with larger leaf area of top three leaves
generally produced more grain yield per plant (Table
3 and 4).
Table 5. Computed Eigen values of the different principal components with corresponding proportion and
cumulative explained variance.
Component Total Extraction Sums of Squared Loadings Total Rotation Sums of Squared Loadings
% of Variance Cumulative % % of Variance Cumulative %
1 7.744 43.024 43.024 5.411 30.061 30.061
2 2.539 14.104 57.128 2.692 14.955 45.016
3 1.977 10.985 68.113 2.439 13.55 58.566
4 1.494 8.297 76.41 2.328 12.934 71.5
5 1.043 5.796 82.206 1.927 10.706 82.206
Panicle and spikelet traits evaluated in the current
study included panicle length, number of primary and
secondary branches per panicle, number of grains per
panicle, spikelet fertility, thousand grains weight,
panicle shattering and threshability.
Significant variations were recorded in panicle length
of rice genotypes with LSD value of 1.50 for
comparison at 5% level of probability. The grand
mean panicle length of all the genotypes was 28.21
cm. Lager panicle produced more number of grains
with enhanced yield potentials. Line-130, Line-46,
Line-64, and Line-140 with higher panicle length of
36.43, 34.40, 33.26 and 31.96 cm respectively gave
more yield than genotypes with short panicles i.e. IR-
24 (22.20 cm), Line-57 (23.73 cm), M-2 (24.00 cm),
JP-5 (24.33 cm) and Line-404 (24.36 cm). Khush and
Peng, (1996) proposed the development of new plant
types with ideal morphology, large panicles and
photosynthetic efficiency.
Significant variations were found in the number of
primary and secondary branches per panicle. Line-48,
Line-130, LB-4, Line-46 and Line-80 produced the
highest number of primary branches per panicle,
while it was lowest in NPT-22, Line-11, Line-16 and
M-2. Genotypes also recoded significant differences
in number of secondary branches per panicle
with13.46% CV of and 44.76 grand mean for all the
tested genotypes.Line-130 produced the highest
(76.90),
Number of grains per panicle is highly correlated with
yield (Moosavi et al., (2015), In the present study the
rice genotypes showed significant variations (p>
Page 10
69 Ahmad et al.
Int. J. Biosci. 2016
0.05) for this trait with the formation of 33 groups
with critical value of 53.85 in which the means were
not significantly different from one another. Parikh et
al., (2012) also reported a wide range of variability for
the morpho-agronomical traits in accessions. Number
of grains per panicle ranged from 114.57 (Line-53) to
416.10 (Line-130). It is evident from the table 3 that
genotypes producing high number of grains per
panicle also recorded high grain yield per plant.
Bagheri et al., (2011) also reported a linear positive
relationship of yield with number of grains per
panicle. Majority of rice advance lines were superior
in production of the number of grain than cultivars
used as check.
Table 6. Factor loadings (eigenvectors) for the different morphological characters for the principal components
retained.
Descriptor Principal Components
PC 1 PC 2 PC 3 PC 4 PC 5
Days to Heading 9.00 86.30 15.70 12.60 -16.60
Days to Maturity 12.80 85.30 9.00 5.30 -27.80
Plant Height (cm) 17.50 25.00 -13.30 85.10 4.00
Leaf Length (cm) 10.60 63.40 7.60 48.50 38.50
Leaf Width (cm) 30.20 11.20 89.80 -5.60 -9.90
Flag Leaf Length (cm) 58.30 56.60 -12.40 -21.20 30.50
Flag Leaf Width (cm) 37.60 16.10 85.40 -2.00 4.60
Fresh Weight of Top Three Leaves (g) 73.40 37.40 38.80 8.90 -10.90
Dry Weight of Top Three Leaves (g) 73.20 42.30 30.90 20.70 -4.40
Culm Basal Internode Diameter (mm) 45.05 -2.70 16.70 80.60 -13.40
Number of Productive Tillers/Plant -50.50 -10.00 -12.40 -17.80 72.60
Panicle Length (cm) 81.20 16.30 1.90 30.40 1.00
Number of Primary Branches/Panicle 74.80 11.90 38.50 28.90 -18.10
Number of Secondary Branches/Panicle 86.80 -4.40 36.00 12.80 -13.80
Number of Grains/Panicle 86.60 -6.10 37.50 14.80 -12.60
Spikelet Fertility (% age) -58.60 4.50 -14.60 48.20 48.00
1000 Grains Weight (g) 7.70 11.30 5.00 0.00 -63.20
Grains Yield/Plant (g) 41.60 -7.30 31.60 35.00 55.80
High spikelet fertility is a desired yield enhancing
characteristic of commercial rice cultivars. The
Genetic of cultivar with environmental conditions and
crop management practices play basic role in the
grain filling and development. The genotypes
evaluated for estimating their agro-morphological
diversity recorded significant variations with CV value
of 4.54% and 81.91 grand mean. Spikelet fertility
ranged from 56.02 (Line-57) to 95.33% (NPT-22).
Hairmansis et al., (2010) also recorded diversity in
rice cultivars and reported significant association of
grain yield with spikelet fertility.
The weight of grain also contribute in the final yield of
rice and it was found that 1000-grains weight showed
variability among the rice genotypes with the
formation of 22 significantly different groups at LSD
value of 3.45 (5% level of probability). The weight
range of 20-25 g, 26-30 g. and 31-35 g for 1000-
grains accommodated 23 35, and 4 genotypes
respectively. The grains of Line-37 were found as the
heaviest by giving the maximum weight (34.03 g) for
1000 grains while it was lowest (19.94 g) in LB-4.
Grain yield of rice is a complex trait, quantitative
in nature and is the expression of combined
functions of a number of constituent traits
(Satheesh and Saravanan, 2012). LSD all-pair
wise comparisons Test with critical value of 9.66
formed twenty four statistically divergent groups
Page 11
70 Ahmad et al.
Int. J. Biosci. 2016
of genotypes on the basis of per plant grain yield.
The top ten high yielding genotypes wereLine-28
(102.18 g), Line-46 (91.16, g), Line-21 (90.89 g),
Line-130 (88.90) , Line-50 (86.34 g), NPT-146
(86.20 g), Line-37 (86.14 g), Line-48 (83.84 g),
NPT-156 (83.34 g) and LB-3 (83.21 g).
Out of 56 advance lines evaluated, 31 advance
lines produce more grain yield per plant than the
check cultivars. Grain yield per plant in the check
cultivars was in the order of IRBB-59 (68.77 g),
Fakhr-e-Malakand (62.23 g), JP-5 (58.42 g),
Basmati-385 (53.94 g), Swat-1 (50.28 g) and IR-
24 (33.27 g).
It is evident that the advance lines evaluated in
the current study proved high yielder than the
locally cultivated varieties i.e.JP-5, Fakhr-e-
Malakand, Swat-1 and Basmati-385.
Ashrafuzzaman et al., (2009) also found variation
in morphological and yield components in
different varieties of aromatic rice, while Roel et
al., (2014) reported phenotypic diversity in
traditional rice varieties in the Philippines by
using morphological traits.
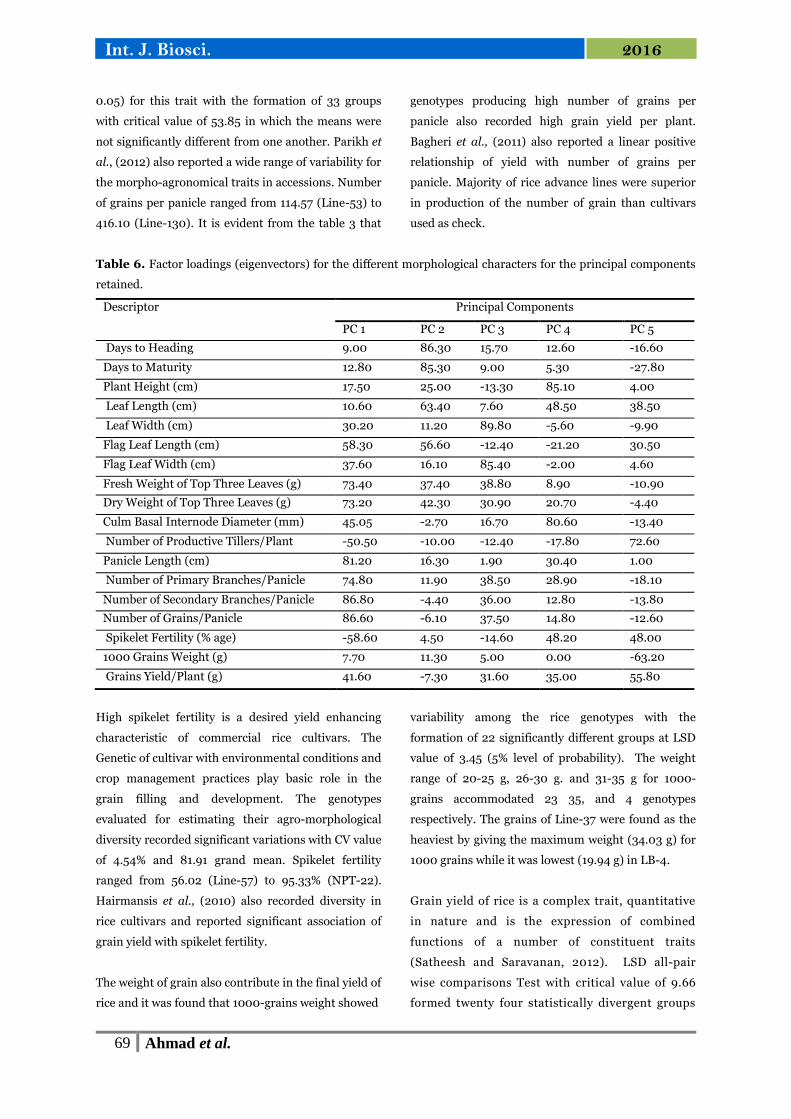
Fig. 1. Cluster tree for rice genotype.
Panicle shattering and threshability are important
varietal characteristic in rice. Low panicle shattering
is a preferred quality of rice genotype which saves the
produce from loses in the field and harvesting
operations. Strong wind and hailing inflicts shattering
in rice crop and the genotypes with low shattering
panicles are damaged minimum. Out of 62 genotypes,
35.48% genotypes recorded low panicle shattering,
while the position of remaining genotypes was in the
order of moderate (29.03%), very low (22.58%) and
moderately high (12.9%) panicle shattering. Panicle
threshability is also a trait of consideration in overall
acceptability of the rice cultivars. Majority of rice
genotypes (40.32%) represented intermediate
threshability and was followed by genotypes
proportion for this trait as moderately difficult
(30.64%), Loose (17.47%), easy (9.67%) and difficult
(1.61%). Wellington et al., 2011 reported a high degree
of variability among 146 the rice accessions for
quantitative and qualitative traits.
Cluster Analysis of Rice Genotypes
Page 12
71 Ahmad et al.
Int. J. Biosci. 2016
The cluster analysis performed for the different
quantitative traits of rice formed two main clusters A
and B diverged at Euclidean distance of25 which
accommodated29 and 33 genotypes respectively.
Cluster A and B truncated at Euclidean distance of 14
resulted in the production of four sub-groups A1, A2
and B1, B2. Clusters AI and B2 were further truncated
at Euclidean distance 7 and produced four groups
denoted by Ai, Aii and Bi, Bii (Fig 1). Thus total six
clusters namely Ai, Aii, A2, B1, Bi, and Bii grouping 16,
9, 4, 7, 13 and 13 genotypes respectively were formed
at Euclidean distance of 7. Each group was assigned
with number of genotypes which has less variation to
one another and more variation to other groups (Fig
1).
Cluster Ai is the largest group contained 16 genotypes
i.e. Line-22, NPT-154, NPT-160, Line-152, Line-19,
Line-50, LB-3, Line-21, Line-106, Line-73, LB-4,
Line-128, Line-140, Line-182, Line-64 and Line-20.
Most of the genotypes of cluster Ai have similarity in
traits like leaf width, number of grains per panicle
and spikelet fertility. Cluster Aii contained nine
genotypes i.e. Line-146, Line-151, Line-4, Line-25,
NPT-156, Line-78, Line-95, Line-74, and NPT-174.
They show nearly similar results for traits like days to
flowering, days to maturity, plant height, leaf width,
panicle length and spikelet fertility. Cluster A2 is the
smallest cluster and comprises of four genotypes i.e.
Line-46, Line-80 and Line-130 and Line-48, which
are distinctive from other advance lines due to their
high values for diameter of basal internode, fresh and
dry weight of top three leaves and number of grains
per panicle. Cluster B1 consists of seven genotypes
namely Line-11, Line-16, M-2, Fakhr-e-Malakand,
Swat-1, IR-24, and Line-53. Members of this cluster
were close in the agro-morphological traits like culm
diameter, flag leaf length and width, panicle length,
number of primary and secondary branches per
panicle, number of grains per panicle and 1000-
grains weight. Cluster Bi having13 genotypes
comprises of Line-37, Line-168, Line-15, NPT-186,
NPT-1, Line-31, Line-404, Line-55, LB-2, Line-3,
Line-180, Line-28, and Line-57. The members of this
cluster were close for leaf length, culm basal
internode diameter, number of productive tillers per
plant, panicle length and number of grains per
panicle characters. Cluster Bii grouped 13 genotypes
i.eNPT-146, IRBB-59, Line-29, Line-181, Line-12,
Line-49, Line-134, Line-99, Basmati-385, Line-129,
JP-5, NPT-22 and Line-60. The genotypes showed
less variation in flag leaf width, fresh and dry weigh of
top three leaves and spikelet fertility.
Principal Component analysis
The KMO test was conducted which calculated high
value of 0.715 and indicated that the data is able to
conduct principal component analysis. In the first
iteration the scree plot extracted seven components
having Eigen value more than one. The 1st
components, 2nd component, 3rd component, 4th
component and 5th component contributing 43.024%,
14.104%, 10.985%, 8.297% and 5.796% of variance to
genetic diversity, respectively. All the five
components were accountable for 82.206%
cumulative variability in quantitative traits. The
extraction was followed by rotated factor pattern for
first five retained components which was linearly
transformed using Varimax (uncorrelated orthogonal
rotation which maximize the explained variance and
interpret the dimension of loadings). The rotation
altered the extraction that 1stcomponents, 2nd
component, 3rd component, 4thcomponent and 5th
component contributed 30.061%, 14.955, 13.55%,
12.934% and 10.706% of variability in genotype,
respectively (Table 5).
It was found that some general patterns created by
principal component analysis. Thirteen traits i.e. leaf
width, flag leaf length, flag leaf width, fresh weight of
top three leaves, dry weight of top three leaves, culm
basal internode diameter, number of productive
tillers per plant, panicle length, number of primary
branches per panicle, number of secondary branches
per panicle, number of grains per panicle, spikelet
fertility and grain yield per plant donating 30.2%,
58.3%, 37.6%, 73.4%, 73.2%, 45.5%, -50.5%, 81.2%,
74.8, 86.8%, 86.6%, -58.6%and 41.6% individual
variation to the 1st component, respectively (Table 6).
The loadings of 1st PC revealed that increase in one
Page 13
72 Ahmad et al.
Int. J. Biosci. 2016
loading confer an increase to other loadings while the
negative value suggests the adverse effect of number
of productive tillers per plant and spikelet fertility on
the rest of significant loadings. The 2ndpattern was
formed by days to heading (86.3%), days to maturity
(85.3%), leaf length (63.4%), flag leaf length (56.6%),
fresh weight of top three leaves (37.4%) and dry
weight of top three leaves (42.3%). Although, the
component showed high genetic variation but do not
elevate the grain yield per plant. The third component
has eight meaningful loadings; leaf width (89.8%),
flag leaf width (85.4%), fresh weight of top three
leaves (38.8%), dry weight of top three leaves
(30.9%), number of primary branches per panicle
(38.5%), number of secondary branches per panicle
(36%), number of grains per panicle (37.5%)and grain
yield per plant (31.6%). The six loading i.e. plant
height (85.1%), leaf length (48.5%), culm basal
internode diameter (80.6%), panicle length (30.4%),
spikelet fertility (48.2%) and grain yield per plant
(35%) lies on the 4th component. Similarly, six
meaningful loadings lies on 5th component which
comprised of leaf length, flag leaf length, number of
productive tillers per plant, spikelet fertility, 1000-
grain weight and grain yield per plant with 38.50%,
30.5%,72.6%, 48%, 63.2% and 55.8% loading
respectively (Table 6).
The 1st component of PCA analysis contributes 41.6%
to grain yield which clearly exhibit that number of
grains per panicle is the basic constituent. The
numbers of grains per panicle which are indirectly
elevated by number of primary and secondary
branches per panicle which got a bigger panicle size
due to decrease in number of tillers per plant which
also give more space to rice stem to achieve large
basal internode diameter and high biomass for top
three leaves. Ashfaq et al., 2012 also found significant
correlation of grain yield per plant with seed per
plant, seed weight per plant and panicle length.
However, panicle length was correlated with flag leaf
area and primary and secondary branches per
panicle, while seed per panicle were also significantly
associated with flag leaf area and primary and
secondary branches per panicle and negative
correlation with tillers per plant. Idris (2012) also
reported a positive phenotypic and genotypic
correlation coefficient between grain yield and panicle
length of rice cultivars. The component also revealed
grain yield per plant, number of primary and
secondary branches per panicle, panicle length, top
three leaves fresh and dry weight, flag leaf length and
width leaf width, culm basal internode diameter share
common genetic architecture while the non-
functionality give rice to low tillers number per plant.
Moosavi et al., 2015 reported the significant direct
correlation of panicle number on grain yield.
Similarly, our 5th component also revealed highest
elevation of grain yield among the components. The
5th component is based on large proportion by tillers
per plant.
Conclusion
Thus, the current study inferred that for increasing
rice grain yield it is essential for a genotype to carry
high number of tillers per plant, large panicle size and
1000 grain weight. Further, the genetic divergence
and identification of desirable traits in advance lines
of rice could be utilized for breeding as new rice
varieties that may be able to break yield stagnation
which rice breeders are currently trying to address.
References
Asana RD. 1968. In quest of yield. Indian Journal of
Plant Physiology 11, 1-10.
Ashfaq M, Khan AS, Khan SHU, Ahmad R.
2012. Association of various morphological traits with
yield and genetic divergence in rice (Oryza Sativa L.).
International Journal of Agriculture and Biology 14,
55–62.
Azarpour E. 2013. Path coefficient analysis for the
yield components of rice cultivars in Iran under
different nitrogen levels. Journal of Biodiversity and
Environmental Sciences 3(10), 24-30 p.
Babu VR, Shreya K, Dangi KS, Usharani G,
Shankar AS. 2012. Correlation and Path Analysis
Studies in Popular Rice Hybrids of India.
Page 14
73 Ahmad et al.
Int. J. Biosci. 2016
International Journal of Scientific and Research
Publication 2(3).
Bajracharya J, Steele KA, Jarvis DI, Sthapit
BR, Witcombe JR. 2006. Rice landrace diversity
in Nepal: Variability of agro-morphological traits and
SSR markers in landraces from a high-altitude site.
Field Crops Research 95, 327–335.
Bagheri NA, Babaeian-Jelodar NA, Pasha A.
2011. .Path coefficient analysis for yield and yield
components in diverse rice (Oryza sativa L.)
genotypes. Biharean Biologist 5(1), 32-35.
Caldo R, Sebastian L, Hernandez J. 1996.
Morphology-based genetic diversity analysis of
ancestral lines of Philippine rice cultivars. Philipp.
Journal of Crop Science 21, 86–92.
Chakravarthi BK, Naravaneni R. 2006. SSR
marker based DNA finger-printing and diversity
study in rice (Oryza sativa L.). African Journal of
Biotechnology 5(9), 684-688.
Habib SH, Bashar MK, Khalequzzaman M,
Ahmed MS, Rashid ESMH. 2005. Genetic
analysis and morpho-physiological selection criteria
for traditional biroin Bangla desh rice germplasm.
International Journal of Biological Sciences 5, 315–
318.
Hairmansis AB, Kustianto, Supartopo S. 2010.
Correlation analysis of agronomic characters and
grain yield of rice for tidal swamp areas. Indonesian
Journal of Agricultural Sciences 11, 11-15.
Hasan MJ, Kulsum MU, Akter A,
Masuduzzaman ASM, Ramesha MS. 2013.
Genetic variability and character association for
agronomic traits in hybrid rice (Oryza sativa L.).
Bangladesh Journal of Plant Breeding and Genetics,
24(1), 45-51.
Hitaka H. 1969. Studies on the lodging of rice
plants. Japan Agricultural Research Quarterly. (4),
1–6.
Idris AE, Justin FJ, Dagash YMI, Abuli A. 2012.
Genetic variability and inter relationship between
yield and yield components in some rice genotypes.
American Journal of Experimental Agriculture 2(2),
2333-2339.
Ilhamuddin, Rosh D, Ahmad M. 1988.
Characteristics of cold tolerant rice cultivars of
NWFP. Pakistan Journal of Agricultural Research.
9(4), 437-439.
Imad N, Khan AS, Akhter M. 2014. Correlation
and path coefficient studies of some yield related
traits in rice (Oryza sativa L.). International Journal
of Scientific and Research Publications. 4(4), 1-5.
IRRI. 1996. Standard Evaluation System for Rice. 4th
Edition. International Rice Research Centre, Manila,
Philippines.
Kwon SJ, Ha WG, Hwang HG, Yang SJ, Choi
HC, Moon HP, Ahn SN. 2002. Relationship
between heterosis and genetic divergence in 'Tongil'-
type rice. Plant Breeding. 121: 487–492.
Li, ZK, Pinson SR, Stansel JW, Paterson AH.
1998. Genetic dissection of the source-sink
relationship affecting fecundity and yield in rice
(Oryza sativa L.). Molecular Breeding. 4:419-426.
Li HB, Bai KZ, Kuang TY, Hu YX Jia X, Lin
JX. 2000. Structural characteristics of thicker-culms
in the high-yield wheat cultivars. Acta Botonica Sinica
42, 258-1262.
Matsuda TH, Kawahara Chonan N. 1983.
Histological studies on breaking resistance of lower
internodes in rice culm. Proceedings of the Crop
Science Society of Japan 52, 355–361.
Mohapatra PK, Patel R, Sahu SK. 1993. Time of
Flowering Affects Grain Quality and Spikelet
Partitioning Within the Rice Panicle. Australian
Page 15
74 Ahmad et al.
Int. J. Biosci. 2016
Journal of Plant Physiology 20(2), 23 –241.
Moosavi M, Ranjbar G, Zarrini H, Gilani A.
2015. Correlation between morphological and
physiological traits and path analysis of grain yield in
rice genotypes under KhuzestanConditions. Biological
Forum – An International Journal. 7(1), 43-47.
NTHRI. 2011. Annual Report. National Tea and High
Value Crops Research Institute, Mnasehra-Pakistan
Ray S, Mondal WA, Choudhuri MA. 1983.
Regulation of leaf senescence, grain-filling and yield
of rice by kinetin and abscisic acid. Acta Physiologiae
Plantarum 59, 343–346.
Satheesh KP, Saravanan K. 2012. Genetic
variability, correlation and path analysis in rice
(Oryza Sativa L.). International Journal of Current
Research 4(09), 082-085.
Selvaraj CI, Nagarajan P, Thiyagarajan K,
Bharathi M, Rabindran R. 2011. Genetic
parameters of variability, correlation and path-
coefficient studies for grain yield and other yield
attributes among rice blast disease resistant
Genotypes of rice (Oryza sativa L.). African Journal
of Biotechnology 10(17), 3322-3334.
Takahashi N. 1984. Seed germination and seedling
growth. Chapter 3. Biology of rice. Amsterdam 7, 71-
88.
Tambussi EA, Bort J, Guiamet JJ, Nogués S,
Araus JL. 2007. The photosynthetic role of ears in
C3 cereals: metabolism, water use efficiency and
contribution to grain yield. Critical Reviews in Plant
Sciences 26, 1-16.
Wu LL, Liu ZL, Wang JM, Zhou CY, Chen KM.
2011. Morphological, anatomical, and physiological
characteristics involved in development of the large
culm trait in rice. Australian Journal of Crop Science.
5, 1356–1363.
Yang WS, Peng RC, Laza RM, Visperas Sese
MLD. 2007. Grain Yield and Yield Attributes of New
Plant Type and Hybrid Rice. Crop Science 47, 1393–
1400.
Yang XC, Hwa CM. 2008. .Genetic modification of
plant architecture and variety improvement in rice.
Heredity 101, 396–404.
Yoshida S. 1981. Fundamentals of rice crop science.
International Rice Research Institute, Manila,
Philippines. Los Baños, Laguna. 269 p.
Zhang C, Peng IS, Laza RC. 2003. Senescence of
Top Three Leaves in Field-Grown Rice Plants.
Journal of Plant Nutrition. 26(12), 2453–2468.