ESTIMATION OF LOWER-BOUND Kjc ON PRESSURE VESSEL STEELS FROM INVALID DATA* Donald E. McCabe and John G. Merklet Metals and Ceramics Division OAK RIDGE NATIONAL LABORATORY P.O. Box 2008 OakRidge, TN 37831-6151 Research sponsored by the Office of Nuclear Regulatory Research, U.S. Nuclear Regulatory Commission, under Interagency Agreement DOE 1886-8011-9B with the U.S. Department of Energy under Contract DE-ACO5-96OR22464 with Lockheed Martin Energy Research Corp. * tEngineering Technology Division. Theurbmitledmanuocripthasbeenaulhored by a contndor of the US. Government under centrad No. M-AC05-960R22464. Accordingly, the U.S. Govommenl retains a nonexclusive, royaHy-free license to publish or reproduce the publishedh dthis contribution. or alia~othero to do so. for U.S. oovemmenl purposes.
Transcript
ESTIMATION OF LOWER-BOUND Kjc ON PRESSURE VESSEL STEELS FROM INVALID DATA*
Donald E. McCabe and John G. Merklet
Metals and Ceramics Division OAK RIDGE NATIONAL LABORATORY
P.O. Box 2008 OakRidge, TN 37831-6151
Research sponsored by the Office of Nuclear Regulatory Research, U.S. Nuclear Regulatory Commission, under Interagency Agreement DOE 1886-801 1-9B with the U.S. Department of Energy under Contract DE-ACO5-96OR22464 with Lockheed Martin Energy Research Corp.
*
tEngineering Technology Division.
Theurbmitledmanuocripthasbeenaulhored by a contndor of the US. Government under centrad No. M-AC05-960R22464. Accordingly, the U.S. Govommenl retains a nonexclusive, royaHy-free license to publish or reproduce the publishedh dthis contribution. or alia~othero to do so. for U.S. oovemmenl purposes.
DISCLAIMER
Portions of this document may be illegible in electronic image products. Images are produced from the best available original document.
Donald E. McCabe’ and John G. Merkle’
ESTIMATION OF LOWER-BOUND KJ, ON PRESSURE VESSEL STEELS FROM INVALID DATA
REFERENCE: McCabe, D. E., and Merkle, J. G., “Estimation of Lower-bound K,, on Pressure Vessel Steels from Invalid Data,” Fatigue and Fracture Mechanics: 28th Volume, ASl34SZ-P 1321, J. H. Underwood, B. D. MacDonald, and M. R. Mitchell, Eds., American Society for Testing and Materials, 1997.
ABSTRACT Statistical methods are currently being introduced into the transition temperature characterization of ferritic steels. The objective is to replace imprecise correlations between empirical impact test methods and universal Kk or Kh lower-bound cuwes with direct use of material-specific fracture mechanics data. This paper will introduce a computational procedure that couples order statistics, weakest-link statistical theory, and a constraint model to arrive at estimates of lower-bound Kj, values. All of the above concepts have been used before to meet various objectives. In the present case, the scheme is to make a best estimate of lower-bound fracture toughness when resource Kj, data are too few to use conventional statistical analyses. The utility of the procedure is of greatest value in the middle-to-high toughness part of the transition range where specimen constraint loss and elevated lower-bound toughness interfere with the conventional statistical analysis methods.
KEYWORDS: fracture toughness, K,, Kj,, lower bound, constraint, order statistics, weakest link
INTRODUCTION
Good progress is being made relevant to the problem of defining the transition temperature of ferritic steels. The problem has been in learning how to deal with excessive scatter in fracture mechanics data based on Kk andor Kj, values. Statistical methods are now being used to model the data scatter patterns and to pinpoint the
‘Metals and Ceramics and Engineering Technology Divisions, respectively, Oak Ridge National Laboratory, P.O. Box 2008, Oak Ridge, TN, 3783 1-6151, managed by Lockheed Martin Energy Research Corp. under contract DE-ACO5-96OR22464 for the U.S. Department of Energy.
c
characteristics that can be used to more accurately compare one material or material condition with another.
Values of Kk are now being used that imply elastioplastic stress intensity fhctors determined at the point of onset of cleavage flacture. Such instabiities are triggered by minute microstructural impurities that are almost always present in commercially produced steels. These can be carbides andor nonmefallic inclusions of varied sizes that are scattered randomly throughout the microstructure [u. To trigger cleavage, a particle must be of a critical size and by chance be located within the highly stressed volume of material local to the crack tip [a. The resulting scatter of Kk data due to this probabilistic phenomenon usually produces ratios of from 2 to 3 times between the lowest to the highest values; assuming, of course, that data replication is sufficient to demonstrate this. It follows that crack tip volume sampling effects that produce data scatter can also lead to a statistical thickness effect in which large specimens tend to exhibit lower toughness than small specimens. This can be explained by using a statistical weakest-link theory.
In general, statistical methods have been able to explain much of what has been observed experimentally. However, there are other influential conditions that need to be taken into account as well. As already mentioned, cleavage flacture is triggered by particles of a critical size exposed to a critical tritensile combination of stress and plastic strain that develops along the crack front. The stress ratios and plastic strain magnitudes are controlled by the degree of crack tip constraint. Therefore, constraint must be well managed to successfblly use statistical models on the data. Constraint is a function of material strength, specimen thickness, and specimen or component geometry. This aspect of transition range behavior has generated a second and somewhat independent focal point for research work [3]. Care can be taken to control constraint in laboratory tests, but the application of laboratory-generated data to engineering problems requires added attention to possible constraint differences.
This paper uses both statistical and constraint modeling to deal with the special problems sometimes encountered in engineering applications. We will consider the case where the background data are too few to use conventional statistics, and show a method of imposing extrapolation limits on the weakest-link size effect model to generate an estimate of the lower bound of fracture toughness.
Background information will be covered first that applies to the more precise determination of median Kk and standard deviation that is possible when a sufficient data sampling plan is used. This approach will provide benchmark information for comparison to the backup method of lower certainty proposed here.
BACKGROUND ON STATISTICAL MODELS
The three-parameter Weibull statistical model has been chosen as the best one to fit Kk data distributions [4]. It has the versatility to fit a wide variety of data distriiutions, one of which is the typical fracture mechanics-based flacture toughness data distribution.
Cumulative probability for failure, Ph at or before stress intensity driving level, Kb is calculated by the following modification of the three-parameter Weibull equation:
Parameters K , K-, and b are three Weibull data population fitting constants obtained from data samplig. The model of Eq. (1) also shows a fourth parameter, N, that describes the phenomenon of weakest-link behavior that develops only in the low-to-middle part of the transition range of fiacture toughness. Term N is a size ratio and, for test specimens of different sizes where all dimensions are scaled proportionally, specimen thickness is used; Le., N = B@,. In theory, the dimension B, is arbitrary and once B, is selected, K, is determined by the order statistics of sample data. For example, when replicate tests are made on specimens of thickness B, and median KjNij has been determined, median ICJN2) for specimens of thickness B, can be calculated using the following relationship:
Equation (2) is derived from Eq. (1) and it models the weakest-link size effect described earlier. The trend set by Eq. (2) has been extended outside the range covered by typical test specimen sizes for predicting large flaw effects in engineering applications [z]. Crack size ratio instead of thickness is then used in term N. The end point of extrapolation on Eq. (2) is 20 MPadm and the present work will propose an existence of a truncation point at higher Kk values based on a constraint limit rationale. To obtain the three Weibull parameters of Eq. (1) that represent the total data population, it is important to know how large the data sampling must be. Early Weibull Parameter fitting work was done without such consideration [4]. Subsequently, Wallin [6] conducted a much-needed sensitivity study and it was determined that parameters K- and Weibull slope, b, require huge numbers of replicate tests; of the order of 50 to 100. However, in this same study, it was determined that when I(II, is set to 20 MPadm, Weibull slope for ferritic steels tended to centralize to a constant value of 4. Data were taken fiom several experiments to demonstrate the centralizing tendency with increased sample size described above. This discovery has been used to convert what had been an interesting technical observation into a practical engineering tool that is amenable to standardization practices. Hence, Eqs. (1) and (2) become more consistent and universally reproducible. To determine the Weibull scale parameter, &, requires only 6 replicate tests. With Weibull slope known and essentially constant, the standard deviation, u, on data scatter is precisely characterized fiom the following [I]:
where Kwmai) is the calculated median toughness value.
Equations (1) through (3), used with the two fixed Weibull parameters, have been tested repeatedly with experimental results and, although small data samplings cannot always accurately match and confirm the two fixed parameters, the evidence of the centralizing tendency to these values is quite convincing.
Finally, Wallin [6] has determined that the median of Kk fiacture toughness for ferritic steels will fit a common transition curve; namely, 1T compact and bend bar specimens (25 mm thick) will fit the following curve:
K J C ( d ) = 30 + 70 exp [O.O19(T - To)] (4)
This curve is known as the “master curve,” and it can be noted that Eq. (4) is of the same mathematical form as the American Society of Mechanical Engineers (ASME) Boiler andPressure Vessel Code equations for static lower-bound Kk and crack arrest KL. In those cases, the curves are positioned using reference temperature, RTmT [a]. For the master curve, reference temperature is To and, when test temperature, T, is set at the reference temperature, Kjc(mcd) is 100 MPadm.
Again, the concepts presented to this point will be used to set the more exact characterization of fiacture toughness. The following sections deal with an application that is specialized toward seeking a lower bound of KJ, fracture toughness for the data distribution of the material. It will be assumed that sample size is insufficient. A constraint-based model is then applied to a lower-bound KJ, estimate to find a safe Kk value for use in engineering applications.
ORDER STATISTICS
Steinstra et al. [9] have described how lower-bound tolerance estimates on KJ, can be made from small data samplings. The method is aided by having prior knowledge of the Weibull slope of the data population. When Kk values are arranged in order of increasing magnitude, the cumulative probability value can be estimated independently fiom each datum using the so-called “Beta distribution estimator.” These estimates are determined for a discretionally selected value of cumulative probability. For example, P, = 0.10 will be used predominantly here. At the same time, one must choose a confidence level on the determination. The concept involves the development of a set of coefficients, q, that, when multiplied by ranked data, will provide estimates of Kj,ca,>
values that are expected to reside in the 10% lower tail of the population distribution. The process of developing the multiplier coefficients is explained in detail elsewhere [&I. Table 1 is an example of such coefficients, set up to cover from one to six data sample sues.
TABLE 1-Coefficient, "q," for Pf = 0.10 and 90% confidence on the estimate.
A hypothetical example will be used here to illustrate the use of order statistics (see Fig. 1). Assume three 1T compact specimens had been tested at 100°C, giving ICI, values of 165, 190, and 235 Mpadm. These are ranked as shown in Table 2 and the appropriate coefficients tiom Table 1 are assigned (column 3).
TABLE 2-Estimates of Kk at or below the Pf = 0.10 level.
The Beta distribution estimation assumes two-parameter Weibull with a slope of 4; so for a three-parameter model, the following equation was used:
The solid and dashed curves in Fig. 1 represent the assumed master curve characteristic of the material population. The true ICJ, at the 10% tolerance bound of the data population is about 140 MPaJm and the filled square datum approximates the order statistic placement of all three order statistic estimates. Such values, when based on few data, carry the potential of being overly conservative. The following order statistic example will be based on actual experimental data.
Figure 2 shows a master curve and tolerance bound developed fiom the testing of about 150 1T compact specimens. The data came fiom a round-robin activity sponsored by the Materials Properties Council and the Japanese Society for the Promotion of Science [MI. Eighteen laboratories were involved. A 508 class 2 steel was tested at three test temperatures: -50, -75, and -100°C. Duplication for each variable (test temperature and laboratory) was five specimens. In this case, the order statistic exercise was to determine how well each data set could predict the lower tolerance bound of the master w e . The 10% tolerance bound on the master curve was margin adjusted 16°C to cover the uncertainty in reference temperature, T, from the five-specimen sample size. A 95% confidence level is imposed.2 The same tolerance bound and confidence level was imposed on the order statistic estimates. Clearly, the order statistics estimates related well to the more rigorous determinations of the three-parameter Weibull method.
ADJUSTMENT TO LOWER-BOUND TOUGHNESS
Equation (2) can follow the size effect trend of median KJ, values suitably for data obtained fiom test specimens. However, some questions arise when the test temperature is high in the transition range and when the equation is used on in-service flaws that could perhaps be an order of magnitude or more larger than that of the test specimens. Observe that predicted KJEO in Eq. (2) will tend toward 20 MPadm as size ratio tends to inhity. It is argued here that such a trend will cease to be maintained as upper-shelf temperature is approached and the model should break down. It seems only reasonable to expect that real K- must rise to J-R curve levels at the upper-shelfpart of the transition range. In addition, it is important to recognize that IC- = 20 MPadm is used as a deterministic parameter of the Weibull model and there must be some departure between the model and real material behavior at temperatures high in the transition range [u,123. Figure 3 depicts how this departure is envisioned. Here, 1T compact specimens are tested at a test temperature where the median Kk is 300 MPaJm. The distribution for 10T compact specimens is calculated using weakest-theory. A constraint-based data truncation point is calculated to be at 144 MPadm using a procedure that is to be covered presently. Kk data to the left of the vertical line cannot be developed experimentally, irrespective of the specimen size used. To experimentally demonstrate the phenomenon at such temperatures as depicted here is difficult for more than one reason. In Fig. 3, it appears that the smaller 1T specimens have an advantage against data truncation because only 3% of the possible test data are influenced. However, small specimens will develop severe top-end Kk data loss due to excessive loss of constraint; a subject not addressed in this paper. On the other hand, an experiment with adequate numbers of 10T specimens would never be considered practical.
2Test Method for the Determination of Reference Temperature, To, for Ferritic Steels in the Transition Range, Appendix C, Draft 12, American Society for Testing and Materials, January 3 1, 1996.
ORNL-W 96-4932 4001 I I I I I I 1
300
- b o 4 Y
4 0 0
I i i
MASTER CURM WITH TOLERANCE BOUNDS
---IO% AND 90% TOLERANCE BOUNDS HYPOTHESIZED
0 3 IQ VALUES AT 4 0 0 %
235
O L I I I I I I I - 4 5 0 -100 -50 0 50 1 0 0 1% 200
TEST TEMPERATURE CC)
FIG. 1-Schematic representation of a three-specimen sample fiom material defined by the master curve with 10% and 90% tolerance bounds.
ORNL-WG 96-4934
300 I I I I I I I m R STATISTICS USED ON MPC MTA MPC RR, A m . 4TcTs. i8 LABS
TO= - 4 0 6 % . MARGIN + 46% 200 - LAB. USING = 0.4 AND as F CONFWNCE LIMIT
g 4w-: - s
Y
4 0 0 - -
- ----I-
O I I I I I I I -200 -475 - 4 5 0 -425 -100 -75 -50 -25 0
TEST TEMPERATURE CC)
FIG. 2--Data for A 508 class 2 steel from 18 participating laboratories from a round robin sponsored by the Materials Properties Council and the Japanese Society for the Promotion of Science. Each data point represents an estimate of the 10% tolerance bound &om five replicate tests.
DETERMINATION OF LOWER-BOUND Kj, TOUGHNESS
The constraint model to be applied here emanates fiom the most senior model used in the technology of fracture mechanics [u]. We assume that the critical maximum constraint is achieved when thickness, B,, satisfies the following inequality:
The right side of Eq. (6) can be input into ratio N of Eq. (2) to project the trend of K,, decrease with increased thickness. Then an equation of the following cubic form results:
where 2G = [ K,, Jc (0.1) - 1) [
The following simple steps will produce a K,, of maximum constraint if G > W
M, = G + {m.
M, = G - dG2 (-1/3)3 .
Let y = Mit3 + Mil3 .
Then KJc(,) = y*(K-) . (9)
Alternatively, the following empirical power law can be used:
Substitution of Kjq) into Eq. (6) will define the limiting thickness of full constraint where increased specimen thickness will not fiuther reduce Kk . The choice of a,, to be used in Eqs. (6) and (8) can be based on experimental evidence. Ea, = 2.5 were used, Kwt and B, would satis@ the validity limits for Iz, [u] in the American Society for Testmg and Materials (ASTM) Standard Test Method for Plane-Strain Fracture Toughness of Metallic Materials (E 399). However, experimental work on ferritic steels has indicated that a, = 1 is the more accurate coefficient [U]; this is the value selected to be used in the examples that follow.
Figure 4 is again a schematic example of specimen size effects. It shows the three-parameter Weibull trend of median fracture toughness (solid line), with open squares for 1/2T, lT, 2T, 4T, and 6T compact specimens, the Pf = 0.10 (dotted line) curve is calculated using Eqs, (1) and (2). The open-diamond points represent exact Pf = 0.1 predictions for lower-bound Kj, at each specimen thickness. When these lower-bound values, KJgo.l)a are adjusted using Eqs. (8) and (9), the ICw2) values shown as filled squares result. The lower bound of Kk toughness is defined and the separation between the dashed line and the dotted line indicates the extent of Kk lower-bound adjustment applied to data distributions.
The Heavy-Section Steel Irradiation Program Fifth Irradiation Series can be used as a challenging example application of the proposed procedure [fi]. Test data replications varied from two to nine specimens and specimen sizes varied from 1T to 8T. There were nominally eight test temperatures selected along the transition range. Two materials were submerged-arc welds in A 533 grade B plate (72W and 73W) that differed only in copper content. The ASME reference temperatures @Tm) were known precisely (k5"C) for both unirradiated and irradiated conditions.
Figures 5 and 6 show unirradiated KJc data for 73W (0.3 1% Cu) material as tabulated (Fig. 5 ) and then after order statistics and constraint adjustments for lower-bound Kk have been applied (Fig. 6). Again, the fracture toughness truncation used corresponds to a, = 1.0 in Eq. (6). The ASME lower-bound Kk curve shown in Fig. 6 is reputed to correspond to a 2% confidence limit (short dash). The 2% cumulative probability tolerance bound line (long dash) based on the master curve is also shown.
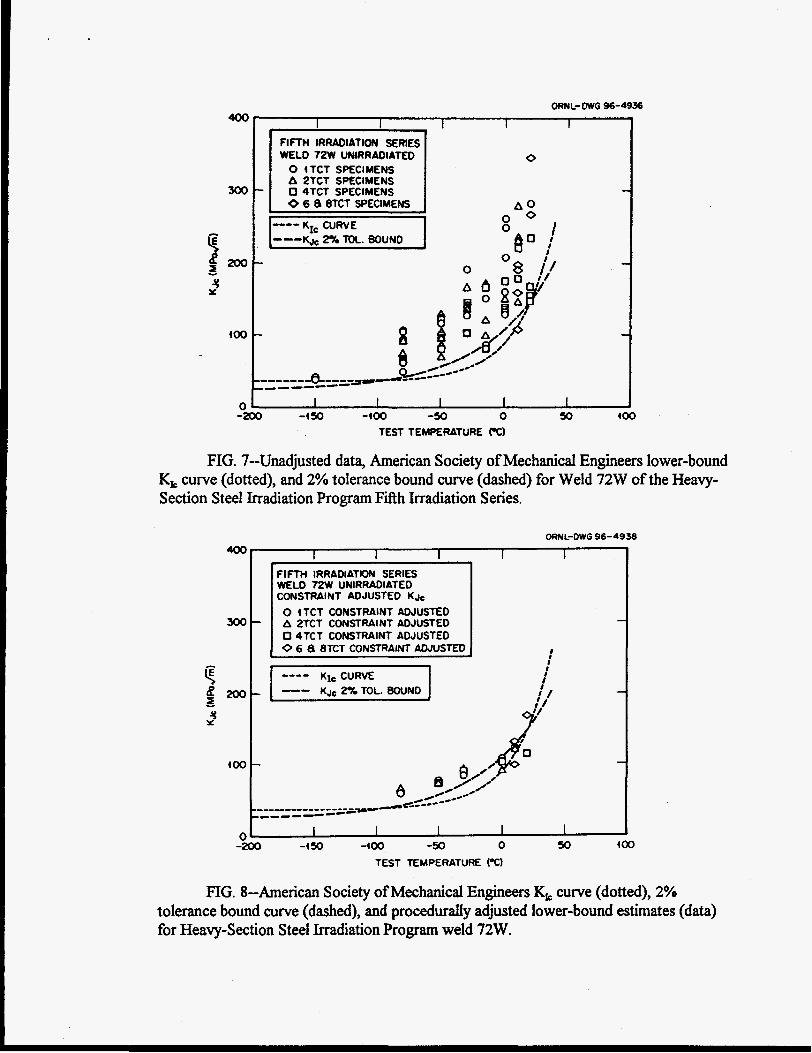
Figures 7 and 8 are the same as Figs. 5 and 6, except that the material is weld 72W (0.23% Cu). In this case, lower-bound predictions tend to be a little nonconservative at the low test temperatures.
0.05
0.04
0.03 - - X
c
0.02
0.0 1
0
ORNL-DWG 96-493
FIG. 3--Density fhction distributions for 1T C(T) and 10T C(T) specimens showing the effect of a true lower bound on distribution shape.
FIG. 4--Three toughness versus specimen size trends showing median trend by weakest link (open squares), Kk 10% tolerance bound trend by weakest lmk (open diamonds), and lower-bound ICJ, (dashed line).
ORNL-OWG96-4935 400
300
s Y
4 0 0
I I I I I
0 ITCT SPECIMENS A ZTCT SPECIMENS
0 6 0 BTCT SeEClMENS
0 0
- -200 -4 50 -400 -50 0 50 1 0 0
TEST TEMPERATURE 0
FIG. 5--Unadjusted data, American Society of Mechanical Engineers lower-bound Kk curve (dotted), and 2% tolerance bound curve (dashed), for weld 73W (A 533 grade B) of the Heavy-Section Steel Irradiation Program Fifth Irradiation Series.
ORNL-OWG 96-4940
400 I I I I I i
FIFTH IRRADiATtON SERIES WELD 7 3 W UNIRRADIATED CONSTRAINT ADJUSTED K J ~
I 0 4TCT CONSTRAINT ADJUSTED
0 4TCT CONSTRAINT ADJUSTED I
0 6 8 8TCT CONSTRAINT AOJUSTEO I
300- A 2TCT CONSTRAINT ADJUSTED I -
I
K I ~ CURVE
g , - I - U -a
Y
l o o - - 0 /<'* *sz@-- ------- ,,-*--
I I I I I -200 -I 50 -100 -m 0 50 100 0
TEST TEMPERATURE CC)
FIG. 6--American Society of Mechanical Engineers Kk curve (dotted), 2% tolerance bound curve (dashed), and procedurally adjusted lower-bound estimates (data) for Heavy-Section Steel Irradiation Program weld 73W.
ORNL-DWG 96-4936 400
WELD 72W UNIRRADIATED 0 0 iTCT SPECIMENS A PTCT SPECIMENS
300- 0 4TCT SPECIMENS
0
0 ' - f m - 0 8 ,(I Y .y At!" !I
loo -
0 - -200 -4 50 -io0 -50 0 Jo 4 0 0
I I I 1 I I
TEST TEMPERATURE CC)
FIG. 7--Unadjusted data, American Society of Mechanical Engineers lower-bound Kk curve (dotted), and 2% tolerance bound curve (dashed) for Weld 72W of the Heavy- Section Steel Irradiation Program Fifth Irradiation Series.
OWL-DWG 96-4938
4oc
XK:
-Y Y
T I I ~~
FIFTH IRRADIATION SERIES WELD 72W UNIRRADIATED CONSTRAINT ADJUSTED K k
FIG. S-American Society of Mechanical Engineers curve (dotted), 2% tolerance bound curve (dashed), and procedurally adjusted lower-bound estimates (data) for Heavy-Section Steel Irradiation Program weld 72W.
Figures 9 and 10 present the same comparison for both materials in the irradiated condition. In this case, 72W and 73W data were combined because the two materials ended up with the same irradiated RTmT temperature. The adjusted data ofFig. 10 are quite similar to those of Fig. 6, both of which tend to favor the 2% tolerance bound curve.
CONCLUSIONS
This paper proposes a method of analysis that represents a best effort at predicting lower-bound fiacture toughness Kk values when the supporting data are sparse. Order statistics can be used to estimate a K,$ toughness value that is near to lower bound when the data sample is small. The resulting KEc estimate can be adjusted for specimen size to large flaw size equivalence. A constraint model is used to truncate the statistical weakest-link size effect trend at a size where constraint will cease to increase with increased crack size, This model is of most value in the middle-to-high toughness part of the transition range, where the weakest-link size effect begins to vanish. The lower-bound KJ, estimate may or may not be precisely the same as lower-bound Kk but, at the same time, it is preferred as an estimate of that value as opposed to the alternative use of impact tests with an assumed correlation to the universal K, lower-bound curve.
The methodoIogy presented is flexible in terms of the value of a, and/or confidence limits selected and can be adjusted to various levels of conservatism chosen at the discretion of the user. The levels chosen for this paper were selected to follow the transition Kk lower-bound curve. However, this practice is not proposed to replace the more rigorous statistical practices3 The applications are for circumstances where source information is sparse or for engineering applications where the conditions are such that the weakest-link theory cannot properly model the fiacture toughnesdsiize effect trend.
ACKNOWLEDGMENTS
This research is sponsored by the Office of Nuclear Regulatory Research, U. S. Nuclear Regulatory Commission, under Interagency Agreement DOE 1886-801 1-9B with the U.S. Department ofEnergy under Contract No. DE-ACOS96OR22464 with Lockheed Martin Energy Research Corp. The authors would like to thank Shafik K. Iskander and Mikhaid A. Sokolov for peer review and Julia L. Bishop for preparation of the manuscript.
?est Method for the Determination of Reference Temperature, To, for Ferritic Steels in the Transition Range, Appendix C, Draft 12, American Society for Testing and Materials, January 3 1, 1996.
n
0 tTCT SPECIMENS A 2TCT SPECIMENS 0 4TCT SPECIMENS
Kyc CURVE Q2XTOL.BolMO
ORNL-Dwo 97-4937
I I I I I FIFTH IRRADIATION SERIES WLOS n w a n w IRRADIATED
0 : A ;
0 ; I
// / /
I 1 I I I - - 4 0 0 -50 0 50 4 0 0 1 5 0 200
TEST TEMPERATURE cc)
FIG. 9--Unadjusted data, lower-bound Kk curve (dotted), and 2% tolerance bound curve (dashed) for Heavy-Section Steel Irradiation Program welds 72W and 73W irradiated to a fast neutron fluence of 1.5 x 10’’ dcm’ (>1 MeV).
FIG. 10-American Society of Mechanical Engineers Kk curve (dotted), 2% tolerance bound curve (dashed), and procedurally adjusted to lower-bound data for Heavy-Section Steel Irradiation Program welds 72W and 73W irradiated to a fast neutron fluence of 1.5 x 10” dcm’ (>I MeV).
REFERENCES
Heerens, J., Read, D. T., Cornec, A., and Schwalbe, K.-H., “Interpretation of Fracture Toughness in the Ductile-to-Brittle Transition Region by Fractographical Observations,” pp. 659-678 in Defect Assessment in Components - Fundamentals andAppZicatiom, ESISIEGF9, J. G. Blauel and K.-H. Schwalbe, Eds., Mechanical Engineering Publications, London, 199 1. Anderson, T. L. Stienstra, D., and Dodds, R. H., Jr., “A Theoretical Framework for Addressing Fracture in the Ductile-Brittle Transition Region,” pp. 186-2 14 in Fracture Mechanics: TwenpFourth Volume, A S m S P 1207, J . D. Landes, D. E. McCabe, and J. A. M. Boulet, Eds., American Society for Testing and Materials, Philadelphia, 1994. Hackett, E. M., Schwalbe, K.-H., and Dodds, R. H., Jr., Eds., Conspaint Efects in Fracture, A S I U S i T 1171, American Society for Testing and Materials, Philadelphia, 1993. Landes, J. D., and McCabe, D. E., “Effect of Section Size on Transition Temperature Behavior of Structural Steels,” pp. 378-392 in Fracture Mechanics: Fifreenth Symposium, A S Z M S P 883, R. J. Sanford, Ed., American Society for Testing and Materials, Philadelphia, 1984. French Verification of P M Vessel Integrity, EPRI NP-6713, Electric Power Research Institute, Palo Alto, Calif, February 1990. Wallin, K., “The Scatter in K,-Results,” Engineering Fracture Mechanics, 19(6),
Johnson, L. G., “Operations Research in Life Testing” pp. 1-1 6 in Idustrial Mathematics, Vol. 8, 1957. “Material Properties,” Sect. XI, Article A-4000, AISME Boiler LRlci Pressure Vessel Code. An American National S t a h d , American Society of Mechanical Engineers, New York, 1994. Steinstra, D. Anderson, T. L., and Ringer, L. J., “Statistical Inferences on Cleavage Fracture Toughness Data,” Journal of Engineering Materials and TechnoZogy, 1121’3 1,3 1-37 (January 1990). Van Der Sluys, W. A., and Miglin, M. T., “Results of MPC/JSPS Cooperative Testing Program in the Brittle-to-Ductile Transition Region,” pp. 308-324 in Fracture Mechanics: TwentpFourth Volume, A S I U S P 1207, J. D. Landes, D. E, McCabe, and J. A. M. Boulet, Eds., American Society for Testing and Materials, Philadelphia, 1994. McCabe, D. E., Merkle, J. G., and Nanstad, R. K., “A Perspective on Transition Temperature and K, Data Characterization,” pp. 2 15-32 in Fracture Mechanics: Twenty-Fourth Volume, A S W S P 1207, J . D. Landes, D. E. McCabe, and J. A. M. Boulet, Eds., American Society for Testing and Materials, Philadelphia, 1994. McCabe, D. E., Zerbst, U., and Heerens, J., Development of Test Practice Requirements for a St&d Method on Fracture Tmghnes Testing in the Transition Range, GKSS Report 93M8 1, GKSS Forschungszentrum, Geesthacht GmbH, Geesthact, Germany, 1993.
1085-1093 (1984).
[U] Jones, M. H., and Brown, W. F., Jr., “The Influence of Crack Length and Thickness in Plane Strain Fracture Toughness Tests,” pp. 63-101 in Review of Developments in Plane Strain Fracture T a g h e m Testing, A S W S P 463, W . F. Brown, Jr., Ed., American Society for Testing and Materials, Philadelphia, 1970. Rolfe, S. T., and Novak, S. R., “Slow-Bend K, Testing of Medium-Strength High-Toughness Steels,” pp. 124-159 in Review of Developments in Plane Strain Fracture Toughness Testing, A S I M S P 463, W, F. Brown, Jr., Ed., American Society for Testing and Materials, Philadelphia, 1970. Nanstad, R. K., et al., Irradiation Effects on Fracture Toughness of Two High-Copper Submerged-Arc Welds, HSSI Series 5, NuREG/CR-5913, Vol. 1 (ORNUTM- 12156N1), Oak Ridge National Laboratory, Oak Ridge, Tenn., October 1992.
[MI
[fi]
DISCLAIMER
This report was prepared as an account of work sponsored by an agency of the United States Government. Neither the United States Government nor any agency thereof, nor any of their employees, makes any warranty, express or implied, or assumes any legal liability or responsi- bility for the accuracy, completeness, or usefulness of any information, apparatus, product, or process disclosed, or represents that its use would not infringe privately owned rights. Refer- ence herein to any specific commercial product, process, or service by trade name, trademark, manufacturer, or otherwise does not necessarily constitute or imply its endorsement, recom- mendation, or favoring by the United States Government or any agency thereof. The views and opinions of authors expressed herein do not necessarily state or reflect those of the United States Government or any agency thereof.