Estimation of movement and mortality of Atlantic menhaden during1966–1969 using a Bayesian multi-state mark-recovery model
Emily M. Liljestranda,⁎, Michael J. Wilberga, Amy M. Schuellerb
a Chesapeake Biological Laboratory, University of Maryland Center for Environmental Science, P.O. Box 38, Solomons, MD, 20688, USAbNational Oceanic and Atmospheric Administration, National Marine Fisheries Service, Southeast Fisheries Science Center, 101 Pivers Island Road, Beaufort, NC, 28516,USA
A R T I C L E I N F O
Handled by A.E. Punt
Keywords:Brownie dead recovery modelForage FishNatural mortalityFishing mortalityBrevoortia tyrannus
A B S T R A C T
Atlantic Menhaden Brevoortia tyrannus is an economically and ecologically important forage fish targeted bylarge-scale commercial reduction and bait fisheries. In the late 1960s, the National Marine Fisheries Serviceconducted a mark-recovery study in which they tagged over one million adult Atlantic Menhaden. Mark-re-capture models at the time did not allow for estimation of movement rates. Our objective was to reanalyze thesedata to simultaneously estimate natural mortality, fishing mortality, and movement probability during1966–1969. We developed a Bayesian version of the Brownie model that incorporated fishing mortality, naturalmortality, and movement among four regions of the northwest Atlantic continental shelf ecosystem at a monthlytime step. The model also accounted for both tag loss and tag detection probability. During May-June, an es-timated 91% of Atlantic Menhaden from North and South Carolina moved northwards. Atlantic Menhadenlargely remained within the same coastal region from June to October. In the winter, an estimated 55% of thetagged sample north of the Chesapeake Bay moved southward to the Chesapeake Bay and North and SouthCarolina. However, the fraction of the tagged sample undertaking these movements was substantially smallerthan previously described. The estimated instantaneous natural mortality rate, 1.17 yr−1 (1.09–1.23 yr−1, 95%CI), was greater than previously reported. Instantaneous fishing mortality was spatially and temporally variableand as high as 1.74 yr−1 in North and South Carolina during 1967. Understanding the historical seasonal spatialdynamics of this stock will improve contemporary survey design and management, as these dynamics maypersist today.
1. Introduction
Mark-recapture (or capture-recapture) studies can be used to esti-mate movement and survival from observations of marked individuals(Arnason, 1972, 1973; Brownie et al., 1993). However, simultaneouslyestimating movement and mortality rates from traditional taggingstudies remains challenging. Often, movement and mortality estimatesare confounded because emigration from the system is indistinguish-able from natural mortality using mark-recapture data (Hilborn, 1990;Schwarz and Arnason, 1990; Sibert et al., 1996). Obtaining preciseestimates from traditional mark-recapture studies that employ con-ventional tags typically requires large sample sizes or supplementaryinformation. Bayesian mark-recapture models have increasingly beenemployed to estimate movement and mortality parameters even whendata are missing or incomplete (Dupuis, 1995; Calvert et al., 2009).
Atlantic Menhaden Brevoortia tyrannus is an ecologically and
economically important forage fish that inhabits U.S. Atlantic coastalwaters from Maine to Florida (Fig. 1; Ahrenholz et al., 1991). AtlanticMenhaden are an important prey species for sea birds, predatory fishes,and cetaceans (Buchheister et al., 2017). Atlantic Menhaden supportthe largest fishery on the U.S. Atlantic coast by volume, with a totalallowable catch of 200,000 metric tons for 2017 (NMFS, 2015). Cur-rently, about 23% of these landings go towards the bait fishery, whichprovides bait for commercial and recreational species such as stripedbass Morone saxatilis, crabs, and lobster (SEDAR, 2015). The remaininglandings go towards the reduction fishery, where Atlantic Menhadenare processed to make fish oil and fish meal in large scale reductionfishery plants (SEDAR, 2015). Historically, the reduction fishery com-prised a much larger (≈95%) fraction of the total landings (SEDAR,2015).
The National Marine Fisheries Service (NMFS) conducted a large-scale mark-recovery study of Atlantic Menhaden during 1966–1969.
https://doi.org/10.1016/j.fishres.2018.10.015Received 16 March 2018; Received in revised form 11 October 2018; Accepted 15 October 2018
NMFS researchers injected 1,066,357 adult Atlantic Menhaden withindividually numbered ferromagnetic tags, which were then passivelyrecovered on magnets installed in reduction fishery plants (Ahrenholzet al., 1991). From these data, researchers determined qualitative mi-gration patterns and estimated the natural mortality rates of adultAtlantic Menhaden (Dryfoos et al., 1973; Nicholson, 1978; Reish et al.,1985). They concluded that the stock consisted of a single populationthat congregates in late autumn in waters along the North Carolinacoast and subsequently moves northward in the spring and summer
with older, larger individuals traveling farther north (Nicholson, 1978).The general description of the Atlantic Menhaden seasonal movementpatterns that emerged from these initial analyses supported earlierstudies that examined age, size structure, and effort of the commercialpurse seine fishery (June and Reintjes, 1959; Roithmayr, 1963;Nicholson, 1971). Although the seasonal patterns of Atlantic Menhadenmovement have been well described qualitatively, quantitative esti-mates of movement rates have not been determined (Dryfoos et al.,1973; Nicholson, 1978).
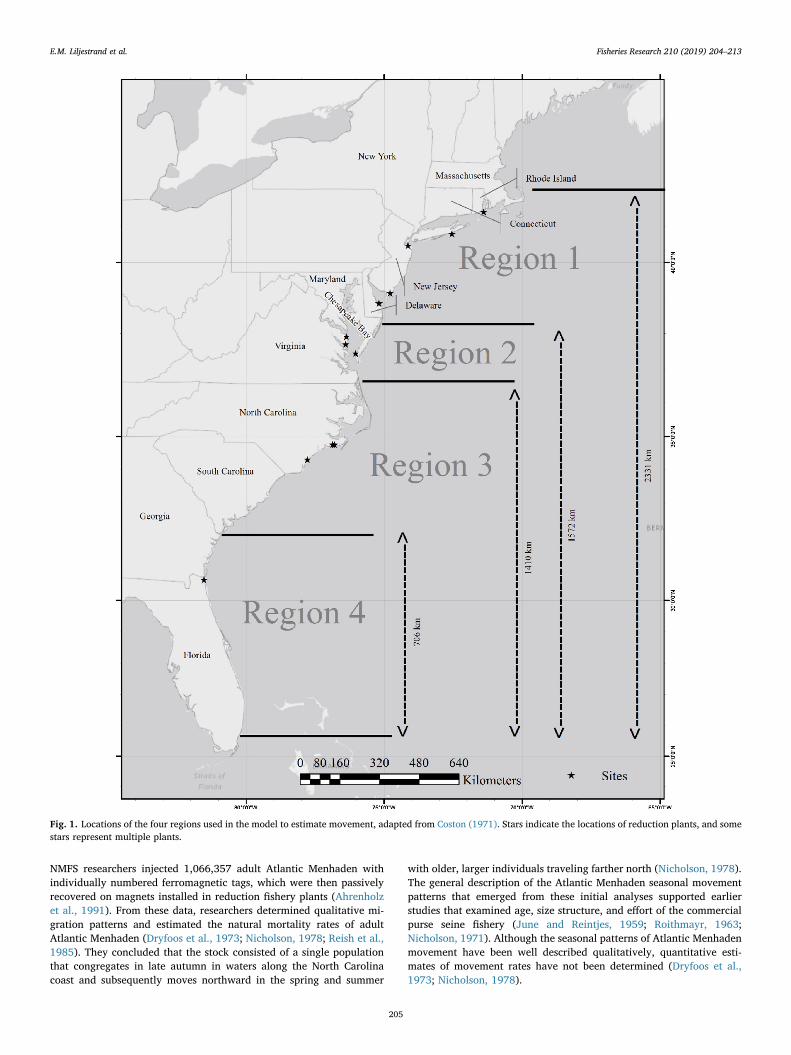
Fig. 1. Locations of the four regions used in the model to estimate movement, adapted from Coston (1971). Stars indicate the locations of reduction plants, and somestars represent multiple plants.
E.M. Liljestrand et al. Fisheries Research 210 (2019) 204–213
205
Advances in mark-recovery approaches allow the simultaneous es-timation of movement and mortality rates, thus the tagging study canbe used to estimate Atlantic Menhaden movement and mortality rates.Atlantic Menhaden seasonal movement patterns are of interest todaybecause evidence exists that the southward movement in the autumnand winter from the mid-Atlantic region may not be as substantial aspreviously believed. Larval Atlantic Menhaden abundance was high inthe mid-Atlantic during winter months indicating the presence of adults(Simpson et al., 2016, 2017). Our objectives were to estimate move-ment, natural, and fishing mortality rates for Atlantic Menhaden during1966–1969. We developed a Bayesian model that estimated naturalmortality, region- and time- specific fishing mortality, and monthlymovement. The model explicitly accounted for tag shedding/taggingmortality and tag reporting because supplementary studies were con-ducted to estimate values for these processes (Kroger and Dryfoos,1972).
2. Methods
We developed a Bayesian version of the Brownie dead recoverymodel parameterized with instantaneous mortality rates (Brownieet al., 1993; Hoenig et al., 1998) that also included movement amongfour regions (Fig. 1). The model estimated natural mortality, fishingmortality, and the probability of movement. The model was im-plemented using AD Model Builder (Fournier et al., 2012) and wasfitted to mark-recovery data from a large-scale tagging study of AtlanticMenhaden conducted during 1966–1969.
2.1. Mark-recovery data
The NMFS began capturing and tagging adult Atlantic Menhadenwith individually numbered ferromagnetic tags in July 1966 in NorthCarolina (region 3; Dryfoos et al., 1973). The program was expandedduring 1967–1969 to include the full range of the Atlantic Menhadenfishery, from Massachusetts to northern Florida (Fig. 1). AtlanticMenhaden were obtained from commercial purse-seine and pound-netcatches and by NMFS researchers through purse-seines, pound-nets, andhaul seines (Ahrenholz et al., 1991). Ferro-magnetic stainless steel tagswith rounded corners (14.0× 3.0× 0.5mm) were injected using hand-held tagging guns (Carlson and Reintjes, 1972; Kroger and Dryfoos,1972). A total of 1,066,378 individuals were released (Tables A.5-A.8).
Tags were recovered on magnets installed in the seven reductionplants in operation in region 3 in 1966 and 17 of the 18 reduction plantsin operation on the Atlantic coast during 1967-1969. The data weremaintained on computers at NMFS’s Southeast Fisheries Science Centerin Miami (SEDAR, 2015). The number of tagged fish released in eachmonth and region and the month and region of recovery were alsosummarized in Coston (1971). During a data transfer in the 1990s, theraw electronic data were lost. A printed copy of the data were recentlyredigitized to create electronic copies of both the recovery data anddata from reduction plant magnet efficiency trials (SEDAR, 2015). Therelease and recovery data were stored separately, but the numbers onthe ferromagnetic tags allowed us to match recovered individuals to aspecific time and location of release. However, approximately 20% ofthe release and recovery data remain lost due to damaged or missingdata from certain regions and years. Therefore, we used the mark-re-covery data summarized by region and month by Coston (1971), whichare complete, albeit less specific (because the data at the tag numberlevel were not included in the summary). Thus, we designed the modelas if the tags represented a batch mark. Because we were limited to thetemporal and spatial scale described in Coston (1971), the mark-re-covery model was similarly constrained to a minimum time step of onemonth and a maximum of five geographic regions. The efficiency ofmagnets to collect the tags was estimated using the redigitized datafrom the plant magnet efficiency trials.
We used a slightly modified version of the regions from Coston
(1971). Region 1 included waters north of the Maryland-Delaware line(lat 38°02′ N). Region 2 included Chesapeake Bay and the coastal wa-ters between lat 36°35′ N and the southern boundary of region 1. Re-gion 3 included North and South Carolina between lat 32°02′ N and thesouthern boundary of region 2, and region 4 included Georgia andFlorida, the waters south of region 3 (Fig. 1; Coston, 1971). Locations ofwhere the tagged fish were recovered were not recorded. Rather, thedata indicate the region of the processing plant where the metallic tagwas recovered. However, this is thought to be a reliable proxy of theregion of capture because the regional boundaries were chosen in sucha way that they largely separated fishing grounds from reduction plantsin different regions (Coston, 1971; SEDAR, 2015).
Region-specific tag shedding and tagging mortality rates were esti-mated by the original researchers using laboratory experiments of tagshedding and the observed average size of individuals in each region(Kroger and Dryfoos, 1972; Dryfoos et al., 1973). The region-specificproportion of individuals experiencing tag shedding and tagging mor-tality (combined) was 0.1 in region 1, 0.2 in region 2, 0.25 in region 3,and 0.4 in region 4, which were originally reported in Dryfoos et al.(1973), but sample sizes and uncertainty were not reported.
Supplementary data on the total landings and effort of each re-duction plant for each month during 1966–1969 were provided by theNMFS Southeast Fisheries Science Center. Fishing effort for each re-duction plant was reported in vessel weeks, the number of vessels thatwere in operation for at least one day during a week. During December-March, most reduction plants outside region 3 suspended operations.No releases were conducted during November-May. This limited ourability to estimate monthly movement rates for the May to Novemberperiod.
2.2. Magnet efficiency trials
Experiments were conducted to test the efficiency of magnets forcollecting tags by introducing batches of tagged Atlantic Menhaden(usually 100 fish) directly into each reduction plant. These trials wereconducted approximately once a week when the plant was in operation,and the total number of trials in each plant varied from 18 to 152,averaging 56 over the course of the 3.5 years of the mark-recoverystudy. Raw data of the trial outcomes were available, but the values ofmagnet efficiency used in previous models were not. Therefore, weestimated magnet efficiency by plant, and from those estimates, cal-culated magnet efficiency by month and region in a way that matchedthe spatial and temporal scale of the current model. A full description ofthe types of magnets their distribution in reduction plants is available inAhrenholz et al. (1991).
The magnet efficiency for each plant was estimated from the effi-ciency trial data across all four years. For each trial, a, and plant, p, thelikelihood of recovering x individuals from a batch of n releases wasmodeled using a binomial distribution and the estimated magnet effi-ciency for that plant, εp. We estimated magnet efficiency for each plantby minimizing the negative log likelihood, NegLLp,
∑ ⎜ ⎟= − ⎛⎝ −
− ⎞⎠
−NegLL nx n x
ε εlog !! ( )!
(1 )pa
ea
a a apx
pn x( )a a a
(1)
Because the recovery data were summarized by region and theamount of harvest by each plant varied over time, we calculatedmagnet efficiency for region, r , and at time, t , by averaging the effi-ciency of each plant, εp, weighted by the proportion of landings (in-dividuals), L, from that plant,
∑=∑
εε L
Lt rp
p t p
p t p,
,
, (2)
If a reduction plant had recorded landings at a given time, but therewere no magnets installed, indicated by an absence of data for thatplant in the redigitized data, εp, was set to 0. This applied to all
E.M. Liljestrand et al. Fisheries Research 210 (2019) 204–213
206
reduction plants in regions 1, 2, and 4 in 1966, and one plant in whichno magnets were installed for the four years of the study. The results ofthese magnet efficiency trials were assumed to be known at their esti-mated values, rather than including process error, to simplify themodel. We also assumed that the proportion of landings in each plantfor each month/region combination are known without error.
2.3. Mark-recovery model
The mark-recovery model was an instantaneous rate version of theBrownie dead recovery model (Hoenig et al., 1998) modified to allowmovement among four regions (Fig. 1). Variables used in the model andtheir descriptions are available in Table 1. The model tracked taggedcohorts of individuals released from a single region and month. Weassumed that all individuals in a cohort experienced the same dynamicsregardless of age or release location within the region. The number ofindividuals from a cohort released in region, R, at time, T , that werealive in region, r , at time, t , NT R t r, , , , was calculated using time- andregion-specific movement and survival rates. The initial magnitude ofthe cohort was calculated by applying the region-specific taggingmortality rate, GR, to the releases, IT R, ,
= −N I G(1 )T R T R T R R, , , , (3)
We assumed that region-specific tagging mortality was known andthat tagged individuals were well mixed and independent. Survival and
movement were modeled as sequential processes with movement oc-curring after survival in each time step. Abundance of the cohort aftersurvival but before movement, +N *T R t r, , 1, , was calculated from region-and time- specific survival rates, St r, ,
=+N N S*T R t r T R t r t r, , 1, , , , , (4)
Our model included the assumption of no movement during themonth of release by applying movement after monthly mortality. Noindividuals were recovered outside of their release area during themonth of release.
Survival rates were estimated from the time- and region-specificinstantaneous fishing, Ft r, , and natural, M , mortality rates,
= − −S et rM F
, t r, (5)
Natural mortality was assumed to be constant over regions andtime, and the fishing mortality rate for a given region and time wascalculated as the product of month- and region- specific catchability,qm r, , and fishing effort, Et r, ,
=F q Et r m r t r, , , (6)
Catchability was calculated as the product of a region-specific ef-fect, Qr , and a month-by-region effect,
=q Q em r rθ
, m r, (7)
This parameterization for catchability assumes that catchability fora month and region was constant over years. For the parameters to beuniquely identifiable, θm r, in July was set to 0, and for month-regioncombinations without fishing effort, qm r, , was set to 0 (Table A.1). Afteraccounting for survival, the vector of abundance of a cohort in eachregion, +NT R t, , 1, was calculated as the product of the movement prob-ability matrix, φ̂ , and the vector of post survival abundance by region,N*T R t, , ,
=+ ˆN φN*T R t T R t, , 1 , , (8)
Each element of a movement matrix indicated the probability of anindividual moving from the region indicated by that column to theregion indicated by that row during that time step. Movement para-meters were estimated for each month during May – October. Monthlymovement parameters could not be estimated during October – Maybecause reduction plant operations were suspended in regions 1, 2, and4 during the winter and early spring, and in all regions during February– March. Movement rates were only estimated for one month duringOctober-May, and φ̂ was fixed as an identity matrix for the remainingmonths. We assumed that the monthly movement rates from October-November reflect all net movement between October and May.
The estimated recoveries for each cohort were the product of time-and region- specific abundance, NT R t r, , , , the proportion of mortality dueto fishing, and the fraction of the population that died (i.e., the Baranovcatch equation; Quinn and Deriso, 1999), and the time- and region-specific magnet efficiency rate,
= − − −C NFZ
e ε(1 )T R t r T R t rt r
t r
M Ft r, , , , , ,
,
,,t r,
(9)
We assumed that there was no additional natural mortality betweenrelease and recovery in the first month (t= T, r=R) after release (forcalculation of NT R t r, , , ). Individuals were tagged adjacent to or onboardcommercial purse seining vessels (Pristas and Willis, 1973). Conse-quently, tagged fish were immediately released in the same localizedareas as the commercial fishery. However, the model includes si-multaneous fishing and natural mortality such that the number of ex-pected recaptures is affected by natural mortality in the first monthafter release.
Table 1Symbols used in estimation model with description and values.
Variable Description Value
m Month 1–12 from January-December
T Time of cohort release 1–42, 1: July 1966, 42:December 1969
t Time of cohort presence 1–42, 1: July 1966, 42:December 1969
R Region of cohort release See Fig. 1r Region of cohort presence See Fig. 1dr Lateral distance between 25° 45’ N and a
region's northern boundarySee Fig. 1
Likelihood componentsNegLLc Negative log likelihood for recoveriespq Log prior for catchabilitypφ Log prior for movement ratesPq Log posterior for catchabilityPφ Log posterior for movement rates
DataL LandingsE EffortIT,R Releases See Table A.1.5-A.1.8JT,R,t,r Recoveries
Specified quantitiesε Magnet efficiency See Table 2GR Tag Shedding/Mortality 1: 0.1, 2: 0.2, 3: 0.25, 4:
0.4k Overdispersion value 2.5v Effective sample size of dirchelet
distribution10
w Average swimming speed 3 lengths/secl Average length of tagged menhaden 19.38 cmσq Variance for distribution of total
catchability1
Calculated quantitiesNT,R,t,r Abundance of a tagged cohortSt,r SurvivalFt,r Fishing mortalityqm,r CatchabilityCT,R,t,r Estimated Recoveriesσm Variance of diffusion process for migration priorsφi,j Prior probability of movement
E.M. Liljestrand et al. Fisheries Research 210 (2019) 204–213
207
2.4. Parameter estimation
We estimated the parameters using a Bayesian approach. The ob-jective function was the sum of the negative log of the prior prob-abilities and the negative log likelihood for the recovery data,
= + +P NegLL p pc φ q (10)
We assumed that the estimated recoveries followed a negative bi-nomial distribution, with an overdispersion value k = 2.5, where Jdenotes the observed recoveries,
∑ ∑ ∑ ∑
⎜ ⎟ ⎜ ⎟
=
− ⎛
⎝⎜
+ ⎛⎝ +
⎞⎠
⎛⎝ +
⎞⎠
⎞
⎠⎟
>
NegLL
Γ k JΓ k Γ J
kk C
Ck C
log( )( ) ( )
c
T R t T r
eT R t r
T R t r T R t r
kT R t r
T R t r
J, , ,
, , , , , ,
, , ,
, , ,
T R t r, , ,
(11)
We assumed a negative binomial distribution, rather than a multi-nomial or Poisson distribution, to better address data overdispersion,which is frequently a feature of tagging data, especially when effort ispatchy and the species schools (Michielsens et al., 2006). The over-dispersion arises, in part, because the number of fish in each month andregion from a tagged cohort is unknown. We assumed that tag re-coveries were independent. We used this distribution because thenumber of tagged individuals in each region and time was unknown.We specified the value for k because testing using simulated data in-dicated that it was not estimable. While it is possible that k may havebeen estimable with a strong, informative prior, we chose to evaluatethe effects of our assumptions through sensitivity analyses instead.
A uniform prior was placed on natural mortality, which constrainedthe value between 0.006 and 148.4 per month, (-5 and 5 on the logscale),
∼M U (0.006, 148.4) (12)
The data were too sparse at certain times and regions to estimatemovement probabilities without imposing a prior. We included weaklyinformative priors on the movement probabilities by assuming that theyfollowed a Dirichlet distribution with means generated from a one-di-mensional diffusion model. A weakly informative prior that mimickeddiffusion dynamics was more appropriate than an uninformative, flatprior which unrealistically assumes movement to an adjacent region isequivalent to movement to a non-adjacent region in the same time. Weassumed that the effective sample size, v, of the Dirichlet distributionwas 10. The negative of the natural logarithm of the Dirichlet dis-tribution (with additive constants removed) was
∑ ∑ ∑= − ˆp vφ φlog ( )φm r r
m r r e m r r1 2
, 1, 2 , 1, 2(13)
For values of v below about 5, it was difficult to estimate theparameters, and for values above 10, the prior began to have a no-ticeable effect on the movement parameter estimates. We used an ef-fective sample size of 10 because it achieved a reasonable balance be-tween the data and the prior informing the estimates.
The one-dimensional diffusion model described the probability ofan individual moving a distance north or south as a normal distribution.The distribution of distance traveled from the center of a region in onemonth had mean zero and standard deviation, σw. The standard de-viation was calculated from an average swimming speed per day andnumber of days in a month (i.e. the distance traveled under directedswimming). We used a mean length, l, 19.38 cm, estimated from thetagged fish that also had length information (about 5% of the fishtagged). We used an average directed swimming speed of 3.0 bodylengths per second, which was slightly greater than the 2.5 lengths/second maximum measured by Durbin and Durbin (1975) duringfeeding, because we assumed feeding would be slower than swimmingduring non-feeding times. The mean prior probability of moving from
region j to region i, φi j, was calculated by integrating the probabilitydensity over the distance between the center of starting region and theending region’s northern and southern boundaries. The limits of in-tegration, a and b were unique for each regional transition (Table A.9),
∫=−
φσ π
e dx12
i ja
b
w
xσ
, 22 w
22
(14)
The winter priors were designed differently, because if diffusion wasassumed across a six-month period, a majority of individuals would beexpected to be outside of the natural range of Atlantic Menhaden. Forthe half-year movement matrix that describes the October to Mayperiod, the prior values were calculated assuming individuals move toeach region in proportion to the north-south distance within a region,and was independent of the starting location.
Catchability was conditioned such that deviations from the mean onthe log scale were normally distributed,
∑ ∑=−
pq q
σ(log ( ) log ( ))
2qm r
e m r e
q
,2
2(15)
The variance of the prior for catchability, σq2, was set to 1.0, to allow
for substantial variation in catchability among regions and months. Thejoint posterior distribution of the parameters was characterized usingMarkov chain Monte Carlo (MCMC) with a Metropolis-Hastings algo-rithm in ADMB. We ran three parallel MCMC chains for 4,000,000iterations, thinning the chains by saving every 1000th iteration. Thefirst half of each chain was discarded as a burn in (Gelman et al., 2004).Posterior distributions from the MCMC were characterized in R andconvergence was assessed using Geweke and Gelman-Rubin con-vergence diagnostics (Geweke, 1991; Gelman and Rubin, 1992). Equal-tailed credibility intervals (CI) were defined by the 2.5 and 97.5 per-centiles of the posterior distributions.
2.5. Sensitivity analysis
We conducted sensitivity analyses to evaluate the effect of the priorsand assumed constants on the model estimates. We evaluated themodel’s sensitivity to the prior distributions on catchability and themovement parameters by doubling or halving the standard deviationaround catchability or the effective sample size of the Dirichlet dis-tribution. Model sensitivity to the movement priors was evaluated byincreasing or decreasing the assumed average swimming speed by 0.5body lengths per second, and increasing or decreasing the over-dispersion parameter to 1.0 or 4.0. Sensitivity was also tested by fixinginstantaneous yearly natural mortality at 0.82 yr−1, the average naturalmortality at age from the most recent stock assessment (SEDAR, 2015),weighted by age composition of the tagged individuals; about 1% oftagged individuals were sampled for age. Sensitivity was summarized asthe change in estimates of M, the average total catchability, and theaverage yearly instantaneous fishing mortality from the base model.
2.6. Net movement
To determine the net effect of monthly movement, we simulatedreleases of individuals from each region in May and determined thelocation of those individuals after one year of movement using the es-timated movement parameters. The simulation was run without fishingor natural mortality to isolate the effect of movement. The results weresummarized as the number of individuals in each region during May.
3. Results
During July 1966 - December 1969, 17 of the 18 operating AtlanticMenhaden processing plants were evaluated for the efficiency of theirmagnets to collect tags. With the exception of one processing plant,with an estimated 23% efficiency, the efficiency of magnets in each
E.M. Liljestrand et al. Fisheries Research 210 (2019) 204–213
208
plant ranged from 59% to 92% (Table 2). Region 1 had the lowestaverage magnet efficiency, and region 3 had the highest averagemagnet efficiency.
The model fit the observed recoveries relatively well across the fourregions (Fig. 2; Fig. A.1). Increased returns in the summer and fall werepresent in both the expected and observed values. The model under-estimated returns in 1967 and 1968 in regions 1, 2, and 4, but over-estimated returns in region 3. Region 3 had the poorest fit overall, butthe fit improved after the first year.
The estimated movement probabilities indicated net northwardmovement in the spring and net southward movement in the late falland winter. More than 95% of individuals were expected to stay in thesame region from month to month during June-October, with a singleexception; approximately 25% of individuals were estimated to movefrom region 3 to region 2 in June (Fig. 3; Table A.10). During May-Junethe estimated movement rate from region 3 to region 2 was about 86%.During the winter, most individuals in regions 3 and 4 remained in thesame region, but 55% and 33% of individuals left regions 1 and 2, re-spectively. The majority of the departures from regions 1 and 2 were toregion 3. During the winter, the second highest estimated movementprobability from region 4, 0.43, was also to region 3.
Individuals released in region 1 exhibited a net southward move-ment, while individuals released in regions 3 and 4 exhibited netnorthward movement (Table 3). In simulations of releases in each of thefour regions, 44–62% of the individuals released in regions 1, 2, and 4
were in their respective starting region one year later. Approximatelyhalf the individuals released in region 3 were in region 2 one year later.
The estimated instantaneous natural mortality rate across all re-gions and months was 0.098 mo−1 (0.091 - 0.102, 95% CI), whichcorresponds to an instantaneous natural mortality rate of 1.17 yr−1
(1.09–1.23, 95% CI). The estimated instantaneous fishing mortality ratewas relatively stable over years in each region. Fishing mortality wasgreatest in 1967 for all regions except region 1 (Fig. 4). Region 3 hadthe highest average fishing mortality rate (1.66 yr−1), more than sixtimes the second largest value, 0.25 yr−1, in region 2. Average fishingmortality was about 0.18 yr−1 in region 1 and 0.10 yr−1 in region 4.
The month with the highest average fishing mortality rate was Julyfor regions 1, 2, and 3, and April for region 4 (Fig. 5). In regions 1 and2, fishing mortality rates peaked at 0.07-0.08 mo−1. Fishing mortalityin region 4 peaked at 0.02 mo−1, but also exhibited similar valuesthroughout the summer and fall. Maximum monthly fishing mortalityrates in regions 1, 2, and 4, were much lower than the average monthlyfishing mortality rate in region 3, which was 0.17 mo−1. The maximumfishing mortality rate in region 3 was 0.45 mo−1 in July, but fishingmortality remained high into the early winter.
Catchability had different yearly and monthly patterns than fishingmortality because effort was not spatially or temporally uniform.Catchability varied considerably among months and regions, rangingfrom 1.47×10⁻⁴ to 0.013 and averaging 0.0025 vessel week-1. Region3 had the greatest average catchability, 0.006 vessel week-1, and thelowest average catchability, 7.69×10⁻⁴ vessel week-1, was estimatedin region 2. During May-November catchability decreased in regions 1,2, and 3, but stayed approximately the same throughout most of theyear in region 4 with an increase at the end of the year.
The model exhibited low to moderate changes in response to thesensitivity analyses. Changing the prior probabilities for the movementrate parameters by adjusting the average swimming speed changed themortality or average catchability parameter estimates by less than 10%(Table 4). Both increasing or decreasing the average swimming speedincreased estimated natural mortality and decreased estimated averagecatchability and fishing mortality. Estimated monthly movement rateswere insensitive to changes to w, σq, k, or M. Decreasing the effectivesample size of the Dirichlet distribution to 5 reduced the fraction of
Table 2Average efficiency of magnets in reduction plants and the number of plants ineach region. Efficiency was calculated from efficiency trials, where a knownnumber of tagged Atlantic Menhaden were introduced directly into the re-duction plant. The average efficiency was the average among plants weightedby the landings for each plant within a region.
Region Magnet Efficiency Number of Plants
1 0.52 42 0.61 73 0.78 74 0.70 2
Fig. 2. Predicted (line) and observed (circles) number of recovered tags for each month after June 1966 in by regions. The predicted values are the median of theposterior probability distribution and the error bars indicate 95% credibility intervals.
E.M. Liljestrand et al. Fisheries Research 210 (2019) 204–213
209
individuals remaining in region 1 during the winter by 0.29 and in-creased the fraction of individuals remaining in region 4 by 0.18. Thegeneral patterns of movement were consistent across sensitivity tests.
Decreasing the effective sample size of the Dirichlet distribution byhalf had the greatest effect on the parameter estimates (Table 4), withaverage catchability increasing by 61% and average fishing mortalityincreasing by 57%. This was caused mostly by a large increase in fishingmortality in region 1. In contrast, increasing the effective sample sizehad little effect (< 5% change) on the average catchability or fishingmortality. Fixing the natural mortality at 0.82 yr−1, had the secondlargest effect on the other parameter estimates among the sensitivityanalyses (Table 4), with average catchability increasing by about 37%and average fishing mortality increasing by about 32%.
Decreasing the standard deviation for the catchability prior, σq,resulted in average catchability decreasing by 10%, and increasing thestandard deviation resulted in average catchability increasing by 12%.The average fishing mortality rate decreased by 5% when σq was de-creased to 0.5. Similarly, decreasing the overdispersion parameter alsodecreased the average catchability by 17%, and increasing the over-dispersion value increased the catchability by about 27%. Estimatedfishing mortality did not change more than 4% when the overdispersionparameter was adjusted.
4. Discussion
We used data from a large-scale mark-recovery study to simulta-neously estimate Atlantic Menhaden movement and mortality ratesduring 1966–1969. We found that during May to June 86% of
Fig. 3. Estimated movement rates for eachmonth May through October and betweenOctober and May. Each pie chart shows thefraction of the population in a region that wasestimated to move to each of the other regions.Colors indicate regions: Region 1- black,Region 2- dark gray, Region 3- light gray, andRegion 4- white.
Table 3Proportion of individuals in each region without fishing or natural mortalityfrom simulated releases of 1000 individuals in each region beginning in Mayand ending in May the following year, following the pattern of movement es-timated in the model.
Release Region
1 2 3 4
Region After 1 Year 1 0.438 0.179 0.167 0.0062 0.271 0.619 0.579 0.0083 0.288 0.2 0.241 0.4494 0.004 0.001 0.013 0.537
Fig. 4. Estimated instantaneous fishing mortality rates (F yr−1) for AtlanticMenhaden by year and region. Error bars indicate 95% credibility intervals.
Fig. 5. Estimated average instantaneous fishing mortality rates (F mo−1) forAtlantic Menhaden by month and region. Error bars indicate 95% credibilityintervals.
Table 4Sensitivity analysis results. Columns indicate the estimated parameter values,or average value, and the percent difference from the baseline value. M isnatural mortality, Average Q is catchability averaged across all estimated va-lues, and Average F is yearly fishing mortality averaged across all years andregions. Rows indicate sensitivity scenarios.
E.M. Liljestrand et al. Fisheries Research 210 (2019) 204–213
210
individuals from region 3 moved northward into region 2, and then amonth later 25% of individuals from region 3 also moved to region 2.During June to October, individuals mainly stayed within the sameregions. In the winter, the majority of individuals (71–81%) from theregions north of North Carolina (regions 1 and 2) remained in these twonorthernmost regions; 45% of individuals from region 1 and 68% ofindividuals from region 2 stayed in their respective regions during thewinter.
Our estimated movement patterns were similar to those identified inprevious research, but differed in the magnitude of movement duringthe winter in the northernmost regions. From October to May we foundthat about 55% of individuals from region 1 moved southwards intoregions 2 and 3. In contrast, Roithmayr (1963) and Nicholson (1971)concluded that the “majority” of the Atlantic Menhaden populationoverwinters south of North Carolina (region 3) based on purse-seinefishery effort and age and length distributions. Dryfoos et al. (1973)qualitatively examined movement using the same mark-recovery dataset used in this study using yearly time steps. They describe that duringthe North Carolina fall fishery, individuals from progressively morenorthern areas are caught, but they did not have the temporal resolu-tion to estimate movement rates from summer to fall (Dryfoos et al.,1973). Dryfoos et al. (1973) estimated movement on a yearly time scalefrom summer 1967 to summer 1968 and from summer 1968 to summer1969. They estimated movement as the proportion of tags recovered inone region that originated from each region or as the proportion re-leased in one region that were recovered in each region. They foundthat more than 99% of individuals released in regions 1 and 2 wererecovered in those regions one year later, which is higher retention thanwe estimated in our simulations (Table 3; Dryfoos et al., 1973). Ourestimated movement patterns in the spring and summer were similar tothose described by Dryfoos et al. (1973).
The differences between our findings and those of previous researchare likely due to different approaches used to analyze the data. Previousresearch took the lack of Atlantic Menhaden schools sightings bycommercial fishermen in northern coastal surface waters as an indica-tion of southward movement, though absence may be caused by ver-tical or offshore migration (June and Reintjes, 1959). Reported ab-sences of Atlantic Menhaden may also be due to low fishing effort.Fishing effort was used as a proxy for regional presence-absence instudies of Atlantic Menhaden movement and mortality (Roithmayr,1963). However, effort is not only determined by fish abundance, andcan be influenced by poor weather, economic factors, and movement offish vertically or offshore (Mangel, 1982). Our finding that AtlanticMenhaden appear to overwinter in the northern part of their rangeagrees with recent studies of larval distribution. Simpson et al. (2016)found high Atlantic Menhaden larval abundance in near-shore watersduring the winter in our regions 1 and 2. This pattern was relativelyconsistent over the period of their study, 1977–2013, suggesting asubstantial number of adults in those areas during winter. Furthermore,consistency of the pattern of larval abundance during 1977–2013 mayindicate that the movement patterns we estimated from the late 1960sare still relevant today.
Our model estimated natural mortality to be 1.17 yr−1, which wasabout 2.3 times greater than previous estimates, ranging from 0.50yr−1 to 0.52 yr−1 (Dryfoos et al., 1973; Reish et al., 1985). Dryfooset al. (1973) used catch curve analysis of the 1966–1968 commercialcatch to estimate total mortality (1.47 yr−1), and subtracted off fishingmortality (0.95 yr−1), to estimate natural mortality. Our natural mor-tality estimate should be more reliable because it is estimated from themark-recovery data rather than the age structure of catch. Furthermore,testing of the mark-recovery model revealed that estimated naturalmortality was relatively unbiased (Liljestrand et al., 2018). Based on theprevious estimates, the most recent stock assessment used an age-varying natural mortality rate, ranging from 0.52 to 1.23 yr−1, which isscaled by weight to the tagging estimate 0.50 yr-1 for age 4-6+ in-dividuals (SEDAR, 2015). Given the structure of the model, a time-
varying natural mortality rate was not estimable, though realistically,conditions such as predator abundance and temperature likely lead tovariation in natural mortality. Consequently, the variance in naturalmortality in this model represents uncertainty about mean naturalmortality, and spatial and temporal variation in natural mortality maybe reflected in the estimated fishing mortality rates.
Underestimating natural mortality can result in an overestimate offishing mortality (Clark, 1999). If fishing mortality is overestimated,excessive limitations may be put in place, which may not achievemanagement objectives. The high average yearly fishing mortality, 1.66yr−1, in region 3 is reasonable because this is a large and centralizedregion that can support a high abundance of Atlantic Menhaden. Ad-ditionally, we found that many individuals move into region 3 fromOctober to May, which could support high landings during the sub-stantial North Carolina fall fishery.
A primary limitation of our analysis was that we could not estimatemonthly movement during winter and spring because there was littlefishing effort, and thus few or no recoveries. We treated October to Mayas one period for movement, which meant that the movement rate es-timates represented the net effect of movement over this period. Havingsuch a long time step may mask the movement that occurred at ashorter time scale. For example, seasonal movement may have occurredas late as November and December, and northward movement mayhave begun as early as April (Nicholson, 1971). Because our model onlyaccounts for net movement between those months, it cannot discern ifindividuals from northern regions are moving southward then returningto their initial region within that period. However, the high levels oflarval abundance in northern regions during the winter indicate thatAtlantic Menhaden are likely overwintering in the northern portion oftheir range (Simpson et al., 2016). If a majority of the populationmoved southward then northward from October to May, we would notexpect abundant larvae in the northern regions during winter. Usingotolith microchemistry Anstead et al. (2017) estimated that approxi-mately 30% of age-2 and -3 Atlantic Menhaden used northeastern es-tuaries as nursery habitat. They attributed the relatively large fractionof individuals from this region to larger fecund females being present inthese regions during the summer and fall. However, juvenile agingwork in Chesapeake Bay indicated that most young-of-the-year resultedfrom spawning during late winter (Atkinson and Secor, 2017). Thus,winter spawning in northern regions could also explain Anstead et al.’sfindings.
Our model did not allow for age-specific movement or fishingmortality rates because age data were not present in the Coston (1971)summaries of releases and recoveries. Larger, older individuals arethought to travel farther north during summer (Nicholson, 1978). Bynot including age structure, our model estimates an average movementrate for the ages that were tagged; the average age at tagging was 1.35years. Our model also assumes that all ages and regions experience thesame natural mortality rate.
Adult Atlantic Menhaden of the same age and length tend to schooltogether (Smith, 1991), which may violate model assumptions of in-dependence and no age effect for movement. Tagged individuals from abatch of 100 tags could remain together in a school, so the probabilityof catching one may increase the probability of catching others from thesame release. However, the data showed that individuals from the samebatch of tags were usually recovered over several weeks and by severalplants. Therefore, the assumption of independence among recoveriesseems reasonable. Older individuals are hypothesized to not be assusceptible to fishing mortality because there are fewer large in-dividuals and therefore smaller schools (SEDAR, 2015). If the reductionfishery selectively harvests larger schools, then the fishery may beharvesting younger, smaller individuals because Atlantic Menhadenschool by age, and younger individuals should be more abundant thanolder ones (Smith, 1991). If fishing mortality rates decreased for olderages, our estimate of the natural mortality rate may be biased high, andthe movement rate estimates may disproportionally reflect the
E.M. Liljestrand et al. Fisheries Research 210 (2019) 204–213
211
dynamics of smaller, younger individuals.The model included assumptions about detection efficiency that
may have oversimplified the tag recovery process. Two kinds of mag-nets were installed in the reduction plants: primary magnets located atthe conveyer system collected about 85% of the tags within the first twodays of processing, and secondary magnets in other locations of theplants, which often did not accumulate tags until months after the in-dividual entered the plant and were not checked as regularly (Dryfooset al., 1973). The Coston (1971) data did not identify whether a tag wasrecovered on a primary or secondary magnet. Therefore, some re-coveries may have been misattributed to later months. One reductionplant in region 2 never had magnets installed. The model accounted forthis lack of magnets in the landings-weighted average magnet efficiencyby assuming magnet efficiency of zero for this plant.
Because our estimates indicated less movement than previous stu-dies, it is possible that our estimates simply reflected the priors thatassumed a substantial probability of staying in the same region. Themonthly movement rate estimates did not seem to be overly-influencedby the priors. In the sensitivity analyses, changing the prior Dirichletdistribution did not substantially change the monthly movement rateestimates. Doubling or halving the effective sample size, which re-spectively increases or decreases the influence of the prior, did notchange any monthly movement rate estimates by more than 0.09 mo−1.Furthermore, the estimated monthly probability of staying in the sameregion was usually higher than the mean of the prior distribution.
Improving understanding of Atlantic Menhaden movement patternsmay assist current management efforts. Movement can have importantimplications for assessment accuracy and fishery management re-ference points (Goethel et al., 2011; Lauretta and Goethel, 2017).Changing fishery management practices with consideration for spatio-temporal distribution has been shown to increase biomass and catch insimulation models (Fahrig, 1991; Walters et al., 1993; Pelletier andMagal, 1996). Including spatial considerations in stock assessmentmodels can also lead to large changes in the estimated fishing mortalityrates (Langseth and Schueller, 2017). Introducing spatial dynamics intoAtlantic Menhaden assessment and management may be importantgiven changes in the reduction fishery industry since the 1970s. As of2005, there is only one remaining menhaden reduction fishery on theeast coast, located in Chesapeake Bay (SEDAR, 2015). Therefore, thereduction fishery principally operates between North Carolina and NewJersey (primarily our region 2) and does not extend throughout theAtlantic Menhaden’s full range. If the population is not as well-mixed aspreviously believed, this may have consequences for the perceivedabundance based on the catch. Additionally, the bait fishery, whichextends throughout the full geographic range of this species, has begunto constitute a larger fraction of the total Atlantic Menhaden landings inrecent years (SEDAR, 2015; Smith and O’Bier, 2011).
Our model required supplementary information on tagging mor-tality, detection efficiency, fishing effort, and landings. Experiments toquantify tag mortality and loss and to determine which tag type andtagging method minimized tagging mortality have aided several otherforage fish studies (Fridriksson and Aasen, 1950; Hamre, 1970;Dommasnes, 1978). The passive tag recovery system used in this mark-recovery study facilitated experiments to estimate detection efficiency,which is necessary to distinguish between natural and fishing mortality(Pollock et al., 2001). There was insufficient information in the mark-recovery study alone to estimate natural and fishing mortality, but itwas possible to distinguish these mortality rates by including fishingeffort data.
Ideally, a mark-recovery study on a forage fish species such asAtlantic Menhaden would include sampling over all periods and re-gions. If the entire geographic range is not considered in the samplingdesign, then emigration becomes indistinguishable from natural mor-tality (Schwarz et al., 1993). Because over 1 million adult AtlanticMenhaden were tagged in this mark-recovery study, relatively lowmovement rates were estimable (e.g., 5% transition from region 3 to
region 1 from May to June). However, a more uniform distribution offishing effort would likely have improved our ability to estimatemovement rates (Liljestrand et al., 2018).
Tags that allow continuous tracking have become popular forstudying movement. However, small species, such as most forage fishes,require small tags. Because we are limited in our ability to use con-tinuous tracker tags on forage fishes, it is important to continue de-veloping and improving dead recovery tagging models. Conventionaltagging methods such as those used in this study, with a single re-covery/detection event were used to monitor forage fish in the 1970s(IMARPE, 1972; Leary and Murphy, 1975) and are still used today(Isley and Tomasso, 1998; Ely et al., 2008).
We found that there may be less southward movement of AtlanticMenhaden during the winter than previously described and that naturalmortality may be greater than previously estimated. Having a sizablepopulation of Atlantic Menhaden in the north may influence samplingdesign and the distribution of fishing in the future. Winter surveys mayneed to direct additional effort north of the Chesapeake Bay to suffi-ciently sample and characterize the stock. Fisheries for AtlanticMenhaden may be feasible in new regions in the north. We recommendthat the 1.17 yr−1 estimated natural mortality rate be used in futurestock assessments. Additionally, we recommend that future surveys bedesigned to sample the Atlantic Menhaden stock over its full range.
Declarations of interest
None
Acknowledgments
We thank the original researchers for conducting this mark-recoverystudy and the Atlantic States Marine Fisheries Commission for fundingthe effort to redigitize the data. Ray Mroch provided harvest and effortdata, Joseph Smith assisted with the proposal for our study, and TomMiller who offered suggestions to improve this research and providedhelpful comments on a previous draft of this manuscript. We also thankthe two anonymous reviewers who provided comments and suggestionsto improve this manuscript. This research was supported by MarylandSea Grant, through the graduate research fellowship program [grantnumber NA14OAR4170090].
Appendix A. Supplementary data
Supplementary material related to this article can be found, in theonline version, at doi:https://doi.org/10.1016/j.fishres.2018.10.015.
References
Ahrenholz, D.W., Dudley, D.L., Levi, E.J., 1991. Overview of mark-recovery studies onadult and juvenile Atlantic menhaden, Brevoortia tyrannus and Gulf menhaden, B.patronus. Mar. Fish. Rev. 53, 20–27.
Anstead, K.A., Schaffler, J.J., Jones, C.M., 2017. Contribution of nursery areas to the adultpopulation of Atlantic menhaden. Trans. Am. Fish. Soc. 146 (36), 46.
Arnason, A.N., 1972. Parameter estimation for mark-recapture experiments on two po-pulations subject to migration and death. Res. Popul. Ecol. 13, 97–113.
Arnason, A.N., 1973. The estimation of population size, migration rates, and survival in astratified population. Res. Popul. Ecol. 15, 1–8.
Atkinson, A.N., Secor, D.H., 2017. Influence of winter conditions on the age, hatch dates,and growth of juvenile Atlantic menhaden in the Choptank River, Maryland. Trans.Am. Fish. Soc. 146, 1126–1136.
stock assessment. Can. J. Fish. Aquat. Sci. 56, 1721–1731.Coston, L.C., 1971. Summary of Tags Released and Recovered for the Atlantic Menhaden,
1966-69. U.S. Dep. Commer. Nat. Mar. Fish. Serv. Data Rep. 66, 117pp.Dommasnes, A., 1978. Survival of tagged Barents Sea capelin (Mallotus villosus Müller)
and estimates of the 1973, 1974 and 1975 spawning stocks from tag returns. Fisk.Skr. HavUnders. 16, 339–358.
Dryfoos, R.L., Cheek, R.P., Kroger, R.L., 1973. Preliminary analysis of Atlantic menhaden,Brevoortia tyrannus, migrations, population structure, survival and exploitation rates,and availability as indicated from tag returns. Fish. Bull. 71, 719–734.
Dupuis, J.A., 1995. Bayesian estimation of movement and survival probabilities fromcapture-recapture data. Biometrika 82, 761–772.
Durbin, A.G., Durbin, E.G., 1975. Grazing rates of the Atlantic menhaden Brevoortiatyrannus as a function of particle size and concentration. Mar. Biol. 33, 265–277.
Ely, P.C., Young, S.P., Isely, J.J., 2008. Population size and relative abundance of adultAlabama shad reaching Jim Woodruff Lock and Dam, Apalachicola River, Florida. N.Am. J. Fish. Manage. 28, 827–831.
Fahrig, L., 1991. Simulations Relevant to the 1/3 Harvesting Rule for Northern Cod.CAFSAC. Research Document 91/34, Halifax. .
Fournier, D.A., Skaug, H.J., Ancheta, J., Ianelli, J., Magnusson, A., Maunder, M.N.,Nielsen, A., Sibert, J., 2012. AD Model Builder: using automatic differentiation forstatistical inference of highly parameterized complex nonlinear models. Optim.Methods Softw. 27, 233–249.
Fridriksson, A., Aasen, O., 1950. The Norwegian-Icelandic herring tagging experiments.Fisk. Skr. HavUnders. 9, 1–43.
Gelman, A., Rubin, D.B., 1992. Inference from iterative simulation using multiple se-quences. Stat. Sci. 7, 457–472.
Gelman, A., Carlin, J.B., Stern, H.S., Rubin, D.B., 2004. Bayesian Data Analysis. Chapmanand Hall, New York.
Geweke, J., 1991. Evaluating the accuracy of sampling-based approaches to the calcu-lation of posterior moments. In: In: Bernado, J.M., Berger, J.O., Dawid, A.P., Smith,A.F.M. (Eds.), Bayesian Statistics, vol. 4 Clarendon Press, Oxford, U.K.
Goethel, D.R., Quinn, T.J., Cadrin, S.X., 2011. Incorporating spatial structure in stockassessment: movement modeling in marine fish population dynamics. Rev. Fish Biol.Fish. 19, 119–139.
Hamre, J., 1970. Internal Tagging Experiments of Mackerel in the Skagerak and theNorth-eastern North Sea. ICES CM. 1970/H:25. .
Hilborn, R., 1990. Determination of fish movement patterns from tag recoveries usingmaximum likelihood estimators. Can. J. Fish. Aquat. Sci. 47, 635–643.
IMARPE (Instituto del mar del peru “Institute of the Peruvian Sea”), 1972. Report on thesecond session of the panel of experts on the population dynamics of Peruvian an-chovy. Bol. Inst. Mar Perú-Callao 2, 373–458.
Isley, J.J., Tomasso, J.R., 1998. Estimating fish abundance in a large reservoir by mark-recapture. N. Am. J. Fish. Manage. 18, 269–273.
June, F.C., Reintjes, J.W., 1959. Age and size composition of the menhaden catch alongthe Atlantic coast of the United States, 1952-55: with a brief review of the com-mercial fishery. U.S. Fish Wildl. Serv. Pec. Sci. Rept. Fish. 317.
Kroger, R.L., Dryfoos, R.L., 1972. Tagging and tag-recovery experiments with Atlanticmenhaden, Brevoortia tyrannus. NOAA Tech. Rep. U.S. Dept. Commer. NMFS SSRF-664, 11pp.
Langseth, B.J., Schueller, A.M., 2017. Calculation of population level fishing mortality forsingle- versus multi-area models: Application to models with spatial structure. Can. J.Fish. Aquat. Sci. 74, 1821–1831.
Lauretta, M.V., Goethel, D.R., 2017. The robustness of Brownie tag return models tocomplex spatiotemporal dynamics evaluated through simulation analysis. Can. J.
Fish. Aquat. Sci. 74, 1845–1861.Leary, D.F., Murphy, G.I., 1975. A successful method for tagging the small, fragile en-
recapture model performance for estimating movement and mortality rates. Fish. ResIn press.
Michielsens, C.G.J., McAllister, M.K., Kuikka, S., Pakarinen, T., Karlsson, L.,Romakkaniemi, A., Pera, I., Mantyniemi, S., 2006. A Bayesian state-space mark-re-capture model to estimate exploitation rates in mixed-stock fisheries. Can. J. Fish.Aquat. Sci. 63, 321–334.
Mangel, M., 1982. Search effort and catch rates in fisheries. Eur. J. Oper. Res. 11,361–366.
Nicholson, W.R., 1971. Coastal movements of Atlantic menhaden as inferred fromchanges in age and length distributions. Trans. Am. Fish. Soc. 100, 708–716.
Nicholson, W.R., 1978. Movements and population structure of Atlantic menhaden in-dicated by tag returns. Estuaries 1, 141–150.
NMFS (National Marine Fisheries Service), 2015. Fisheries of the United States. U.S.Department of Commerce, pp. 2014 NOAA-NMFS Curr. Fish. Stat. No.2014.
Pelletier, D., Magal, P., 1996. Dynamics of a migratory population under different fishingeffort allocation schemes in time and space. Can. J. Fish. Aquat. Sci. 53, 1186–1199.
Pollock, K.H., Hoenig, J.M., Hearn, W.S., Calingaert, B., 2001. Tag reporting rate esti-mation: 1. An evaluation of the high-reward tagging method. N. Am. J. Fish. Manage.21, 521–532.
Pristas, P.J., Willis, T.D., 1973. Menhaden tagging and recovery: part 1- Field methods fortagging menhaden, genus Brevoortia. Mar. Fish. Rev. 35, 31–35.
Quinn, T.J., Deriso, R.B., 1999. Quantitative Fish Dynamics. Oxford University Press, NewYork.
Reish, R.L., Deriso, R.B., Ruppert, D., Carroll, R.J., 1985. An investigation of the popu-lation dynamics of Atlantic menhaden (Brevoortia tyrannus). Can. J. Fish. Aquat. Sci.42, 147–158.
Roithmayr, C.M., 1963. Distribution of fishing by purse seine vessels for Atlantic men-haden, 1955-59. U.S. Fish Wildl. Serv. Pec. Sci. Rept. Fish. 22 No. 434.
SEDAR (Southeast Data, Assessment, and Review), 2015. SEDAR 40 – Atlantic MenhadenStock Assessment Report. SEDAR, North Charleston, SC, pp. 643.
Schwarz, C.J., Arnason, A.N., 1990. Use of tag-recovery information in migration andmovement studies. Am. Fish. Soc. Symp. 7, 588–603.
Sibert, J.R., Hampton, J., Fournier, D., 1996. Skipjack movement and fisheries interactionin the western Pacific. FAO Fish. Tech. Pap. 365, 402–424.
Simpson, C.A., Wilberg, M.J., Bi, H., Schueller, A.M., Nesslage, G.M., Walsh, H.J., 2016.Trends in relative abundance and early life survival of Atlantic menhaden during1977–2013 from long-term ichthyoplankton programs. Trans. Am. Fish. Soc. 145,1139–1151.
Simpson, C.A., Bi, H., Liang, D., Wilberg, M.J., Schueller, A.M., Nesslage, G.M., Walsh,H.J., 2017. Spawning locations and larval dispersal of Atlantic menhaden during1977-2013. ICES J. Mar. Sci. 74, 1574–1586.
Smith, J.W., 1991. The Atlantic and Gulf menhaden purse seine fisheries: origins, har-vesting technologies, biostatistical monitoring, recent trends in fisheries statistics,and forecasting. Mar. Fish. Rev. 53, 28–41.
Smith, J.W., O’Bier, B., 2011. The bait purse-seine fishery for Atlantic menhaden,Brevoortia tyrannus, in the Virginia portion of Chesapeake Bay. Mar. Fish. Rev. 73,1–12.
Walters, C.J., Hall, N., Brown, R., Chubb, C., 1993. Spatial model for the populationdynamics and exploitation of the Western Australian rock lobster, Panulirus cygnus.Can. J. Fish. Aquat. Sci. 50, 1650–1662.
E.M. Liljestrand et al. Fisheries Research 210 (2019) 204–213