Estimation of skin optical parameters for real-time hyperspectral imaging applications Asgeir Bjorgan Matija Milanic Lise Lyngsnes Randeberg Downloaded From: https://www.spiedigitallibrary.org/journals/Journal-of-Biomedical-Optics on 27 Jan 2022 Terms of Use: https://www.spiedigitallibrary.org/terms-of-use
Transcript
Estimation of skin optical parametersfor real-time hyperspectral imagingapplications
Downloaded From: https://www.spiedigitallibrary.org/journals/Journal-of-Biomedical-Optics on 27 Jan 2022Terms of Use: https://www.spiedigitallibrary.org/terms-of-use
Estimation of skin optical parameters for real-timehyperspectral imaging applications
Asgeir Bjorgan,* Matija Milanic, and Lise Lyngsnes RandebergNorwegian University of Science and Technology, Department of Electronics and Telecommunications, Trondheim 7491, Norway
Unported License. Distribution or reproduction of this work in whole or in part requires full attribution of the original publication, including its DOI.
Paper 130812PRR received Nov. 13, 2013; revised manuscript received Apr. 30, 2014; accepted for publication May 6, 2014; pub-lished online Jun. 4, 2014.
1 IntroductionHyperspectral imaging has been recently adopted for diagnosticimaging of human skin. Hyperspectral imaging combines highspatial and spectral resolution in one modality, giving imageswith full spectral resolution in every pixel.1,2 This makes it apromising tool for tissue characterization and optical diagnos-tics.1,3,4 Flexible wide-field imaging options give the possibilityof rapid scanning of both larger areas and samples and smallerdetails, e.g., full body scans and close up imaging with micro-scopic resolution.5 The physical size of the equipment makes itpossible to place it on a small trolley, and it can thus be used forbedside scanning.6 The hyperspectral camera used in this studyis a push broom, line-scanning device with a capture speed of30 ms per line of data.
The amount of collected data is an obstacle for fast hyper-spectral data processing while scanning. With typical files beingin the order of several gigabytes, processing time is prohibitivefor advanced analysis. Time is a crucial parameter for the tech-nique to be clinically relevant. Processing speed should preferablyobey an external real-time deadline limit defined by the acqusitionspeed of the hyperspectral camera. Commodity graphics process-ing units (GPUs) are well known to satisfy heavy computingrequirements.7,8 GPUs are normally used to process graphics onpersonal computers and are relatively inexpensive. Such graphicscards can potentially boost processing speed due to the inherentparallelizability of hyperspectral data processing.
It is valuable to estimate the concentrations of various tissuecomponents (blood, melanin, and water) for diagnostic purposes.Spectral unmixing algorithms are frequently used to obtain con-centration maps of materials in remote sensing.9 Applying thesame methods to analyze the hyperspectral images of skin ischallenging due to the turbid, layered nature of human skin.One aim of this study is to develop a method for spectral unmix-ing of the hyperspectral images of human skin.
Forward light transport models, such as Monte Carlo10 or thediffusion approximation,11–13 may be used to simulate lighttransport in media such as human skin. These type of modelshave previously been used to extract optical properties of tis-sue.13–15 This has been typically done by comparing measured,diffuse reflectance spectra to simulations, and tweaking theinput parameters of the simulations to obtain the best possiblefit. To our knowledge, these methods have never been applied tohyperspectral images in real-time during data collection. Somereports exist on the application of inverse photon transport mod-els on hyperspectral images after image acquisition.16,17
This paper presents a deterministic hyperspectral inverse mod-eling approach based on diffusion theory and spectral unmixing.These analytical methods are suitable for GPU implementation.The analysis chain fulfills the real-time requirements of the hyper-spectral imaging process. The optical properties are delivered lineby line during data collection, and no additional computationaltime is needed beyond the time it takes to scan the sample.
The accuracy of the results obtained using the inverse modelwas evaluated against numerical simulations. However, as this isa proof of a new concept, real-time processing concerns weregiven priority over simulation accuracy. This issue will beaddressed in further development of the concept.
*Address all correspondence to: Asgeir Bjorgan, E-mail: [email protected]
Journal of Biomedical Optics 066003-1 June 2014 • Vol. 19(6)
Journal of Biomedical Optics 19(6), 066003 (June 2014)
Downloaded From: https://www.spiedigitallibrary.org/journals/Journal-of-Biomedical-Optics on 27 Jan 2022Terms of Use: https://www.spiedigitallibrary.org/terms-of-use
The main objective of the study was to develop an algorithmfor extraction of skin properties from hyperspectral images inreal-time during scanning. This has been done using GPU par-allelization. GPU hardware is essentially an SIMD (singleinstruction and multiple data) vector processor.18 For maximumparallelization, this requires the same sequence of instructions tobe independently applied to multiple data. Since the hyperspec-tral data are discretized in pixels and wavelengths, doing indi-vidual processing on pixels and wavelengths is the natural wayto parallelize the GPU processing.
A photon transport model is iterated with respect to skinparameters, such as blood volume fraction and melanin concen-tration. In order to apply the same sequence of GPU instructionsfor all data, the iteration strategies will be limited to rather sim-ple iteration strategies. To fulfill the independency requirement,each pixel in the hyperspectral image is treated as an indepen-dent diffuse reflectance spectrum measured on a laterally infinitelayered medium. It is possible to achieve pixel interdependencyand nondeterminism, but at the cost of reducing GPU processingoptimality. This is not applied in this preliminary study.
The GPU code was designed for a computer with an IntelCore i7 CPU (8 cores), 6 GB RAM and an NVIDIA GeForceGTX 670 GPU. Debian GNU/Linux (jessie) was used as theoperating system. The code was integrated into a hyperspectralstreaming framework developed by the Norwegian DefenceResearch Establishment.19
2.2 Optical Modelling
2.2.1 Inverse model
Skin model. The skin model applied in the inverse model isa two-layered model which was previously described by Spottet al.,13 Randeberg et al.,20,21 and Svaasand et al.11 In short, itconsists of two planar layers. The first layer represents an epi-dermal layer of finite thickness containing melanin and a smallamount of blood. Blood is added to the epidermal layer to cor-rect for the depth variations of the papillae. The second layer is ahomogeneous, semi-infinite dermal layer containing blood andother chromophores evenly distributed throughout the layer.
The applied melanin absorption model was adapted fromSpott et al.13 and is given as
μa;mðλÞ ¼ μa;m;694 ·
�λ
694 nm
�−3.46
: (1)
The melanin content is denoted by the melanin absorption at694 nm (μa;m;694) in units of m−1. The absorption in blood isassumed to arise from deoxygenated and oxygenated hemo-globins.22 It depends on the blood volume fraction (BVF) andoxygen saturation (oxy). A constant background absorption of25 m−1 was added to the model.11 Absorption spectra of hemo-globin, fat, and melanin are shown in Fig. 1.
In the model, the absorption spectra are multiplied by theirvolume fractions and summed to yield the total wavelength-dependent dermal absorption coefficient, μa;dðλÞ.
The reduced scattering coefficient in the tissue is modeled byan expression given by Jacques25
μ0sðλÞ¼100m−1 ·
�aMie
�λ
500nm
�−bMieþaRay
�λ
500nm
�−4�:
(2)
Bashkatov et al.26 give aMie ¼ 18.780, aRay ¼ 17.6, andbMie ¼ 0.22 as values for the coefficients in the expression.This is based on data obtained from whole skin ex vivo samples,and is used for both dermis and epidermis. The anisotropy factorg is modeled as
gðλÞ ¼ 0.62þ λ · 29 · 10−5; (3)
reported by Van Gemert et al.27 The index of refraction used forboth skin layers was 1.4.
Light transport model. The light transport model is basedon a diffusion model with isotropic source functions, derivedby Svaasand et al.11 This model is used to obtain diffuse reflec-tance as a function of wavelength and skin optical parameters.The diffusion model has fast, analytic solutions well suitable fora real-time computing environment. In the diffusion approxima-tion, it is assumed that scattering dominates over absorption.This assumption is less valid below 600 nm for skin due tothe high absorption coefficients for hemoglobin and melanin(see Fig. 1). It has been shown that the approximation stillresults in reflectances close to Monte Carlo simulations forthe 450–800 nm spectral range.20
The error between the Monte Carlo model and the diffusionapproximation was reported by Randeberg et al.20 to be mini-mized by applying a constant scaling factor to the absorptioncoefficients in the diffusion model. This scaling factor has notbeen explicitly applied. However, a constant deviation is presentin all extracted parameters, as found by Randeberg et al.20 Theextracted parameters are thus expected to characterize the relativevariations of properties between different tissues well.
A Monte Carlo-based inverse model will not fulfill real-timerequirements, even if they are GPU-accelerated.7 Typical com-puting times for 1600 pixels and 160 wavelengths, based on ourown experiences, are in the order of days.
The derivation of the diffusion model assumes a laterallyhomogeneous skin model within the range of a few mean trans-port lengths. A valid application of the diffusion model to singlehyperspectral pixels would require the lateral broadening of thelight to be smaller than the spatial width of the hyperspectralpixel. Since this is not the case, photons will be scatteredfrom pixel to pixel. The properties extracted from a single
0.01
0.1
1
10
100
1000
1,0000
10,0000
450 500 550 600 650 700 750 800
Abs
orpt
ion
(m−
1)
Wavelength (nm)
MelaninOxy-Hb
Deoxy-HbWater
Purified fat
Fig. 1 The absorption coefficients of blood,22 water,23 fat,24 andthe melanin model13 for sun-protected north European skin(μa;m;694 ¼ 350 m−1).
Journal of Biomedical Optics 066003-2 June 2014 • Vol. 19(6)
Bjorgan, Milanic, and Randeberg: Estimation of skin optical parameters for real-time hyperspectral imaging applications
Downloaded From: https://www.spiedigitallibrary.org/journals/Journal-of-Biomedical-Optics on 27 Jan 2022Terms of Use: https://www.spiedigitallibrary.org/terms-of-use
pixel will therefore be influenced by the surrounding pixels.This effect has been further investigated in this study.
Fitting algorithm. The diffusion model is applied to calcu-late the wavelength-dependent diffuse reflectance. By compar-ing the calculated reflectance against a measured reflectance, theskin parameters may be found iteratively. The iteration strategyis designed with GPU implementation in mind, requiring inde-pendence across wavelengths and pixels and determinism in theset of instructions used. The iteration strategy is therefore basedaround the independent estimation of the epidermal and dermalabsorption coefficients using Newton–Rhapson’s method28 andthe spectral unmixing of these.
The number of layers is kept down to two layers in order tokeep the number of fitted parameters down to a minimum, thussimplifying the reflectance expression. It is known that the skinis a nonhomogeneous organ and is approximated more accu-rately by three or more skin layers. The two-layered skin modelis, therefore, applied on separate wavelength ranges where thepenetration depth can be assumed to be more or less uniformacross the given wavelength range. It is assumed that thisapproach will yield the mean properties down to the given pen-etration depth. This is illustrated in Fig. 2 and has been donepreviously by Randeberg et al.21 This approach is also similarto work done by Tseng et al.29 and Saager et al.30 The twochosen fitting intervals are 510–590 and 690–820 nm. Lightpenetrates more superficially at the shorter wavelengths due tothe high absorption of hemoglobin and melanin, while lightpenetrates more deeply at the longer wavelengths (see Fig. 1).The exact limits have been chosen through thorough testing onreal data and close observation of the chromophore absorptionspectra. Typical mean optical penetration depths through dermisare estimated to around 200 μm for 510–590 nm and above500 μm for 690–820 nm.
The fixed parameters within the chosen skin model are:
• scattering coefficients [Eq. (2)]
• thickness of the layers (100 μm for epidermis).
The parameters used in Eq. (2) are assumed to have a slowspatial variation for normal skin tissues and can be assumedfixed, although they may be different for different types oftissues. The thickness of the epidermis varies by person andlocation, and thickness under- or overestimation results in eithera lowered or increased melanin content.
The fitted parameters within the chosen skin model, asapplied to a given wavelength interval, are:
• melanin absorption in epidermis
• BVF in dermis
• oxygen saturation of the blood in dermis
• other chromophores (in this paper: water, fat, and constantbaseline absorption).
The basic fitting procedure is outlined in Fig. 3. The dermalabsorption coefficient μa;d is estimated and unmixed at twowavelength intervals following determination of melanin inepidermis. The melanin extraction method is outlined inFig. 4. The melanin absorption coefficient μa;m;694 is assumedto be 100 m−1 as a starting value.
The dermal absorption coefficients are derived for the wave-length interval 730–830 nm. Melanin and hemoglobin are thenfitted to the absorption coefficients. Next, the hemoglobinparameters are fixed and the epidermal absorption coefficientsare derived. Melanin is then fitted to the epidermal absorptioncoefficients to get the corresponding melanin content. Using thenew melanin estimate, the method is run a second time to get thefinal estimate of the melanin content.
The wavelength-dependent dermal absorption coefficient isthen found across the entire spectral range. Due to a linear rela-tionship between the chromophore absorption coefficients andthe total dermal absorption, the chromophore contributions tothe dermal absorption spectrum are found using a spectralunmixing algorithm.
The chromophore spectra for this unmixing procedure areknown a priori and only estimation of chromophore volumefractions is desired for the spectral unmixing part. For a singlepixel, the derived dermal absorption can be written as
~μa;d ¼ A~x; (4)
where the matrix A consists of the chromophore absorptionspectra and ~x are the concentrations fx0; x1; x2; : : : g of eachmaterial to be found under a non-negativity constraint.
The sequential coordinate-wise algorithm for non-negativeleast-squares problems (SCA)31 is used to estimate the solutionsto Eq. (4), and thus unmix the absorption spectra. This algorithmhas no proven convergence guarantees, but is reportedly fast. It
Fig. 2 Illustration of the two-layered skin model applied to a three-lay-ered situation. The two-layered skin model approximates the proper-ties of multiple, inhomogeneous layers to a single, homogeneous andsemi-infinite (s.i.) layer where the derived properties are distributedevenly throughout the layer. Different parts of the diffuse reflectancespectrum contain information about different penetration depths.
Fig. 3 Outline of the inverse model algorithm, where the absorption indermis is corrected for melanin in epidermis.
Journal of Biomedical Optics 066003-3 June 2014 • Vol. 19(6)
Bjorgan, Milanic, and Randeberg: Estimation of skin optical parameters for real-time hyperspectral imaging applications
Downloaded From: https://www.spiedigitallibrary.org/journals/Journal-of-Biomedical-Optics on 27 Jan 2022Terms of Use: https://www.spiedigitallibrary.org/terms-of-use
requires only the matrix H ¼ ATA and optimizes with respect toone variable at a time, suitable for a memory-effective GPU par-allelization in a demonstration prototype.
The unmixing of the dermal absorption coefficient deter-mines the fitted chromophores (hemoglobin, water, fat, andthe constant baseline absorption) in two separate wavelengthintervals. In addition, melanin is included in the fitting to rectifypotential melanin underestimation in epidermis.
2.2.2 Numerical simulations
Reflectance spectra simulated using a four-layered Monte Carlomodel were used to test the reliability of the inverse diffusionmodel. In the Monte Carlo model, the dermis was subdividedinto two layers, the first representing papillary dermis, and thesecond reticular dermis. The fourth layer represented a blood-less subcutaneous layer containing 40% fat and 60% back-ground absorption. The implemented background absorptionwas taken from Salomatina et al.32
The reduced scattering coefficient in subcutis was modeledby an expression given by Naglic et al.,33 comparable to the scat-tering coefficients reported by Salomatina et al.,32
The refraction index n was set to 1.4 for all layers. Dermiswas modeled using blood and the constant background absorp-tion presented earlier in Sec. 2.2.1. The reduced scattering coef-ficient for dermis was calculated using Eq. (2). This will serve to
ease the applicability of the inverse diffusion model since thesame optical properties are modeled. The main purpose ofthe simulations is to:
• Test the accuracy of the optical parameters given by theinverse diffusion model.
• Test the applicability of the one-dimensional (1-D) diffu-sion model to describe a 3-D situation.
A 1-D Monte Carlo model7 was used to simulate reflectancespectra. The melanin in epidermis and the BVF in the superficialdermal layer were varied. The inverse model was tested for itsability to estimate the changes in these parameters and the sta-bility of the other estimated parameters (oxygenation and BVFin the deeper dermal layer). The skin model is shown in Fig. 5.The melanin absorptions corresponded to lightly and morepigmented Caucasian skin. Diffuse reflectance spectra in thewavelength range between 400 and 848 nm with a step size of2 nm were simulated.
The inverse diffusion model used to derive optical propertiesfrom the 1-DMonte Carlo spectra involved the use of an ordinarynon-negative least-squares algorithm34 for the unmixing of theabsorption spectra, instead of SCA unmixing as presented earlier.This was done in order to evaluate the performance of SCAagainst a more ordinary non-negative least-squares algorithm.
The iteration strategy has been evaluated against resultsobtained using MATLAB’s (Version 8.1.0.604, The Math-Works Inc., Natick, Massachusetts, USA) lsqcurvefit routine,using a Trust-region reflective optimization approach with upperand lower boundary constraints. This was run on the wavelengthrange 690–820 nm for all 1-D Monte Carlo spectra.
We also performed 3-D Monte Carlo simulations to test theapplicability of the 1-D diffusion model on single pixels ina mock hyperspectral image. An implementation of 3-DMonte Carlo developed by Milanic and Majaron35 was used toobtain reflectance images of a 1-mm diameter junctional nevus,and an intradermal vessel at a depth of 0.25 mm and witha diameter of 0.2 mm. Skin geometries are shown in Figs. 6and 7. The simulated wavelength range for the diffuse reflec-tance was 42 wavelengths from 687 to 835 nm with a stepsize of 3.6 nm. This wavelength discretization was used inorder to simulate a hyperspectral dataset.
The blood vessel was simulated using the blood absorptionand scattering values from Friebel et al.36 and a blood oxygena-tion of 95%. The refraction index of the vessel was set to
Fig. 4 Outline of the melanin estimation algorithm. The method is runon the wavelength interval from 730 to 830 nm, and is run twice.
Fig. 5 Geometry of the one-dimensional (1-D) Monte Carlo forwardmodel used to simulate skin reflectance. Parameter values withinbrackets are varied, the other parameters are fixed.
Journal of Biomedical Optics 066003-4 June 2014 • Vol. 19(6)
Bjorgan, Milanic, and Randeberg: Estimation of skin optical parameters for real-time hyperspectral imaging applications
Downloaded From: https://www.spiedigitallibrary.org/journals/Journal-of-Biomedical-Optics on 27 Jan 2022Terms of Use: https://www.spiedigitallibrary.org/terms-of-use
nðλÞ ¼ 1.357þ 6.9 · 103
λ2þ 7.6 · 108
λ4; (7)
as reported by Li et al.37
The inverse diffusion model used for the 3-D Monte Carlosignals involved SCA unmixing for the unmixing of the absorp-tion spectra, as presented earlier in Sec. 2.2.1.
2.3 Experimental
The developed inverse diffusion model was also tested on mea-sured hyperspectral data.
Hyperspectral images of skin were collected using a push-broom HySpex VNIR-1600 camera (Norsk Elektro Optikk,Lillestrøm, Norway).38 A healthy, female volunteer (Caucasian,39 years old) with fair skin (Fitzpatrick skin type I/II) had thevolar side of her forearm imaged. Two images were obtained.The first image was obtained as a baseline. The secondimage was obtained after 5 min of occlusion induced by apply-ing a blood pressure cuff. This was done in order to modulatethe oxygenation and blood content in the skin. The images hada size of 1600 pixels ðsamplesÞ × 160 wavelengths ðbandsÞ×a varying number of lines. Hyperspectral data lines were
scanned at a speed of 30 ms per line of data, which was alsochosen to be the real-time deadline limit for the processing.
The lens had a focal length of 30 cm. The pixel field of viewwas approximately 0.4 mrad.38 Pixel size on the skin surfaceafter magnification using a 30 cm lens was approximately60 × 60 μm.
Two linear light sources were used for illumination (Model2900 Tungsten Halogen, Illumination Technologies, New York).Polarizers were mounted on the camera lens and the light sources(VLR-100 NIR, 450–1100 nm, Meadowlark Optics, Frederick,Colorado) in order to avoid specular reflection.
The images were converted into reflectance and correctedfor uneven illumination across the field of view using aSpectralon reflectance target (SRT-50-050 Reflectance Target,12.7 × 12.7 cm, ACAL Bfi Nordic AB, Uppsala).6 Spectralvariations in the specified intensity of the reflectance standardwere taken into account in the conversion. The images weredenoised using the maximum noise fraction transform (MNF).39
3 Results
3.1 Timing Results
The specific timing results for each GPU operation as applied ona 1600 samples × 160 bands hyperspectral data line are shown
Fig. 6 Geometry of the skin model containing a superficial vessel.The vessel was modeled as a circular tube. A horizontal cross sectionthrough the center of the vessel is shown on top. A vertical cross sec-tion is shown below. The image scale of the vertical cross sectiondiffers from the horizontal cross section.
Fig. 7 Geometry of the skin model containing a mole. The mole wasmodeled as a circular area with increased melanin content. A horizon-tal cross section through the center of the mole is shown on top.A vertical cross section is shown below. The image scale of thevertical cross section differs from the horizontal cross section.
Journal of Biomedical Optics 066003-5 June 2014 • Vol. 19(6)
Bjorgan, Milanic, and Randeberg: Estimation of skin optical parameters for real-time hyperspectral imaging applications
Downloaded From: https://www.spiedigitallibrary.org/journals/Journal-of-Biomedical-Optics on 27 Jan 2022Terms of Use: https://www.spiedigitallibrary.org/terms-of-use
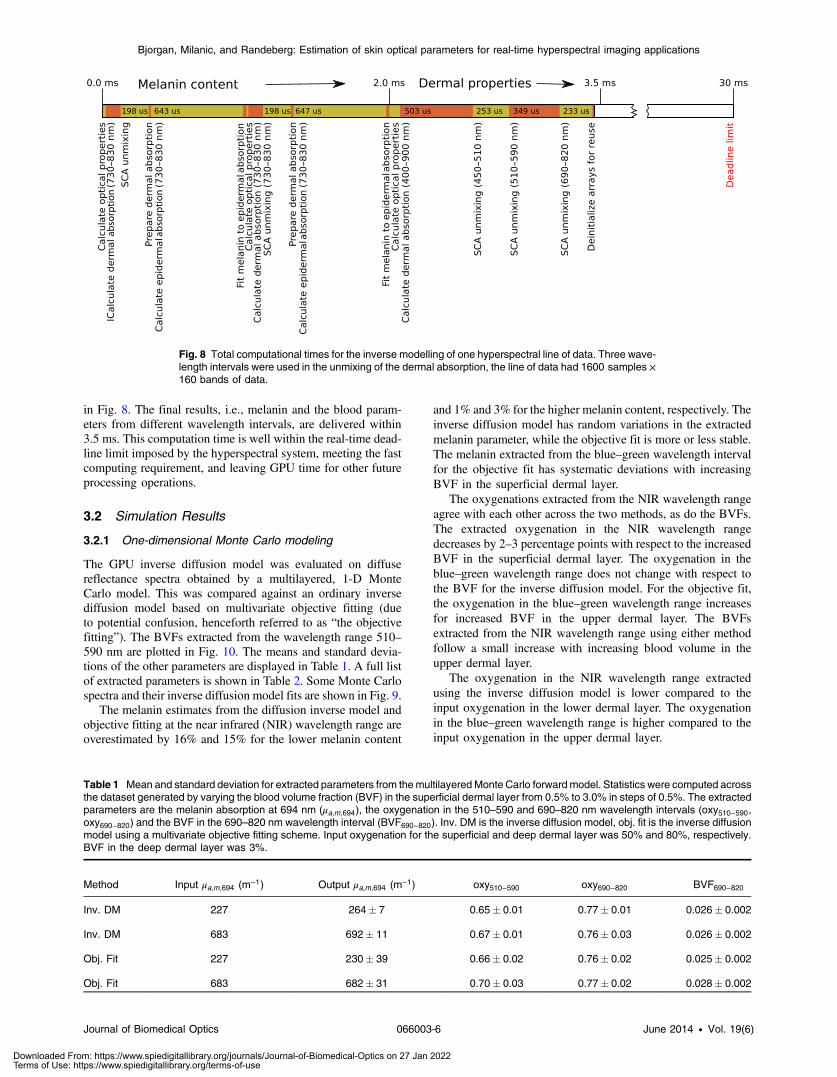
in Fig. 8. The final results, i.e., melanin and the blood param-eters from different wavelength intervals, are delivered within3.5 ms. This computation time is well within the real-time dead-line limit imposed by the hyperspectral system, meeting the fastcomputing requirement, and leaving GPU time for other futureprocessing operations.
3.2 Simulation Results
3.2.1 One-dimensional Monte Carlo modeling
The GPU inverse diffusion model was evaluated on diffusereflectance spectra obtained by a multilayered, 1-D MonteCarlo model. This was compared against an ordinary inversediffusion model based on multivariate objective fitting (dueto potential confusion, henceforth referred to as “the objectivefitting”). The BVFs extracted from the wavelength range 510–590 nm are plotted in Fig. 10. The means and standard devia-tions of the other parameters are displayed in Table 1. A full listof extracted parameters is shown in Table 2. Some Monte Carlospectra and their inverse diffusion model fits are shown in Fig. 9.
The melanin estimates from the diffusion inverse model andobjective fitting at the near infrared (NIR) wavelength range areoverestimated by 16% and 15% for the lower melanin content
and 1% and 3% for the higher melanin content, respectively. Theinverse diffusion model has random variations in the extractedmelanin parameter, while the objective fit is more or less stable.The melanin extracted from the blue–green wavelength intervalfor the objective fit has systematic deviations with increasingBVF in the superficial dermal layer.
The oxygenations extracted from the NIR wavelength rangeagree with each other across the two methods, as do the BVFs.The extracted oxygenation in the NIR wavelength rangedecreases by 2–3 percentage points with respect to the increasedBVF in the superficial dermal layer. The oxygenation in theblue–green wavelength range does not change with respect tothe BVF for the inverse diffusion model. For the objective fit,the oxygenation in the blue–green wavelength range increasesfor increased BVF in the upper dermal layer. The BVFsextracted from the NIR wavelength range using either methodfollow a small increase with increasing blood volume in theupper dermal layer.
The oxygenation in the NIR wavelength range extractedusing the inverse diffusion model is lower compared to theinput oxygenation in the lower dermal layer. The oxygenationin the blue–green wavelength range is higher compared to theinput oxygenation in the upper dermal layer.
Fig. 8 Total computational times for the inverse modelling of one hyperspectral line of data. Three wave-length intervals were used in the unmixing of the dermal absorption, the line of data had 1600 samples ×160 bands of data.
Table 1 Mean and standard deviation for extracted parameters from themultilayeredMonte Carlo forward model. Statistics were computed acrossthe dataset generated by varying the blood volume fraction (BVF) in the superficial dermal layer from 0.5% to 3.0% in steps of 0.5%. The extractedparameters are the melanin absorption at 694 nm (μa;m;694), the oxygenation in the 510–590 and 690–820 nm wavelength intervals (oxy510−590,oxy690−820) and the BVF in the 690–820 nm wavelength interval (BVF690−820). Inv. DM is the inverse diffusion model, obj. fit is the inverse diffusionmodel using a multivariate objective fitting scheme. Input oxygenation for the superficial and deep dermal layer was 50% and 80%, respectively.BVF in the deep dermal layer was 3%.
Journal of Biomedical Optics 066003-6 June 2014 • Vol. 19(6)
Bjorgan, Milanic, and Randeberg: Estimation of skin optical parameters for real-time hyperspectral imaging applications
Downloaded From: https://www.spiedigitallibrary.org/journals/Journal-of-Biomedical-Optics on 27 Jan 2022Terms of Use: https://www.spiedigitallibrary.org/terms-of-use
The BVFs in Fig. 10 follow the increase in the BVF inthe upper dermal layer. The values are overshot compared tothe BVF extracted from the NIR wavelength range.
3.2.2 Three-dimensional Monte Carlo modeling
Results of applying the hyperspectral inverse model to a 3-DMonte Carlo model of a mole are shown in Fig. 11. The 3-Dvessel results are shown in Fig. 12.
The determined melanin values outside the mole are around250 m−1. The determined melanin values inside the moleapproach 650 m−1. Melanin input values were 225 and1135 m−1, respectively. Increased melanin values are seen out-side of the mole boundary. The mean optical penetration depthcan be calculated to be approximately 0.97 mm in dermis and0.2 mm in the epidermis of the mole area. This was calculated
using the following definition of the mean optical penetrationdepth,40
and the modeled absorption and scattering coefficients at687 nm. The BVF is about 3.7%. The oxygen saturationstays constant at 100%. Both of these parameters are extractedfrom the 690–820 nm wavelength interval. Some random, dis-connected pixels inside the mole have a slightly lowered oxy-genation saturation, to around 97%. This is likely due toincreased noise levels in the mole due to higher absorption.
The determined melanin values for the vessel image stayconstant to about 250 m−1. The BVFs outside the vessel are
Table 2 Extracted parameters from the one-dimensional (1-D) Monte Carlo forward model for the different inverse models. The number below theparameter name denotes from which wavelength range the parameter was extracted (510–590 or 690–820 nm). μa;m is the epidermal melaninabsorption coefficient at 694 nm. Input oxygenation for the superficial and deep dermal layer was 50% and 80%, respectively. Blood volume fraction(BVF) in the deep dermal layer was 3%.
Journal of Biomedical Optics 066003-7 June 2014 • Vol. 19(6)
Bjorgan, Milanic, and Randeberg: Estimation of skin optical parameters for real-time hyperspectral imaging applications
Downloaded From: https://www.spiedigitallibrary.org/journals/Journal-of-Biomedical-Optics on 27 Jan 2022Terms of Use: https://www.spiedigitallibrary.org/terms-of-use
around 3.7%, while the area above the vessel approaches 5.0%.The modeled BVF in dermis was 1.0%, while the vessel wasassumed to be a small tube with pure blood absorption, locatedat a depth of 0.25 mm. The increased BVF ranges over an areacorresponding to a diameter of 0.5 mm. The oxygenation staysconstant to 100% throughout the vessel. Both parameters wereextracted from the 690–820 nm wavelength interval.
3.3 Hyperspectral Image Inverse Modeling Results
Red, green, and blue (RGB) images and results of the inversemodel are shown in Figs. 13 and 14, before and after 5 min ofcuff-induced occlusion of the arm, respectively. Individual spec-tral fits are shown in Fig. 15. The images have been subsetted inorder to ignore nonskin regions with a high signal-to-noise ratioand to analyze only the parts of the image that are well
illuminated and in focus. The approximate width and heightof the imaged subsetted area are 60 and 120 mm.
The total time used to process the subsetted (1800 lines ×900 samples) image was 7 s.
Water and fat were fitted for the absorption spectra, but arenot shown here.
Focus and illumination problems in the experimental data arepropagated into an overestimation of the BVF and melanin inthe upper left corner and lower right corner of the image. Theseartifacts in the data are due to the curvature of the arm. Themelanin content was estimated to be about 600 m−1 in the cen-tral parts of the mole. The blood parameters extracted fromeither wavelength range show structures reminiscent of vessels.
After occlusion, the estimated blood content is increasedboth in normal tissue and in the blood vessels. The oxygenationis decreased at both wavelength ranges. The melanin is more orless unaffected, although the melanin in the mole is decreasedcompared to unaffected skin.
4 DiscussionThe aim of this paper is to present a proof of concept for a real-time inverse modeling method for hyperspectral images of skin.
The steps in the inverse modeling approach have been chosenin order to make a real-time implementation using GPU paralle-lization viable. A two-layered model is applied to multilayeredtissue in each point of the hyperspectral image. The two-layeredapproach is verified through 1-DMonte Carlo simulations, whilethe point-based approach is verified through the 3-DMonteCarlosimulations. In addition, the model is applied to a set of basichyperspectral images to show the potential of the technique.
Large individual variations in optical properties can beexpected from measurements on in vivo tissue. The optical prop-erties will vary as a function of temperature and hydration.41–44
Fixed spectra of optical properties are applied in the inversemodels, which have been obtained ex vivo under specificconditions and after preparation techniques, which may affect
0
0.1
0.2
0.3
0.4
0.5
0.6
0.7
400 450 500 550 600 650 700 750 800 850
Ref
lect
ance
(nm)
1
2
3
Diffusion model fitMonte Carlo simulation
Fig. 9 Monte Carlo simulations and their corresponding diffusionmodel fits. Spectrum 1 corresponds to a melanin absorption of227 m−1 while both spectra 2 and 3 have a melanin absorption of683 m−1. Blood volume fractions (BVFs) in the upper dermal layerare respectively 1%, 1%, and 3%. Dots in the graph are not indicativeof fitting points and are only used for discrimination. Fitted wavelengthranges were 510–590 and 690–820 nm.
Fig. 10 Output BVF from the wavelength range 510–590 nm. μa;m isshort for μa;m;694.
0100200300400500600700800
µa,
m,6
94(m
-1)
(a)0
0.2
0.4
0.6
0.8
1
Oxy
gen
satu
ratio
n
(b)
Fig. 11 Melanin content (a) and oxygenation for 690–820 nm(b) extracted from the 3-DMonte Carlo model of a mole. Blood volumefraction was as in Fig. 12 outside the vessel.
0
0.02
0.04
0.06
0.08
0.1
Blo
odvo
lum
efr
actio
n
(a)0100200300400500600700800
µa,
m,6
94(m
-1)
(b)
Fig. 12 Blood volume fraction for 690–820 nm (a) and melanin con-tent (b) from the 3-D Monte Carlo model of a vessel. Oxygenation for690–820 nm was constant throughout the image, 100%.
Journal of Biomedical Optics 066003-8 June 2014 • Vol. 19(6)
Bjorgan, Milanic, and Randeberg: Estimation of skin optical parameters for real-time hyperspectral imaging applications
Downloaded From: https://www.spiedigitallibrary.org/journals/Journal-of-Biomedical-Optics on 27 Jan 2022Terms of Use: https://www.spiedigitallibrary.org/terms-of-use
the coefficients.43,45 As a result, there will always be a largeuncertainty in the obtained tissue properties, no matter howaccurate the inverse model may be when applied on numericalsimulations. This has to be taken into account when setting theaccuracy requirements and evaluating these kind of methods.
In general, our developed inverse diffusion model provides amean of the tissue parameters. The resulting mean is a mean ofall tissue parameters reached by the light. The model character-izes the changes of this mean. The output parameters fromthe simulations are stable despite the change in the BVF ofthe upper dermal layer. The BVF extracted using the blue–greenwavelength range characterizes this change well.
The isotropic diffusion model is known to result in higherreflectance values than the corresponding Monte Carlo reflec-tance for the same set of input parameters and high absorp-tion.20,46 This will explain the slightly increased melaninvalues produced by the inverse diffusion model and theincreased BVF extracted from the blue–green wavelengthrange. The difference gets higher with increased input melaninabsorption. The results obtained using our methods and the
objective multivariate fit are comparable for the NIR wavelengthrange. Mainly the BVFs are comparable for the blue–greenwavelength range, while the objective fit deviates for the mela-nin and oxygenation. This seems to be due to cross talk, possiblybetween hemoglobin and melanin.
0
0.02
0.04
0.06
0.08
0.1
0.12
0.14
Blo
odvo
lum
efr
actio
n
(a)0
0.02
0.04
0.06
0.08
0.1
0.12
0.14
Blo
odvo
lum
efr
actio
n
(b)
0
0.2
0.4
0.6
0.8
1
Oxy
gen
satu
ratio
n
(c)0
0.2
0.4
0.6
0.8
1
Oxy
gen
satu
ratio
n
(d)
0
100
200
300
400
500
600
700
800
µa,
m, 6
94(m
-1)
(e) (f)
Fig. 14 Extracted skin properties from the volar side of the forearm ofa Caucasian woman after 5 min of cuff-induced occlusion. Theseproperties are the blood volume fraction in (a) 510–590 nm and(b) 690–820 nm, the oxygenation in (c) 510–590 nm and (d) 690–820 nm, (e) the melanin content and (f) the RGB image.
0
0.1
0.2
0.3
0.4
0.5
0.6
0.7
400 450 500 550 600 650 700 750 800 850
Ref
lect
ance
(nm)
1
2
Diffusion model fitMeasurement
Fig. 15 Diffusion model fits of pixels located close to the mole.Spectrum 1 is before occlusion, spectrum 2 is after 5 min of occlusion.Note that the dots are used for differentiation and are not indicative offitting points. Fitted wavelength ranges were 510–590 and 690-820 nm.
0
0.02
0.04
0.06
0.08
0.1
0.12
0.14
Blo
odvo
lum
efr
actio
n
(a)0
0.02
0.04
0.06
0.08
0.1
0.12
0.14
Blo
odvo
lum
efr
actio
n
(b)
0
0.2
0.4
0.6
0.8
1
Oxy
gen
satu
ratio
n
(c)0
0.2
0.4
0.6
0.8
1
Oxy
gen
satu
ratio
n
(d)
0
100
200
300
400
500
600
700
800
µa,
m, 6
94(m
-1)
(e) (f)
Fig. 13 Extracted skin properties from the volar side of the forearm ofa Caucasian woman. These properties are the blood volume fractionin (a) 510–590 nm and (b) 690–820 nm, the oxygenation in (c) 510–590 nm and (d) 690–820 nm, (e) the melanin content and (f) the RGBimage.
Journal of Biomedical Optics 066003-9 June 2014 • Vol. 19(6)
Bjorgan, Milanic, and Randeberg: Estimation of skin optical parameters for real-time hyperspectral imaging applications
Downloaded From: https://www.spiedigitallibrary.org/journals/Journal-of-Biomedical-Optics on 27 Jan 2022Terms of Use: https://www.spiedigitallibrary.org/terms-of-use
The situation for the 3-D Monte Carlo model is comparableto the results for the 1-D case. The melanin outside of the molehas the same trend as for the 1-D situation. The determinedmelanin content inside the mole is lowered compared to theinput value, although there is no apparent misfitting. Using theestimated penetration depths as an estimate of the mean trans-port length, it is clear that some of the light entering the molewill exit normal skin and vice versa. This results in a washed outappearance of the mole and higher reflectance values inside themole region. This gives the surrounding pixels the appearance ofa higher melanin content. The diffuse reflectance of the mole hasa slightly higher diameter (1.5 mm) than the actual mole (1 mm).This is to be expected in a highly scattering tissue.
The BVF extracted from 3D Monte Carlo is increased com-pared to the BVF extracted from the 1-D Monte Carlo simula-tion. This is not due to the difference between 1-D and 3-DMonte Carlo modelings, as the extracted properties outside bothmole and vessel should be the same as for the 1-D case due tosimilar assumptions. The source of this difference might be theSCA method, which was used for unmixing of the absorption.SCA (sequential coordinate-wise algorithm for non-negativeleast-squares problems) was chosen for the unmixing of thederived absorption coefficients in the hyperspectral imagesdue to its suitability for GPU implementation. This method wasnot used in unmixing of the absorptions in the 1-D case, wherean ordinary non-negative least-squares algorithm was applied.The use of SCA apparently also results in increased oxygena-tion. The oxygenation should be slightly lower than the inputoxygenation of 95%. This can be traced to a cross talk betweenthe constant baseline absorption and the blood absorptions,where SCA encounters more challenges than an ordinary non-negative least-squares algorithm.
The changes are still characterized well. The properties do notchange significantly across the mole, and an increased BVF isseen for the vessel area. Many scattering events give a washed-out appearance, which makes complete reconstruction difficult.We are still able to extract useful information from the model.
The same behavior is seen for the experimental data. Theproperties have a washed-out, diffuse look due to lateral broad-ening. The characterized properties are, on the other hand, morerealistic than the properties extracted from the 3-D Monte Carlomodel. The oxygenation saturation for the NIR wavelengthrange does not approach 100% and the BVFs are not unrealis-tically high. It seems that the cross talk between the constantbaseline absorption and the blood parameters is not seen here.
With the results from the simulated mole in mind, we canexpect the melanin content to be underestimated inside thereal mole. This is seen. The other extracted parameters seemto be affected by this. They were not affected for the 3-D MonteCarlo. This seems to be mainly due to a change in scatteringparameters. Compared to normal skin, scattering propertiesare altered due to the structural difference of a mole. The methoddoes not rectify variations in scattering, though scattering var-iations may be observed in the more extreme cases by quantify-ing the misfit between the different wavelength ranges.
The trends of the extracted parameters are as expected fromthe experiences with the simulations. The BVFs are increasedwhere blood vessels are localized. The vessels extracted fromthe NIR wavelength range are likely to carry venous bloodsince the depths of these are less than the depths of the largearteries. The oxygenation here is lowered compared to the oxy-genation in the rest of the tissue, which is assumed to be correct.
The extracted oxygenations are decreased after occlusion of thearm, which is expected.
In general, the oxygenation extracted from the blue–greenwavelength interval is lower than the oxygenation extractedfrom the NIR wavelength interval. This agrees with resultsfound by Tseng et al.,29 and is likely due to differences invascularization down to the different penetration depths.21
The melanin is slightly underestimated for lower oxygen-ations and at the locations of larger blood vessels. The formeris mainly due to cross talk with deoxyhemoglobin. The lattermay be due to both cross talk and changes in the boundary con-dition assumptions (e.g., changes in refraction indices).
SCAwas used in the unmixing process. While having no con-vergence guarantees, it still minimizes the differences betweenthe fitted and derived absorption coefficients. This is evidentfrom the displayed spectra fits in Fig. 15. Still, it should notbe trusted for the unmixing of larger wavelength intervals andmany chromophores. The experiences with theMonte Carlo sim-ulations showed SCA to be less trustworthy than a more ordinarynon-negative least-squares algorithm. SCA has, however, the ad-vantage of being more suitable for GPU implementation. Futurework will involve improving the unmixing algorithms. This canbe done either by improving SCA, adapting other non-negativeleast-squaresGPU implementations,47 or by implementing a non-negative least squares algorithm optimized for problems such asthe unmixing of hyperspectral imagery.48
Illumination problems in the image lead to some artifacts inthe extracted parameters. This issue in the imaging technique iscurrently being addressed in another study which aims to use3-D modeling to obtain a digital elevation model and flattenthe image.
The developed model is a proof of concept where we haveshown the possibility of characterizing spatially resolved tissueproperties in real-time. The model will still be further developedto obtain more complexity and accuracy. The isotropic sourcefunctions used in the model will be exchanged by more accurateDelta-Eddington source functions.46 No special assumptionswere made for the blood vessel distribution in the skinmodel. It is known that assuming an average blood vessel diam-eter will affect the apparent absorption levels in blood.49 Thelack of such a correction of the blood absorption may haveaffected the extracted blood oxygenation and BVF, and is some-thing which will be implemented in the future.
The initial results obtained from the hyperspectral imagesshow promise in the characterization of tissue properties. Themethod can be used to identify interesting areas during imagescan, such as areas where the optical properties are changed (i.e.,wounds, moles, bruises, or other skin lesions). Classificationand statistical methods can be run on the estimated tissue prop-erties to automatize this identification process. The interestingareas may then be more closely investigated.
5 ConclusionAn inverse photon transport model with real-time performancehas been developed for a hyperspectral image scanning systemusing GPU parallelization. The model fulfills the real-timeanalysis constraints set by the hyperspectral setup, leaving a lotof computational time for additional image processing.
Simulations have shown that the inverse model has an abilityto characterize changes in optical properties. Running the inversemodel on hyperspectral images of skin shows promising results.
Future work will involve improvement of the unmixing algo-rithms and complexity of the models.
Journal of Biomedical Optics 066003-10 June 2014 • Vol. 19(6)
Bjorgan, Milanic, and Randeberg: Estimation of skin optical parameters for real-time hyperspectral imaging applications
Downloaded From: https://www.spiedigitallibrary.org/journals/Journal-of-Biomedical-Optics on 27 Jan 2022Terms of Use: https://www.spiedigitallibrary.org/terms-of-use
AcknowledgmentsThanks to Norsk Elektro Optikk and the Norwegian DefenceResearch Establishment for exchange of code. The NorwegianResearch School in Medical Imaging has provided funding forthis project through the MedIm Bridging Grant. Thanks toLukasz Paluchowski for help with the experimental work.
References1. G. Lu and B. Fei, “Medical hyperspectral imaging: a review,” J. Biomed.
Opt. 19(1), 010901 (2014).2. T. Skauli et al., “A compact combined hyperspectral and polarimetric
imager,” Proc. SPIE 6395, 639505 (2006).3. L. L. Randeberg, E. L. P. Larsen, and L. O. Svaasand, “Characterization of
vascular structures and skin bruises using hyperspectral imaging, imageanalysis and diffusion theory,” J. Biophotonics 3(1–2), 53–65 (2010).
4. E. L. Larsen et al., “Hyperspectral imaging of atherosclerotic plaques invitro,” J. Biomed. Opt. 16(2), 026011 (2011).
5. J. Hernandez-Palacios et al., “Hyperspectral characterization of fluoro-phore diffusion in human skin using a scmos based hyperspectral cam-era,” Proc. SPIE 8087, 808717 (2011).
6. M. Denstedt et al., “Hyperspectral imaging as a diagnostic tool forchronic skin ulcers,” Proc. SPIE 8565, 85650N (2013).
7. E. Alerstam et al., “Next-generation acceleration and code optimizationfor light transport in turbid media using gpus,” Biomed. Opt. Express1(2), 658–675 (2010).
8. Y. Tarabalka et al., “Real-time anomaly detection in hyperspectraliimage using multivariate normal mixture models and gpu processing,”J. Real-Time Image Proc. 4(3), 287–300 (2009).
9. N. Keshava and J. Mustard, “Spectral unmixing,” IEEE Signal ProcMag. 19, 44–57 (2002).
10. L. Wang, S. L. Jacques, and L. Zheng, “Mcml monte carlo modeling oflight transport in multi-layered tissues,” Comput. Meth. Prog. Bio.47(2), 131–146 (1995).
11. L. Svaasand et al., “Tissue parameters determining the visual appear-ance of normal skin and port-wine stains,” Laser Med. Sci. 10,55–65 (1995).
12. R. C. Haskell et al., “Boundary conditions for the diffusion equation inradiative transfer,” J. Opt. Soc. Am. A 11, 2727–2741 (1994).
13. T. Spott et al., “Application of optical diffusion theory to transcutaneousbilirubinometry,” Proc. SPIE 3195, 234–245 (1998).
14. L. L. Randeberg et al., “A novel approach to age determination of trau-matic injuries by reflectance spectroscopy,” Laser Surg. Med. 38(4),277–289 (2006).
15. R. Zhang et al., “Determination of human skin optical properties fromspectrophotometric measurements based on optimization by geneticalgorithms,” J. Biomed. Opt. 10(2), 024030 (2005).
16. T. Tseng et al., “Quantification of the optical properties of two-layeredturbid media by simultaneously analyzing the spectral and spatial infor-mation of steady-state diffuse reflectance spectroscopy,” Biomed. Opt.Express 2(4), 901–914 (2011).
17. H. Cen and R. Lu, “Quantification of the optical properties of two-layerturbid materials using a hyperspectral imaging-based spatially-resolvedtechnique,” Appl. Opt. 48(29), 5612–5623 (2009).
18. CUDA Toolkit Documentation, CUDA C Programming Guide, 2012,http://docs.nvidia.com/cuda (8 May 2014).
19. T. Skauli et al., “An airborne real-time hyperspectral target detectionsystem,” Proc. SPIE 7695, 76950A (2010).
20. L. L. Randeberg et al., “Performance of diffusion theory vs. monte carlomethods,” Proc. SPIE 5862, 58620O (2005).
21. L. L. Randeberg et al., “In vivo spectroscopy of jaundiced newborn skinreveals more than a bilirubin index,” Acta Paediatr. 94(1), 65–71(2005).
22. W. G. Zijlstra, A. Buursma, and O. W. van Assendelft, Visible and NearInfrared Absorption Spectra of Human and Animal Haemoglobin, VSP,Utrecht (2000).
23. H. Buiteveld, J. M. H. Hakvoort, and M. Donze, “The optical propertiesof pure water,” Proc. SPIE 2258, 174–183 (1994).
24. R. L. P. van Veen et al., “Determination of vis-nir absorptioncoefficients of mammalian fat, with time- and spatially resolved diffuse
reflectance and transmission spectroscopy,” in Proc. BiomedicalTopical Meeting, SF4, Optical Society of America, Washington DC(2004).
25. S. L. Jacques, “Optical properties of biological tissues: a review,” Phys.Med. Biol. 58(11), R37–R59 (2013).
26. A. N. Bashkatov et al., “Optical properties of human skin, subcutaneousand mucous tissues in the wavelength range from 400 to 2000 nm,”J. Phys. D: Appl. Phys. 38, 2543–2555 (2005).
27. M. J. C. van Gemert et al., “Skin optics,” IEEE Trans. Biomed. Eng.36, 1146–1154 (1989).
28. W. H. Press et al., Numerical Recipes, Cambridge University Press,Cambridge, UK (2007).
29. S. Tseng et al., “Chromophore concentrations, absorption and scatteringproperties of human skin in-vivo,” Opt. Express 17, 14599–14617(2009).
30. R. B. Saager et al., “Method for depth-resolved quantitation of opticalproperties in layered media using spatially modulated quantitativespectroscopy,” J. Biomed. Opt. 16(7), 077002 (2011).
31. V. Franc, V. Hlavac, and M. Navara, “Sequential coordinate-wise algo-rithm for the non-negative least squares problem,” in Proc. ComputerAnalysis of Images and Patterns, 11th International Conference, CAIP2005, Versailles, France, September 5-8, 2005. Lecture Notes inComputer Science, Vol. 3691, pp. 407–414, Springer, New York (2005).
32. E. Salomatina et al., “Optical properties of normal and cancerous humanskin in the visible and near-infrared spectral range,” J. Biomed. Opt.11(6), 064026 (2006).
33. P. Naglic et al., “Applicability of diffusion approximation in analysis ofdiffuse reflectance spectra from healthy human skin,” Proc. SPIE 9032,90320N (2013).
34. R. J. Hanson and C. L. Lawson, Solving Least Squares Problems,Society for Industrial and Applied Mathematics, Philadelphia (1995).
35. M. Milanic and B. Majaron, “Three-dimensional monte carlo model ofpulsed-laser treatment of cutaneous vascular lesions,” J. Biomed. Opt.16(12), 128002 (2011).
36. M. Friebel et al., “Determination of optical properties of human blood inthe spectral range 250 to 1100 nm using Monte Carlo simulation withhematocrit-dependence effective scattering phase functions,” J. Biomed.Opt. 11(3), 034021 (2006).
37. H. Li, L. Lin, and S. Xie, “Refractive index of human whole blood withdifferent types in the visible and near-infrared ranges,” Proc. SPIE 3914,517–521 (2000).
38. Hyspex VNIR-1600, “Main specifications,” http://www.hyspex.no/products/hyspex/vnir1600.php (8 May 2014).
39. A. A. Green et al., “A transformation for ordering multispectral data interms of image quality with implications for noise removal,” IEEE T.Geosci. Remote 26, 65–74 (1988).
40. L. V. Wang and H. Wu, Biomedical Optics, Principles and Imaging,John Wiley & Sons, Hoboken, New Jersey (2007).
41. J. Laufer et al., “Effect of temperature on the optical properties of ex vivohuman dermis and subdermis,” Phys. Med. Biol. 43 2479–2489(1998).
42. O. S. Khalil et al., “Temperature modulation of the visible and nearinfrared absorption and scattering coefficients of human skin,” J.Biomed. Opt. 8(2), 191–205 (2003).
43. T. Lister, P. A. Wright, and P. H. Chappell, “Optical properties of humanskin,” J. Biomed. Opt. 17(9), 090901 (2012).
44. C. G. Rylander et al., “Dehydration mechanism of optical clearing intissue,” J. Biomed. Opt. 11(4), 041117 (2006).
45. E. K. Chan et al., “Effects of compression on soft tissue optical proper-ties,” IEEE J. Sel. Top. Quant. 2(4), 943–950 (1996).
46. T. Spott and L. O. Svaasand, “Collimated light sources in the diffusionapproximation,” Appl. Opt. 39, 6453–6465 (2000).
47. Y. Luo and R. Duraiswami, “Efficient parallel nonnegative least squareson multicore architectures,” SIAM J. Sci. Comput. 33, 2848–2863 (2011).
48. M. H. Van Benthem and M. R. Keenan, “Fast algorithm for the solutionof large-scale non-negativity-constrained least squares problems,”J. Chemometrics 18, 441–450 (2004).
49. L. O. Svaasand et al., “Therapeutic response during pulsed laser treat-ment of port-wine stains: dependence on vessel diameter and depth indermis,” Laser Med. Sci. 10, 235–243 (1995).
Biographies of the authors are not available.
Journal of Biomedical Optics 066003-11 June 2014 • Vol. 19(6)
Bjorgan, Milanic, and Randeberg: Estimation of skin optical parameters for real-time hyperspectral imaging applications
Downloaded From: https://www.spiedigitallibrary.org/journals/Journal-of-Biomedical-Optics on 27 Jan 2022Terms of Use: https://www.spiedigitallibrary.org/terms-of-use