North Carolina Agricultural and Technical State University Estimation of Markov transition matrices with aggregate data: An application to modeling no-till frequency Lyubov A. Kurkalova and Dat Quoc Tran
Transcript
North Carolina Agricultural and Technical State University
Estimation of Markov transition matrices with aggregate data:
An application to modeling no-till frequency
Lyubov A. Kurkalova and Dat Quoc Tran
North Carolina Agricultural and Technical State University
This presentation Motivation for interest in dynamics of tillage choices Markov chain model of crop-tillage choice Data, estimation, and results Conclusions and next steps
North Carolina Agricultural and Technical State University
Conservation tillage Tillage
»Conventional - leaves less than 30% the soil covered with crop residue after planting
»Conservation (CT) – 30% or more residue coverNo-till (NT) – only minimal amount of soil disturbed
CT, and especially NT provides significant environmental benefits, when compared to conventional till»Reduction in soil erosion by water and wind»Reduction in Nitrogen and Phosphorus run-off»Carbon sequestration (Lal at al., 1999, Lal et al., 2004)
North Carolina Agricultural and Technical State University
Dynamics of tillage For carbon sequestration benefits to occur, CT needs to be
practiced continuously over several years in a row»Even a single year of conventional till in between years of CT (NT)
releases most of the accumulated carbon back to atmosphere (Manley et al., 2005; Conant et al., 2007)
However, most of the empirical economic studies of tillage choices did not account for the dynamics:» Binary, single year choice between tillage regimes (e.g., Conventional vs.
NT), conditional on the crop grown (Rahm and Huffman, 1984; Soule at al., 2000; Pautsch et al., 2001; Vitale et al., 2011; Druschke and Secchi, 2014)
North Carolina Agricultural and Technical State University
Dynamics of tillage: Limited data Nation-wide USDA ARMS (Agricultural Resources
and Management Survey)» Selected years, crops, states» Limited attempts to gather information on continuous CT
Nation-wide CTIC (Conservation Technology Information Center)»Tillage systems by county and crop, yearly 1989 –1998, 2000, 2002,
2004» Survey was not designed to track tillage from one year to another
Regional, based on surveys of farmers: » Hill, 2001; Napier and Tucker, 2001
North Carolina Agricultural and Technical State University
Data: regional studies: Hill (2001, JSWC)
Continuous NT Corn-soybean, 1994 - 1999 Randomly selected 230 fields in
each surveyed county
State/ counties surveyed
% fields in NT continuously for the indicated number of years
North Carolina Agricultural and Technical State University
Rotational tillage
Anecdotal evidence from Conservation Effects Assessment Project (USDA CEAP studies):» Farmers rotate tillage from one year to another»Tillage rotation is closely associated with crop rotation
Iowa and central Illinois:Soybeans: high probability of NTCorn: lower probability of NTCorn-after-corn: even lower probability of NT
Question: can we estimate these probabilities with the yearly county-level data from CTIC?
North Carolina Agricultural and Technical State University
Present study Assume that crop-tillage choice could be described as a
stationary 1st order Markov process
Si, i = 1,2,3,4 is the share of state’s cropland in1 – NT-corn, 2 – till-corn, 3 – NT-soybeans, 4 – till-soybeans
Each transition probability pij represents the probability of crop-
tillage category i after crop-tillage category j the year before
11 21 31 41
1 12 22 32 421 2 3 4 1 2 3 4
13 23
14 24
0 0
0 0
t t
p p p p
p p p ps s s s s s s s
p p
p p
North Carolina Agricultural and Technical State University
NT cornTill corn
NT soybeansTill
soybeans
The 1st order Markov transition diagram
North Carolina Agricultural and Technical State University
CTIC data and assumption for the model
No-till crop-tillage share, Source: CTIC
North Carolina Agricultural and Technical State University
Estimation of Markov probability matrix
If the transitions from one crop-tillage category to another (field-level) are observed, then Maximum Likelihood can be used (Anderson and Goodman, 1957)
North Carolina Agricultural and Technical State University
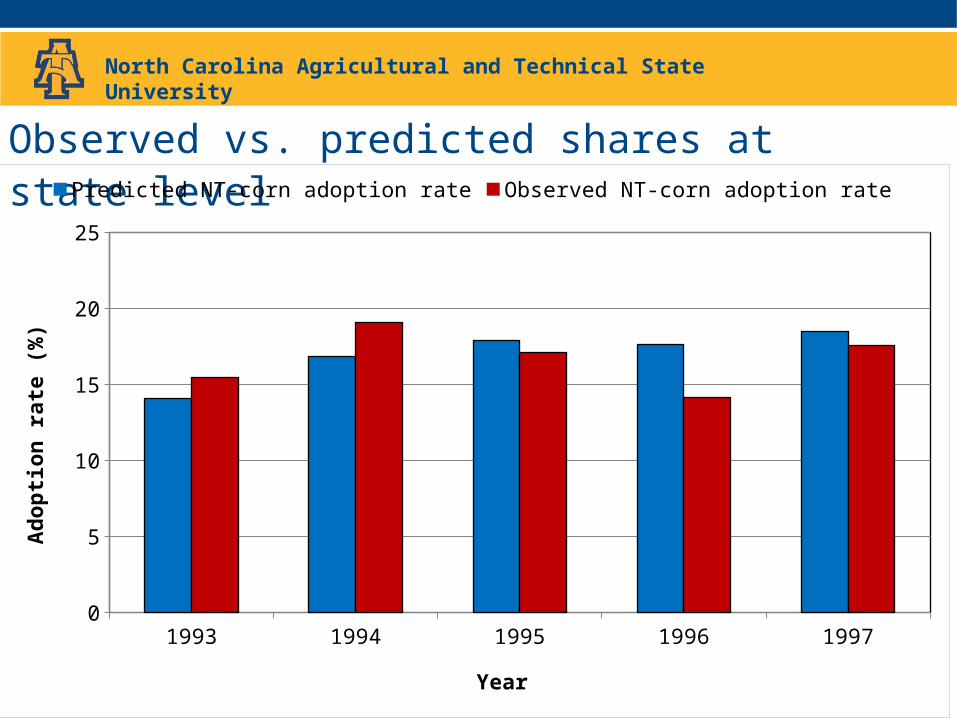
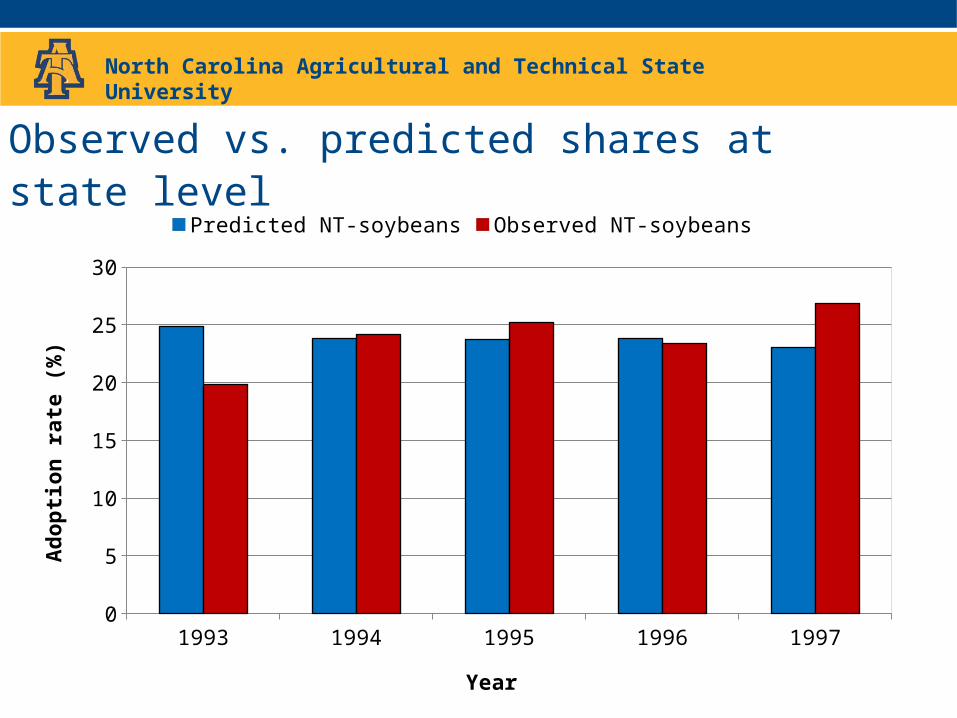
Observed vs. predicted shares at state level
1993 1994 1995 1996 19970
5
10
15
20
25
30
Predicted NT-soybeans Observed NT-soybeans
Year
Ad
opti
on r
ate
(%)
North Carolina Agricultural and Technical State University
IL, Mercer county
Probability of a field being in NT 2 years in a row• Hill (2001):
58.1%• Markov model:
54.1%
0.00 0.06 0.62 0.32
0.25 0.23 0.23 0.29
0.46 0.54 0 0
0.27 0.73 0 0
North Carolina Agricultural and Technical State University
Conclusions and next steps Conclusions:
»Markov model provides a useful way of describing the dynamics of crop-tillage choices in Iowa
»Estimates of the probabilities of transition between alternative crop-tillage categories are consistent with qualitative data on dynamics of tillage in Iowa
Next steps:»Analyze the effect of soil productivity in the estimated Markov transition
matrices»Analyze the within-state variation in the estimated Markov transition
matrices»Extend the model to allow the Markov transition matrix to vary across
time»Apply the Markov process approach to cropping patterns data derived
from USDA/NASS-collected CDL
North Carolina Agricultural and Technical State University
Acknowledgements
Partial support from USDA/ERS/Evans-Allen is gratefully acknowledged
The views expressed in this presentation are those of the authors and do not necessarily reflect the views or policies of the USDA
North Carolina Agricultural and Technical State University