18
Estimation of the gender pay gap in London and the UK: an econometric approach Margarethe Theseira and Leticia Veruete- McKay GLA Economics 17 May 2005 www.london.gov.uk/mayor/economic_unit

Estimation of the gender pay gap in London and the UK: an econometric approach
Margarethe Theseira and Leticia Veruete-McKayGLA Economics17 May 2005
www.london.gov.uk/mayor/economic_unit

Overview
One of the Mayor’s priorities is to improve access to London jobs for all people. London’s economic structureEconomic activity rates of womenWhere are women in London working?Women on the boardWomen as business ownersGender pay gap

Introduction
This presentation will concentrate on two main issues:
1) Why we used STATA instead of other software
2) How we used STATA to analyse the gender pay gap in London and the UK. Commands that we found useful for our research

Reasons for using STATA
Version 8 is more user friendly than previous versions: Choice of using menus for different commands and/or doing programming ( DO FILES ). More flexibility for programming than SPSS.Easy to handle large datasets and the facility of the matrix notation. Access to powerful statistical analysis, such as cross tabulations, percentiles in the distribution.Easy to run regressions for a cross sectional analysis or panel analysis for around 10,000 households with more than 40 independent variables.

Our research interests
Understand differences between:
1. Employment rates by gender in London compared to the rest of the UK.
2. Wages of men and women, in London and outside of London:
Wages for men and women by individual and job characteristics.Matrix of wages by occupation and industry (for men and women).Modelling the gender pay gap in London and the UK.

Data used and filtering
Used Labour Force Survey (LFS):– 60,000 households in the UK and about 26,000 resident
persons in Greater London.– Needed sample of those working age population by gender.
Women working age is between 16-59 and for men is 16-64. Filtering data:
keep if (age >=16 & age <=64 & sex==1) | (age >=16 & age <=59 & sex==2)
Provide two main broad applications using STATA in our research:
1) Calculation of employment rates for women and men and their wages by different individuals and job characteristics
2) Estimate unequal treatment between women and men: Decompose average gender pay gap in London into a) different individual and job characteristics and b) discrimination and/or unexplained factors.

Employment rates by gender and age
Employment = number of employees+ self employed + government employment/working age populationSource: Labour Force Survey (LFS), 2002/03

Wages by deciles for men and women in London
Full time hourly earnings
0
10,000
20,000
30,000
40,000
50,000
60,000
70,000
80,000
90,000
100,000
5.8 andunder
5.8 - 7.4 7.4 - 8.8 8.8 -10.3
10. 3 -11.9
11.9 -13.7
13.7-16.0
16.0 -19.6
19.6 -25.9
25.9 andover
Decile 1 Decile 2 Decile 3 Decile 4 Decile 5 Decile 6 Decile 7 Decile 8 Decile 9 Decile 10Hourly pay (£) divided by male wage deciles
Num
ber o
f peo
ple
MalesFemales
Source: LFS data, 2002/03

Gender pay gap by occupation and whether private or public sector
-
20.0
40.0
60.0
80.0
100.0M
anag
ers
and
seni
or o
ffici
als
Pro
fess
iona
loc
cupa
tions
Ass
ocia
tepr
ofes
sion
al a
ndte
chni
cal
Adm
inis
trativ
e an
dse
cret
aria
l
skill
ed tr
ades
occu
patio
ns
Per
sona
l ser
vice
occu
patio
ns
Sal
es a
nd c
usto
mer
serv
ice
occu
patio
ns
Pro
cess
, pla
nt a
ndm
achi
ne o
pera
tives
Ele
met
ary
occu
patio
ns
Private sectorPublic sector
Female hourly pay as % of male hourly pay
Source: LFS data, 2002/03

Useful commands
For standard cross tabulation: TABULATE variable 1 variable 2 [fweight=name variable of weight] if all different conditions.
To calculate wages at different points of the distribution with two different characteristics and count the number of individuals at that wage: TABLE characteristic 1 characteristic 2 (if all different conditions) [fweight=name variable of weight], contents (median wage count wage) row col

Estimating discrimination
Implement Oaxaca’s decomposition, which decomposes the mean gender pay gap into two main components:
I) Individual and job characteristics between men and women. Estimate wage differential in absence of discrimination.
II) Discrimination part (and/or unexplained factors):A) Overpayment of men orB) Underpayment of women

Oaxaca and Ransom’s approach (1994)
Equation (1):
*'*'*' ˆ)()ˆˆ()ˆˆ(lnln βββββ fmffmmfm XXXXWW −+−+−=−
(1A) (1B) (2)where:
fm WandW lnln , denote the mean logarithm wage for men and women respectively.
mX ' and fX ' , are vectors of the mean values of the explanatory variables in the wage regression for men and women respectively.
mβ)
and fβ)
are the vectors of estimated coefficients from the regression equations for men and women respectively.
*β̂ is the estimated vector of coefficients from the equation of all workers.
Estimation of mean gender pay gap
Majority of studies estimate gender pay gap, considering how different male wages are from female wages (and two regression equations).
To estimate the average gender pay gap, our research considered three regression equations:1. For all workers in London2. For all male workers in London3. For all female workers in London

Factors considered to explain pay gap
Age (proxy of experience)Whether working public/private sectorWhether working full-time/part-timeNumber of childrenHighest level of qualificationsEthnicityIndustryOccupationFirm sizeRegion
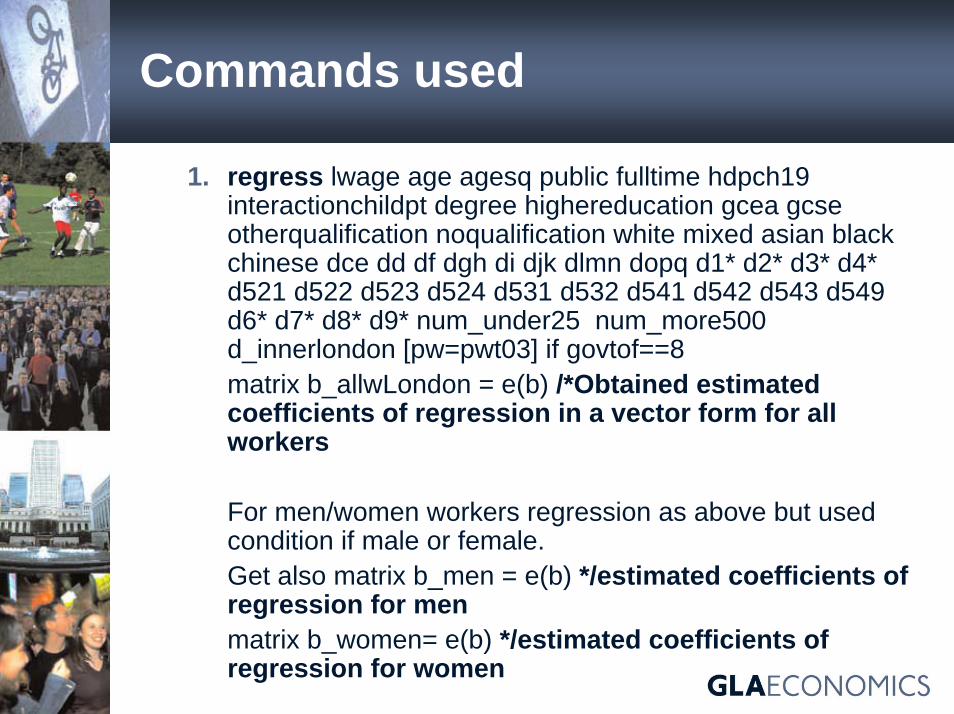
Commands used
1. regress lwage age agesq public fulltime hdpch19 interactionchildpt degree highereducation gcea gcseotherqualification noqualification white mixed asian black chinese dce dd df dgh di djk dlmn dopq d1* d2* d3* d4* d521 d522 d523 d524 d531 d532 d541 d542 d543 d549 d6* d7* d8* d9* num_under25 num_more500 d_innerlondon [pw=pwt03] if govtof==8matrix b_allwLondon = e(b) /*Obtained estimated coefficients of regression in a vector form for all workers
For men/women workers regression as above but used condition if male or female.Get also matrix b_men = e(b) */estimated coefficients of regression for menmatrix b_women= e(b) */estimated coefficients of regression for women

Commands used (2)
2. su lwage age agesq public fulltime hdpch19 interactionchildpt degree highereducation gcea gcseotherqualification noqualification white mixed asian black chinese dce dd df dgh di djk dlmn dopq d1* d2* d3* d4* d521 d522 d523 d524 d531 d532 d541 d542 d543 d549 d6* d7* d8* d9* num_under25 num_more500 d_innerlondon [fw=pwt03] if govtof==8For men/women workers (used condition if male or female). /*Obtained vector of means of each individual and job characteristics
3. Exported vectors of estimated coefficients and mean values of explanatory variables from the three regressions respectively into EXCEL. We calculated components (1A), (1B) and (2) from equation (1) to estimate the mean gender pay gap. This involves the multiplication of the vector of the mean values of the factors considered and the vector of estimated coefficients. In STATA we could use matrix C= E*B for instance

Key findings on gender pay gap
Differences in individual and job characteristics account for most of the gender pay gap.
The impact of direct unequal treatment appears to be slightly lower in London than outside.
London part-time workers of both sexes are paid less than full-time workers.
Among full-time workers, lower paid workers have virtually no difference in pay between men and women however the gender pay gap widens further up the wage distribution to 24 per cent for the top decile.

Final thoughts
We will continue to use STATA in our future research.We would like to calculate the Oaxaca decomposition within STATA using a more elegant programming solution.Our results from this study are published as Women in London’s Economy and available at www.london.gov.uk/mayor/economic_unitThank you for listening!


