Analele Universităţ ţii din Oradea, Seria Geog grafie Year XXVII, no. 2/2017 (December), pp. 164-174 ISSN 1221-1273, E-ISSN 2065-3409 Article no. 272103-747 7 http://istgeorelint.uoradea.ro/Reviste/Anale/anale.htm ESTIMATION OF THE POTENTIAL VULNERABILITY TO FLOODS BY “SUITABILITY MODELING” METHOD. CASE OF BATNA CITY, NORTHEAST OF ALGERIA Kenza SLIMANI PhD student, Natural Hazards and Spatial Planning laboratory (LRNAT), University of Batna 02, Algeria, e-mail: [email protected]Mahdi KALLA Professor, Natural Hazards and Spatial Planning laboratory (LRNAT), University of Batna 02, Algeria, e-mail: [email protected]Abstract: The city of Batna, one of the Algerian cities, is the most exposed to flood risks, which are highly active and constitute a threat to the residents and the infrastructure. To better understand the vulnerability of this phenomenon, an approach of cartography inspired by the method of “suitability modeling” is used. This method allows us to determine the potential vulnerability levels of the study zone; therefore, we need to consider several criteria: socioeconomic factors like density of population, land use, and also physical criteria such as permeability, flow direction, and the like. Each of these various criteria was built on a database, which constituting an important element for building a model that helps us determine the vulnerable zones by using various GIS applications. The applied approach that depends on how the criteria are suitable give us 4 different levels of vulnerability in Batna, which are as follows: high vulnerability, 13% of the city’s total surface, average vulnerability 5%, low vulnerability 0.7%, and null vulnerability 82%. Key words: Batna, Floods, vulnerability, suitability, model, SIG, * * * * * * INTRODUCTION In the face of the global threat which represents the climate change, the disasters bound to the increasing vulnerability of societies urbanized to climatic hazards became one of the major concerns in a triple title; At first, because more than half world population is today urban (UN-Habitat, 2010), and because our cities today recognize a very important population growth, that one noticed on the urbanized circles which are already situated in zones in displayed to the risks. Then, because since the second half of the XX th century the urban systems of the whole world where concentrate in multiple issues (populations, activities, material and immaterial properties) knew a strong increase of dramatic episodes activated by lively climatic hazards and causes numerous human losses and especially sometimes exaggerated damage; and finally, Corresponding Author
Transcript
AAnnaalleellee UUnniivveerrssiittăăţţiiii ddiinn OOrraaddeeaa,, SSeerriiaa GGeeooggrraaffiiee Year XXXXVVIIII, no. 22//22001177 (December), pp. 116644--117744 ISSN 11222211--11227733, E-ISSN 22006655--33440099 Article no. 227722110033--774477
Professor, Natural Hazards and Spatial Planning laboratory (LRNAT), University of Batna 02, Algeria, e-mail: [email protected]
Abstract: The city of Batna, one of the Algerian cities, is the most exposed to flood risks, which are highly active and constitute a threat to the residents and the infrastructure. To better understand the vulnerability of this phenomenon, an approach of cartography inspired by the method of “suitability modeling” is used. This method allows us to determine the potential vulnerability levels of the study zone; therefore, we need to consider several criteria: socioeconomic factors like density of population, land use, and also physical criteria such as permeability, flow direction, and the like. Each of these various criteria was built on a database, which constituting an important element for building a model that helps us determine the vulnerable zones by using various GIS applications. The applied approach that depends on how the criteria are suitable give us 4 different levels of vulnerability in Batna, which are as follows: high vulnerability, 13% of the city’s total surface, average vulnerability 5%, low vulnerability 0.7%, and null vulnerability 82%. Key words: Batna, Floods, vulnerability, suitability, model, SIG,
* * * * * *
INTRODUCTION In the face of the global threat which represents the climate change, the disasters bound
to the increasing vulnerability of societies urbanized to climatic hazards became one of the major concerns in a triple title; At first, because more than half world population is today urban (UN-Habitat, 2010), and because our cities today recognize a very important population growth, that one noticed on the urbanized circles which are already situated in zones in displayed to the risks. Then, because since the second half of the XXth century the urban systems of the whole world where concentrate in multiple issues (populations, activities, material and immaterial properties) knew a strong increase of dramatic episodes activated by lively climatic hazards and causes numerous human losses and especially sometimes exaggerated damage; and finally,
Corresponding Author
Estimation of the Potential Vulnerability to Flood by ”Suitability Modeling” Method.
165
because the climate change represents a factor of additional uncertainty for the socio-ecological systems, complex urban and “meta-risk” (Gilbert, 2003).
In this context, there is a concept which was used by many people working in natural hazards management domain; it is the vulnerability, this notion is difficult to seize, in particular, because its sense is not the same for all. It also gave rise to a scientific debate. Certain researchers approach it from the potential damage of the human beings and the properties; others define it according to favorable factors to the damages or response capacity of societies to a catastrophic situation (D’Ercole, 1994; Herman, 2009, 2010).
As such, the city of Batna, like many cities of the world, is exposed to periodically violent floods, sometimes putting in danger the lives of the population and property. These past few years marked a huge and continuous increase in the frequency of natural disasters, the floods, which had an impact on the people and the properties.
In this study, the identification of the vulnerability needs a certain analytical cartographic approach, which depends on the database of a few physical and socioeconomic criterion comprising certain and various levels and weights. For this purpose; we have adopted a method which is “suitability modeling”; this one depends on raster data and it’s one of the most important classic methods in GIS applications, in suitability modeling, spatial data is classified and combined to identify sites most suitable for a specific use (Clio Andris). The majority of researchers are using this approach for studying urban matters such as habitat and land use. However, in our case, we are going to use it in a different way, exactly as it was used in the natural hazards domain, where this method will help us determine the extent to which our city is vulnerable to floods hazard according to numerous criteria. Then, as regards the most important points and objective of this study, is that our work here based essentially on database construction for a several elements already selected to extract a model, this one indicates the levels of the vulnerability and which allows us to determine vulnerable zones to floods in Batna City.
DESCRIPTION OF STUDY ZONE The city of Batna, our study zone, it’s an Algerian municipality and the center administrative of
Batna province, the city situated about 435 km in the southeast of the capital Algiers and 113 km in the southwest of Constantine's province, Batna located between the north and the south Atlas Mountains.
Figure 1. The Geographic situation of Batna City
Kenza SLIMANI, Mahdi KALLA
166
The city extends over 40 km², it is surrounded by Oued Chaaba, Fesdis, and Tazoult, and its altitude varies between 965 m and 1100 m. The city of Batna located between 35.55° of attitude and 6.17° of longitude. At the level of the watershed our city situated under Oued El Gourzi's sub-watershed exactly in the large Constantine High plateaus watershed (figure 1).
The city of Batna Characterized by a semiarid climate, which can be dry during summer with a temperature average of 33.8 C° and very cold in winter with an average of 5.2 C°. For the precipitation; this one estimated with 375,4 mm per year. The city also has several rivers which cross it: the main Oued El Gourzi and its main tributaries; Tazoult, Oued Bou Idane and Sguene.
The terrain surrounds the city of Batna is poor of vegetation, especially in zones following rivers, even it has generally a very low permeability in the end of 2014; number of population of Batna City has estimated 325 178 inhabitant, which represents 26.1% of the total number of the whole province since the last census.
METHODOLOGY The approach used in this study was inspired by the suitability modeling method, this method
considers as a spatial analysis multi-criterion which allows us to combine several criteria, of a different nature, to obtain a cartographic result indicating that areas are more or less suitable, to solve a certain problem (Balzarini et al., 2012). We are based first of all on criteria for purpose to create our vulnerability model, we have chosen a group contains a physic morphometric and socioeconomic criteria to see in the end if the combination between this elements can be suitably enough to give a vulnerable environment, and for that we are going to determine in the first place the database for each criterion in form of raster data. This method realizes essentially by ArcGIS 10.2. program (English version) and exactly with both applications; Classify and Weighted Overlay.
In this context and as what we mentioned before the criteria which were selected for our model are represented by physic morphometric criteria such as; the slope, the permeability flow directions, and for the socioeconomic criteria we have the land use the road network beside to sewage system network. For the used maps in this study, we have taken 04 maps, topographic; Batna (the East and the West) and Arris (the East and the West) with one scale of 1/50 000, we had also Shuttle Radar Topography Mission image (SRTM) with a 30 m of resolution. Including to that, we also used Online ArcGIS Base map. On the other hand, we have also worked on three programs; Hyfran, Hydrolabe, and WMS (watershed modeling system) for the hydrological analysis of El Gourzi River sub-watershed.
THE HYDROLOGICAL ASPECT OF THE STUDY ZONE In this part we are going to focus on the max flows, these represent the pluviometrical
strong intensity events, what characterizes our study zone; that these events are producing on a step of short time with a low occurrence; these optional events are generally at the origin of the natural risks which related to floods in our city.
As regards our study zone, we based on the hydrometric station data under Oued el Gourzi sub-watershed; this station has a series of 44 years; starting from the hydrological year (1969-1970) till the year (2011-2012). The hydrological behavior of Oued El Gourzi sub-watershed, where the city of Batna situated; distributed a considerable quantity of flows which passes by from tributaries (Tazoult, Bouidane, and Sguene) towards the principal river of ' El Gourzi '. According to the observations of the hydrometric station, the sub-watershed gave an annual average considered of 18,1 m ³/s.
THE VULNERABILITY MODEL CRITERIA The physiques criteria Slope The flows generally are conditioned by the slope, where their speed reach to several meters
per second on the grounds that has a steep slope, which let waters more and more concentrated and
Estimation of the Potential Vulnerability to Flood by ”Suitability Modeling” Method.
167
stagnates on the grounds that has a low slope, these can favor the overflowing of waters. In our study zone condition; we distinguish 05 classes.
First class: its slopes between 0 to 3%, which represent 25.1% of the city total surface with 9.8 km².
Second class: it is the most dominant category; between 3-6% it represents 38% of the total surface with 14.9 km².
Third class: its slopes between 6 to 9%, this class presents 22.1% of the total surface with 8.6 km².
Fourth class: which is between 9 to 12%, it presents 9.8% of the total surface with 3.7 km². Fifth class: it is the class which has a weak presence in the study zone; this category is superior to 12% and represents 5.4% of the total surface with 2.1 km².
Permeability According to the lithological nature, we find that Batna City is situated on the following
formations: marls and limestones, also conglomerates, sandstone, clay and blue-grey Marl with limestones, we can find also the recent alluviums which are dominated on the study zone. The set of these formations allowed to distinguish the permeability of our terrain; zones with low permeability which we find it on the North and Northwest part, but in a very weak appearance (1,1%). The second category it is the very low permeability which dominates on study zone (82%) and what increases this lack of permeability is the construction density that reduces the infiltration of terrains and increases the runoff. For the average permeability, we find it generally at the level of the city outskirts; where is agricultural grounds with a considerable percentage of 24%, whereas the high and the highest permeability values; have a low extension (3.4%) and generally we find it in the North and Southwest part of the city.
Flow directions The flow directions it has been defined by the function of ArcGIS “Flow direction”, this
function is based on the principle natural path of waters; that driven by the gravity and guided by the topography, and it is going to allow us to create a GRID of Flow direction for each cell will flow to a neighboring according to the largest downward slope (Minelli and Pirot, 2007).
After the realization of this map, we find eight; cells, each one flows by in one or a several directions, of course depending on drainage slope of our study zone.
After the application of this algorithm, we observe that the flow of our study zone flows in an essential way towards eastward, the North and the West parts of the city.
SOCIO ECONOMIQUE CRITERIA Land use The map of land use can be briefly defined as “the (bio-) physical cover on the surface
emerged lands”. This map includes the vegetation (natural or cultivated) and the spatial planning (habitat, buildings, roads), which occupy the earth’s surface and the hydrography as well (FAO 1998; El Hadraoui, 2013). The realization of the land use map consists a very important criterion for our vulnerability model, this map develops essentially from a several data sources such as the satellite images and the aerial or spatial photos, and which is going to be treated by various programs of GIS; such as ArcGIS. According to the land use map; the artificialized territory of the study zone occupies about 13.7 km², where 52.4% of this surface represents the individual and collective habitats, 19.7% represents all various equipment and 25.5% occupies by the industrial and commercial activities, while 2.2% stays for the green space (figure 2).
The road network In this part, we are going to give the typology of our roads network, and depending on this
creation database, where we can conclude the types of roads with the numbers of the existing lines.
Kenza SLIMANI, Mahdi KALLA
168
Figure 2. The lande use map of Batna City
Figure 3. The Sewage network map of Batna City
Estimation of the Potential Vulnerability to Flood by ”Suitability Modeling” Method.
169
Table 1. The road network typology of Batna City
Road type Railway principal Primary Secondary Tertiary Residential
Lines number 6 12 18 46 63 1467
Sewage network According to the National Sanitation Office and the hydraulics direction; Batna City drained by a
Unitarian sewage system type (waste water and rain waters) with a total line of 371 km of various diameters, actually now the city has connected with 95% of the sewer. The network includes approximately 9000 cesspools, also 26 weirs where there are only 8 weirs available to work. All discharges are linked downstream of the city with a water-treatment plant (capacity of 200.000 eq/habs).
From our study, the city of Batna generally has a sewer system varied between a very good situation (39% of principal lines and 14% of secondary lines, whereas 15.3% of new lines are already function) to bad situation (61% of principal lines and 15% secondary lines), this last remains because of maintenance care and a real effective cleaning absence, especially that the majority of conduits have small diameters (400-1000 mm) what can create deposits and clog problems, and the decrease of conduits capacity engenders the rise and the overflowing of waters which provoke floods (Kalla et al., 2009).
Density of population Because population represents an essential element, so we have chosen it as one of our
vulnerability model criteria. As regards Batna City’s demography this one knows a significant population evolution, what makes the citizens build near to flood exposed zones. According to the available data (the last statistics of RGPH 2008) we find that the population of the Batna City is estimated at 307 393 inhabitants and which present a demographic weight with more than 27% of the state population total and 1.97% as growth rate, generally the population of the city almost tripled in the last 30 years (181 601 habs in the year 1987 and 246 800 habs in 1998), what already explains the largest growth of population of the same city.
Figure 4. The population density of Batna City sectors
(Data source: O.N.S Batna)
Kenza SLIMANI, Mahdi KALLA
170
THE VULNERABILITY MODEL Our model was inspired by another method which is called “Suitability modeling”, this
approach bases mainly on the criteria (Berrocal, 2012); which we already chose to create this model, this one will be built from the following equation:
IV = (1)
Where: IV: the vulnerability index; Wi: the criterion weight; Ci: The vulnerability criterion; r : restriction. In case of our study zone, the vulnerability model will be determined by the following
criteria: - IV1 for the physical criteria; the slope, the permeability and flow direction - IV2 for the socioeconomic criteria; the land use, the road network, the sewage situation
system and the population density. The combination between both equations gives the final IV
IV1 = (2)
IV2= (3)
so:
IV= (4)
The weight of each criterion will present in the following table:
Table 2. The weight of each vulnerability criteria
Criterion weight Model Weight
slope Permeability
Flow direction
25% 25% 50%
IV1
50%
Land use Road network
sewage situation population Density
25% 20% 25% 30%
IV2
50%
And for the categories classification of each criterion, we gave a scale from 1 to 4 for each, depends on their importance
Table 3. The classification of categories for each vulnerability criteria
Estimation of the Potential Vulnerability to Flood by ”Suitability Modeling” Method.
171
flow direction
permeability
west South
North-east North-west South-east South-west
P. very low
P. low P. average
P. steep P. very steep
2 2 3 3 4 4 1 1 2 3 4
sewerage situation
population Density
Primary Secondary Tertiary
Residential
Very good good
average bad
0.5 – 32.7 hab/hec
32.8 – 68 68.1 – 112.1 112.2 – 223.2
1 2 3 2 4 3 2 1 4 3 2 1
The form of our model was built by the model tool, then we need to use both functions
Reclassify and Weighted Overlay but before the application of this model it is necessary to convert the maps from the Victor format to Raster format (figure 5).
Figure 5. The vulnerability model builder by ArcGIS
RESULTATS ET DISCUSSION The final vulnerability flood model gives us 4 classes which indicate:
Class1: represent the high vulnerability in red color. Class 2: represent the average vulnerability in yellow color. Class 3: represent the weak vulnerability in green color. Class 4: represent the null vulnerability, in a transparent color.
Kenza SLIMANI, Mahdi KALLA
172
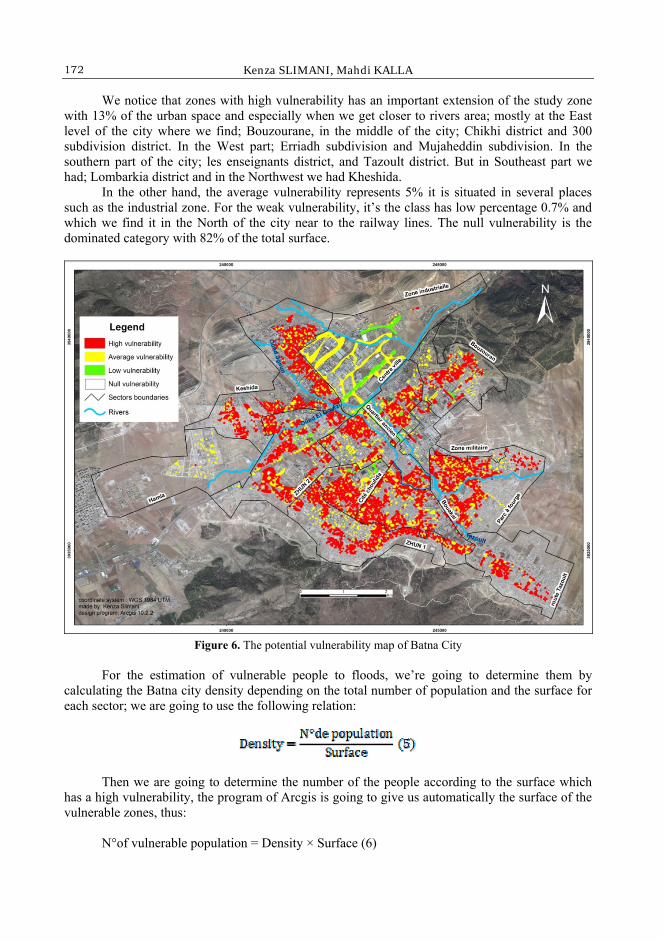
We notice that zones with high vulnerability has an important extension of the study zone with 13% of the urban space and especially when we get closer to rivers area; mostly at the East level of the city where we find; Bouzourane, in the middle of the city; Chikhi district and 300 subdivision district. In the West part; Erriadh subdivision and Mujaheddin subdivision. In the southern part of the city; les enseignants district, and Tazoult district. But in Southeast part we had; Lombarkia district and in the Northwest we had Kheshida.
In the other hand, the average vulnerability represents 5% it is situated in several places such as the industrial zone. For the weak vulnerability, it’s the class has low percentage 0.7% and which we find it in the North of the city near to the railway lines. The null vulnerability is the dominated category with 82% of the total surface.
Figure 6. The potential vulnerability map of Batna City
For the estimation of vulnerable people to floods, we’re going to determine them by
calculating the Batna city density depending on the total number of population and the surface for each sector; we are going to use the following relation:
Then we are going to determine the number of the people according to the surface which
has a high vulnerability, the program of Arcgis is going to give us automatically the surface of the vulnerable zones, thus:
N°of vulnerable population = Density × Surface (6)
Estimation of the Potential Vulnerability to Flood by ”Suitability Modeling” Method.
173
The results that “Bouakal” sector represents the largest vulnerable population number (26 864 habs with 48.6% of the total number of sectors), what shows that the criteria in this sector are highly suitable to create a vulnerable environment to floods.
Our vulnerability model is also allowing us to determine the potential vulnerability of various equipment and infrastructures of the city and the following table represents the most vulnerable components of Batna.
Table 4. The vulnerable equipment and infrastructures of Batna City
Industry and Trade The industrial zone. 03 shopping centers.
Road network Principal Primary
Secondary Tertiary
residential
02 lines. 09 lines. 23 lines. 27 lines.
831 liens.
Our vulnerability model is also allowing us to determine the potential vulnerability of
various equipments and infrastructures of the city and the following table represents the most vulnerable components of the city system.
The vulnerable levels given by the approach can explain that the chosen criteria could be more or less suitable for the different sensibility degrees to floods; high vulnerability 13% (criteria more suitable), moderate vulnerability 5% (criteria moderately suitable), low vulnerability 0.7% (weak suitability) and null vulnerability 82% (no suitability). Here, we found that the Bouakal sector is the most sensible sector among the other city sectors because the criterion that exists and characterizes Bouakal is like this: the bad sewage network, the high population density, habitats, apart from the physical criteria, make this section of the city very vulnerable. Therefore, the obtained results are logical and already commensurate with the terrain reality, whereas Bouakal is considered to be one of the largest city sectors that were damaged by floods.
In fact, this approach has been successfully used in many domains such as habitats and urban domains. For that, we can mention building health facilities as spatial modeling of site suitability assessment for hospitals (Abdullahi et al., 2013). The results can add a new qualification to this method, specially the fact that the observed changes always make our planet vulnerable to certain phenomena such us floods. So, this suitability modeling approach has the ability to give a prevision to guess the phenomena probable damages. Therefore, we can suggest the adequate operations to avoid as much as possible, the losses of human beings and their properties and all the different infrastructures. This considered the important objective of natural hazards management. We can say that this approach fits this domain.
CONCLUSION In the last decades Batna City knew an increase of floods phenomenon, especially at the
level of its effects where the last floods of September 2007 and, July 2008 caused important human and material damages, which explains the evolution of the vulnerability, especially that
Kenza SLIMANI, Mahdi KALLA
174
floods affected one of the important commercial districts in the center city. Among responsible factors for this damage, it is the population explosion and also the spread of construction zones nearby to rivers that cross the city, on the other hand, there is physical factors as well; the basin form of the city, slope, the flows ... etc.; all these factors could affect the circulation of precipitated waters on the ground. suitability modeling with GIS approach gave us a view on the vulnerable places in our urban environment; what allows to distinguish the adequate strategies for purpose to decrease the vulnerability to floods in Batna City and as a first step; the concerned authorities put various projects to manage precipitation waters which flow towards the northeast direction to Constantine, also the authorities considered the protection of the city peripheral parts, which are flooded by the North and the Southeast flows of the valley.
But still that Batna City needs a real application of flood prevention plan to strengthen the major risk management politics and improve the interventions efficiency (schemes to deal with major civil emergencies) through the participation of all the parts of the state. In the end, this study considered as the first and the important part to identify also the level of Batna City resilience against floods, which is going to be our next project.
REFERENCES Abdullahi S., bin Mahmud A., Pradhan B. (2013), Spatial modelling of site suitability assessment for hospitals using
geographical information system-based multicriteria approach at Qazvin city, Iran, Geocarto International. Balzarini R., Davoine P., Ney M. (2012), Evolution et développement des méthodes d’Analyse spatiale multicritère pour
des modèles d’aptitude : l’exemple des applications en Géosciences, [Evolution and development of multi-criteria spatial analysis methods for aptitude models: the example of applications in Geosciences], ESRI France, Département Education et Recherche.
Berrocal L, (2012), Suitability Analysis with ArcGIS (part 1, 2, 3 lessons on social media), University of Panama, http://tecnofuenteabierta.blogspot.com
Clio Andris, [unknown year], Interactive Site Suitability Modeling a better method of understanding the effects of input data. University of South Carolina. http://www.esri.com/news/arcuser/0408/suitability.html
D’Ercole R. (1994), Les vulnérabilités des sociétés et des espaces urbanisés : concepts, typologie, modes d’analyse, [The vulnerabilities of societies and urbanized areas: concepts, typology, analysis modes ]. Revue de géographie alpine, t. LXXXII, n° 4, pp 87-96.
El Hadraoui Y. (2013), Étude diachronique de l'occupation du sol et de modélisation des processus érosifs du bassin versant du Bouregreg (Maroc) à partir des données de l'Observation de la Terre, [diachronic study of land use and modeling erosion processes of Bouregreg watershed (Morocco) from the Earth Observation data] Engineering Sciences. HAL Id: dumas-00920465, pp 89.
Gilbert C. (2003), Risques collectifs et situations de crise, [collectif risks and crisis situations] Apports de la recherche en sciences humaines et sociales, Paris, L’Harmattan, Col. Risques collectifs et situations de crise, pp 340.
Herman G. V. (2009), Omul şi modificările antropice din Câmpia Someşului [The man and anthropogenic changes in Somes Plain], Editura Universităţii din Oradea, 227 pag., ISBN 978-973-759-981-0, Oradea.
Herman G. V. (2010), Using Geographical Information (GIS) System for Management of Flood Risks in the Somes Plain, in Cross-Border Partnership with Special Regard to the Hungarian - Romanian - Ukrainian Tripartite Border, Book Editors Ioan Horga, Istvan Suli Zakar, Publishing House University of Debrecen Press, p. 175 -179.
Kalla M., Dridi H., Bendib H., Boutennoune N., Habibi Y., Haoues C., Bouhata R. (2009), L’impact réseau d’assainissement sur la vulnérabilité au risque d’inondation dans la ville de Batna- Approche par les SIG-. [The sewerage impact on floods vulnerability in Batna city - GIS Approach - ], Université de Batna 2.GEOTUNIS.
Minelli F., Pirot F. (2007), Méthodologie pour la localisation automatique des zones humides et des creux potentiels à partir d'une modélisation hydrologique sous ArcInfo Workstation 9.1 : Cas du Parc Naturel Régional des Caps et Marais d'Opale. [Methodology for automatic wetlands location and potential hollow from a hydrological modeling in ArcInfo Workstation 9.1: Case of Regional Natural Park of Caps and Marais d'Opale], Conférence francophone Esri. http://www.esrifrance.fr/sig2007/index.htm
*** (1998), FAO, La situation mondiale de l’alimentation et de l’agriculture. FAO Agriculture Series No 31, pp 391. *** (2008), Officie National des Statistiques (O.N.S.), Recensement général de la population et de l’habitat (RGPH),
[General Census of Population and Housing], tableau récapitulatif communal, Commune de Batna.pp70 *** (2010), UN-HABITAT, Cities and Climate Change: taking climate change to the local level, Office of the Executive