Page 1
1
Estimation of Viscoelastic Properties of Vessel Walls
Using a Computational Model and Doppler Ultrasound
Simone Balocco1,2,3,4,5
, Olivier Basset4 , Guy Courbebaisse
4, Enrico Boni
5, Alejandro F. Frangi
2,3,6, Piero Tortoli
5, Christian
Cachard4
1 Computer Vision Center, 08193 Bellaterra, Spain
2 Centre for Computational Imaging & Simulation Technologies in Biomedicine (CISTIB), Information & Communication
Technologies, Department (DTIC), Universitat Pompeu Fabra, Barcelona, Spain
3 Networking Research Center on Bioengineering, Biomaterials and Nanomedicine (CIBER-BBN), Barcelona Spain.
4 CREATIS, Université de Lyon, INSA de Lyon, Université Lyon 1, CNRS UMR 5220, INSERM U630, Lyon, France.
5 Microelectronic Systems Design Laboratory, Università di Firenze, Italy.
6 Institució Catalana de Recerca i Estudis Avançats (ICREA), Barcelona Spain.
E-mail: [email protected]
Abstract—Human arteries affected by atherosclerosis are characterized by altered wall viscoelastic properties. The possibility of
noninvasively assessing arterial viscoelasticity in vivo would significantly contribute to the early diagnosis and prevention of this disease.
This paper presents a noniterative technique to estimate the viscoelastic parameters of a vascular wall Zener model. The approach requires
the simultaneous measurement of flow variations and wall displacements, which can be provided by suitable ultrasound Doppler
instruments. Viscoelastic parameters are estimated by fitting the theoretical constitutive equations to the experimental measurements using
an ARMA parameter approach. The accuracy and sensitivity of the proposed method are tested using reference data generated by
numerical simulations of arterial pulsation in which the physiological conditions and the viscoelastic parameters of the model can be
suitably varied. The estimated values quantitatively agree with the reference values, showing that the only parameter affected by changing
the physiological conditions is viscosity, whose relative error was about 27% even when a poor signal-to-noise ratio is simulated. Finally,
the feasibility of the method is illustrated through three measurements made at different flow regimes on a cylindrical vessel phantom,
yielding a parameter mean estimation error of 25%.
Index Terms—Viscoelasticity, arterial wall model, noninvasive measurement, ARMA parameter fitting
Page 2
2
I. INTRODUCTION
Atherosclerosis is a disease affecting arterial blood vessels, caused by inflammation of the arterial membrane. At early stages,
it is characterized by a remodeling of the arteries, inducing hardening and thickening of the arterial wall without narrowing of the
lumen. Then it typically evolves with the development of atheromatous plaque, which narrows the vessel provoking the death of
the tissues fed by the artery (Ramnarine et al., 2003; Reneman et al., 2005). The mechanical and biological causes leading to the
progression of atherosclerotic plaques are not completely understood, but it is believed that wall elasticity alterations emerge not
only in the pathological state, but also during early remodeling (Sipahi et al., 2008; Tsamis and Stergiopulos, 2007; Humphrey,
2008). In fact, remodeling is a dynamic process, leading to changes in both the geometrical dimensions and material properties of
an artery, and is dependent on mechanical stress and strain. It is thus particularly affected by cardiovascular pathologies altering
mechanical loads such as hypertension (Tsamis and Stergiopulos, 2007).
Although the relevance of viscoelasticity to early diagnosis and prevention of atherosclerosis has not been established yet,
Simon (Simon and Levenson, 2001) and Armentano (Armentano et al., 1998), have demonstrated that the influence of the elastic
and viscous components of the arterial walls should be independently considered when assessing the development of vascular
remodeling due to hypertension. They also showed that the elastic alteration (stiffening) was related to local pathologies of the
arterial system, whereas abnormal wall viscosity may reflect a more general influence of hypertension on large-artery smooth
muscle.
A detailed structural model of the viscoelastic behavior of arterial walls was introduced by Holzapfel et al. (Holzapfel et al.,
2002). They proposed a generalized Maxwell model composed of several parallel branches of spring and damper elements
arranged in parallel. However, the vessel’s viscoelastic arterial dynamics can also be accurately approximated using simplified
models (Kelvin-Voight, Windkessel, Zener (Bia et al., 2005; Hoeks et al., 1999 ; Marcus et al., 1994 ; Valdez-Jasso et al., 2007;
Burattini and Natalucci, 1998)) composed of a reduced number of elements (see Barnes (Barnes et al., 1989) for a complete
description of all possible layouts). Additionally, the relations between the mechanical components of a simplified viscoelastic
model (springs, dampers) and the relative contributions of biological arterial wall components (wall elastine, muscular fibers)
involved in vessel pulsation were identified (Bia et al., 2005; Fung, 1993; Marcus et al., 1994 ).
Ultrasonography (US) provides inexpensive and noninvasive methods to assess the flow rate using the Doppler technique and
arterial intima–media thickness (IMT) and arterial wall dilation (Meinders and Hoeks, 2004b) by B-mode imaging and Doppler.
Complementary techniques aimed at characterizing the wall’s response to flow changes may be used in the assessment of vascular
health or as a biomarker of vascular diseases (Anderson, 2006).
Page 3
3
In recent years, various US image-based methods have been developed to assess and monitor the interaction between pulse
pressure and diameter expansion. The simultaneous measurement of diameter and pressure waveforms automatically estimates
compliance, distensibility, and pulse wave velocity (PWV) related to the wall viscoelastic parameters (Meinders and Hoeks,
2004a; Zhang et al., 2005; Hoeks et al., 1999 ; Simon and Levenson, 2001). Accurate measurements of the time delay between
two simultaneously recorded pressure or distension waves are required. Promising results have been announced using ultrasound-
stimulated vibro-acoustography (Heikkila et al., 2004).
More recently, noninvasive investigations of the mechanical properties of superficial arteries like the carotid were conducted
using elastography (Schmitt et al., 2007; Ribbers et al., 2007; Maurice et al., 2008). Other authors (Shi et al., 2008;
Danilouchkine et al., 2009) proposed the use of high resolution intravascular ultrasound (IVUS) imaging. Preliminary results in
the plaque characterization were also obtained using Acoustic Radiation Force Imaging (Dahl et al., 2009). Such methods only
assess a strain map or provide an estimation of the linear elasticity (Young’s modulus) without considering the viscosity of the
materials. Additionally, IVUS imaging is invasive and requires the use of expensive catheters to be performed.
Another approach consists in solving an inverse problem by estimating the vessel parameters from an iterative comparison of
the wall displacement measurements with the data provided by a finite element model (Aglyamov et al., 2004). The drawbacks of
these methods lie in the slow convergence (due to the computational complexity of each finite element iteration) and non
uniqueness of the solution. Other authors (Bia et al., 2005; Armentano et al., 1995; Valdez-Jasso et al., 2007) used an approach
to study the vascular wall behavior based on Hardung’s (Hardung, 1952) viscoelastic model. The technique estimates the
parameters with an iterative procedure of hysteresis eliminations in the measurement of pressure-diameter loops. From these
techniques, other vascular indices such as PWV, compliance, distensibility and the mechanical parameters of a two-element
Maxwell model (Kelvin-Voight) were deduced. The main limitation of this approach is that it cannot track instantaneous changes
in the wall properties and requires measurement over several cardiac cycles.
This paper presents a noniterative technique to estimate the viscoelastic parameters of a three-element Maxwell vascular wall
(Zener) model (Barnes et al., 1989) from data collected in real time by a new US Doppler system (Tortoli et al., 2006) which
continuously monitors the vessel flow rate and wall displacement. Using the 3-element Zener model allows to capture
fundamental viscoelastic properties of the arterial wall by including both creep and stress relaxation (Valdez-Jasso et al., 2007),
while a viscoelastic model composed by only two elements would neglect one of the two phenomena. On the other hand, a more
sophisticated model would simply provide a more accurate approximation of them (Barnes et al., 1989). Indeed, a three element
model was considered by several authors as the most suitable to represent the arterial dynamic response (Olufsen and Nadim,
2004; Marcus et al., 1994 ; Craiem et al., 2005). Following the same principle used in the three-element Windkessel model
Page 4
4
(Olufsen and Nadim, 2004; Marcus et al., 1994 ; Craiem et al., 2005), the equivalence between the differential equation relating
stress and strain for a viscoelastic model and its analog electrical system is suggested. The mechanical kinetics of the wall is thus
described in the frequency domain as a linear system in which the transfer function depends on three viscoelastic mechanical
parameters. An identification technique based on an autoregressive moving average (ARMA) curve fitting approach (Box et al.,
1994) was used to simultaneously estimate the optimal set for these parameters.
The next section introduces the vascular model, while Section III describes the numerical approach used. In Section IV, the
accuracy and the robustness of the proposed approach are estimated from simulated reference data. Section V shows an
experiment conducted on a vessel phantom to estimate the Young’s modulus and the viscosity of the tissue. The results are
discussed in Section VI.
II. MODELING APPROACH
A. Geometric model
The geometry considered in the proposed model is shown in Figure 1-a. The inner part of the cylinder (radius r) corresponds to the
lumen of the blood vessel, H is the wall thickness and the outer part represents the surrounding tissues. The wall model is
simplified to a single layer and the variables characterizing the arterial wall are considered the composite mechanical parameters
of the three tunicae of the wall (intima, media and adventitia).
(a)
(b)
Figure 1 Isometric view of vessel geometry (a) and scheme illustrating the mechanical interactions
between blood pressure and tissue (b). The dashed region indicates the dilatation and thinning of
the vessel wall under the application of the pressure P.
Page 5
5
B. Vascular stress modeling
In pulsatile flow conditions, the vessel wall stress, ( )tσ , intrinsically depends on the dynamic variation of the hydrodynamic
flow. In the general case of complex geometries or turbulent flow conditions, the Navier-Stokes equations describe the relation
between the flow velocity profile and the hydrodynamic pressure variations ∆ ( )P t . Under the assumption of cylindrical vessel
and laminar flow, the pressure variations ∆ ( )P t in pulsatile flow conditions can be computed using the simplified Bernoulli-
Poiseuille equation (Badeer, 2001). Bernoulli’s equation is incomplete because it disregards the fluid viscosity; while Poiseuille’s
equation is incomplete because gravitational potential and accelerative-decelerative pressures are neglected. The combination of
both provides a more realistic equation (Badeer, 2001), given by:
η ρ∆ = ⋅ +
2
2
8 ( )( ) ( )
( ) 2
fL v tP t v t
r t (1)
in which fη represents the viscosity of the fluid, ρ its mass density, and ( )v t the instantaneous mean fluid velocity.
The absolute pressure at the inner surface of the tube results in:
= + ∆0( ) ( )P t P P t (2)
where 0P is the diastolic pressure corresponding to the dilatation of the vessel at the rest position, 0r . 0P can be estimated in
vivo using noninvasive techniques (Meinders and Hoeks, 2004b) or through sphygmomanometer measurements (Nagakura et al.,
2001).
The time-dependent vessel radius ( )r t thus depends on the value at the rest position and on the arterial pressure
variations ∆ ( )P t (Figure 1-b). Following the energy conservation principle, the hydrodynamic pressure variation at each point of
the surface provokes, along the cardiac cycle, a mechanical tension oriented in the tangential direction of the vessel surface.
Classic Theory of Elasticity, described by Timoshenko and Goodier (Timoshenko and Goodier, 1970), presents analytical
solutions for the relationship between hydraulic pressure, wall tangential stress ( σ ), vessel radius and wall thickness ( H ), in
which the stress and strain are variable along the thickness. However, an acceptable approximation of the wall stress amplitude
can be obtained using the Laplace Law (Westerhof et al., 2004):
0( )( ) r
tH
P tσ
⋅=
∆ (3)
Page 6
6
The main limitation of Laplace's Law, here, is that it yields the average wall stress and thus it cannot give any information on the
stress distribution across the wall.
Hence, assessment of the mean flow velocity, together with the vessel morphology and fluid properties, enables the estimation of
the pressure variations ( )P t∆ (eqs. 1 and 2) and, consequently, of the wall stress ( )tσ (eq. 3).
C. Vascular strain modeling
The strain ( )tε , corresponding to the stretching of the arterial wall resulting from the action of the applied stress tension, can
be estimated from the perimeter variations. Assuming that the cylindrical vessel is composed of a uniform isotropic material, the
strain variations are obtained by measuring the change in radius according to the Lagrangian formula:
ε−
= 0
0
( )( )
r t rt
r (4)
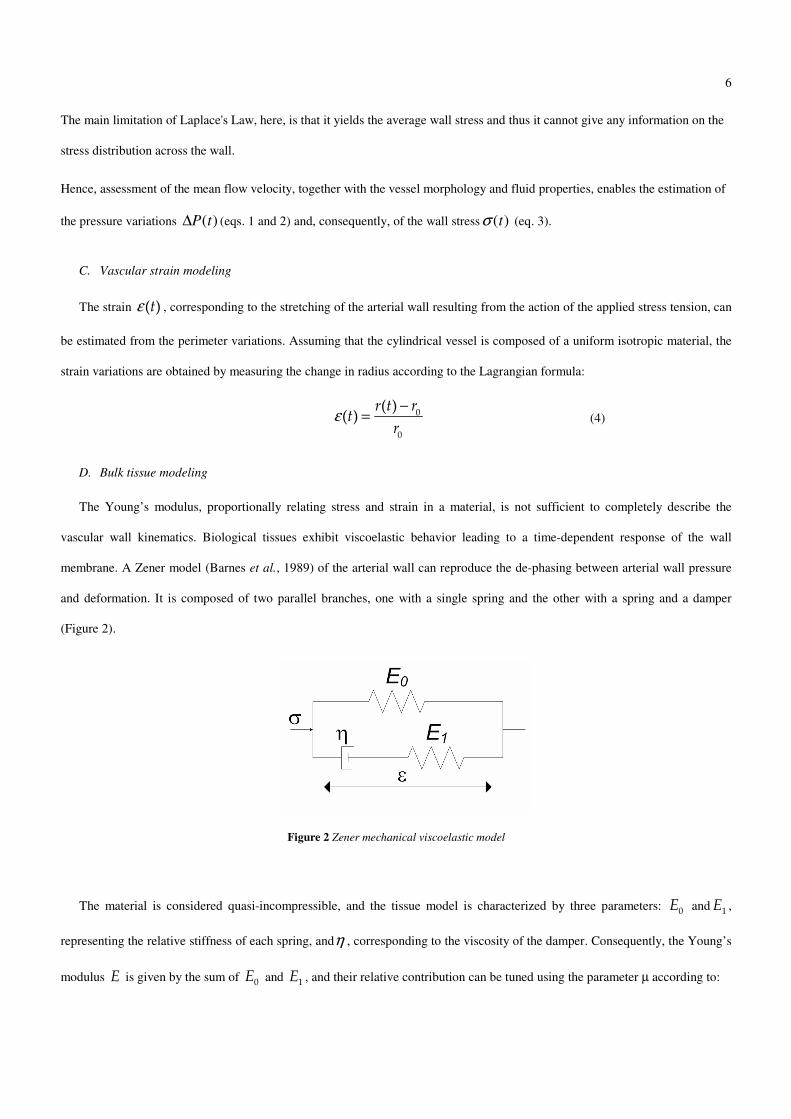
D. Bulk tissue modeling
The Young’s modulus, proportionally relating stress and strain in a material, is not sufficient to completely describe the
vascular wall kinematics. Biological tissues exhibit viscoelastic behavior leading to a time-dependent response of the wall
membrane. A Zener model (Barnes et al., 1989) of the arterial wall can reproduce the de-phasing between arterial wall pressure
and deformation. It is composed of two parallel branches, one with a single spring and the other with a spring and a damper
(Figure 2).
Figure 2 Zener mechanical viscoelastic model
The material is considered quasi-incompressible, and the tissue model is characterized by three parameters: 0E and 1E ,
representing the relative stiffness of each spring, andη , corresponding to the viscosity of the damper. Consequently, the Young’s
modulus E is given by the sum of 0E and 1E , and their relative contribution can be tuned using the parameter µ according to:
Page 7
7
µ
µ
− ⋅
⋅
1
0
E = (1 ) E
E = E (5)
The relation between the applied stress ( )tσ and the resulting deformations ( )tε at the interface between the vessel and the
tissue is (Barnes et al., 1989):
ε σε σ
η η
+ + = +
0 0
1 1
( ) 1 ( ) 11 ( ) ( )E d t E d t
t tE dt E dt
(6)
Assuming that the stress action due to cardiac pulsation is periodic, the harmonic domain expression of equation (6) becomes:
0 0
1 1
1 11 ( ) ( ) ( ) ( )
E Es s s s s s
E Eε ε σ σ
η η
+ ⋅ + = ⋅ +
(7)
Where s is the Laplace complex variable, leading to the following theoretical transfer function:
0 0
0 1 0 11
1
1
1( )
( )1 1( )
theo
E Es
s E E E s E sEs
s E ss
E
σ η ηηψ
ε ηη
+ + + ⋅ ⋅ + ⋅ ⋅ = = =
+ ⋅+ (8)
In this paper the viscoelastic parameters were expressed using the model variables (E0, E1, and η ). However, the corresponding
magnitude and phase values of the Young modulus (i.e., |E*|) could be easily obtained from the equations described in (Meyers
and Chawla, 1999).
III. METHOD
The mechanical parameters, E0 , E1, and η of the Zener model can be estimated by approximating, through a curve-fitting
technique, the above-described theoretical function to the experimental function, which can be obtained using imaging
techniques. According to the set of equations described in Section II, the changes of the stress and strain signals along the cardiac
cycle can in fact be computed from the experimental measurements of arterial radius and pressure variations.
The experimental transfer function, Ψexp
( )s , is numerically calculated through the fast Fourier transform (FFT) of the ratio
between the strain ( ( )tσ ) and the deformation ( ( )tε ) signals, both sampled with period eT . These discrete signals represent the
Page 8
8
output , )( kty , and the input, )( ktx , respectively, of a linear system which can be approximated by a infinite impulse response
(IIR) filter according to the ARMA technique (Box et al., 1994). This is described by:
ξ ξ
ξ ξ ξ ξξ ξ
= =
− −= =
= −∑ ∑0 1
( ) ( ) ( )M Q
k k ky t b x t a y t (9)
where M and Q are the number of filter coefficients b and a, respectively. By assuming an ARMA filter of the first order
(M=Q=1) the equation (9) becomes:
1 0 0 1 1 1 1( ) ( ) ( ) ( )y t b x t b x t a y t= + − (10)
The ARMA model is fitted by least squares regression to find the estimated parameters ^
C which minimize the error term.
−= − ⇒ =^ ^
2 1
2arg min ( )T T
C
C B AC C A A A B (11)
The discrete expression of equation (8) is obtained using the bilinear transform (i.e., replacing
1
1
2 1
1e
zs
T z
−
−
−=
+).
( ) ( )( ) ( )
110 1 0 1 0 1 0 11
1 11 1
2 2 2 2( )( )
( ) 2 2
e
theo
e e
E E E E T E E E E T zy zz
x z E T E T z
η η η η
η η
−−−
− −
+ + + − − +Ψ = =
+ + − + (12)
The first-order infinite impulse response (IIR) filter can be reordered as follows:
( )( )
( )( )
( )( )
0 1
0 1 0 1 0 1 0 1 1
1 1
1 1 1
1
2 2 2 2 2( ) ( ) ( ) ( )
2 2 2
e e e
k k k k
e e e
b b a
E E E E T E E E E T E Ty t x t x t y t
E T E T E T
η η η η η
η η η− −
+ + − − + − += + −
+ + +����������� ����������� �������
(13)
Finally, the mechanical parameters of the Kelvin model ( 0E , 1E and η ) have been deduced from (10) and (13) analytically
solving the system using Wolfram Mathematica 5.21 software and yielding to:
− −=
−0 1
0
1 1
b bE
a (14)
+=
−1 0 1
1 21
2( )
1
a b bE
a (15)
( )η
+= −
−1 0 1
21( 1)
ea b b T
a (16)
1 http://www.wolfram.com/products/mathematica/index.html
Page 9
9
IV. IN SILICO EXPERIMENTS
To evaluate the performance of the proposed approach, the algorithm was tested using signals generated from in silico
experiments in which the stress and strain waveforms were generated through a numerical simulation of arterial pulsation. The
sensitivity of the method was evaluated by varying relevant parameters of the biomechanical model such as the value of the
viscoelastic parameters, the stress waveform and its amplitude. Then the robustness was evaluated when additive noise was
applied to the reference stress and strain waveforms.
A. Gold standard phantom
The Zener model was implemented by defining the vessel membrane using a viscoelastic material model provided by the finite
element simulator (COMSOL Multiphysics® v3.5, COMSOL Inc., Burlington, MA, USA)2.
The simulated arterial geometry includes a tube with a 4-mm inner radius, r, and a 1-mm wall thickness, H . Since the geometry
of the model is axisymmetric, the simulation time can be reduced by computing the results on a limited sector of the vessel, for
instance in a quarter of the tube (Figure 1-b). The simulated mesh consisted of 3616 elements and 1919 points.
2 http://www.comsol.com/ http://www.comsol.com/
The wall stress, σ, was deduced from the hydraulic blood pressure using the relations reported in section II.B, and the
deformation, ε, was measured as radial variations of the wall. The pulsating function of a typical carotid artery (Holdsworth et al.,
1999) was generated according the equation:
π π ∆ = +
∑max
2 2( ) cos sink k
k
k t k tP t P A B
T T (17)
Page 10
10
where Ak and Bk are the coefficients of k Fourier harmonics, publicly available 3, and T is the period of the cardiac cycle (1 s).
The amplitude ( maxP ) is considered equal to 6000 Pa, corresponding to the difference between systolic and diastolic pressure of
120 mmHg and 80 mmHg, respectively. A Young’s modulus value of 0.4 MPa and a Poisson ratio of 0.49 were chosen to
reproduce a healthy carotid artery (Alastruey et al., 2007). The mechanical parameters µ and η were initially fixed at 0.5 and
2 kPa s⋅ , respectively, corresponding to moderately viscoelastic material in which the weight assigned to the viscoelastic
branches is equally balanced. The sampling frequency of the stress and strain signals generated by the finite element simulation
was 1 kHz. The phase difference between the stress and strain is considered constant throughout the cardiac cycle.
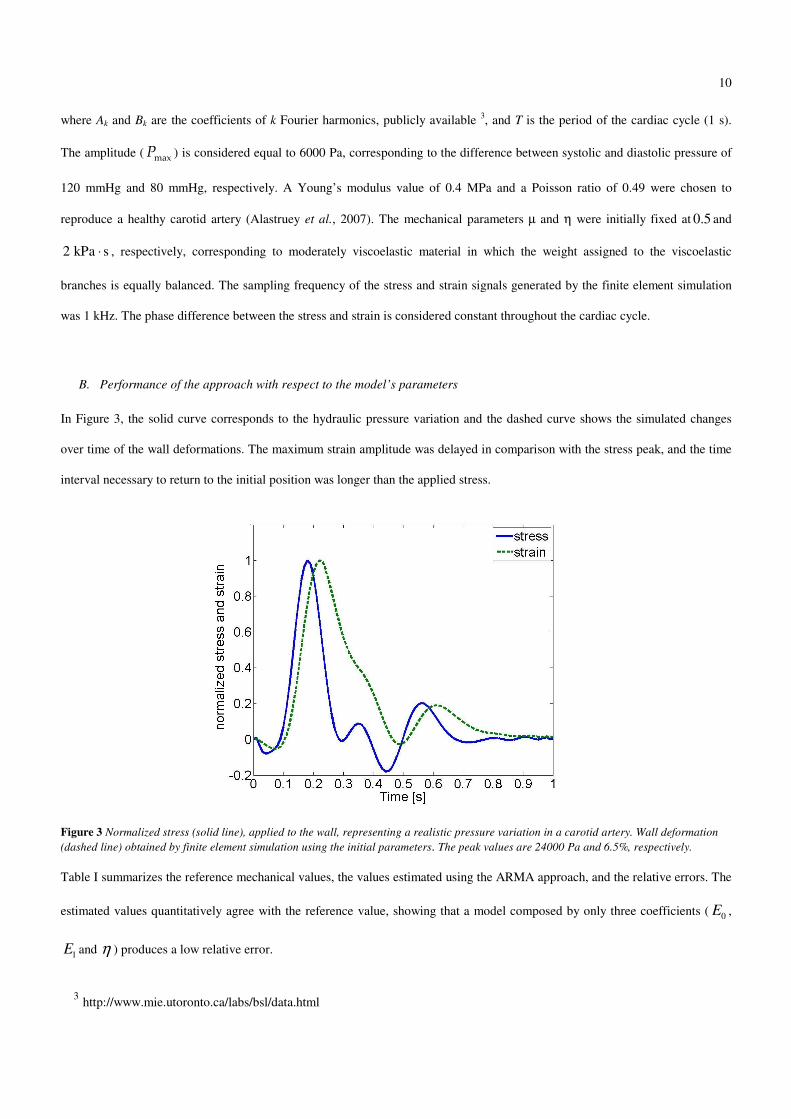
B. Performance of the approach with respect to the model’s parameters
In Figure 3, the solid curve corresponds to the hydraulic pressure variation and the dashed curve shows the simulated changes
over time of the wall deformations. The maximum strain amplitude was delayed in comparison with the stress peak, and the time
interval necessary to return to the initial position was longer than the applied stress.
Figure 3 Normalized stress (solid line), applied to the wall, representing a realistic pressure variation in a carotid artery. Wall deformation
(dashed line) obtained by finite element simulation using the initial parameters. The peak values are 24000 Pa and 6.5%, respectively.
Table I summarizes the reference mechanical values, the values estimated using the ARMA approach, and the relative errors. The
estimated values quantitatively agree with the reference value, showing that a model composed by only three coefficients ( 0E ,
1E and η ) produces a low relative error.
3 http://www.mie.utoronto.ca/labs/bsl/data.html
Page 11
11
Table I
Reference and estimated values of viscoelastic parameters corresponding to the simulation and the carotid pressure waveform
Reference
value
Estimated
value
Relative
error
0[ ]E Pa 200 000 203 940 1.97%
1[ ]E Pa 200 000 203 608 1.80%
[ ]Pa sη ⋅ 2 000 2 036 1.82%
The mechanical parameters of the Zener model were then varied according to different viscoelastic conditions. The performance
of the algorithm was quantified for different configurations by sweeping the value of the viscosity (η) and the weight of the
elastic modulus assigned to the viscosity branch (µ), controlling the creep and stress relaxation response of the wall, respectively.
We defined the percentage of relative error as ( )100rel ref est refE E Eδ = − .
Figure 4 illustrates the percentage of error of the three parameters of the Zener model obtained when η varied from 400 to
4000 Pa s⋅ , and µ from 0.05 to 0.95.
(a)
(b)
Figure 4 Discrepancies between the estimated and the reference parameters of the Zener model obtained when the viscosity
varied (a) (while =0.5µ ) and when the weight of the elastic modulus assigned to the viscosity branch (b) changes (while
=2 kPa sη ⋅ ) in the finite element simulation.
Page 12
12
The percentage of error remains lower than 10% in both plots of Figure 4. However, it can be noted that while the accuracy in the
estimation of E0 and E1 remains nearly constant, the error corresponding to η increases in configurations exhibiting a quasi-elastic
behavior of the wall. This can be explained by the low time delay between stress and strain when the viscosity was low leading to
an increasing error in the measurement of this delay. This effect is not critical for our application since here a satisfactory
estimation of the Young’s modulus is the point of interest, while the viscosity value has a low contribution to the mechanical
analysis.
The vessel pulsation generated by finite element simulation was finally modified using the viscoelastic parameters of and varying
the configurations of the simulated physiological conditions, i.e., the stress amplitude, Young’s modulus, the vessel radius and the
wall thickness. In particular, the error of the three viscoelastic parameters was recorded for values of E ranging from 0.04 to 4
MPa, σ from 2400 Pa to 48,000 Pa, r from 2 to 7 mm and H from 0.5 to 4 mm. In all cases, the maximum error increase was
below 0.25%, showing that the accuracy of the method is rather independent on the geometrical and mechanical characteristics of
the vessel.
Since the curve was fit in the frequency domain, the performance of the algorithm might depend on the waveform outline. To
investigate this, the shape corresponding to the pressure variation of the carotid artery was replaced by three pressure waveforms
(Figure 5), i.e., a generic sinusoidal oscillation and the typical waveforms of the iliac and femoral arteries 4.
Figure 5 Normalized stress (solid line) applied to the wall corresponding to a generic sinusoidal waveform (a) and to
realistic pressure variation in iliac (b) and femoral (c) arteries. The dashed lines represent the wall deformations obtained by
finite element simulation.
Table II compares the relative errors obtained in the correspondence of the three stress waveforms. As expected, the use of the
sinusoidal waveform, exhibiting a simpler behavior in the frequency domain, induced a lower estimation error with respect to the
use of the carotid artery waveform. On the other hand, the estimation error remained almost unchanged when waveforms of
4 http://www.mie.utoronto.ca/labs/bsl/data.html
Page 13
13
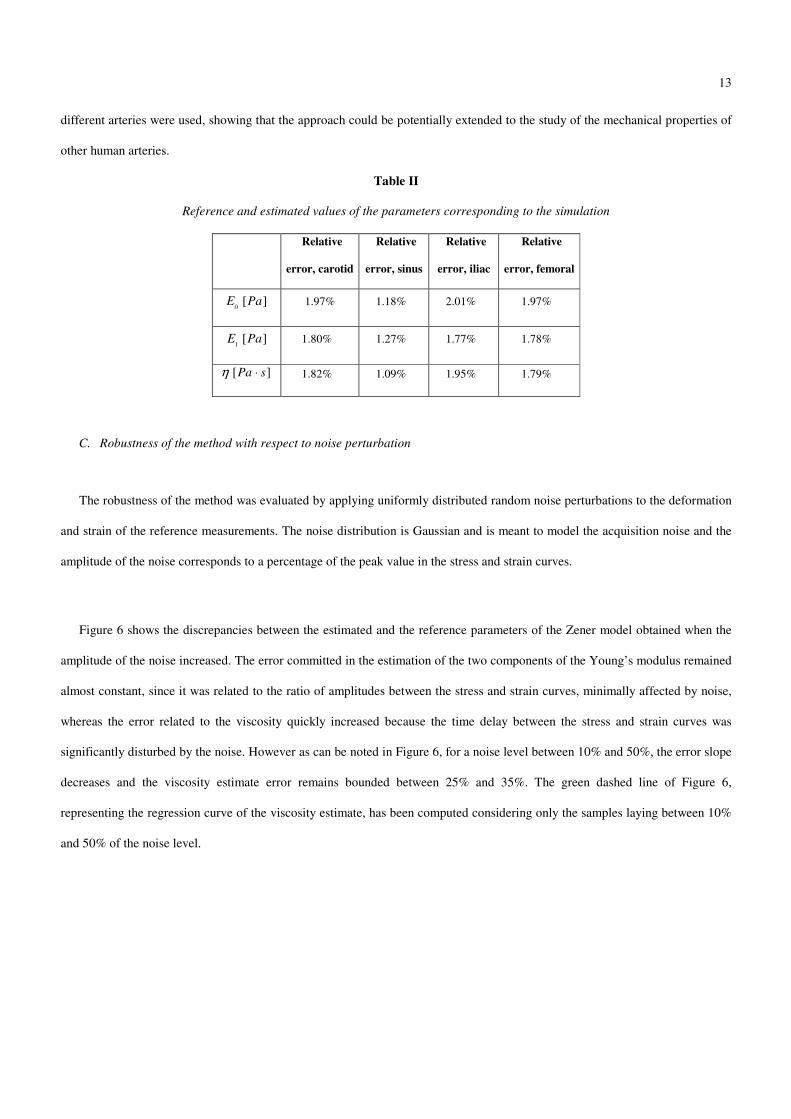
different arteries were used, showing that the approach could be potentially extended to the study of the mechanical properties of
other human arteries.
Table II
Reference and estimated values of the parameters corresponding to the simulation
Relative
error, carotid
Relative
error, sinus
Relative
error, iliac
Relative
error, femoral
0[ ]E Pa 1.97% 1.18% 2.01% 1.97%
1[ ]E Pa 1.80% 1.27% 1.77% 1.78%
[ ]Pa sη ⋅ 1.82% 1.09% 1.95% 1.79%
C. Robustness of the method with respect to noise perturbation
The robustness of the method was evaluated by applying uniformly distributed random noise perturbations to the deformation
and strain of the reference measurements. The noise distribution is Gaussian and is meant to model the acquisition noise and the
amplitude of the noise corresponds to a percentage of the peak value in the stress and strain curves.
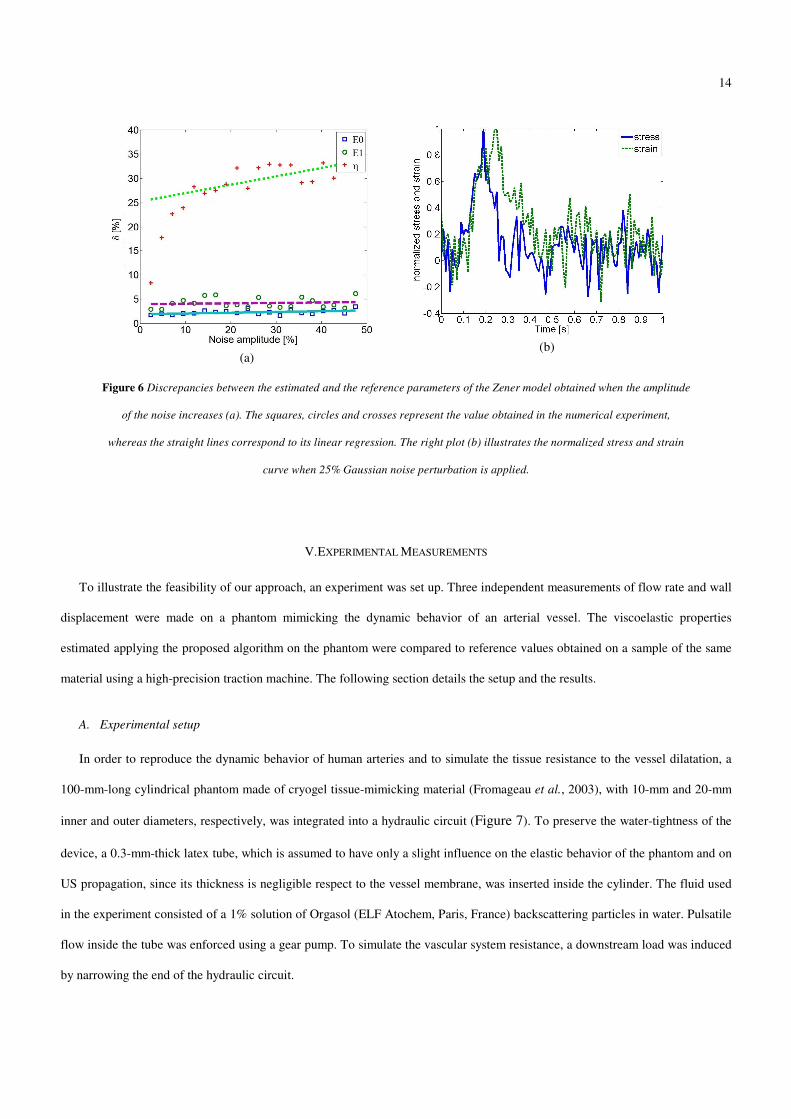
Figure 6 shows the discrepancies between the estimated and the reference parameters of the Zener model obtained when the
amplitude of the noise increased. The error committed in the estimation of the two components of the Young’s modulus remained
almost constant, since it was related to the ratio of amplitudes between the stress and strain curves, minimally affected by noise,
whereas the error related to the viscosity quickly increased because the time delay between the stress and strain curves was
significantly disturbed by the noise. However as can be noted in Figure 6, for a noise level between 10% and 50%, the error slope
decreases and the viscosity estimate error remains bounded between 25% and 35%. The green dashed line of Figure 6,
representing the regression curve of the viscosity estimate, has been computed considering only the samples laying between 10%
and 50% of the noise level.
Page 14
14
(a)
(b)
Figure 6 Discrepancies between the estimated and the reference parameters of the Zener model obtained when the amplitude
of the noise increases (a). The squares, circles and crosses represent the value obtained in the numerical experiment,
whereas the straight lines correspond to its linear regression. The right plot (b) illustrates the normalized stress and strain
curve when 25% Gaussian noise perturbation is applied.
V. EXPERIMENTAL MEASUREMENTS
To illustrate the feasibility of our approach, an experiment was set up. Three independent measurements of flow rate and wall
displacement were made on a phantom mimicking the dynamic behavior of an arterial vessel. The viscoelastic properties
estimated applying the proposed algorithm on the phantom were compared to reference values obtained on a sample of the same
material using a high-precision traction machine. The following section details the setup and the results.
A. Experimental setup
In order to reproduce the dynamic behavior of human arteries and to simulate the tissue resistance to the vessel dilatation, a
100-mm-long cylindrical phantom made of cryogel tissue-mimicking material (Fromageau et al., 2003), with 10-mm and 20-mm
inner and outer diameters, respectively, was integrated into a hydraulic circuit (Figure 7). To preserve the water-tightness of the
device, a 0.3-mm-thick latex tube, which is assumed to have only a slight influence on the elastic behavior of the phantom and on
US propagation, since its thickness is negligible respect to the vessel membrane, was inserted inside the cylinder. The fluid used
in the experiment consisted of a 1% solution of Orgasol (ELF Atochem, Paris, France) backscattering particles in water. Pulsatile
flow inside the tube was enforced using a gear pump. To simulate the vascular system resistance, a downstream load was induced
by narrowing the end of the hydraulic circuit.
Page 15
15
Figure 7 Schematic of the hydraulic circuit used in the experimental setup
B. Ultrasound equipment
The temporal variations of the fluid velocity ( )v t and the amplitude of wall displacement ( )r t were recorded using a
prototype dual-beam multigate Doppler system (Tortoli et al., 2006), while the initial diameter restr of the phantom and the
thickness H were estimated through standard B-mode imaging. The Doppler system(Tortoli et al., 2006) , developed at the
University of Florence, consists of a PC add-on custom board based on a high-speed digital signal processor, capable of
simultaneously applying pulsed wave excitation to two independent probes and processing in real-time the related echoes. One
probe was perpendicularly oriented to the vessel to optimally detect the radial wall movements, while the second probe was
oriented at a suitable Doppler angle to simultaneously measure the fluid velocities. The displacements of the walls were estimated
using an automatic procedure, based on a modified autocorrelation algorithm that first evaluates their velocities, so that they can
then be integrated in time. The measurement was shown highly precise, as standard deviations lower than 4 µm where obtained in
vitro (Morganti et al., 2005).
The echo-signals corresponding to the second (Doppler) beam, oriented at 72° to the flow, were recorded over 128
subsequent gates corresponding to adjacent depths separated about 100 µm apart. The latter value is well better than the spatial
resolution required to suitably track the spatial velocity variations typically present in human arteries (Nichols and O’Rourke,
1998). The power spectral density of the Doppler signal corresponding to each gate was computed, and the local mean velocity
was estimated from the spectrum’s first moment (Bambi et al., 2004). For each gate, over each pulsating cycle, approximtely 70
velocity values were obtained. In particular, by processing the echo-signals from the sample volume on the vessel axis, the
reference velocity profile, ( )v t , was obtained. The instantaneous velocity of the blood flow ( )v t was computed averaging the
amplitude of each velocity profile (i.e., over the 128 gates of the beam line).
Three independent experimental conditions (Dyn1, Dyn2, Dyn3) were generated inducing a pulsed flow characterized by
increasing peak velocities in the hydraulic circuit. The flow was characterized by the superposition of a steady velocity
Page 16
16
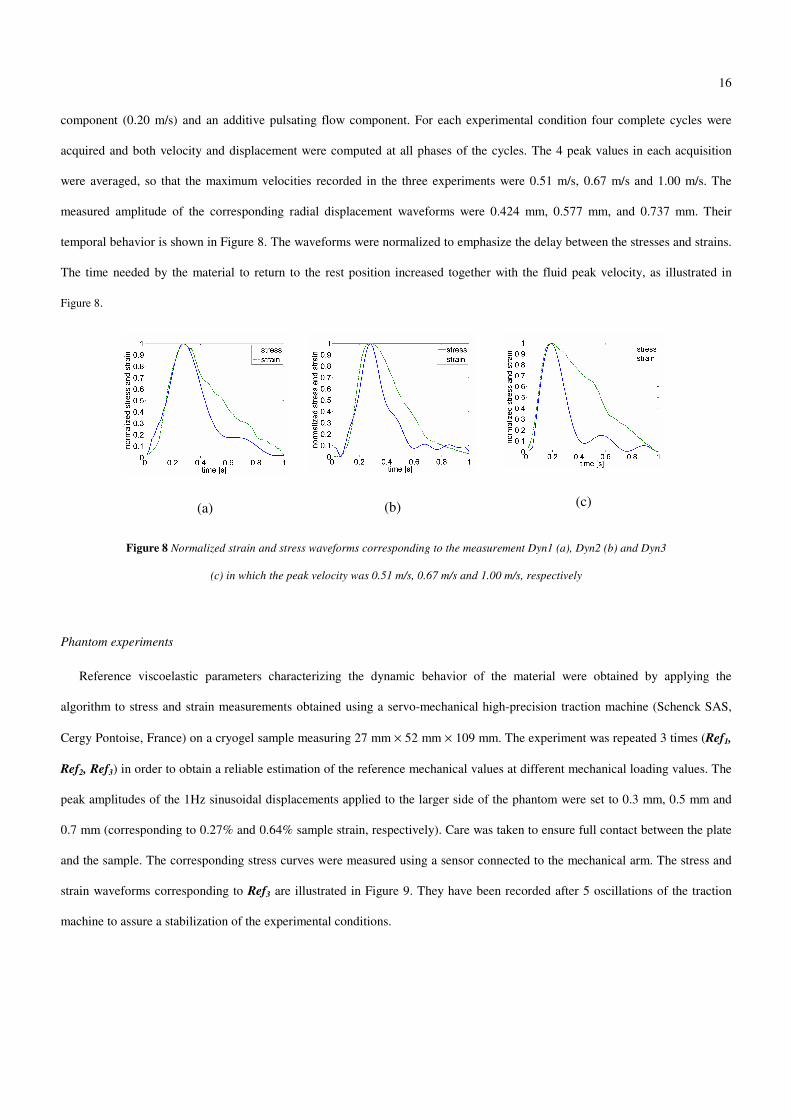
component (0.20 m/s) and an additive pulsating flow component. For each experimental condition four complete cycles were
acquired and both velocity and displacement were computed at all phases of the cycles. The 4 peak values in each acquisition
were averaged, so that the maximum velocities recorded in the three experiments were 0.51 m/s, 0.67 m/s and 1.00 m/s. The
measured amplitude of the corresponding radial displacement waveforms were 0.424 mm, 0.577 mm, and 0.737 mm. Their
temporal behavior is shown in Figure 8. The waveforms were normalized to emphasize the delay between the stresses and strains.
The time needed by the material to return to the rest position increased together with the fluid peak velocity, as illustrated in
Figure 8.
(a)
(b)
(c)
Figure 8 Normalized strain and stress waveforms corresponding to the measurement Dyn1 (a), Dyn2 (b) and Dyn3
(c) in which the peak velocity was 0.51 m/s, 0.67 m/s and 1.00 m/s, respectively
Phantom experiments
Reference viscoelastic parameters characterizing the dynamic behavior of the material were obtained by applying the
algorithm to stress and strain measurements obtained using a servo-mechanical high-precision traction machine (Schenck SAS,
Cergy Pontoise, France) on a cryogel sample measuring 27 mm × 52 mm × 109 mm. The experiment was repeated 3 times (Ref1,
Ref2, Ref3) in order to obtain a reliable estimation of the reference mechanical values at different mechanical loading values. The
peak amplitudes of the 1Hz sinusoidal displacements applied to the larger side of the phantom were set to 0.3 mm, 0.5 mm and
0.7 mm (corresponding to 0.27% and 0.64% sample strain, respectively). Care was taken to ensure full contact between the plate
and the sample. The corresponding stress curves were measured using a sensor connected to the mechanical arm. The stress and
strain waveforms corresponding to Ref3 are illustrated in Figure 9. They have been recorded after 5 oscillations of the traction
machine to assure a stabilization of the experimental conditions.
Page 17
17
Figure 9 Normalized strain and stress waveforms corresponding to the measurement Ref3
Table III summarizes the parameters obtained from the three measurements in terms of mean and standard deviation values. The
mean value of the benchmark assessments was used as the reference against the estimation of 0E , 1E and η performed using our
approach in Section III. The value of the standard deviation shows the complexity of an accurate assessment of the model’s
parameters using a high-precision traction machine.
Table III
Cryogel mechanical parameters estimated from the measurement performed on the sample
0
[ ]E Pa 1
[ ]E Pa [ ]Pa sη ⋅
Ref1 6950 7810 715
Ref2 6296 8250 673
Ref3 7207 7599 817
Mean 6817 7886 734
SD 469 332 74
Table IV reports the mechanical parameters of the tissue composing the vessel wall, estimated using the signal processing
procedure described in Section III. For each acquisition (Dyn1, Dyn2, Dyn3), the estimated values and their relative and absolute
error versus the reference value are reported. Furthermore, the mean value of the three estimations is given and compared to the
reference value.
Page 18
18
Table IV
Vessel wall mechanical parameters estimated from the experimental measurements
Model parameters 0
[ ]E Pa 1
[ ]E Pa [ ]Pa sη ⋅
Reference value 6817 7886 734
Measurement 8350 6529 884 D
yn1
Relative error 22% 17% 20%
Measurement 5405 7089 701
Dyn
2
Relative error 20% 10% 4%
Measurement 8256 6861 916
Dyn
3
Relative error 21% 12% 25%
1,2,3Mean(Dyn ) 7337 6826 883
1, 2 ,3Rel. Error( )Dyn 7% 13% 20%
Although each of the measurements (Dyn1, Dyn2, Dyn3) was taken under different hydraulic load conditions (flow amplitude),
the estimated value of the viscoelastic parameter is similar in all the presented cases. The mechanical parameters of the wall
tissue were recovered with an error lower than 25%. The computation time is about 500 ms on an Intel Pentium Core 2 Duo 1.8
MHz processor.
VI. DISCUSSION AND CONCLUSION
This paper has presented an US-based method to noninvasively measure the viscoelastic properties of vessel walls. The
technique consists of estimating the parameters of the Zener viscoelastic model representing the arterial wall and measuring the
blood flow variations, vessel wall displacements and geometrical dimensions of the vessel. These measurements were taken using
a novel dual-beam multigate Doppler system that is particularly well suited because it provides the simultaneous assessment of
both the blood velocity profile and wall displacements in vessels. In order to apply the proposed method in clinical practice only
the patient-specific end-diastolic pressure is required. Nichols and Meinders illustrated that such value do not change
significantly throughout the arterial tree (Nichols and O’Rourke, 1998; Meinders and Hoeks, 2004b), and its measurement
accuracy should be within 2 mm of Hg (Williams et al., 2004) (according to the recommendations of the British Hypertension
Society). The flow variations are deduced combining the measurement of P0 and the flow variations measured at the imaging site
using the fluido-dynamic relation (1). The dual-beam multigate system has already been shown capable of working in vivo
Page 19
19
allowing the acquisition of complex velocity profiles (Ricci et al., 2009) and wall displacements (Tortoli et al., 2006). The non-
commercial availability of this system, and the lack of imaging capability, have undoubtedly limited its use. However, limitations
are partially overcome by the most recent version of the system (Tortoli et al., 2009), which could be easily reproduced for use by
other laboratories and includes the imaging option.
The parameter is estimated by deducing the constitutive equations of the viscoelastic model, which are successively solved
using an ARMA parameter fitting approach. In this way, the solution is obtained through a noniterative process, considerably
speeding up the algorithm performance. With respect to other approaches (Bia et al., 2005; Aglyamov et al., 2004; Balocco et al.,
2007; Valdez-Jasso et al., 2007), the viscoelastic parameters are estimated from a single cardiac cycle, making this approach
particularly well suited for hardware implementations. The proposed approach doesn't require a model initialization close to the
expected values, as needed in the iterative approach presented in a previous paper (Balocco et al., 2007). The ARMA fitting
technique automatically provides the model parameters and guarantees accurate and fast convergence of the solution.
The description of the mechanical model using the transfer function in the harmonic domain is convenient because it permits
further analysis of the vascular wall and the changes in the mechanical properties can be monitored using the pole-zeros
representations.
The accuracy of the proposed approach was tested using reference data generated by a numerical simulation of arterial
pulsation. The sensitivity of the parameter estimation was assessed by varying the physiological conditions of the simulation
(pressure amplitude, Young’s modulus, vessel radius and wall thickness) and the viscoelastic parameters of the model (viscosity
and the weight assigned to the viscous branch of the model).
The estimated values quantitatively agreed with the reference value, showing that the accuracy of the method is not
particularly affected by changing physiological conditions. However, the error in the estimation of the viscosity coefficient
increased when the model was used to analyze material exhibiting quasi-elastic behavior.
The algorithm robustness was assessed by estimating the influence of noise perturbations of gold-standard waveforms on
parameter estimates. The most widely affected result is viscosity, since the noise significantly disturbed the time delay between
stress and strain curves. However, even in presence of strong perturbations of the waveforms (25% noise amplitude), the relative
error obtained was about 27%.
The feasibility of the method was illustrated through an experiment consisting of three independent measurements taken at
different flow regimes on a cylindrical vessel phantom. Comparing the performance of our approach with other iterative
estimation techniques presented in the literature is difficult because each method uses a different viscoelastic model. None of the
Page 20
20
iterative estimation approaches (Valdez-Jasso et al., 2007; Bia et al., 2005; Armentano et al., 1995) reported the true accuracy of
the technique, since the gold standard viscoelastic parameters were not available. From the estimation of relative values, those
authors showed, through "in vivo" experiments conducted on animal arteries, that the difference in the parameter estimation were
statistically significant and able to differentiate pathological cases from healthy arteries. The reported variance of the
measurement ranges from 76% (Bia et al., 2005) to 33% (Valdez-Jasso et al., 2007) depending on the analyzed artery and on the
model parameter, which is on the same order of the error reported in our approach. Even though encouraging results were
obtained (the "in vitro" estimates the error remain lower than 25%), further improvement of the method might be necessary in
order to extend it to clinical applications. In particular Table I reports the reference and estimated values of viscoelastic
parameters corresponding to the in silico experiment. In such example the transfer function of the filter corresponds exactly to the
Zener model implemented using the FE software. The estimations are affected only by the Laplace’s Law approximation. As
expected the errors are low, demonstrating that the approximation is reasonable. On the other hand, as can be observed on the
experimental results (Table IV) the estimation errors are larger because, in addition to the noise due to acquisition and
measurements, the Zener model (composed only by three mechanical elements) is an approximation of the viscoelastic kinetic of
the wall.
In comparison with our previous approach (Balocco et al., 2007), the introduction of the viscoelastic tissue modeling provides
a more comprehensive description of the dynamic arterial behavior, considering the temporal changes of the pulsation and the
delay between stress and strains. Indeed, as can be observed in the in silico and phantom experiments, in addition to an accurate
estimation of the Young’s modulus, the algorithm provides information on the viscosity of the vessel wall (Simon and Levenson,
2001; Armentano et al., 1998).
The current technique aims at the estimation of the mechanical alteration of the arterial wall, which could be indicative of the
general state of the vascular system and, as such, used for early diagnosis of atherosclerosis evolution. Indeed the method focuses
on the description of blood flow interactions with a realistic arterial membrane representing simple arterial vessels. Hence, the
technique is not directly suited for measurements taken on complex geometries or at the proximity of an atherosclerotic plaque.
However, the approach can be potentially applied to any straight portion of the vasculature such as the common carotid, the iliac
and femoral arteries, providing a noninvasive tool for the periodic screening of the patient’s cardiovascular health, by monitoring
the vessel’s elasticity and viscosity (Simon and Levenson, 2001; Armentano et al., 1998).
More complex geometries, including, e.g., plaque stenosis and aneurysm could be included in the geometrical model by
considering the artery as a set of smoothly connected small piecewise cylinders with progressively changing diameter (Balocco et
al., 2008). In such model, the US measurement should be repeated in each section of the vessel.
Page 21
21
Additionally realistic anatomical shapes of carotid arteries, possibly including multiple arterial wall layers or a plaque, could
be considered if the displacement vectors corresponding to the wall pulsation of both the inner and outer boundaries of each
structure are known at each point of the whole perimeter.
The viscoelastic parameters of the isotropic tissue estimated by the approach used herein are considered to be representative
of the composite stiffness of the three arterial tunicae. Hence, the information obtained could be an indicator of the general
condition of arterial disease and not a local characterization of the plaque or stiffness of each tissue layer. In this paper, we use of
a simple Zener model which consists of only three coefficients (0E ,
1E and η ) but the non invasive parameter estimation
framework allows a straightforward incorporation of more accurate mechanical model composed by a higher number of elements
by providing the corresponding filter.
Additionally, the arterial wall model presented in this paper assumes a constant thickness and homogeneous viscoelastic
parameters along the blood vessel. The method could be extended towards local elastography provided accurate displacement
field can be measured at different locations of the vessel. For instance, diameter and distension inhomogeneities can be assessed
from 2-D distension waveforms obtained by repeating the M-mode measurement at different longitudinal section of the vessel
(Meinders et al., 2003).
VII. ACKNOWLEDGEMENT
This work has been partially funded by the Industrial and Technological Development Centre (CDTI) within the CENIT
Programme (CDTEAM Project), the EC @neurIST (IST-FP6-2004-027703) projects, by BQR INSA-Lyon and by the Italian
Ministry of University & Research (COFIN-PRIN 2005).
The work of S. Balocco is supported by the Catalan Agency for Administration of University and Research (AGAUR) under a
Beatriu de Pinos Fellowship.
REFERENCES
Aglyamov S, Skovoroda A R, Rubin J, O’Donnell M and S. Emelianov 2004 Model-Based Reconstructive Elasticity Imaging of
Deep Venous Thrombosis IEEE Trans Ultrason Ferroel Freq Contr 51 521-31
Alastruey J, Parker K, Peiró J, Byrd S and Sherwin S 2007 Modelling the circle of Willis to assess the effects of anatomical
variations and occlusions on cerebral flows J Biomech 40 1794-805
Anderson T 2006 Arterial stiffness or endothelial dysfunction as a surrogate marker of vascular risk Can J Cardiol 22 (Suppl B)
72B-80B
Armentano R, Megnien J L, Simon A, Bellenfant F, Barra J and Levenson J 1995 Effects of hypertension on viscoelasticity of
carotid and femoral arteries in humans Hypertension 26 48-54
Page 22
22
Armentano R L, Graf S, Barra J G, Velikovsky G, Baglivo H, Sánchez R, Simon A, Pichel R H and Levenson J 1998 Carotid
wall viscosity increase is related to intima-media thickening in hypertensive patients Hypertension 31 534
Badeer H 2001 Hemodynamics for medical students Adv Physiol Educ 25 44-52
Balocco S, Basset O, Azencot J, Tortoli P and Cachard C 2008 3D dynamic model of healthy and pathologic arteries for
ultrasound technique evaluation Med. Phys. 35 5440-50
Balocco S, Basset O, Courbebaisse G, Boni E, Tortoli P and Cachard C 2007 Noninvasive Young's Modulus Evaluation of
Tissues Surrounding Pulsatile Vessels Using Ultrasound Doppler Measurement IEEE Trans Ultrason Ferroel Freq
Contr 54 1295-71
Bambi G, Morganti T, Ricci S, Boni E, Guidi F, Palombo C and Tortoli P 2004 A novel ultrasound instrument for investigation
of arterial mechanics Ultrasonics 42 731-7
Barnes H, J.Hutton and K.Walkers 1989 Introduction to rheology: Elsevier
Bia D, Armentano R L, Zócalo Y, Barmak W, Migliaro E and Fischer E I C 2005 In vitro model to study arterial wall dynamics
through pressure-diameter relationship analysis Lat Am Appl Res 35 217-24
Box G, Jenkins G M and Reinsel G C 1994 Time series analysis: forecasting and control, third edition: Prentice-Hall
Burattini R and Natalucci S 1998 Complex and frequency-dependent compliance of viscoelastic windkessel resolves
contradictions in elastic windkessels Med Eng Phys 20 502-14
Craiem D, Graf S, Pessana F, Grignola J C, Bia D, Gines F and Armentano R 2005 Cardiovascular engineering: modelization of
ventricular-arterial interaction in systemic and pulmonary circulation Latin American Applied Research 35 111-4
Dahl J J, Dumont D M, Allen J D, Miller E M and Trahey G E 2009 Acoustic radiation force impulse imaging for noninvasive
characterization of carotid artery atherosclerotic plaques: a feasibility study Ultrasound Med Biol 35 707-16
Danilouchkine M G, Mastik F and van der Steen A F 2009 Reconstructive compounding for IVUS palpography IEEE Trans
Ultrason Ferroelectr Freq Control 56 2630-42
Fromageau J, Brusseau E, Gimenez G and Delachartre P 2003 Characterization of PVA Cryogel for intravascular Ultrasound
elasticity imaging IEEE Trans Ultrason Ferroel Freq Contr 50 1318-24
Fung Y 1993 Mechanical Properties of Living Tissues. Biomechanics: Springer
Hardung V 1952 Vergleichende Messungen der dynamischen Elastizitat und Viskositat von Blutgefassen, Kautschuk und
synthetischen Elastomeren Helv Physiol Acta 11 194-211
Heikkila J, Karjalainien T, Vauhkonen M and Hynynen K 2004 3D simulations of difference frequency effects on a blood vessel
in ultrasound-stimulated vibro-acoustography. In: IEEE Ultrasonics Symposium, pp 23-7
Hoeks A P, Brands P J, Willigers J M and Reneman R S 1999 Non-invasive measurement of mechanical properties of arteries in
health and disease Journal of Engineering in Medicine 213 195-202
Holdsworth D W, Norley C J, Frayne R, Steinman D A and Rutt B K 1999 Characterization of common carotid artery blood-flow
waveforms in normal human subjects Physiol Meas 20 219-40
Holzapfel G A, Gasser T C and Stadler M 2002 A structural model for the viscoelastic behavior of arterial walls: Continuum
formulation and finite element analysis Eur J Mech A Solids 21 441-63
Humphrey J D 2008 Mechanisms of arterial remodeling in hypertension. Coupled roles of wall shear and intramural stress
Hypertension 52 195
Marcus R H, Korcarz C, McCray G, Neumann A, Murphy M, Borow K, Weinert L, Bednarz J, Gretler D D and Spencer K T
1994 Noninvasive method for determination of arterial compliance using Doppler echocardiography and subclavian
pulse tracings. Validation and clinical application of a physiological model of the circulation Circulation 89 2688-99
Maurice R L, Soulez G, Giroux M F and Cloutier G 2008 Noninvasive vascular elastography for carotid artery characterization
on subjects without previous history of atherosclerosis Med Phys 35 3436-43
Meinders J and Hoeks A 2004a Simultaneous assessment of diameter and pressure waveforms in the carotid artery Ultrasound
Med Biol 30 147-54
Meinders J, Kornet L and Hoeks A 2003 Assessment of spatial inhomogeneities in intima media thickness along an arterial
segment using its dynamic behavior Am J Physiol Heart Circ Physiol 285: 384–91
Meinders J M and Hoeks A P G 2004b Simultaneous assessment of diameter and pressure waveforms in the carotid artery
Ultrasound Med Biol 30 147–54
Meyers M A and Chawla K K 1999 Mechanical Behavior of Materials: Prentice Hall; US ed edition
Morganti T, Ricci S, Vittone F, Palombo C and Tortoli P 2005 Clinical validation of common carotid artery wall distension
assessment based on multigate doppler processing Ultrasound Med Biol 31 937–45
Nagakura T, Masuda K, Ooe Y, Kosuge S, Hase Y, Okazaki T, Ishihara K, Hori M and Furukawa T 2001 The non-invasive
functional tissue characterization for arteriosclerosis by artery wall motion analysis with time series high-speed echo
images and continuous sphygmomanometer. In: Proceedings of the 23rd Annual International Conference of the IEEE
Engineering in Medicine and Biology Society, pp 197- 200
Nichols W and O’Rourke M 1998 McDonald’s Blood Flow in Arteries: Theoretical, experimental and clinical principles:
Arnold and Oxford University Press Inc.
Page 23
23
Olufsen M S and Nadim A 2004 On deriving lumped models for blood flow and pressure in the systemic arteries. Math Biosci
Eng 1 61-80
Ramnarine K, Hartshorne T, Sensier Y, Naylor M, Walker J, A-Naylor, R.Panerai and Evans D 2003 Tissue Doppler imaging of
carotid plaque wall motion: a pilot study Cardiovasc Ultrasound 19 1-17
Reneman R, Meinders J and Hoeks A 2005 Non-invasive ultrasound in arterial wall dynamics in humans: what have we learned
and what remains to be solved Eur Heart J 26 960-6
Ribbers H, Lopata R G, Holewijn S, Pasterkamp G, Blankensteijn J D and de Korte C L 2007 Noninvasive two-dimensional
strain imaging of arteries: validation in phantoms and preliminary experience in carotid arteries in vivo Ultrasound Med
Biol 33 530-40
Ricci S, Diciotti S, Francalanci L and Tortoli P 2009 Accuracy and reproducibility of a novel dual-beam vector Doppler method
Ultrasound Med Biol 35 829-38
Schmitt C, Soulez G, Maurice R L, Giroux M F and Cloutier G 2007 Noninvasive vascular elastography: toward a
complementary characterization tool of atherosclerosis in carotid arteries Ultrasound Med Biol 33 1841-58
Shi H, Mitchell C C, McCormick M, Kliewer M A, Dempsey R J and Varghese T 2008 Preliminary in vivo atherosclerotic
carotid plaque characterization using the accumulated axial strain and relative lateral shift strain indices Phys Med Biol
53 6377-94
Simon A and Levenson J 2001 Effect of hypertension on viscoelasticity of large arteries in humans Curr Hypertens Rep 3 74-8
Sipahi I, Tuzcu E M, Moon K W, Nicholls S J, Schoenhagen P, Zhitnik J, Crowe T D, Kapadia S and Nissen S E 2008 Do the
extent and direction of arterial remodelling predict subsequent progression of coronary atherosclerosis? A serial
intravascular ultrasound study Heart 94 623-7
Timoshenko S and Goodier J 1970 Theory of Elasticity (New York): McGraw-Hill
Tortoli P, Bassi L, Boni E, Dallai A, Guidi F and Ricci S 2009 ULA-OP: an advanced open platform for ultrasound research
IEEE Trans Ultrason Ferroelectr Freq Control 56 2207-16
Tortoli P, Morganti T, Bambi G, Palombo C and Ramnarine K V 2006 Noninvasive simultaneous assessment of wall shear rate
and wall distension in carotid arteries Ultrasound Med Biol 32 1661-70
Tsamis A and Stergiopulos N 2007 Arterial remodeling in response to hypertension using a constituent-based model Am J
Physiol Heart Circ Physiol 293 H3130-H9
Valdez-Jasso D, Haider M A, Banks H T, Bia D, Zocalo Y, Armentano R and Olufsen M S 2007 Viscoelastic mapping of the
arterial ovine system using a Kelvin model IEEE Trans Biomed Eng. 1 19
Westerhof N, Stergiopulos N and Noble M I M 2004 Snapshots of Hemodynamics: An Aid for Clinical Research and Graduate
Education: Springer
Williams B, Poulter N R, Brown M J, Davis M, McInnes G T, Potter J F, Sever P S and Thom S M 2004 British Hypertension
Society guidelines for hypertension management 2004 (BHS-IV): summary BMJ 328 634-40
Zhang X, Kinnick R, Fatemi M and Greenleaf J 2005 Noninvasive method for estimation of complex elastic modulus of arterial
vessels IEEE Trans Ultrason Ferroel Freq Contr 52 642-52