Journal of Mechanical Science and Technology 24 (2010) 73~76
www.springerlink.com/content/1738-494x DOI 10.1007/s12206-009-1115-8
Estimations of work hardening exponents of engineering metals
using residual indentation profiles of nano-indentation† Byung-Min Kim1, Chan-Joo Lee2 and Jung-Min Lee2,* 1School of Mechanical Engineering, Pusan National University, Busan, Korea
2Dept. of Precision Manufacturing Systems Engineering, Pusan National Univ., Busan, Korea
(Manuscript Received May 4, 2009; Revised September 30, 2009; Accepted October 12, 2009)
Abstract This study was designed to predict work hardening exponent n of materials from AFM (atomic force microscope) observations of re-
sidual indentation impression in sharp indentations. FE simulations of nano-indentation were performed to 140 combinations to each parameter (elastic modulus E, yield stress yσ , work hardening exponent n, and Poisson's ratio ν ) expressing elastic-plastic behaviors of universal engineering metals. Using the results from FE simulations and dimensional analysis, dimensionless functions were estab-lished to correlate residual indentation profiles with the work hardening exponent. This function was examined with nano-indentation, tensile test, and AFM observations after indentation for two materials (Al6061-T6 and copper).
Keywords: Nano-indentation; Work hardening exponent; AFM observation; Engineering metal ---------------------------------------------------------------------------------------------------------------------------------------------------------------------------------------------------------------------------------------------------------------------------------------------- 1. Introduction
One of the main features of nano-indentation technique is the indirect measurement of the contact area between the in-denter and materials during indentation. However, the forma-tion of pile-up and sink-in in contact during indentation in-volves either an overestimation or underestimation of the true contact area [1]. Fischer-Cripps [1, 2] reported that the real contact area of the indenter could be underestimated up to 60% for a certain material in a pile-up, thereby leading to the overestimation of elastic modulus E and hardness. In general, for engineering metals, including elastic-plastic deformations, behaviors of pile-up and sink-in are mainly dependent on their
/ yE σ and the work hardening exponent n [1-3]. This paper was designed to estimate n of the engineering
metals from AFM observations of residual indentation im-pression in nano-indentation using a sharp indenter. FE simu-lations of a sharp indentation were performed to 140 different combinations of elastic-plastic parameters (E, yσ , n, ν ), which represent the power-law behavior of typical engineer-ing metals. Using simulated results and the dimensional analy-sis, the dimensionless function was constructed to relate the residual indentation profile to n of the indented material. Fi-nally, the constructed function was examined with nano-
indentation, tensile tests, and AFM observations for the two materials (Al6061-T6 and copper).
2. FE simulations of indentation and dimensional an-
alysis
FE simulations of nano-indentation and dimensional analy-sis were based on Lee and Dao's studies [4, 5]. The power law true-stress/true-strain curve of the engineering metals in the uniaxial tensile state (Fig. 1) can be assumed as [1, 4, 5]
Eσ ε= , for y
Eσ
ε ≤ and nKσ ε= , for y
Eσ
ε ≥
(1)
where K is strength coefficient. The continuity of the curve in Eq. (1) requires ( / )n
y yK Eσ σ= . Therefore, E, n, yσ , and ν are independent parameters describing the power law be-havior of the material. Applying reduced modulus *E and
σ
1
yσ
rσ
E
yε
rε
pε
ε
= ny yσ Kε
Fig. 1. The power law elastic-plastic stress-strain behavior of metals.
† This paper was presented at the ICMDT 2009, Jeju, Korea, June 2009. This paperwas recommended for publication in revised form by Guest Editors Sung-Lim Ko, Keiichi Watanuki.
74 B.-M. Kim et al. / Journal of Mechanical Science and Technology 24 (2010) 73~76
Conical indenter
Material
70.3o
Tip radius : 40nm
Indentation depth : 1000nm
Fig. 2. FE model of sharp nanoindentation (70.3°).
hm hp
Contact point
Indent profile under load Indent profile after unloading
Indenter Y
X
hrp
Y=0Y=0
Slope pointElastic recovery
(a) Pile - up
hm hp
Contact point
hrp
Slope point
Indent profile under load Indent profile after unloading
IndenterY
XY=0Y=0
Elastic recovery
(b) Sink - up Fig. 3. Definitions of the contact boundary of pile-up and sink-in under full load and after complete unloading.
representative stress rσ [5], instead of E and yσ , the be-havior is represented as *E , rσ , ν , and n [4-6].
FE simulations were carried out for to a total of 140 cases: E varied from 10 to 600 GPa, yσ from 10 to 2500 MPa, and n from 0.01 to 0.5 at 0.1 intervals, and ν was fixed at 0.3. For both the Berkovich and Vickers indenters ( 224.56 mA h= ), the corresponding apex angle of their two dimensional cones is 70.3°. [1] The FE model of nano-indentation (Fig. 2) was assumed to be axisymmetric and two-dimensional, and the indenter was modeled as a rigid body. The contact between the indenter and materials was assumed to be frictionless [7]. The maximum indentation depth mh was 1000nm, where by which the size effect of the indented material was negligible [5]. All the simulations were performed using ABAQUS 6.3-1.
Fig. 3 shows the definitions of the contact boundary of pile-up and sink-in under full load and after complete unloading for FE simulations of the 140 cases. This study used /p mh h and /rp mh h were used as independent parameters to esti-mate the amount of pile-up and sink-in before and after inden-tation. Here, ph and rph are the indentation depths by pile-up and sink-in under full load and after unloading, respec-tively. Using the dimensional analysis, the degree of pile-up and sink-in is expressed as:
*
1 ,p
m r
h E nh σ
⎛ ⎞= Π ⎜ ⎟⎜ ⎟
⎝ ⎠ at mh during loading
(2)
and
*
2 ,rp
m r
h E nh σ
⎛ ⎞= Π ⎜ ⎟⎜ ⎟
⎝ ⎠ after unloading
(3)
(a) Pile-up
(b) Sink-up
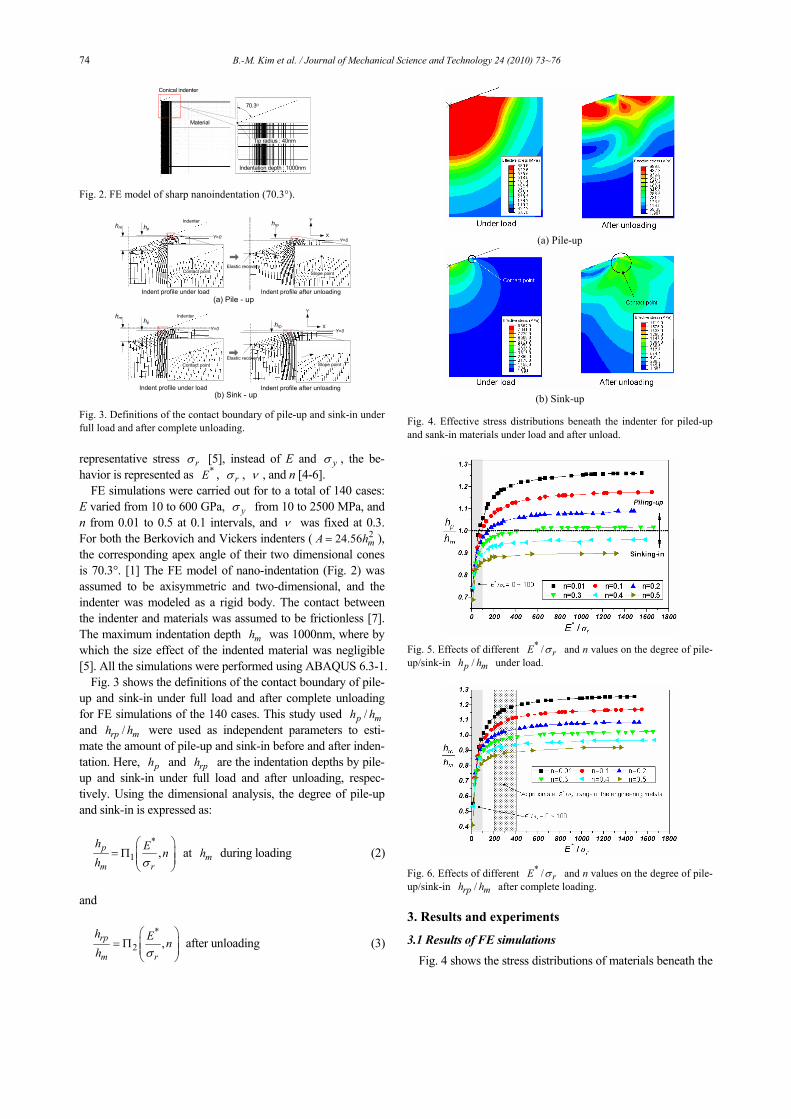
Fig. 4. Effective stress distributions beneath the indenter for piled-up and sank-in materials under load and after unload.
Fig. 5. Effects of different * / rE σ and n values on the degree of pile-up/sink-in /p mh h under load.
Fig. 6. Effects of different * / rE σ and n values on the degree of pile-up/sink-in /rp mh h after complete loading.
3. Results and experiments
3.1 Results of FE simulations
Fig. 4 shows the stress distributions of materials beneath the
B.-M. Kim et al. et al / Journal of Mechanical Science and Technology 24 (2010) 73~76 75
indenter for pile-up (E= 500GPa, yσ = 150MPa, n= 0.5) and sink-in (E= 240GPa, yσ = 650MPa, n= 0.01) at full load and after complete unloading. In the case of pile-up, the maximum stress distributions under load were observed to have a hemi-spherical shape and located widely over the piled -up part. Also, the residual stress distributions after unloading were extensively placed near the indenter and the piled -up part. In the case of sink-in, the stress distributions beneath the indenter were limited within the contact radius and were more deeply formed compared to those in the pile-up. Also, the maximum stress distributions were concentrated near the indenter tip. However, the residual stress distributions after unloading were concentrated at the sink-in part, and the values were also very low in terms of elastic recovery. For sink-in, the amount of elastic recovery and the difference between stress values at loading and after unloading were much larger than those in the pile-up [1, 2]. The * / rE σ values for each material of the 140 cases in FE simulations were determined from Lee's study [4]. Fig. 5 shows /p mh h with different n values under full load. Inden-tation profiles were divided according to pile-up and sink-in at approximately n = 0.3. In general, the pile-up and sink-in of the indented material were very much dependent on their n values at around 400 * / rE σ< . However, they depended heav-ily on * / rE σ , not n, at about 400 * / rE σ> . Also, the only sink-in was dominant, especially at about 100 * / rE σ> , indi-cating properties like polymeric materials with high elastic strain. Fig. 6 shows /rp mh h with different n values after complete unloading. Since rph of pile-up may be smaller than mh due to high elastic recovery of the indenter's apex, it is difficult to distinguish scenarios of pile-up/sink-in from Fig. 5. However, n of the indented materials can be characterized by their residual indentation depth using these data. Therefore, the dimensionless 2Π function to determine n of the in-dented material after complete unloading can be given by Eq. (3) and its closed form are shown to be completed by fitting all 140 data points within ±3.0% errors in Fig. 6 (Appendix A).
3.2 Experiments
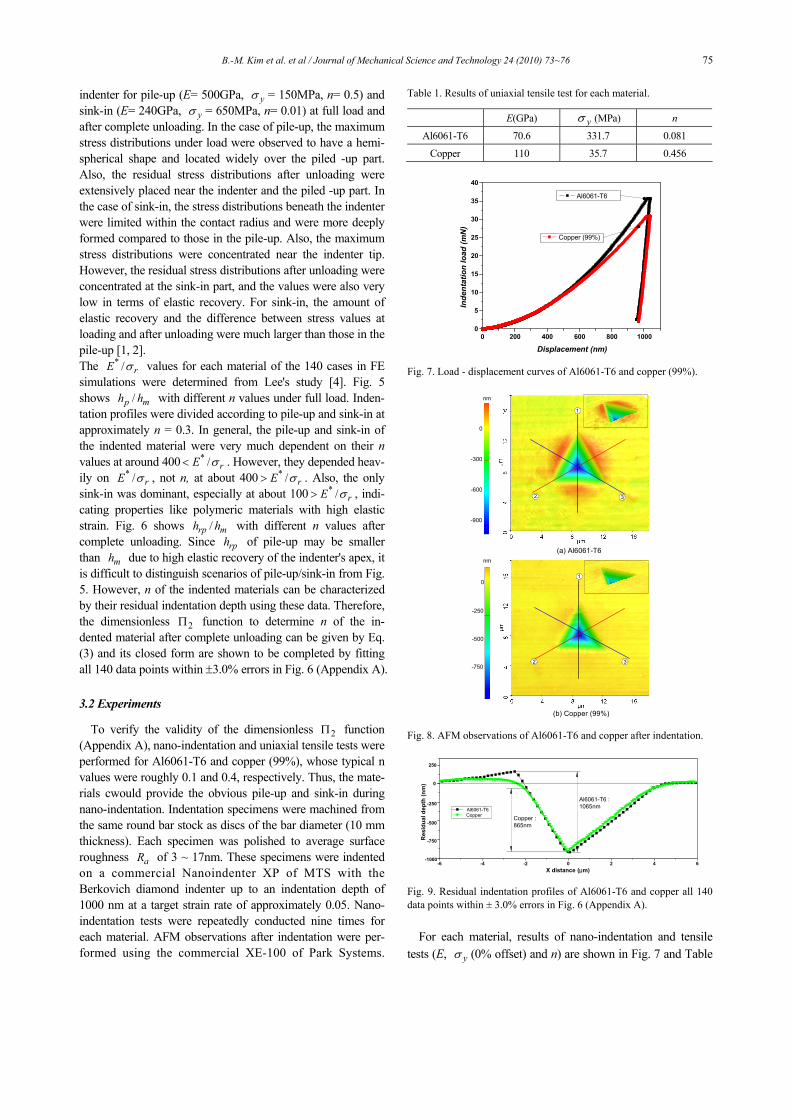
To verify the validity of the dimensionless 2Π function (Appendix A), nano-indentation and uniaxial tensile tests were performed for Al6061-T6 and copper (99%), whose typical n values were roughly 0.1 and 0.4, respectively. Thus, the mate-rials cwould provide the obvious pile-up and sink-in during nano-indentation. Indentation specimens were machined from the same round bar stock as discs of the bar diameter (10 mm thickness). Each specimen was polished to average surface roughness aR of 3 ~ 17nm. These specimens were indented on a commercial Nanoindenter XP of MTS with the Berkovich diamond indenter up to an indentation depth of 1000 nm at a target strain rate of approximately 0.05. Nano-indentation tests were repeatedly conducted nine times for each material. AFM observations after indentation were per-formed using the commercial XE-100 of Park Systems.
Table 1. Results of uniaxial tensile test for each material.
E(GPa) yσ (MPa) n
Al6061-T6 70.6 331.7 0.081
Copper 110 35.7 0.456
0 200 400 600 800 10000
5
10
15
20
25
30
35
40
Inde
ntat
ion
load
(mN
)
Displacement (nm)
Al6061-T6
Copper (99%)
Fig. 7. Load - displacement curves of Al6061-T6 and copper (99%).
0
-300
-600
-900
nm
1
2 3
-250
-500
-750
0
nm
1
2 3
(a) Al6061-T6
(b) Copper (99%) Fig. 8. AFM observations of Al6061-T6 and copper after indentation.
Res
idua
l dep
th (n
m)
-6 -4 -2 0 2 4 6-1000
-750
-500
-250
0
250
Al6061-T6 Copper
X distance (μm)
Al6061-T6 : 1065nm
Copper : 865nm
Fig. 9. Residual indentation profiles of Al6061-T6 and copper all 140 data points within ± 3.0% errors in Fig. 6 (Appendix A).
For each material, results of nano-indentation and tensile
tests (E, yσ (0% offset) and n) are shown in Fig. 7 and Table
76 B.-M. Kim et al. / Journal of Mechanical Science and Technology 24 (2010) 73~76
Table 2. * / rE σ and /p mh h of each materials and the estimated n from 2∏ functions.
* / rE σ /rp mh h n ( 2Π function)Al6061-T6 191.17 1.065 0.075
Copper 110 0.865 0.466
1, respectively. Fig. 8 shows the typical AFM images of the residual indentation impressions after indentation of the two materials, which showed scenarios of obvious pile-up for Al6061-T6 with n=0.081 and sink-in for copper with n=0.456. Fig. 9 shows the residual indentation profiles of two materials, which are the average profiles measured for three locations marked in Fig. 8.
3.3 Estimations of work hardening exponents
Detailed procedure to obtain * / rE σ of Al6061-T6 and copper used in this study was referred in Lee's work [ ]. Also,
rph values of each material after indentation were obtained from Fig. 9. * / rE σ and /rp mh h of Al6061-T6, as well as the copper used to estimate n and the subsequently calculated n values using the 2Π function are listed in Table 2.
The 2Π functions provide relatively accurate estimates of n with -8.0% errors for Al6061-T6 and with 9.19% errors for copper (99%) compared to the tensile tests. These errors are due to the difference between each of the pile-up/sink-in gen-erated by Berkovich and its equivalent cone indenters. The
2Π function was established based on the equivalent cone indenter. Therefore, the entire amounts of pile-up and sink-in obtained from AFM observations (Fig. 9) and the further ex-tracted n could be somewhat overestimated in the case of the Berkovich indenter. To calibrate differences, the definition of geometric relation between each pile-up and sink-in created by two indenters is required. We will discuss the problem in future research. Consequently, 2Π function can be used as a simple method for estimating the approximate n from the re-sidual indentation impression of nano-indentation.
4. Conclusions
This study was performed to relate residual indentation profile to the work hardening exponent of the indented material. The residual indentation profiles of the indented material were di-vided into scenarios of pile-up and sink-in at approximately n= 0.3. Also, the phenomena of pile-up and sink-in were dependent on * / rE σ , as well as n at around 200 * / rE σ< < 400, which is the approximate range of the engineering metals. From this rela-tion, the dimensionless 2Π function was set up to relate the work hardening exponent and residual indentation profile of the indented material. The n values extracted from the function agreed well with those of the tensile tests within ±10% errors.
Acknowledgments
This work was supported by KICOS through a grant pro-vided by MEST in 2008 (No. K2060111114-08E0100-00410) and a grant-in-aid for the NCRC Program of MOST and KOSEF (No. R15-2006-022-03003-0).
References [1] A. C. Fischer-Cripps, Nanoindentation, Springer-Verlag,
New York, USA, (2002). [2] A. C. Fischer-Cripps, A review of analysis methods for sub-
micron indentation testing, Vacuum, 58 (2000) 569-585. [3] A. Bolshakov and G. M. Pharr, Influence of piling-up on the
measurement of mechanical properties by load and depth sensing indentation techniques, Journal of material research, 13 (4) (1998) 1049-1058.
[4] J. M. Lee et al., Improvement of Dao's reverse analysis and determination of representative strain for extracting elastic-plastic properties of materials in analysis of nanoindentation, Journal of KSME-A, 32 (2) (2008) 105-118.
[5] M. Dao et al., Computational modeling of the forward and reverse problems in instrumented sharp indentation, Acta materialia, 49 (2001) 3899-3918.
[6] Y. T. Cheng and C. M. Cheng, Scaling, dimensional, and indentation measurements, Material science and Engineer-ing R 44 (2004) 91-149.
[7] J. L. Bucaille et al., Determination of plastic properties of metals by instrumented indentation using different sharp in-denters, Acta materialia, 51 (2003) 1663-1678.
Byung-Min Kim received his B.S. degree (1979), M.S. (1984) and Ph.D. (1987) from Pusan National University. He is currently a Professor at the School of Mechanical Engineer-ing at Pusan National University, and currently serv-ing as a Director in PNU-IFAM Joint Research Center. His major area is
metal forming process and hybrid joining technology.
Jung-Min Lee received his B.S. De-gree(2001), M.S. (2003) and Ph.D. (2008) from Pusan National University. He is currently a Researcher at Korea Institute of Materials Science. His major area is metal forming process.