27
Estonian Dairy Sector 2005 Tiina Saron, MBA Estonian Dairy Association managing director
| Date post: | 23-Jul-2015 |
| Category: |
Business |
| Upload: | piimaliit2 |
| View: | 49 times |
| Download: | 0 times |

Estonian Dairy Sector 2005
Tiina Saron, MBAEstonian Dairy Associationmanaging director

Overall introduction
% 1996 1998 2000 2001 2002 2003 2004
Share ofmilkproductionin GAO
27 28 29 31 31 28 30
Share ofmilkprocessingin foodindustry
26 28 28 30 27 26 32
Share ofmilk in foodexports
33 32 28 25 22 20 22
Source: ESO

Milk production
0
200
400
600
800
1000
1200
1400
19
25
19
50
19
75
19
90
19
91
19
92
19
93
19
94
19
95
19
96
19
97
19
98
19
99
20
00
20
01
20
02
20
03
20
04
20
05
0
1
2
3
4
5
6
7per cow, EU
per cow, EST
total, EST
th tonnetonne

Per Cent of Dairy Cows Living in Herds with the Respective Size

Herd size(cows)
2000 2002 2004 2005
% herd
% milk
% herd
% milk
% herd
% milk
% herd
% milk
1 - 10 68 10 64 7 62 6 55 4,4
11- 50 21 14 24 13 25 12 29 12
51- 100 3 6 4 7 4 6 4,5 6
101-300 5 27 6 28 6 27 8 27
301-600 2 22 2 23 2 25 3 28
601-900 0,3 9 0,5 10 0,6 10 0,6 10
901-1200 0,1 3 0,1 5 0,2 7 0,1 4,2
1200- 0,1 8 0,1 8 0,1 7 0,2 9

Milk quota
0
500
1000
1500
2000
2500
3000
Estonia Slovenia Latvia Slovakia Lithuania Hungary CzechRep
production 2002
quota
0
2000
4000
6000
8000
10000
12000
14000
Poland
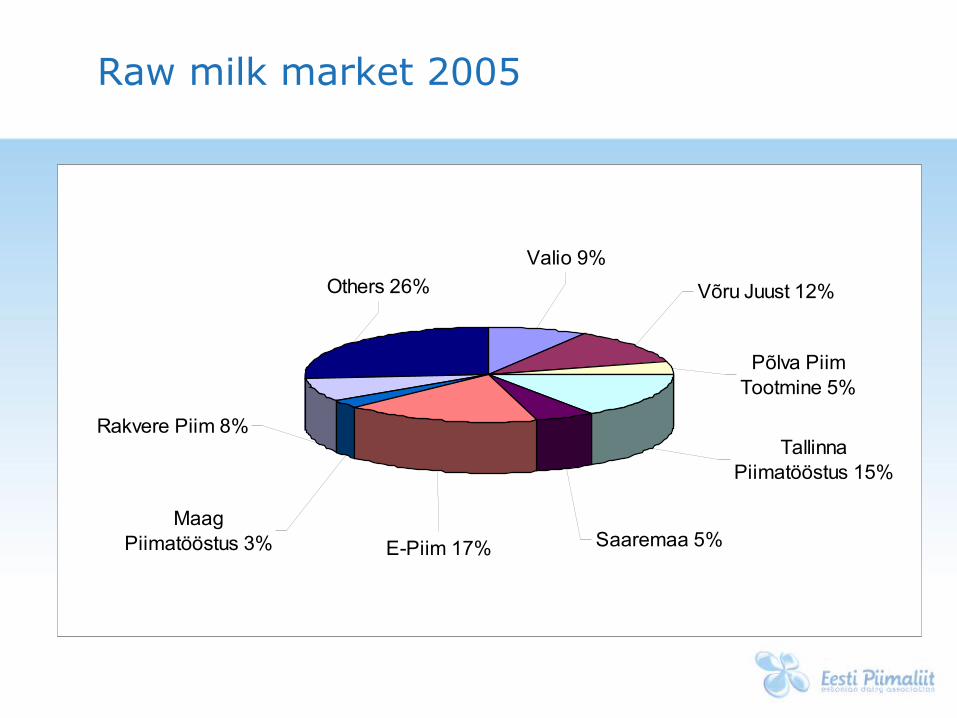
Raw milk market 2005
Saaremaa 5%
Tallinna Piimatööstus 15%
Põlva Piim Tootmine 5%
Võru Juust 12%
E-Piim 17%
Valio 9%
Maag Piimatööstus 3%
Rakvere Piim 8%
Others 26%

Quality of Raw Milk 2005
52%38% 39%
41%58% 57%
41%
58%67% 71%
79% 83% 87% 88%
43%
32%27% 23%
17% 14% 12%
6% 3% 3,70%10%
0%
10%
20%
30%
40%
50%
60%
70%
80%
90%
100%
1995
1996
1997
1998
1999
2000
2001
2002
2003
2004
2005
grade I
elite or highergrade
elite grade
higher grade

Price of Raw Milk, EEK/kg

Structure of the Dairy Industry
35 enterprises, 41 processing units
19 large capacity units (process more than 2 mn litres of raw milk annually),
13 small capacity units ( less than 2 mn litres), 9 units do not use raw milk
5 co-operatives, they own 7 units
Foreign investment in 5 enterprises; which own 8 units

Production of milk products (th t)
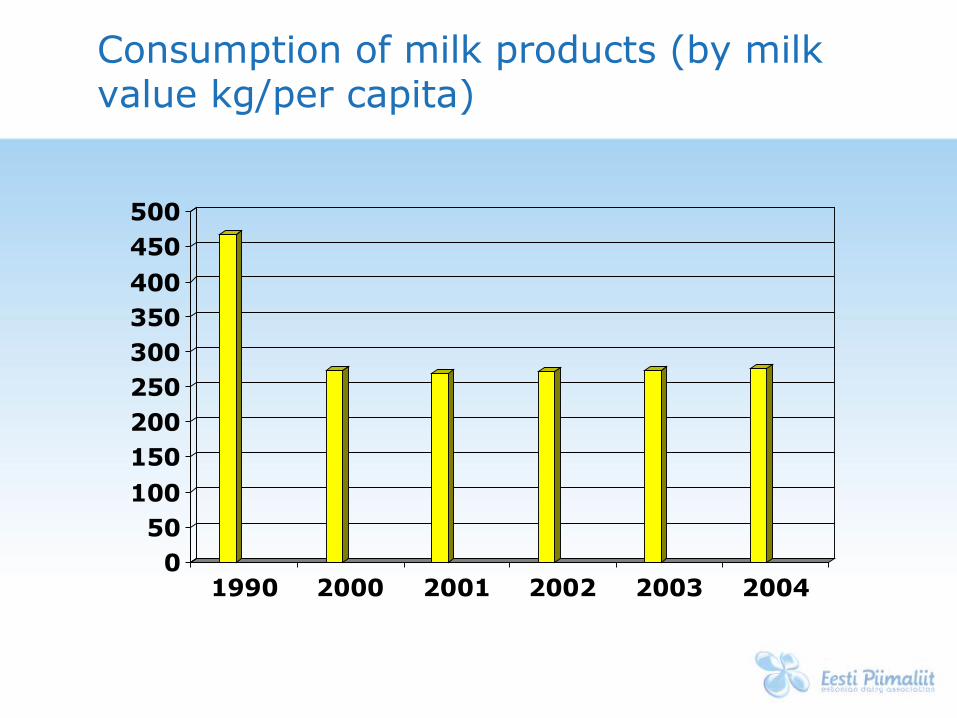
Consumption of milk products (by milk value kg/per capita)
050100150200250300350400450500
1990 2000 2001 2002 2003 2004

Consumption of drinking milk per capita
60
65
70
75
80
85
1996 1997 1999 2001 2002 2003 2004

Consumption of Milk Products (kg per capita)
012345678910
sourmilk
joghurt cheese quark sourcream
1996200020032004

Consumption in other countries
Consumption of Milk, Cheese and Butter in Europe in 2002, kg per capita annually
020406080
100120140160180
Irela
nd
Finl
and UK
Sw
eden
Denm
ark
Neth
erla
nds
Fran
ce
Hun
gary
Aust
ria
Ger
man
y
Cze
ch R
ep
Bel
gium
Pol
and
Slov
enia
Est
onia
Gre
ece
Lith
uani
a
0
5
10
15
20
25
30cheese butter milk
milk
butter,
cheese

Trade of dairy products
-300
-250
-200
-150
-100
-50
0
50
1995 1996 1997 1998 1999 2000 2001 2002 2003 2004
Foreign Trade Balance (mio EUR)
agriculturalproducts
milk and milkproducts

………..cont
By Product Group
skimmed milk pow der
25%
butter and other milk fat
27%
cheese and quark19%
ice cream4%
w hole milk pow der
17%sour milk products
3%
yoghurt3%
other2%
By Destination
Netherlands35%
Germany18%
Lithuania5%
Finland4%
France10%
other countries
14%
Italy3%
Russia3% Belgium
4%
Latvia4%

Trade of agricultural products with Russia
Trade with Russia before and after Accession
Export
0
10
20
30
40
50
60
70
may june july aug sep
2003
2004
Import
0
5
10
15
20
25
30
35
may june july aug sep
2003
2004

Promotion
•Increasing trend everywhere - to encourage the production of higher value added special and traditional products (incl. emotional values)
Examples:•“European Cookery” - Dutch project
•program “Estonian Food” (www.eestitoit.ee)
•campaign “Life originates from milk” (75% financed by the state, 25% by the members of Estonian Dairy Associataion)
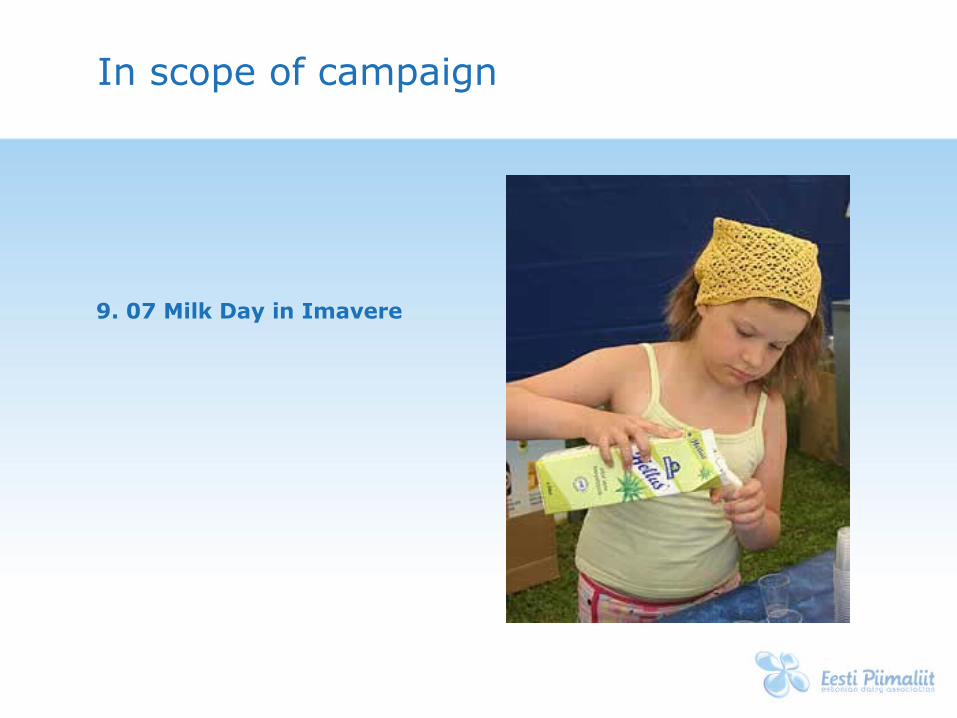
In scope of campaign
9. 07 Milk Day in Imavere

…cont
billboards, print, commercial etc.
participants:
•Eri Klas, conductor
•Eda Ines Etti, singer
•Gert Koovit, coach
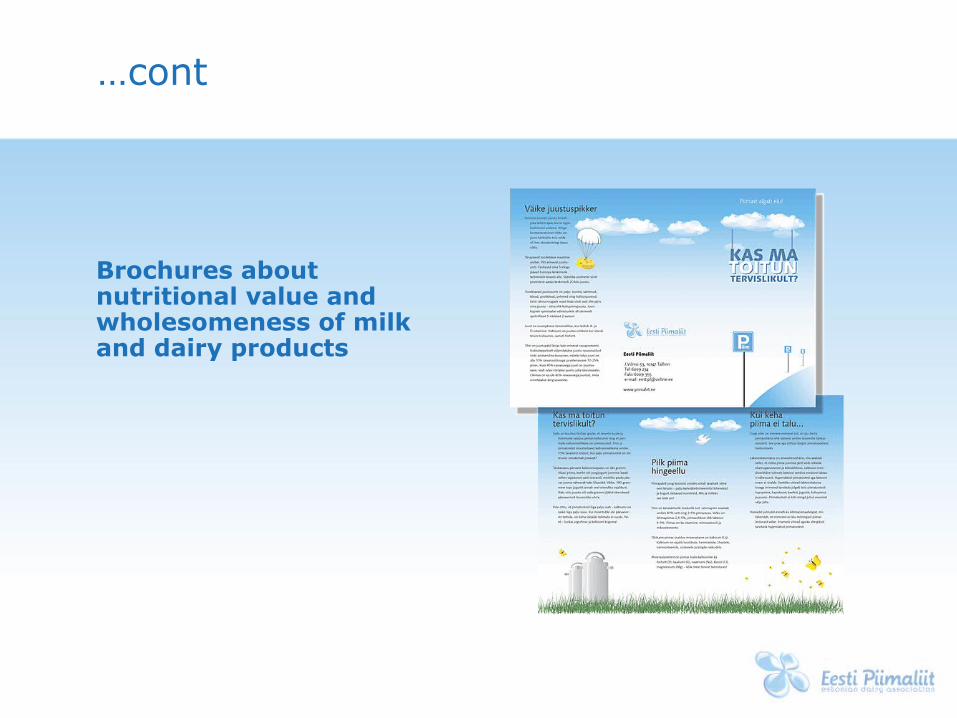
…cont
Brochures about nutritional value and wholesomeness of milk and dairy products

…cont
Workbook for kids

...cont
Recepies and articles in different magazines
...cont
Book “Estonian Milk”
...cont
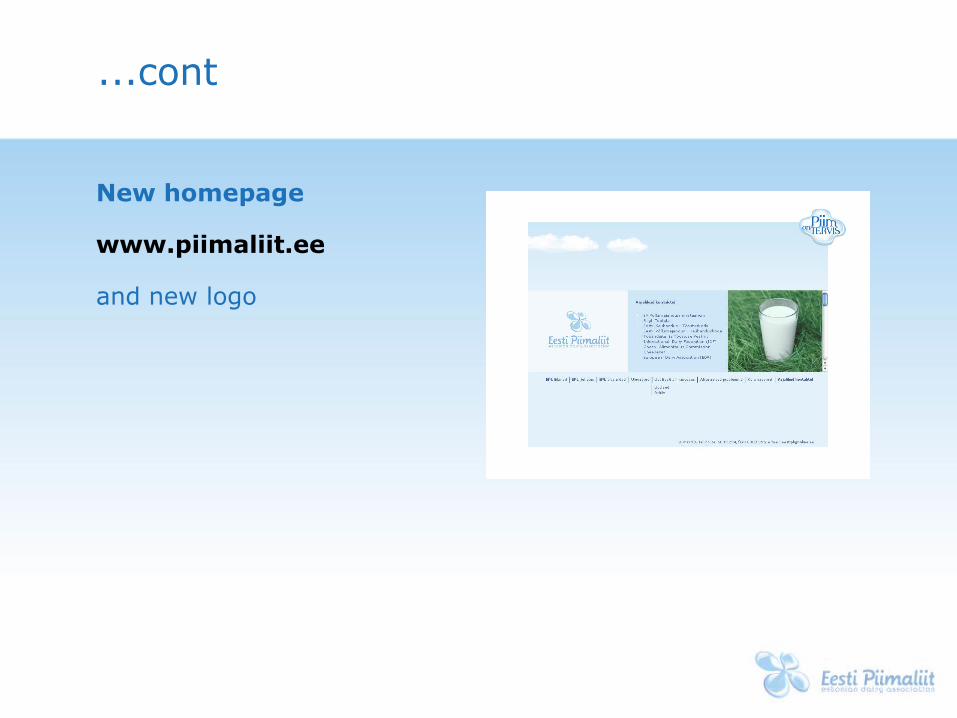
New homepage
www.piimaliit.ee
and new logo
…cont
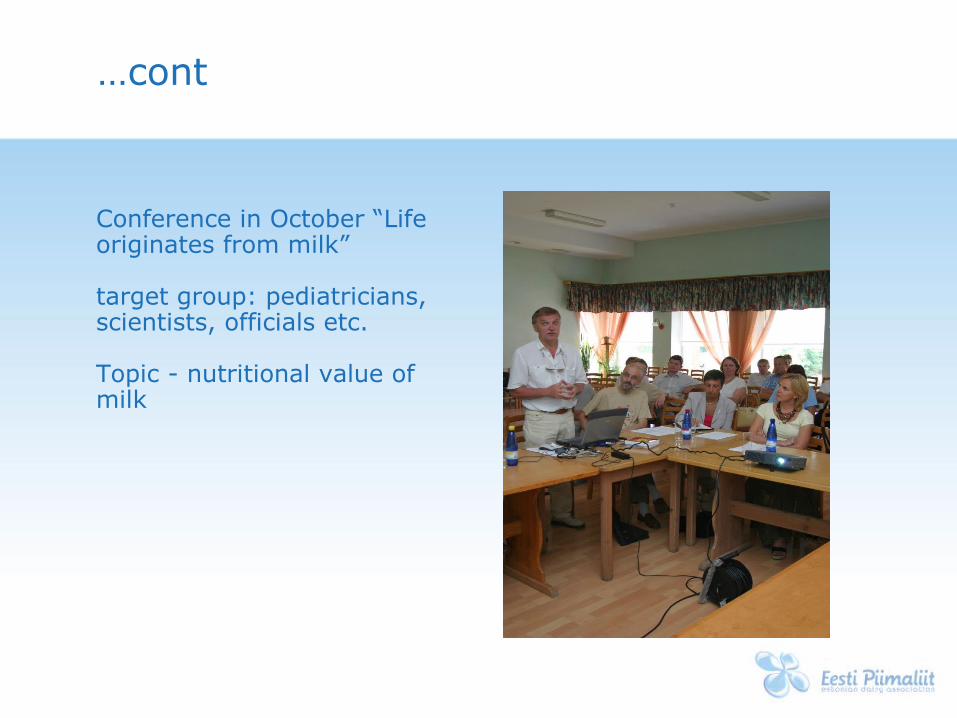
Conference in October “Life originates from milk”
target group: pediatricians, scientists, officials etc.
Topic - nutritional value of milk


![Dairy sector review 2011 [PDF 2.3MB]](https://static.documents.pub/doc/80x56/5868c4631a28ab12578bb5e3/dairy-sector-review-2011-pdf-23mb.jpg)


