ETAP PowerStation 4.0 User Guide Copyright 2001 Operation Technology, Inc. All Rights Reserved This manual has copyrights by Operation Technology, Inc. All rights reserved. Under the copyright laws, this manual may not be copied, in whole or in part, without the written consent of Operation Technology, Inc. The Licensee may copy portions of this documentation only for the exclusive use of Licensee. Any reproduction shall include the copyright notice. This exception does not allow copies to be made for other persons or entities, whether or not sold. Under this law, copying includes translating into another language. Certain names and/or logos used in this document may constitute trademarks, service marks, or trade names of Operation Technology, Inc. or other entities. • Access, Excel, ODBC, SQL Server, Windows NT, Windows 2000, Windows Me, Windows 98, Windows XP, and Microsoft Word are registered trademarks of Microsoft Corporation. • AutoCad is a registered trademark of Autodesk. • Oracle is a registered trademark of Oracle Corporation. • PowerPlot is a registered trademark of Jackson & Associates. • Crystal Reports is a registered trademark of Seagate Software. • MATLAB and Simulink are registered trademarks of MathWorks • Screen shot(s) reprinted by permission from Microsoft Corporation. Operation Technology, Inc. believes that the information contained herein is accurate as of its publication date, and such information is subject to change without notice. This information is provided “as is” without warranty of any kind, either expressed or implied, including but not limited to the implied warranties of merchantability, fitness for a particular purpose, or non- infringement. Operation Technology, Inc. assumes no responsibility for errors or omissions in this publication or any other documents referenced in this publication. Operation Technology, Inc. Southern California (949) 462-0100 Sales (949) 462-0400 Fax (949) 462-0400 User Support
Transcript
ETAP PowerStation 4.0
User Guide
Copyright 2001 Operation Technology, Inc.
All Rights Reserved This manual has copyrights by Operation Technology, Inc. All rights reserved. Under the copyright laws, this manual may not be copied, in whole or in part, without the written consent of Operation Technology, Inc. The Licensee may copy portions of this documentation only for the exclusive use of Licensee. Any reproduction shall include the copyright notice. This exception does not allow copies to be made for other persons or entities, whether or not sold. Under this law, copying includes translating into another language. Certain names and/or logos used in this document may constitute trademarks, service marks, or trade names of Operation Technology, Inc. or other entities. • Access, Excel, ODBC, SQL Server, Windows NT, Windows 2000, Windows Me, Windows
98, Windows XP, and Microsoft Word are registered trademarks of Microsoft Corporation. • AutoCad is a registered trademark of Autodesk. • Oracle is a registered trademark of Oracle Corporation. • PowerPlot is a registered trademark of Jackson & Associates. • Crystal Reports is a registered trademark of Seagate Software. • MATLAB and Simulink are registered trademarks of MathWorks • Screen shot(s) reprinted by permission from Microsoft Corporation. Operation Technology, Inc. believes that the information contained herein is accurate as of its publication date, and such information is subject to change without notice. This information is provided “as is” without warranty of any kind, either expressed or implied, including but not limited to the implied warranties of merchantability, fitness for a particular purpose, or non-infringement. Operation Technology, Inc. assumes no responsibility for errors or omissions in this publication or any other documents referenced in this publication.
Operation Technology, Inc. Southern California
(949) 462-0100 Sales (949) 462-0400 Fax (949) 462-0400 User Support
Chapter 15
Load Flow Analysis
The PowerStation Load Flow Analysis program calculates the bus voltages, branch power factors, currents, and power flows throughout the electrical system. The program allows for swing, voltage regulated, and unregulated power sources with multiple utility and generator connections. It handles both radial and loop systems. Different methods are provided for you to select from in order to achieve the best calculation efficiency. This chapter defines definitions and explains the usage of different tools you will need to run load flow studies. Theoretical background for different load flow calculation methods is also provided. The Load Flow Toolbar section explains how can you launch a load flow calculation, open and view an output report, or select display options. The Load Flow Study Case Editor section explains how can you create a new study case, what parameters are required to specify a study case, and how to set them. The Display Options section explains what options are available for displaying some key system parameters and the output results on the one-line diagram, and how to set them. The Load Flow Calculation Methods section shows formulations of different load flow calculation methods. Comparisons on their rate of convergence, improving convergence based on different system parameters and configurations, and some tips on selecting an appropriate calculation method are also found in this section. The Required Data for Calculations section describes what data is necessary to perform load flow calculations and where to enter them. Finally, the Load Flow Study Output Report section illustrates and explains output reports and their format.
Operation Technology, Inc. 15-1 ETAP PowerStation 4.0
Load Flow Analysis Toolbar
15.1 Load Flow Toolbar The Load Flow Toolbar will appear on the screen when you are in the Load Flow Study mode.
Run Load Flow Studies
Update Cable Load Current
Alert View
Load Flow Display Options
Load Flow Report Manager
Run LSelect aperform name is report.
UpdatSelectingrun loadcable ass
Load FThe resuclick on Alert VAfter peequipme
Operation T
Halt Current Calculation
Get Archived Data
Get Online Data
oad Flow Studies study case from the Study Case Editor. Then click on the Run Load Flow Study icon to a load flow study. A dialog box will appear to specify the output report name if the output file set to Prompt. The study results will then appear on the one-line diagram and in the output
e Cable Load Current the Update Cable Load Current icon will transfer cable load current data from the previously
flow study. The data is transferred to the Operating Load Current in the Cable Editor for each ociated with the load flow study.
low Display Options lts from load flow studies are displayed on the one-line diagram. To edit how these results look, the Load Flow Display Options icon. For more information see Load Flow Display Options.
iew rforming a load flow study, you can click on this button to open the Alert View, which lists all nt with critical and marginal violations based on the settings in the study case.
echnology, Inc. 15-2 ETAP PowerStation 4.0
Load Flow Analysis Toolbar
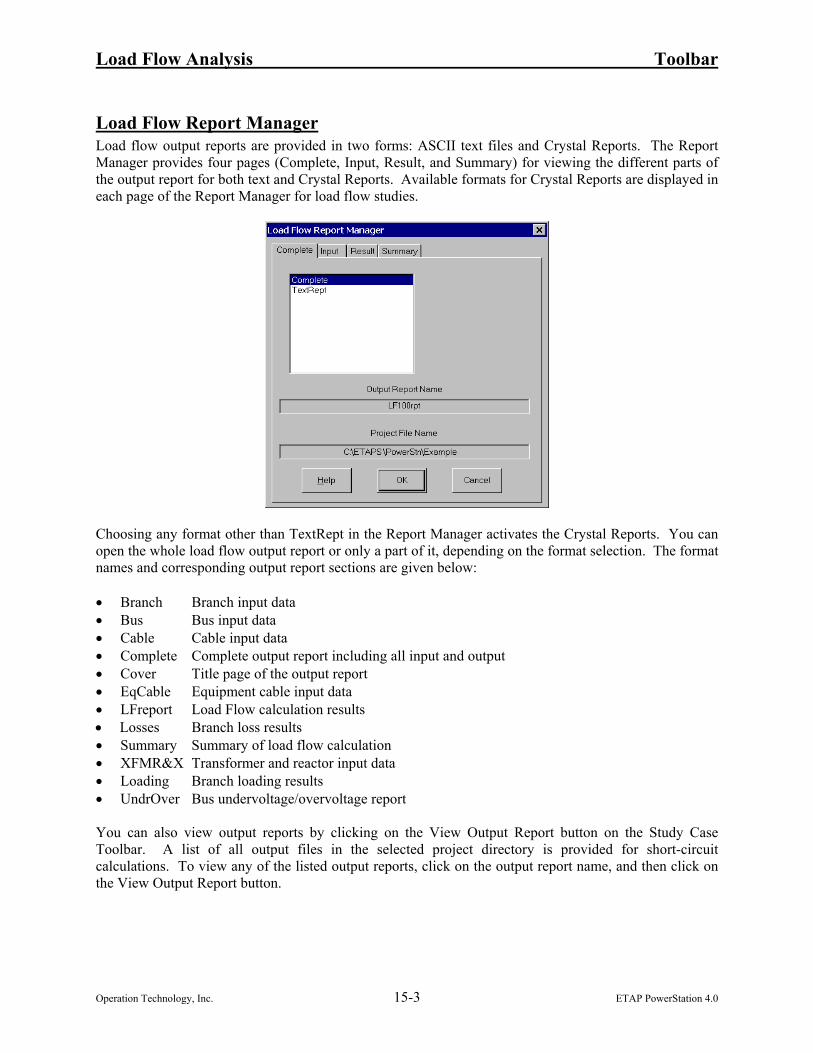
Load Flow Report Manager Load flow output reports are provided in two forms: ASCII text files and Crystal Reports. The Report Manager provides four pages (Complete, Input, Result, and Summary) for viewing the different parts of the output report for both text and Crystal Reports. Available formats for Crystal Reports are displayed in each page of the Report Manager for load flow studies.
Choosing any format other than TextRept in the Report Manager activates the Crystal Reports. You can open the whole load flow output report or only a part of it, depending on the format selection. The format names and corresponding output report sections are given below: • Branch Branch input data • Bus Bus input data • Cable Cable input data • Complete Complete output report including all input and output • Cover Title page of the output report • EqCable Equipment cable input data • LFreport Load Flow calculation results • Losses Branch loss results • Summary Summary of load flow calculation • XFMR&X Transformer and reactor input data • Loading Branch loading results • UndrOver Bus undervoltage/overvoltage report You can also view output reports by clicking on the View Output Report button on the Study Case Toolbar. A list of all output files in the selected project directory is provided for short-circuit calculations. To view any of the listed output reports, click on the output report name, and then click on the View Output Report button.
Operation Technology, Inc. 15-3 ETAP PowerStation 4.0
Load Flow Analysis Toolbar
Load flow text output reports (with an .lfr extension) can be viewed by any word processor such as Notepad, WordPad, and Microsoft Word. Currently, by default, the output reports are viewed by Notepad. You can change the default viewer in the ETAPS.INI file to the viewer of your preference (refer to Chapter 1). The text output reports are 132 characters wide with 66 lines per page. For the correct formatting and pagination of output reports, you MUST modify the default settings of your word processor application. For Notepad, WordPad, and Microsoft Word applications, recommended settings are explained in the Printing & Plotting section.
Halt Current Calculation The Stop Sign button is normally disabled. When a short-circuit calculation has been initiated, this button becomes enabled and shows a red stop sign. Clicking on this button will terminate the calculation.
Get Online Data When PowerStation Management System is set-up, and the Sys Monitor presentation is on-line, you can bring real-time data into your off-line presentation and run a Load Flow by pressing on this button. You will notice that the Operating Loads, Bus Voltages, and Study Case Editor will be updated with the on-line data.
Get Archived Data When ETAPS Playback is set-up, and any presentation is on Playback mode, you can bring this data into your presentation and run a Load Flow by pressing on this button. You will notice that the Operating Loads, Bus Voltages, and Study Case Editor will be updated with the playback data.
Operation Technology, Inc. 15-4 ETAP PowerStation 4.0
Load Flow Analysis Study Case Editor
15.2 Study Case Editor The Load Flow Study Case Editor contains solution control variables, loading conditions, and a variety of options for output reports. PowerStation allows you to create and save an unlimited number of study cases. Load flow calculations are conducted and reported in accordance with the settings of the study case selected in the toolbar. You can easily switch between study cases without the trouble of resetting the study case options each time. This feature is designed to organize your study efforts and save you time. As a part of the multi-dimensional database concept of PowerStation, study cases can be used for any combination of the three major system toolbar components, i.e. for any configuration status, one-line diagram presentation, and Base/Revision data. When you are in Load Flow Analysis mode, you can access the Load Flow Study Case Editor by clicking on the Study Case button from the Load Flow Study Case Toolbar. You can also access this editor from the Project View by clicking on the Load Flow Study Case folder.
To create a new study case, go to the Project View, right-click on the Load Flow Study Case folder, and select Create New. The program will then create a new study case, which is a copy of the default study case, and adds it to the Load Flow Study Case folder.
Operation Technology, Inc. 15-5 ETAP PowerStation 4.0
Load Flow Analysis Study Case Editor
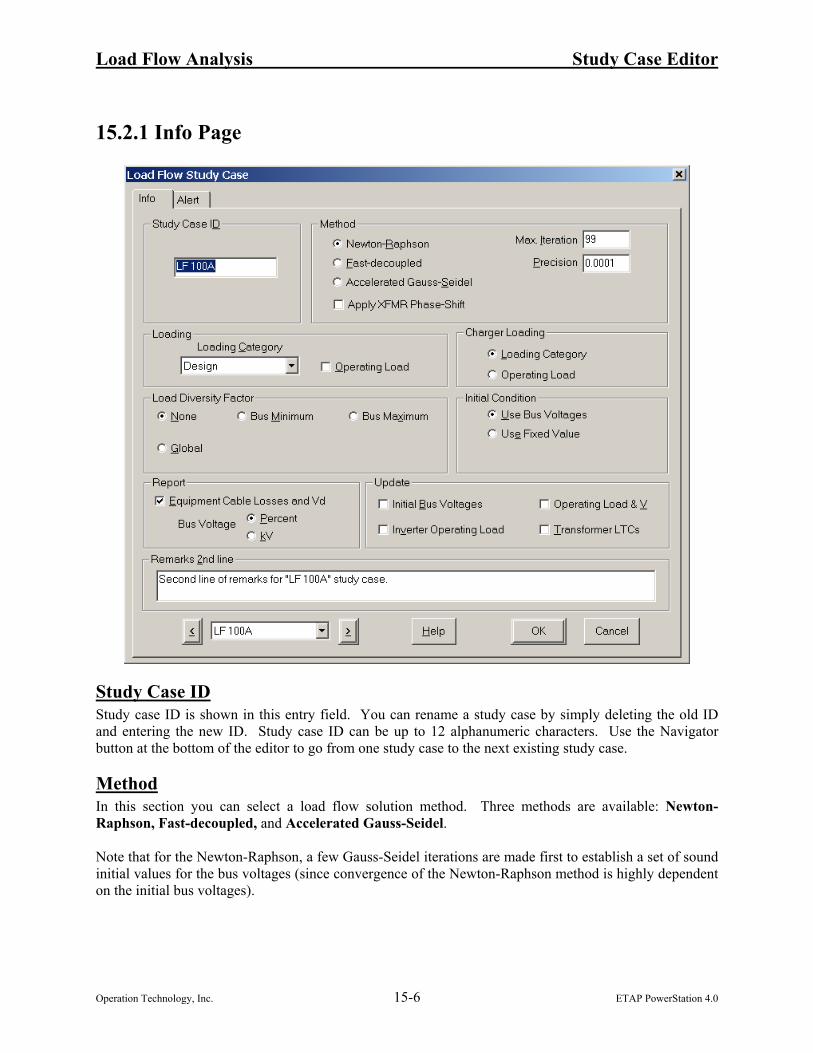
15.2.1 Info Page
Study Case ID Study case ID is shown in this entry field. You can rename a study case by simply deleting the old ID and entering the new ID. Study case ID can be up to 12 alphanumeric characters. Use the Navigator button at the bottom of the editor to go from one study case to the next existing study case.
Method In this section you can select a load flow solution method. Three methods are available: Newton-Raphson, Fast-decoupled, and Accelerated Gauss-Seidel. Note that for the Newton-Raphson, a few Gauss-Seidel iterations are made first to establish a set of sound initial values for the bus voltages (since convergence of the Newton-Raphson method is highly dependent on the initial bus voltages).
Operation Technology, Inc. 15-6 ETAP PowerStation 4.0
Load Flow Analysis Study Case Editor
Maximum Iteration Enter the maximum number for iterations. If the solution has not converged before the specified number of iterations, the program will stop and inform the user. The recommended and default values are 2000 for the Gauss-Seidel method, and five for the Newton-Raphson and Fast-decoupled methods.
Precision Enter the value for the solution precision, which is used to check for convergence. This value determines how precise you want the final solution to be. For the Gauss-Seidel method, precision is applied to check the difference between the bus voltages after each iteration. For the Newton-Raphson and Fast-decoupled methods, the precision is compared with the difference in power for each bus (MW and Mvar) between iterations. If the difference between the iterations is less than or equal to the value entered for precision, the desired accuracy is achieved. If the solution converges but the mismatch values are high, reduce the value of the precision to make your results more precise and run the program again (you may need to increase the number of iterations). Note that a smaller precision value results in lower mismatch (higher accuracy), as well as a longer run time. The default (and recommended) values are 0.000001 pu volts for the Gauss-Seidel method, and .001 pu power for the Newton-Raphson and Fast-decoupled methods.
Acceleration Factor This field is present if the Accelerated Gauss-Seidel method is used. Enter the convergence acceleration factor to be used between iterations. Typical values are between 1.2 and 1.7; the default is 1.45.
Apply XFMR Phase-Shift Check this box to consider transformer phase-shift in load flow calculations. The phase-shift of a transformer can be found from the transformer editor.
Loading In the Loading section of the Load Flow Study Case Editor, you can specify the operating loads by selecting a loading category and diversity factors (variable or fixed).
Loading Category Select one of the ten Loading Categories for this Load Flow Study. With the selection of any category, PowerStation uses the percent loading of individual motors and other loads as specified for the selected category. Note that you can assign loading to each one of the ten categories from the Nameplate page of the induction machine editor and synchronous motor editor and the Loading or Rating page of other load component editors.
Operating Load This option is available if your ETAP key has the online feature. When this box is checked, the operating loads updated from online data or a previous load flow study will be utilized in the load flow study.
Load Diversity Factor This section allows you to specify load diversity factors to be applied on the loading category load. When the Operating Load is selected, no diversity factor is considered.
None Select None to use the percent loading of each load as entered for the selected Loading Category.
Operation Technology, Inc. 15-7 ETAP PowerStation 4.0
Load Flow Analysis Study Case Editor
Bus Maximum When the Maximum Loading option is selected, all motors and other loads directly connected to each bus will be multiplied by the bus maximum diversity factor. Using this option, you can simulate load flow studies with each bus having a different maximum diversity factor. This study option is helpful when the future loading of the electrical system has to be considered and each bus may be loaded at a different maximum value.
Bus Minimum When the Minimum Bus Loading option is selected, all motors and other loads directly connected to each bus will be multiplied by the bus minimum diversity factor. Using this option, you can simulate load flow studies with each bus having a different minimum diversity factor. The minimum bus loading study option may be used to see the effect of transformer taps and capacitors (if any) on the system voltages under a minimum (light) loading condition.
Global Diversity Factor Enter the diversity factors for all constant kVA and constant Z loads. When you select this option, PowerStation will globally multiply all motors and static loads of the selected Loading Category with the entered values for the motor and static load diversity factors. Note that a motor load-multiplying factor of 125% implies that the motor loads of all buses are increased by 25 percent above their nominal values. This value can be smaller or greater than 100 percent.
Charger Loading For chargers, you have the option to use the loading category load or the operating load. Note that the operating load for a charger can only be updated from a DC load flow study.
Initial Condition Initial conditions for all bus voltages and angles can be specified in this section for load flow calculation purposes.
Use Bus Voltages Select this option to use bus voltages and angles as entered in the Info page of the bus editors. Using this option you can simulate load flow studies with different initial conditions for bus voltage.
Use Fixed Values This option allows you to simulate load flow studies using a fixed bus voltage and angle for all buses. When you select the fixed initial condition option, you must enter the initial voltage value as the percent of the bus nominal voltage. The default values are 100% for bus voltage magnitude and zero degree for bus voltage angle.
Determination of Initial Bus Voltage Angle When transformer phase-shift is considered in the load flow calculation, the initial bus voltage angle should take it into account. Otherwise, very poor initial bus voltage angle may be used and will affect load flow convergence. To resolve this issue, ETAP load flow program calculates the bus voltage angle based on transformer phase-shift and compare the calculated value against the initial bus voltage angle from user selected option. If the difference between the two values is larger than MaxIniAngDiff, ETAP uses the calculated the values as the initial bus voltage angle, where MaxIniAngDiff is an ETAP.INI file
Operation Technology, Inc. 15-8 ETAP PowerStation 4.0
Load Flow Analysis Study Case Editor
entry defaulted at 10. According to the selection for the initial bus voltage and the Apply XFMR Phase-Shift field, there are four different situations: • When the Use Fixed Values is checked and the Apply XFMR Phase-Shift is also checked, the
calculated initial bus voltage angles are used in the load flow calculation. • When the Use Bus Voltages is checked and the Apply XFMR Phase-Shift is also checked, the initial
bus voltage angle from the Bus Editor is compared against the calculated bus voltage angle. If the difference is less than MaxIniAngDiff, the initial bus voltage angle from the Bus Editor is used; otherwise the calculated value is used in the load flow calculation.
• When the Use Fixed Values is checked and the Apply XFMR Phase-Shift is not checked, the initial voltage angle entered in the Load Flow Study Case is used in the load flow calculation. In this case, all the buses have the same initial voltage angle.
• When the Use Bus Voltages is checked and the Apply XFMR Phase-Shift is not checked, the initial bus voltage angles from the Bus Editor are used in the load flow calculation.
When the operating load is specified as the system load, the operating voltage angles are used as the initial value. In this case, if the Apply XFMR Phase-Shift is checked, the operating voltage angle is compared against the calculated bus voltage angle. If the difference is less than MaxIniAngDiff, the operating voltage angle is used; otherwise the calculated value is used in the load flow calculation.
Report
Equipment Cable Losses and Vd Select this option to report losses and voltage drop associated with equipment cables in the output report.
Bus Voltage Calculated bus voltages seen in the output report can be printed in kV or in percent of the bus nominal voltages. Select your preference by clicking on in Percent or in kV. For graphical display of bus voltages see Load Flow Display Options.
Update In this section, you can decide to update initial conditions of the buses and/or set the transformer taps to the calculated value of LTCs. The selected options will be updated after the subsequent load flow run.
Initial Bus Voltage Select this option to update the values of the bus voltage magnitudes with the result of this load flow run. Bus voltage update will result in a faster convergence of the subsequent load flow solutions since the initial bus voltages will be closer to the final values.
Inverter Operating Load In an AC load flow study, an inverter is represented as a constant voltage source. When this option is checked, the load provided by the inverter will be updated to the inverter element, which can be used later as DC load of the inverter in a DC load flow study.
Operating Load & V The option is available if your ETAP key has the online feature. When this box is checked, the calculation results will be updated to sources, loads, and buses, so that they can be utilized as input for later studies. These values are also displayed in element editors. If your ETAP key does not have the
Operation Technology, Inc. 15-9 ETAP PowerStation 4.0
Load Flow Analysis Study Case Editor
online feature, you can see the operating P, Q, and V in only element editors, and they cannot be used in a later study.
Transformer LTCs Select this option to update the transformer taps to reflect the result of load tap changer (LTC) settings, i.e., transformer taps will be set to values determined from the load flow solution for LTCs. This feature is useful when you want to consider the impedance of the LTC taps for short-circuit calculations.
Remarks 2nd Line You can enter up to 120 alphanumeric characters in this remarks box. Information entered in this location will be printed on the second line of every output page header line. These remarks can provide specific information for each study cases. Note that the first line of the header information is global for all study cases and is entered in the Project Information Editor.
15.2.2 Alert Page The Alert Page in the Load Flow Study Case Editor is used to specify the setup of all the Simulation Alerts provided to notify the user of an abnormal loading condition based on predetermined, “allowable”, percent values and system topology. The functional capability of the Simulation Alert System is to generate alerts when there is an overload in protective devices, buses, transformers, cables, reactors, generators, and utilities. The alerts are reported by the generation of different types of alerts, either graphically in the one-line diagram display or in the Alert View Window.
Operation Technology, Inc. 15-10 ETAP PowerStation 4.0
Load Flow Analysis Study Case Editor
Critical and Marginal Alerts There are two types of simulation alerts generated after a Load Flow study. The difference between Marginal and Critical Alerts is their use of different percent value conditions to determine if an alert should be generated. If a condition for a Critical alert is met, then an alert will be generated in the Alert View Window and the overloaded element will turn red in the one-line diagram. The same is true for Marginal Alerts, except that the overloaded component will be displayed in magenta color. Also, the Marginal Alerts check box must be selected if the user desires to display the Marginal Alerts. If a device alert qualifies it for both Critical and Marginal alerts, only Critical Alerts are displayed. It should be noted that in order for ETAP PowerStation to generate alerts for an element type, both the element rating and the percent value entered in this page must be non-zero. The element ratings for alert checking are given in the following sections.
Loading This set of value fields allows the user to enter the condition percent values of the monitored parameters used to determine if an alert should be reported based on loading conditions determined by a Load Flow calculation. The Load Flow Loading Alerts generate overload alerts.
Bus Alerts Bus loading alerts are determined from the values entered into the percent value input fields. The monitored parameter is the percent of rated continuous current flowing through the bus. If the continuous current calculated from a Load Flow study exceeds the specified percent values, then the program generates an alert.
Transformer Alerts Transformer Simulation Alerts generate an alert if the Critical or Marginal percent limit of maximum MVA rating is exceeded after a Load Flow calculation. If the calculated MVA is more than the percent of rated value specified in the Marginal or Critical percent fields, overload alerts are reported. The simulation alerts work for both two and three winding transformers.
Cable Cable Simulation Alerts monitor the rated loading limit for cables / line in percent of allowable ampacity, which is entered from the Ampacity Page of the Cable Editor. If the Load Flow calculated current percent flowing through the cable is greater than the Marginal or Critical percent limits, overload alerts are reported.
Reactor A reactor alert generates alerts if the program determines that the percent of rated continuous current is exceeded based on the Load Flow calculation results. These alerts are reported as overloads.
Generator / Utility The generator Loading Simulation Alert monitors the percent of rated MW. If the results from a Load Flow calculation indicate that the specified percent of rated MW is exceeded, then, the program reports an overload alert.
Operation Technology, Inc. 15-11 ETAP PowerStation 4.0
Load Flow Analysis Study Case Editor
Protective Devices Protective Device Simulation Alerts generate alerts when certain predetermined parameter value ratings are exceeded. The following table contains a list of the conditions used by the Alert Simulation Program to determine when to report an alert. Load Flow results are compared to the monitored parameters listed in the following table:
Protective Devices Monitored parameters in percent of
Condition reported
Low Voltage Circuit Breaker Continuous rated Current Overload High Voltage Circuit Breaker Continuous rated Current Overload
Fuses Rated Current Overload Contactors Continuous rated Current Overload
SPDT / SPST switches Continuous rated Current Overload Protective device alerts will generate alerts only if the monitored parameter rating is larger than zero.
Bus Voltage Alerts Bus Voltage Simulation Alerts generate alerts if the voltage magnitude percent results from the Load Flow calculation exceed or are below the specified nominal kV rating percent values. Bus Voltage Alerts report over voltage and under voltage alerts.
Generator / Utility Excitation Alerts Simulation Alerts for generator excitation, monitor the percent rated Mvar limits. An alert for Over Excitation is reported if the Upper Excitation percent limit (Qmax) for the generator is exceeded according to a Load Flow calculation. An alert for Under Excitation is reported if the generator Mvar result from the Load Flow calculation is below the specified Lower Excitation percent limit (Qmin).
Operation Technology, Inc. 15-12 ETAP PowerStation 4.0
Load Flow Analysis Display Options
15.3 Display Options
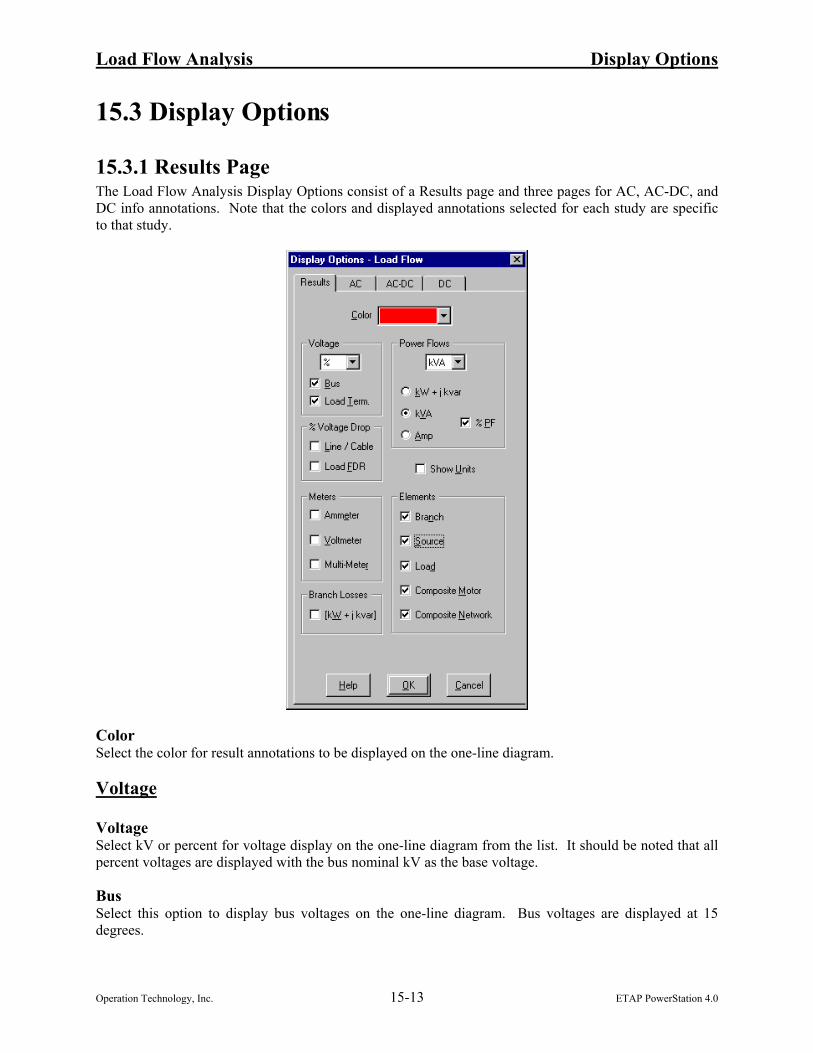
15.3.1 Results Page The Load Flow Analysis Display Options consist of a Results page and three pages for AC, AC-DC, and DC info annotations. Note that the colors and displayed annotations selected for each study are specific to that study.
Color Select the color for result annotations to be displayed on the one-line diagram.
Voltage
Voltage Select kV or percent for voltage display on the one-line diagram from the list. It should be noted that all percent voltages are displayed with the bus nominal kV as the base voltage.
Bus Select this option to display bus voltages on the one-line diagram. Bus voltages are displayed at 15 degrees.
Operation Technology, Inc. 15-13 ETAP PowerStation 4.0
Load Flow Analysis Display Options
Load Term Select this option to display load (motors and static loads) terminal voltages on the one-line diagram. Load terminal voltages are displayed at 15 degrees.
% Voltage Drop
Line / Cable Select this option to display line and cable voltage drops on the one-line diagram.
Load FDR Select a unit for power flow or current flow from the list to be displayed on the one-line diagram.
Power Flows Here you specify how the flows will be displayed.
Units Select the unit (kVA or MVA) to be used to display power flow on the one-line diagram.
kW + jkvar Select the kW + jkvar radio button to display power flow in kW+jkvar or MW+jMvar.
kVA Select the kVA radio button to display power flow in kVA or MVA.
Amp Select the Amp radio button to display current flow in amperes.
%PF When the Amp or kVA radio button is selected, you can check this box to show power factor of power flow along with the current.
Show Units Select this option to show units for power flow and current displayed on the one-line diagram.
Elements
Branch Select this option to display power flow through all branches on the one-line diagram. PowerStation displays the power flow at one end of a branch, i.e., the end that has a positive kW value flowing into the branch. For three-winding transformers, all three power flows are displayed.
Gen./Motor/Load Select this option to display power flow for generators, motors, MOVs, capacitors, lumped loads, and static loads on the one-line diagram.
Composite Motor Select this option to display power flow into composite motors.
Operation Technology, Inc. 15-14 ETAP PowerStation 4.0
Load Flow Analysis Display Options
Composite Network Select the check box to display power flow into composite networks.
Branch Losses Select this option to display branch losses on the one-line diagram. Losses are displayed inside a bracket in [kW+jkvar] or [MW+jMvar].
Meters
Ammeter Check this option to display primary current for the branch to which an ammeter is attached.
Voltmeter Check this option to display primary voltage for the bus to which a voltmeter is attached.
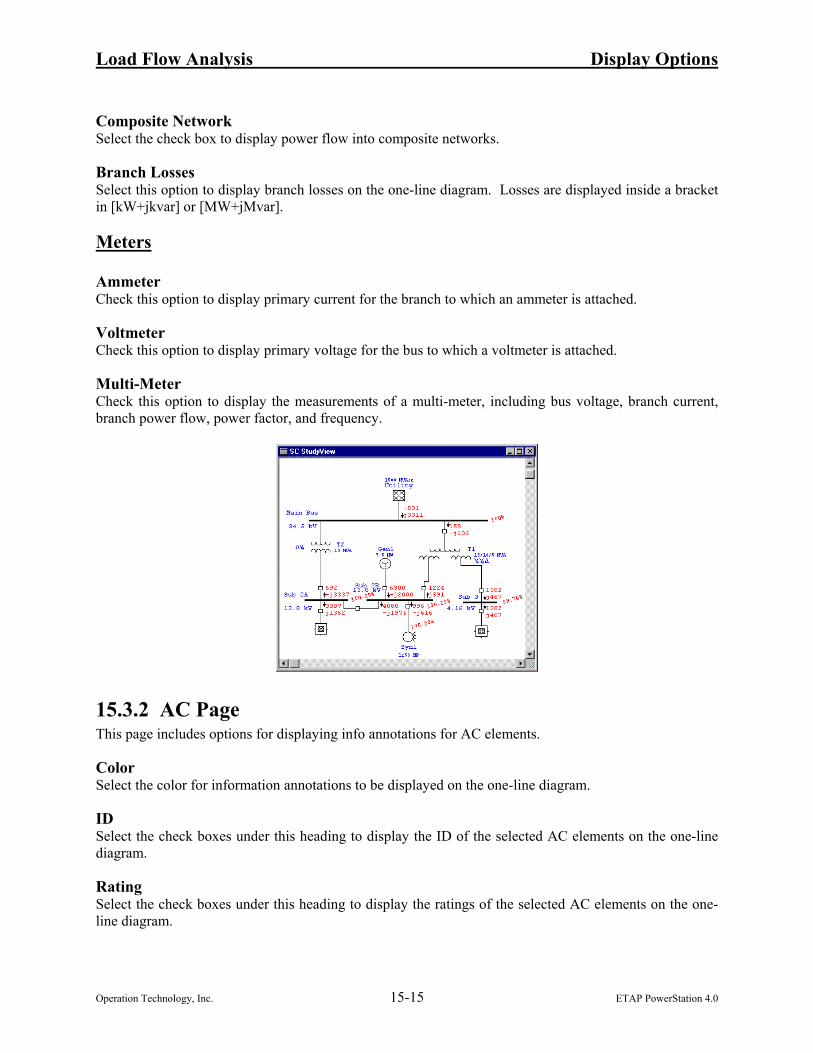
Multi-Meter Check this option to display the measurements of a multi-meter, including bus voltage, branch current, branch power flow, power factor, and frequency.
15.3.2 AC Page This page includes options for displaying info annotations for AC elements.
Color Select the color for information annotations to be displayed on the one-line diagram.
ID Select the check boxes under this heading to display the ID of the selected AC elements on the one-line diagram.
Rating Select the check boxes under this heading to display the ratings of the selected AC elements on the one-line diagram.
Operation Technology, Inc. 15-15 ETAP PowerStation 4.0
Load Flow Analysis Display Options
Device Type Rating Generator kW / MW Power Grid (Utility) MVAsc Motor HP / kW Load kVA / MVA Panel Connection Type (# Phases - # Wires) Transformer kVA / MVA Branch, Impedance Base MVA Branch, Reactor Continuous Amps Cable / Line # of Cables - # of Conductor / Cable - Size Bus kA Bracing Node Bus Bracing (kA) CB Rated Interrupting (kA) Fuse Interrupting (ka) Relay 50/51 for Overcurrent Relays PT & CT Transformer Rated Turn Ratio
kV Select the check boxes under this heading to display the rated or nominal voltages of the selected elements on the one-line diagram. For cables/lines, the kV check box is replaced by the button. Click on this button to display the cable/line conductor type on the one-line diagram.
A Select the check boxes under this heading to display the ampere ratings (continuous or full-load ampere) of the selected elements on the one-line diagram. For cables/lines, the Amp check box is replaced by the button. Click on this button to display the cable/line length on the one-line diagram.
Z Select the check boxes under this heading to display the rated impedance of the selected AC elements on the one-line diagram.
Device Type Impedance Generator Subtransient reactance Xd” Power Grid (Utility) Positive Sequence Impedance in % of 100 MVA (R + j X) Motor % LRC Transformer Positive Sequence Impedance (R + j X per unit length) Branch, Impedance Impedance in ohms or % Branch, Reactor Impedance in ohms Cable / Line Positive Sequence Impedance (R + j X in ohms or per unit length)
D-Y Select the check boxes under this heading to display the connection types of the selected elements on the one-line diagram. For transformers, the operating tap setting for primary, secondary, and tertiary windings are also displayed. The operating tap setting consists of the fixed taps plus the tap position of the LTC.
Operation Technology, Inc. 15-16 ETAP PowerStation 4.0
Load Flow Analysis Display Options
Composite Motor Click on this check box to display the AC composite motor IDs on the one-line diagram, then select the color in which the IDs will be displayed.
Use Default Options Click on this check box to use PowerStation’s default display options.
15.3.3 AC-DC Page This page includes options for displaying info annotations for AC-DC elements and composite networks.
Color Select the color for information annotations to be displayed on the one-line diagram.
ID Select the check boxes under this heading to display the IDs of the selected AC-DC elements on the one-line diagram.
Rating Select the check boxes under this heading to display the ratings of the selected AC-DC elements on the one-line diagram.
Device Type Rating Charger AC kVA & DC kW (or MVA / MW) Inverter DC kW & AC kVA (or MW / MVA) UPS kVA VFD HP / kW
kV Click on the check boxes under this heading to display the rated or nominal voltages of the selected elements on the one-line diagram.
A Click on the check boxes under this heading to display the ampere ratings of the selected elements on the one-line diagram.
Device Type Amp Charger AC FLA & DC FLA Inverter DC FLA & AC FLA UPS Input, output, & DC FLA
Composite Network Click on this check box to display the composite network IDs on the one-line diagram, then select the color in which the IDs will be displayed.
Use Default Options Click on this check box to use PowerStation’s default display options.
Operation Technology, Inc. 15-17 ETAP PowerStation 4.0
Load Flow Analysis Display Options
15.3.5 DC Page This page includes options for displaying info annotations for DC elements.
Color Select the color for information annotations to be displayed on the one-line diagram.
ID Select the check boxes under this heading to display the IDs of the selected DC elements on the one-line diagram.
Rating Select the check boxes under this heading to display the ratings of the selected DC elements on the one-line diagram.
Device Type Rating Battery Ampere Hour Motor HP / kW Load kW / MW Elementary Diagram kW / MW Converter kW / MW Cable # of Cables - # of Conductor / Cable - Size
kV Select the check boxes under this heading to display the rated or nominal voltages of the selected elements on the one-line diagram. For cables, the kV check box is replaced by the button. Click on this button to display the conductor type on the one-line diagram.
A Select the check boxes under this heading to display the ampere ratings of the selected elements on the one-line diagram. For cables, the Amp check box is replaced by the button. Click on this button to display the cable length (one way) on the one-line diagram.
Z Select the check boxes under this heading to display the impedance values of the cables and impedance branches on the one-line diagram.
Composite Motor Click on this check box to display the DC composite motor IDs on the one-line diagram, then select the color in which the IDs will be displayed.
Use Default Options Click on this check box to use PowerStation’s default display options.
Operation Technology, Inc. 15-18 ETAP PowerStation 4.0
Load Flow Analysis Calculation Methods
15.4 Calculation Methods PowerStation provides three load flow calculation methods: Newton-Raphson, Fast-Decoupled, and Accelerated Gauss-Seidel. They possess different convergent characteristics, and sometimes one is more favorable in terms of achieving the best performance. You can select any one of them depending on your system configuration, generation, loading condition, and the initial bus voltages.
Newton-Raphson Method The Newton-Raphson method formulates and solves iteratively the following load flow equation:
∆∆
∆∆
PQ
J JJ J V
=
1 2
3 4
δ
where ∆P and ∆Q are bus real power and reactive power mismatch vectors between specified value and calculated value, respectively; ∆V and ∆δ represents bus voltage angle and magnitude vectors in an incremental form; and J1 through J4 are called Jacobian matrices. The Newton-Raphson method possesses a unique quadratic convergence characteristic. It usually has a very fast convergence speed compared to other load flow calculation methods. It also has the advantage that the convergence criteria are specified to ensure convergence for bus real power and reactive power mismatches. This criteria gives you direct control of the accuracy you want to specify for the load flow solution. The convergence criteria for the Newton-Raphson method are typically set to 0.001 MW and Mvar. The Newton-Raphson method is highly dependent on the bus voltage initial values. A careful selection of bus voltage initial values is strongly recommended. Before running load flow using the Newton-Raphson method, PowerStation makes a few Gauss-Seidel iterations to establish a set of sound initial values for the bus voltages. The Newton-Raphson method is recommended for use with any system as a first choice.
Fast-Decoupled Method The Fast-decoupled method is derived from the Newton-Raphson method. It takes the fact that a small change in the magnitude of bus voltage does not vary the real power at the bus appreciably, and likewise, for a small change in the phase angle of the bus voltage, the reactive power does not change appreciably. Thus the load flow equation from the Newton-Raphson method can be simplified into two separate decoupled sets of load flow equations, which can be solved iteratively:
[ ] [ ][ ][ ] [ ][ ]∆ ∆
∆ ∆
P J
Q J V
=
=1
4
δ
The Fast-decoupled method reduces computer memory storage by approximately half, compared to the Newton-Raphson method. It also solves the load flow equations using significantly less computer time than that required by the Newton-Raphson method, since the Jacobian matrices are constant. As with the Newton-Raphson method, convergence criteria of the Fast-decoupled method is based on real power and reactive power mismatches, which are typically set to 0.001 in the order of MW and Mvar.
Operation Technology, Inc. 15-19 ETAP PowerStation 4.0
Load Flow Analysis Calculation Methods
Although for a fixed number of iterations it is not as accurate as the Newton-Raphson method, the savings in computer time and the more favorable convergence criteria makes for a very good overall performance. In general, the Fast-decoupled method can be used as an alternative to the Newton-Raphson method, and it should definitely be given a try if the Newton-Raphson method has failed when dealing with long radial systems or systems that have long transmission lines or cables.
Accelerated Gauss-Seidel Method From the system nodal voltage equation
[ ] [ ][ ]I Y VBUS=
the Accelerated Gauss-Seidel method derives the following load flow equation and solves it iteratively:
[ ] [ ][ ][ ]P jQ V Y VTBUS+ = * *
where ∆P and ∆Q are specified bus real and reactive power vectors, ∆V is the bus voltage vector, and YBUS is the system admittance matrix. The Accelerated Gauss-Seidel method has relatively lower requirements of the bus initial voltage values compared to the Newton-Raphson method and the Fast-decoupled method. Instead of using bus real power and reactive power mismatch as convergence criteria, the Accelerated Gauss-Seidel method checks bus voltage magnitude tolerance between two consecutive iterations to control the solution precision. The typical value for bus voltage magnitude precision is set to 0.000001 pu. The Accelerated Gauss-Seidel method has slower convergence speed. When you apply appropriate acceleration factors, a significant increase in the rate of convergence can be obtained. The range for the acceleration factor is between 1.2 and 1.7, and is typically set to 1.45.
Load Flow Convergence As in any iterative solution method, the convergence of the load flow solution is affected by a number of factors specific to power systems.
Negative Impedance Negative resistance and reactance should be avoided. As an example, the traditional method of modeling three-winding transformers by a Y equivalent model, using one impedance and two two-winding transformers, sometimes results in a negative impedance value for one of the impedance branches. In this case, the negative impedance should be combined with other series circuit elements so that the result is a positive impedance value. Load flow calculations may not converge if a large value of negative impedance is used. PowerStation can now model three-winding transformers directly with no need for the user to do any conversions.
Zero or Very Small Impedance A zero or very small impedance value of any branch is not allowed, since this will result in infinity or a huge number in the system admittance matrix. You should represent this type of impedance by a tie circuit breaker to solve the problem.
Operation Technology, Inc. 15-20 ETAP PowerStation 4.0
Load Flow Analysis Calculation Methods
Widely Different Branch Impedance Values Widely different branch impedance values on the same per unit base may result in a slow convergence. To avoid this situation, various techniques, such as combining series branches with low impedance values, ignoring short length transmission lines and/or cables, or modeling a small impedance branch with tie circuit breakers, can be employed.
Long Radial System Configurations Long radial system configurations usually take a longer time to converge than loop configurations. In general, the Fast-decoupled method works faster than the Newton-Raphson or the Accelerated Gauss-Seidel method for radial system.
Bad Bus Voltage Initial Values Solution convergence speed and computing time are functions of the initial voltages for load-type buses. The closer the initial voltages are to their final profile, the faster the solution converges. The solution may not converge if the initial voltages are too far from the final profile, thus it is recommended that the Update Bus Voltage option be used to obtain a set of sound initial bus voltages.
Modeling of AC-DC Converters In a load flow study, chargers and UPSs are represented as constant kVA loads connected to their AC input bus. An inverter is represented as a swing machine, which can maintain its terminal bus angle and voltage magnitude constant. If you have more than one inverters connected to a bus, they will equally share the load. Variable frequency drives are not considered in the load flow study. The load behind a variable frequency drive is directly added to its terminal bus.
Different Factors Considered in Load Calculation PowerStation provides users with great flexibility in modeling load variations through different load factors, such as demand factor, load percent, service factor, and application factor, etc. Depending on user specifications, these factors are used differently in calculating loads under several circumstances: • Load Editor – Calculation of load for loading categories and voltage drop • Input for Studies – Calculation of load specification for load flow and initial load for motor starting
and transient stability studies • Studies Results – Calculation of load displayed in one-line diagram from load flow, motor starting,
and transient stability studies • Bus Editor – Sum of load connected to a bus
Operation Technology, Inc. 15-21 ETAP PowerStation 4.0
Load Flow Analysis Calculation Methods
The following two tables describe how these factors are used in these cases:
Factors Used for Motor Load Calculation Load Editor Input to Studies Results from Studies
Load Loss Vd Load Loss Load Loss Vd Bus
Editor
Bus Nominal kV x x x x x x x x
Bus Operating V x x x x x
Demand Factor x x x x x x x x x
Loading % x x x x x x x x x
Service Factor *
App. Factor *
Load Quantity x x x x x x x
Bus Diversity Factor * * * * *
Global Diversity Factor * * * * *
Factors Used for Static Load Calculation
Load Editor Input to Studies Results from Studies Load Loss Vd Load Loss Load Loss Vd
Bus Editor
Bus Nominal kV x x x x x x x x x
Bus Operating V x x x x
Demand Factor x x x x x x x x x
Loading % x x x x x x x x x
App. Factor *
Load Quantity x x x x x x x
Bus Diversity Factor * * * * *
Global Diversity Factor * * * * * * Indicates the factor is used in calculation if specified by the user in the related load editor or study case. Notes: • Motor load includes induction motor and generator, synchronous motor, MOV, and motor load
portion of lumped load. • Static load includes static load, capacitor, and static load portion of lumped load
Operation Technology, Inc. 15-22 ETAP PowerStation 4.0
Load Flow Analysis Required Data
15.5 Required Data Bus Data Required data for load flow calculations for buses includes: • Nominal kV • %V and Angle (when Initial Condition is set to use Use Bus Voltages) • Load Diversity Factor (when the Loading option is set to use Diversity Factor)
Branch Data Branch data is entered into the Branch Editors, i.e., Transformer, Transmission Line, Cable, Reactor, and Impedance Editors. Required data for load flow calculations for branches includes: • Branch Z, R, X, or X/R values and units, tolerance, and temperature, if applicable • Cable and transmission line, length, and unit • Transformer rated kV and kVA/MVA, tap, and LTC settings • Impedance base kV and base kVA/MVA
Power Grid Data Required data for load flow calculations for power grids includes: • Operating mode (Swing, Voltage Control, or Mvar Control) • Nominal kV • %V and Angle for swing mode • %V, MW loading, and Mvar limits (Qmax & Qmin) for voltage control mode of operation • MW and Mvar loading for Mvar control mode
Synchronous Generator Data Required data for load flow calculations for synchronous generators includes: • Operating mode (Swing, Voltage Control or Mvar Control) • Rated kV • %V and Angle for swing mode of operation • %V, MW loading, and Mvar limits (Qmax & Qmin) for Voltage Control mode of operation • MW and Mvar loading for Mvar control mode of operation
Inverter Data Required data for load flow calculations for inverters includes: • Inverter ID • DC and AC rating data • AC output voltage regulating data
Operation Technology, Inc. 15-23 ETAP PowerStation 4.0
Load Flow Analysis Required Data
Synchronous Motor Data Required data for load flow calculations for synchronous motors includes: • Rated kW/hp and kV • Power factors and efficiencies at 100%, 75%, and 50% loadings • Loading Category ID and % Loading • Equipment cable data
Induction Motor Data Required data for load flow calculations for induction motors includes: • Rated kW/hp and kV • Power factors and efficiencies at 100%, 75%, and 50% loadings • Loading Category ID and % Loading • Equipment cable data
Static Load Data Required data for load flow calculations for static loads includes: • Static Load ID • Rated kVA/MVA and kV • Power factor • Loading Category ID and % Loading • Equipment cable data
Capacitor Data Required data for load flow calculations for static loads includes: • Capacitor ID • Rated kV, kvar/bank, and number of banks • Loading category ID and % Loading • Equipment cable data
Lumped Load Data Required data for load flow calculations for static loads includes: • Load ID • Rated kV, MVA, power factor, and % motor load • Loading category ID and % Loading
Charger & UPS Data Required data for load flow calculations for chargers and UPSs includes: • Element ID • Rated AC kV, MVA, and power factor, as well as DC rating data • Loading category ID and % Loading
Operation Technology, Inc. 15-24 ETAP PowerStation 4.0
Load Flow Analysis Required Data
Other Data There are some study case related data, which must also be provided. This includes: • Method (Newton-Raphson, Fast-decoupled, or Accelerated Gauss-Seidel) • Max Iteration • Precision • Acceleration Factor (when Accelerated Gauss-Seidel method is selected) • Loading Category • Initial Condition • Report (report format) • Update (for bus voltages and transformer LTCs using load flow result) The study case related data is entered into the Load Flow Study Case Editor.
Operation Technology, Inc. 15-25 ETAP PowerStation 4.0
Load Flow Analysis Output Reports
15.6 Output Reports The load flow calculation results are reported both on the one-line diagram and in the Crystal Reports format. The graphical one-line diagram displays the calculated bus voltages, branch flows and voltage drops, load power consumption, etc. You can use the Display Options Editor to specify the content to be displayed. It also flags abnormal operating conditions, such as overloaded cables and over- or undervoltage buses, in different colors. The Crystal Reports format provides you with detailed information for a load flow analysis. You can utilize the Load Flow Report Manager to help you view the output report.
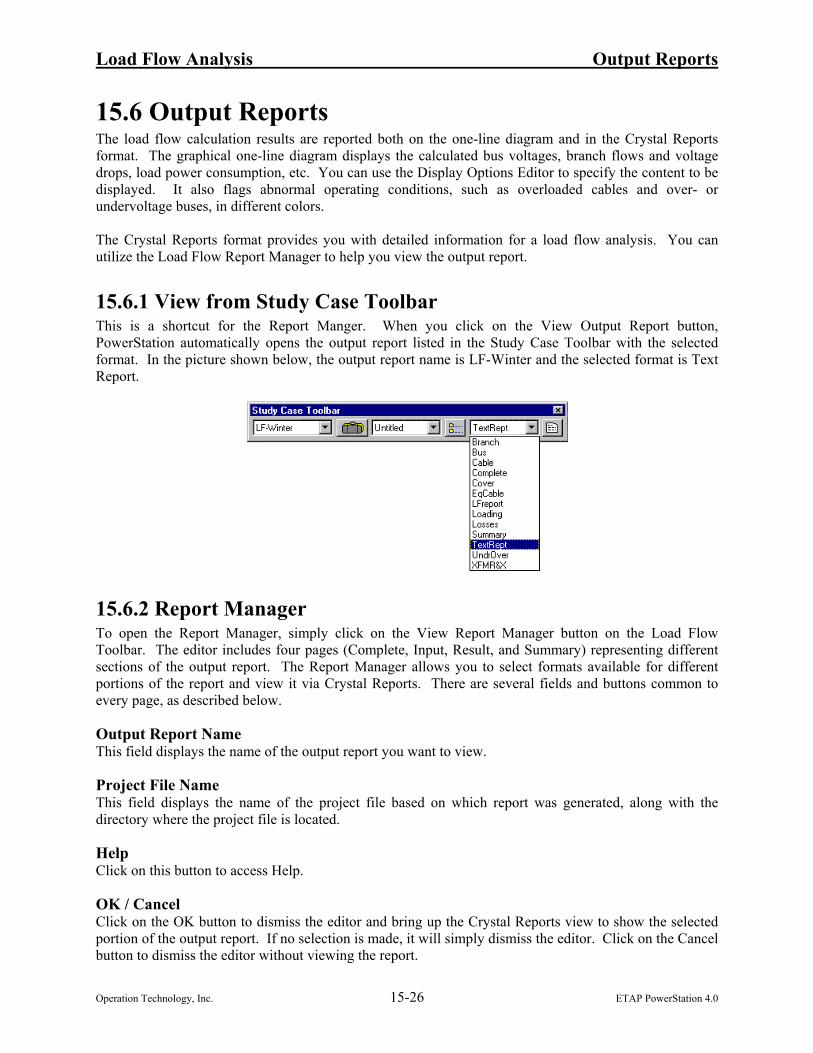
15.6.1 View from Study Case Toolbar This is a shortcut for the Report Manger. When you click on the View Output Report button, PowerStation automatically opens the output report listed in the Study Case Toolbar with the selected format. In the picture shown below, the output report name is LF-Winter and the selected format is Text Report.
15.6.2 Report Manager To open the Report Manager, simply click on the View Report Manager button on the Load Flow Toolbar. The editor includes four pages (Complete, Input, Result, and Summary) representing different sections of the output report. The Report Manager allows you to select formats available for different portions of the report and view it via Crystal Reports. There are several fields and buttons common to every page, as described below.
Output Report Name This field displays the name of the output report you want to view.
Project File Name This field displays the name of the project file based on which report was generated, along with the directory where the project file is located.
Help Click on this button to access Help.
OK / Cancel Click on the OK button to dismiss the editor and bring up the Crystal Reports view to show the selected portion of the output report. If no selection is made, it will simply dismiss the editor. Click on the Cancel button to dismiss the editor without viewing the report.
Operation Technology, Inc. 15-26 ETAP PowerStation 4.0
Load Flow Analysis Output Reports
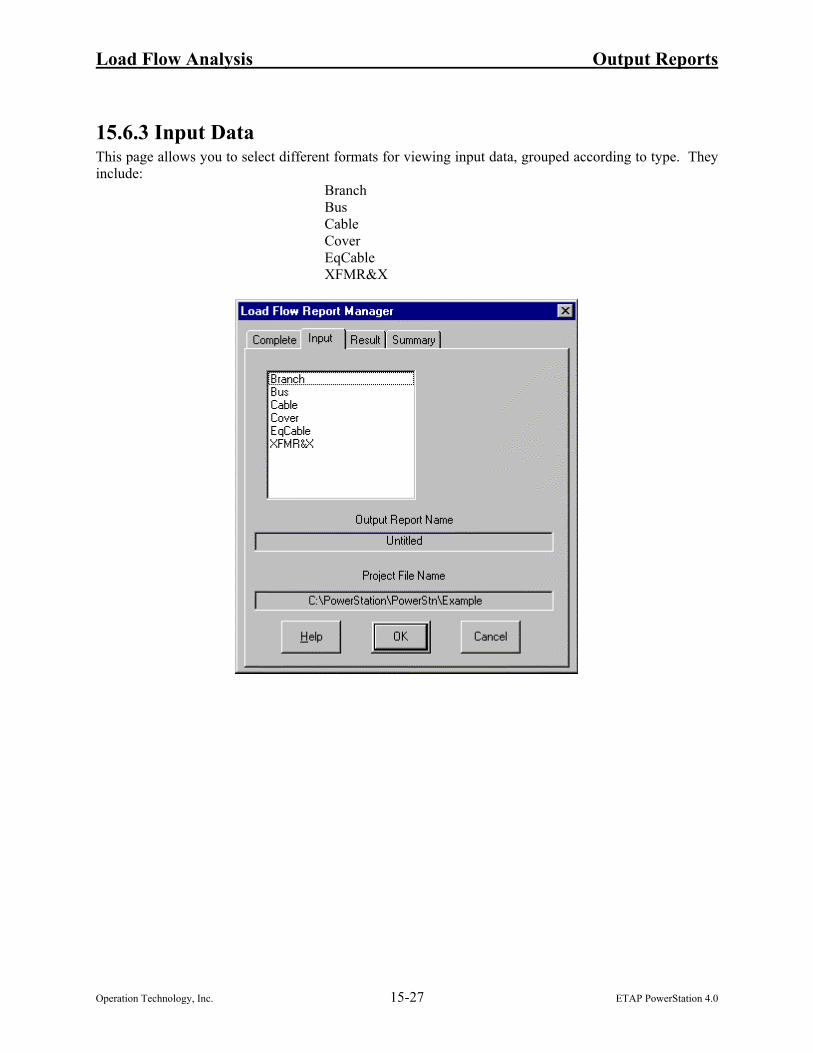
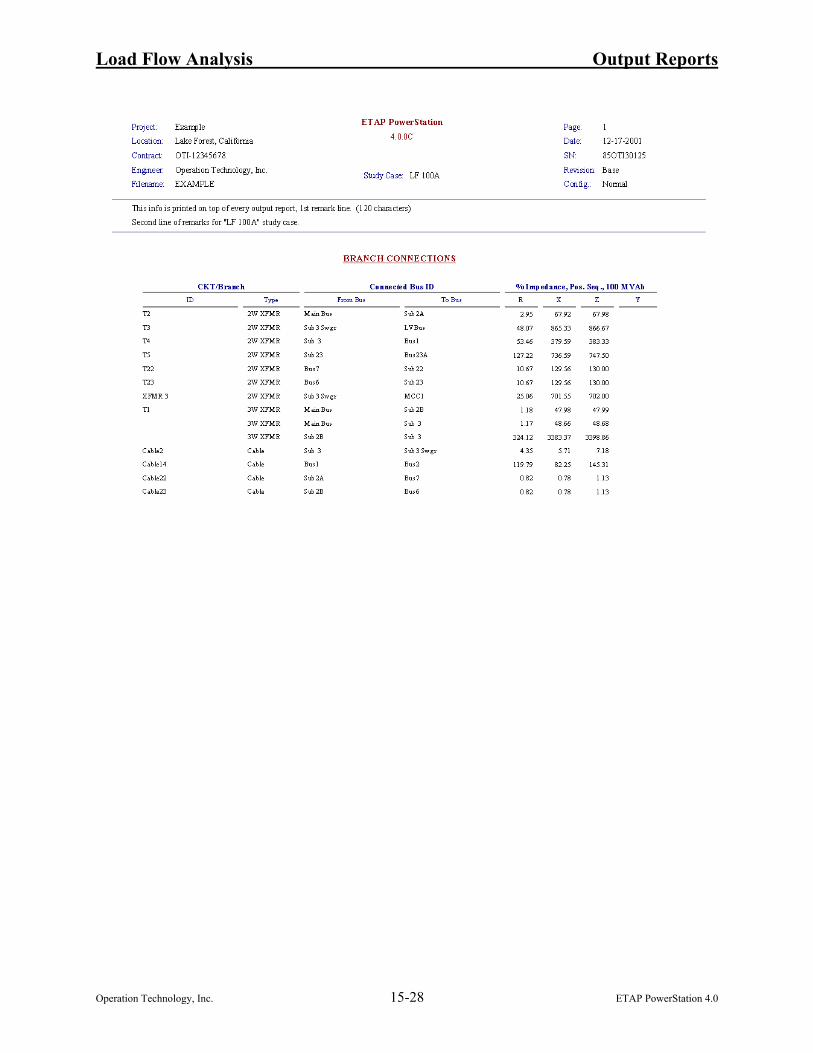
15.6.3 Input Data This page allows you to select different formats for viewing input data, grouped according to type. They include:
Branch Bus Cable Cover EqCable XFMR&X
Operation Technology, Inc. 15-27 ETAP PowerStation 4.0
Load Flow Analysis Output Reports
Operation Technology, Inc. 15-28 ETAP PowerStation 4.0
Load Flow Analysis Output Reports
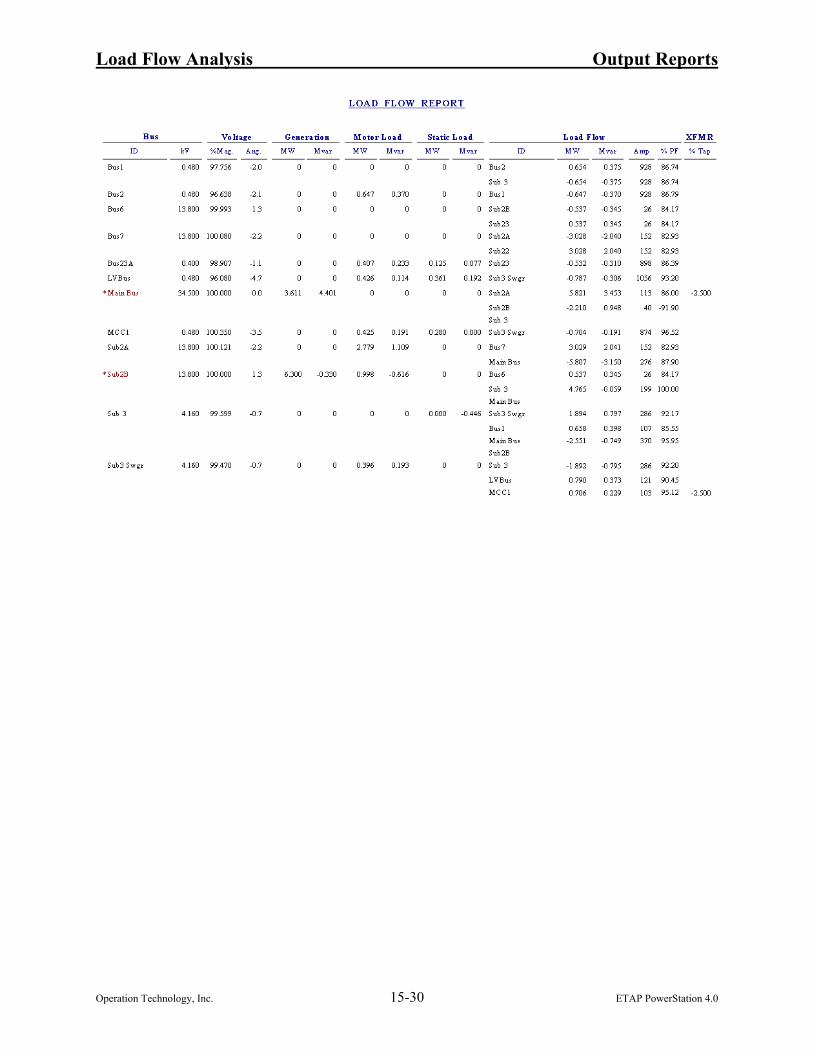
15.6.4 Results This page allows you to select formats to view the load flow result portion of the output report.
Operation Technology, Inc. 15-29 ETAP PowerStation 4.0
Load Flow Analysis Output Reports
Operation Technology, Inc. 15-30 ETAP PowerStation 4.0
Load Flow Analysis Output Reports
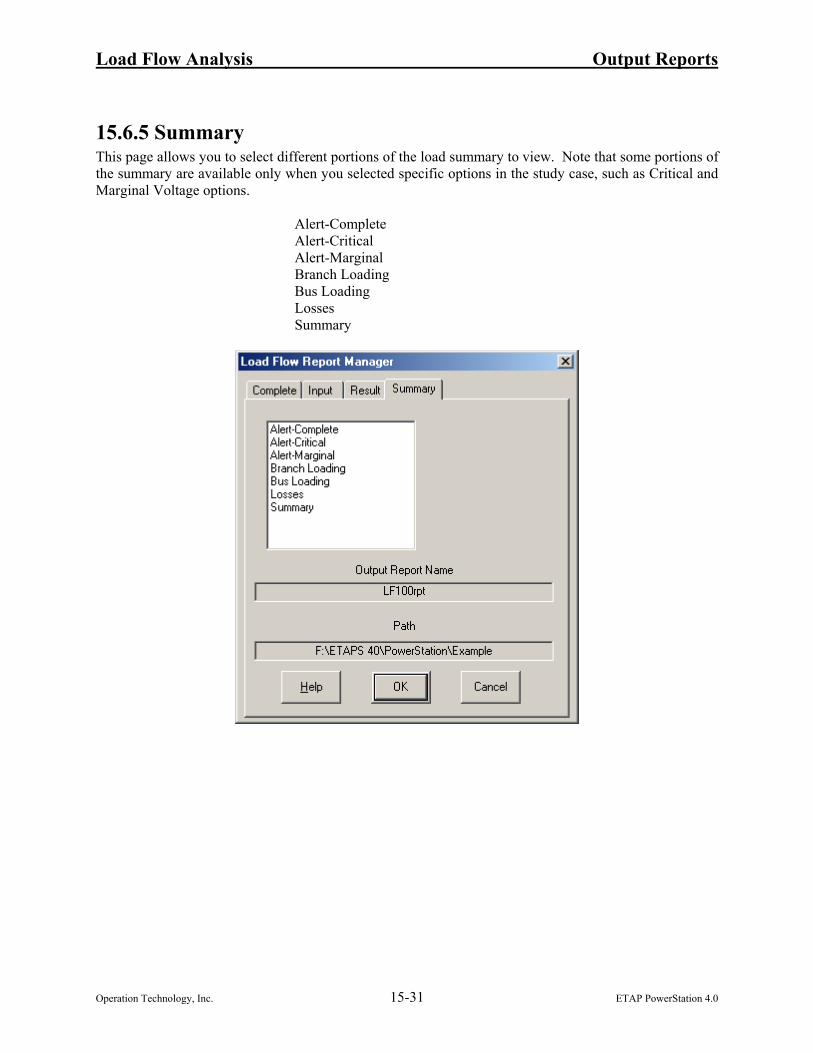
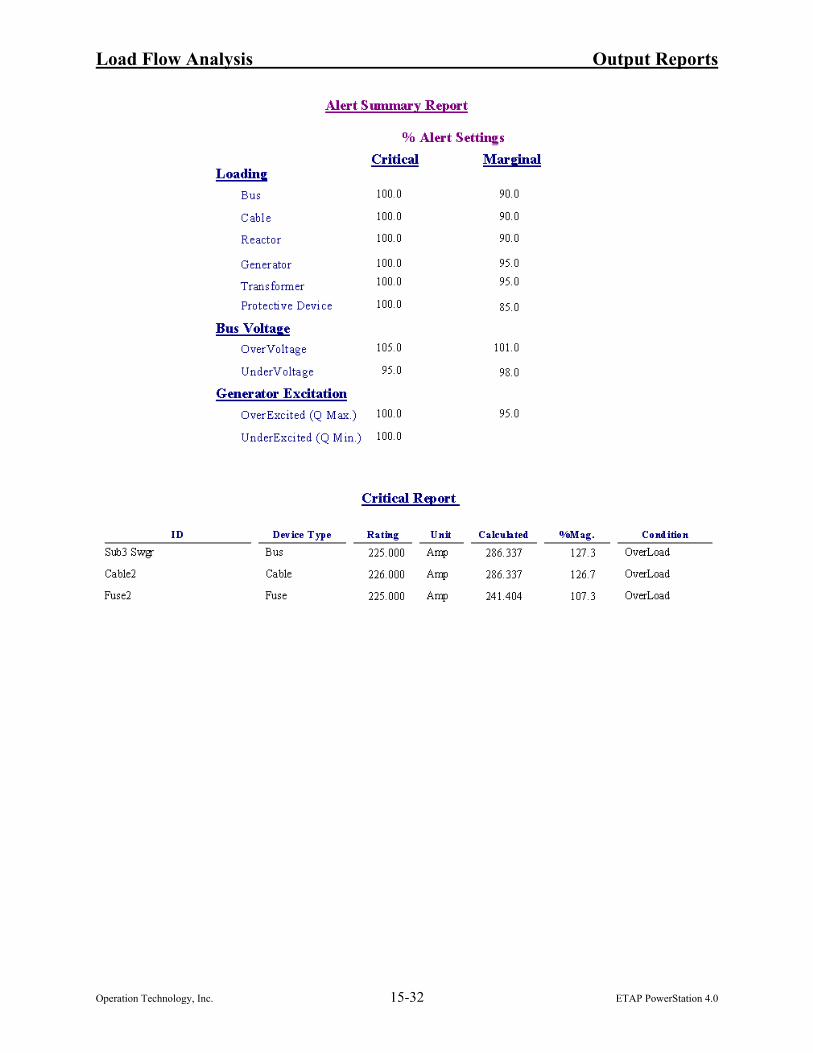
15.6.5 Summary This page allows you to select different portions of the load summary to view. Note that some portions of the summary are available only when you selected specific options in the study case, such as Critical and Marginal Voltage options.
Alert-Complete Alert-Critical Alert-Marginal Branch Loading Bus Loading Losses Summary
Operation Technology, Inc. 15-31 ETAP PowerStation 4.0
Load Flow Analysis Output Reports
Operation Technology, Inc. 15-32 ETAP PowerStation 4.0
Load Flow Analysis Output Reports
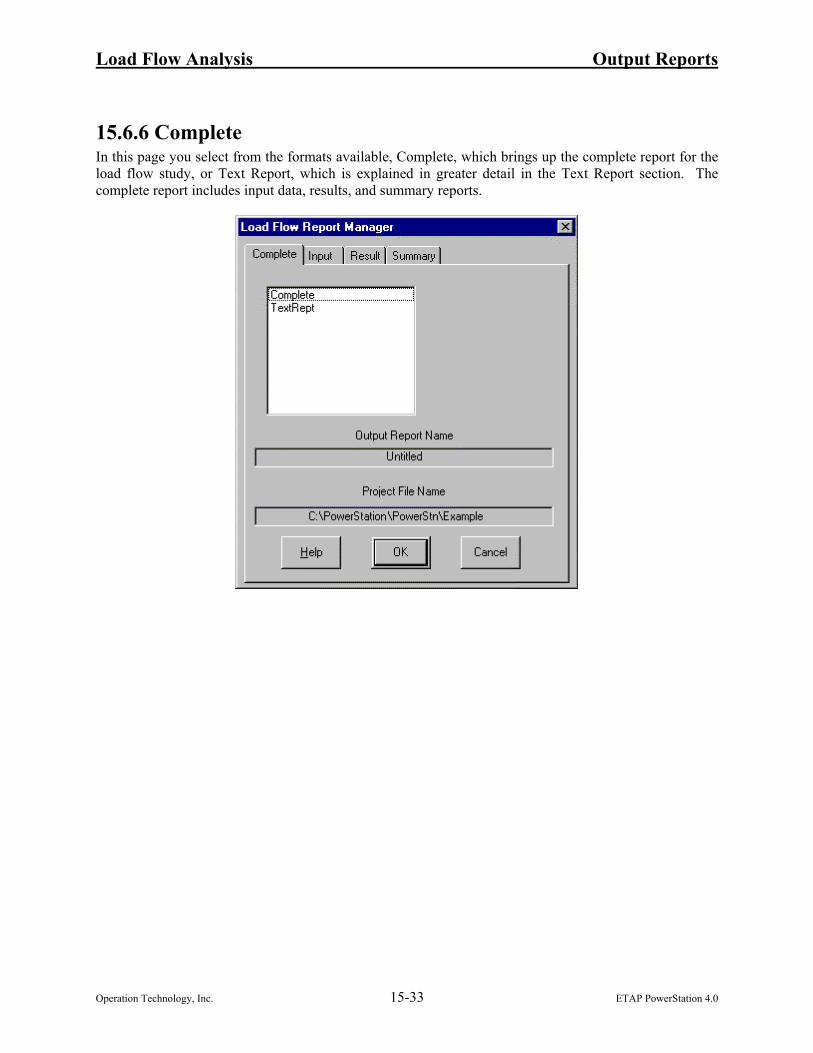
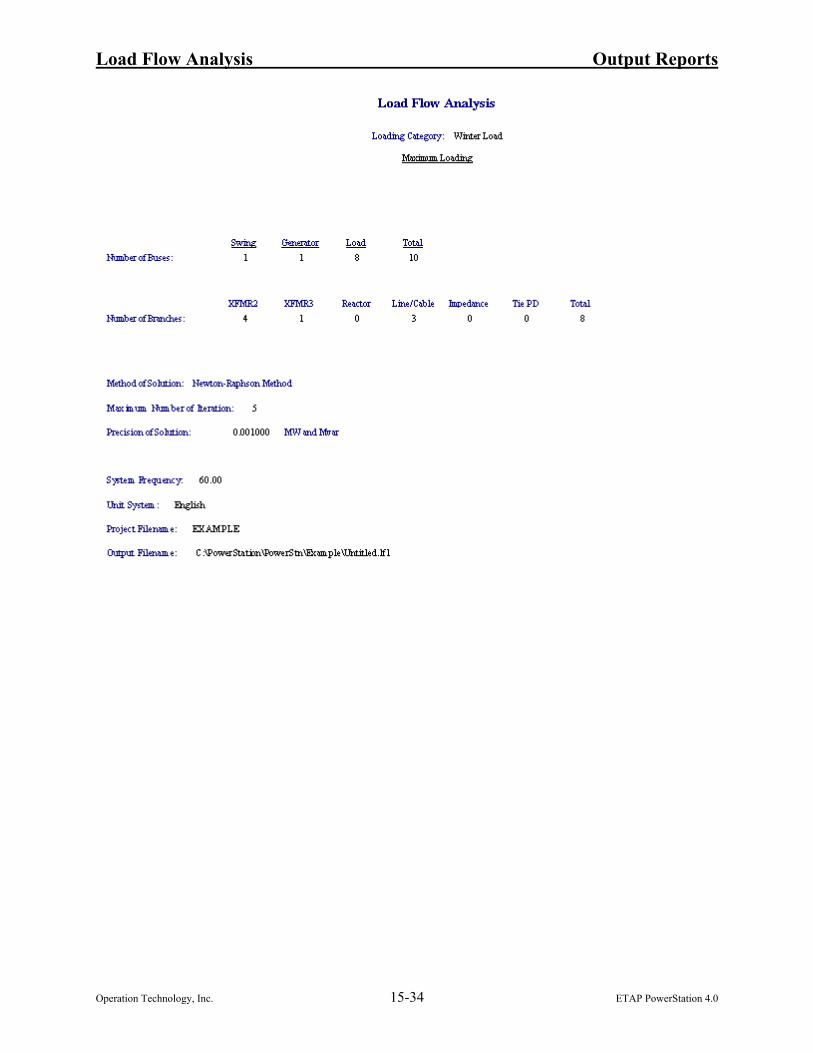
15.6.6 Complete In this page you select from the formats available, Complete, which brings up the complete report for the load flow study, or Text Report, which is explained in greater detail in the Text Report section. The complete report includes input data, results, and summary reports.
Operation Technology, Inc. 15-33 ETAP PowerStation 4.0
Load Flow Analysis Output Reports
Operation Technology, Inc. 15-34 ETAP PowerStation 4.0
Load Flow Analysis Output Reports
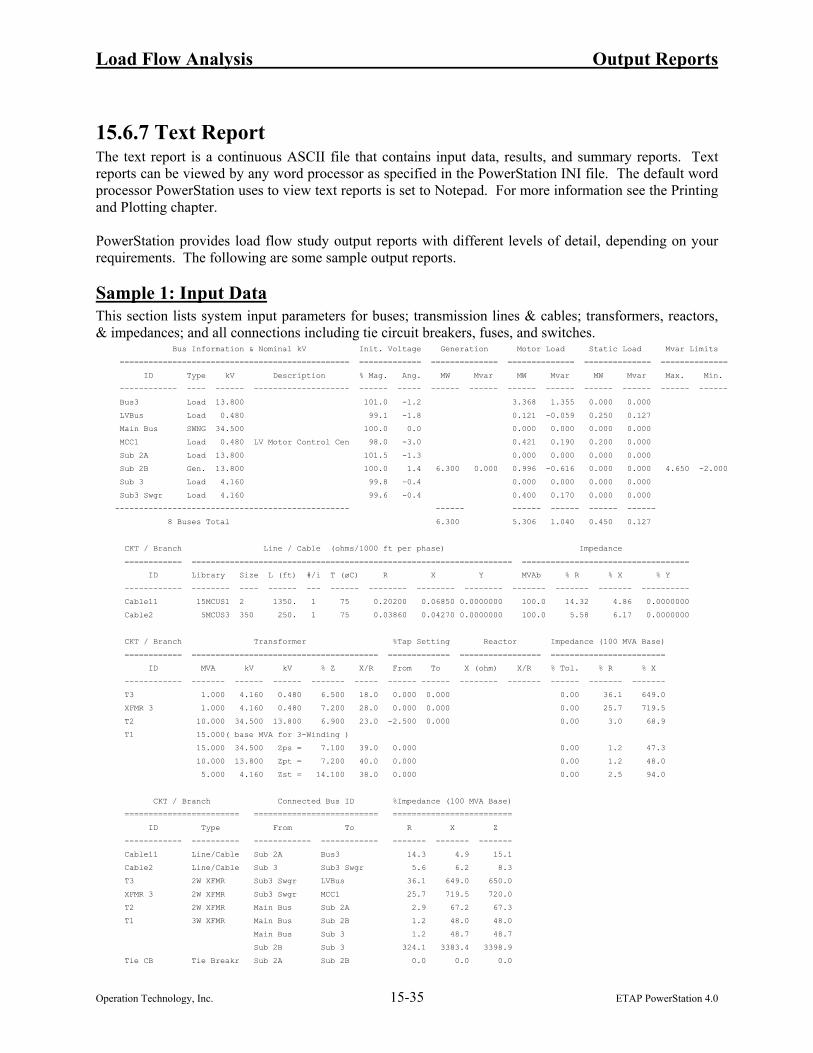
15.6.7 Text Report The text report is a continuous ASCII file that contains input data, results, and summary reports. Text reports can be viewed by any word processor as specified in the PowerStation INI file. The default word processor PowerStation uses to view text reports is set to Notepad. For more information see the Printing and Plotting chapter. PowerStation provides load flow study output reports with different levels of detail, depending on your requirements. The following are some sample output reports.
Sample 1: Input Data This section lists system input parameters for buses; transmission lines & cables; transformers, reactors, & impedances; and all connections including tie circuit breakers, fuses, and switches. Bus Information & Nominal kV Init. Voltage Generation Motor Load Static Load Mvar Limits
Operation Technology, Inc. 15-35 ETAP PowerStation 4.0
Load Flow Analysis Output Reports
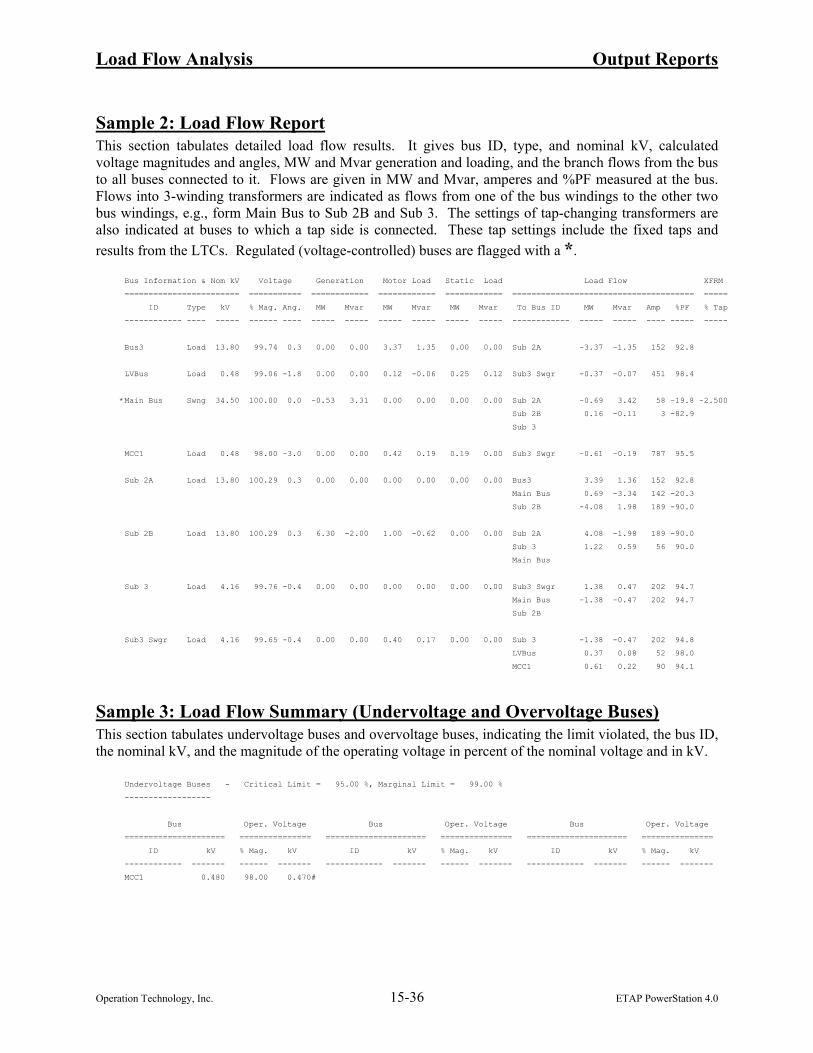
Sample 2: Load Flow Report This section tabulates detailed load flow results. It gives bus ID, type, and nominal kV, calculated voltage magnitudes and angles, MW and Mvar generation and loading, and the branch flows from the bus to all buses connected to it. Flows are given in MW and Mvar, amperes and %PF measured at the bus. Flows into 3-winding transformers are indicated as flows from one of the bus windings to the other two bus windings, e.g., form Main Bus to Sub 2B and Sub 3. The settings of tap-changing transformers are also indicated at buses to which a tap side is connected. These tap settings include the fixed taps and results from the LTCs. Regulated (voltage-controlled) buses are flagged with a *.
Bus Information & Nom kV Voltage Generation Motor Load Static Load Load Flow XFRM
Sample 3: Load Flow Summary (Undervoltage and Overvoltage Buses) This section tabulates undervoltage buses and overvoltage buses, indicating the limit violated, the bus ID, the nominal kV, and the magnitude of the operating voltage in percent of the nominal voltage and in kV. Undervoltage Buses - Critical Limit = 95.00 %, Marginal Limit = 99.00 %
------------------
Bus Oper. Voltage Bus Oper. Voltage Bus Oper. Voltage
Note: * indicates bus voltages violate critical limit.
# indicates bus voltages violate marginal limit.
Sample 4: Load Flow Summary (Branch Loading) This section identifies branches by giving their IDs, and then indicating the allowable ampacity, loading current and percent loading for cables, maximum MVA capability, loading MVA, and percent loading of transformers. Overload cables and transformers are flagged. Branch Loading Summary Report
Sample 5: Load Flow Summary (Branch Losses) This section indicates the branch ID, connected bus IDs, MW, and Mvar flows into each side of the branch, kW and kvar losses, percentage voltage, and voltage drop for each branch. Losses are calculated by adding the From-To and To-From bus flows for each branch. Voltage drops, in magnitude, are calculated by obtaining the difference between the From and To bus voltages. The last column of the Branch Losses Summary Report sets forth voltage drops across the branches due to different phase angles.
Branch Losses Summary Report
----------------------------
CKT / Branch Connected Bus Info. From-To Bus Flow To-From Bus Flow Losses % Bus Voltage Vd
============ ========================= ================== ================== ================= ============= % drop
ID From Bus ID To Bus ID MW Mvar MW Mvar kW kvar From To in Vmag
T1 Sub3 Swgr Sub 3 (3 winding transformer) 0.5 18.7
Sub 2A
-------- --------
25.7 146.0
Operation Technology, Inc. 15-37 ETAP PowerStation 4.0
Load Flow Analysis Output Reports
Sample 6: Load Flow Summary (Generation, Loading, and Demand) This section summarizes the total generation, loading, and demand, which give totals of MW, Mvar, MVA, and %PF for the swing bus(es), generators, total demand, and motor loads. MW and Mvar totals are also given for the static loads, the apparent losses, and the system mismatch. This summary also indicates the number of iterations it took the program to effect the convergence. SUMMARY OF TOTAL GENERATION, LOADING & DEMAND
---------------------------------------------
MW Mvar MVA % PF
========= ========= ========= ==============
Swing Bus(es): -0.531 3.311 3.353 15.8 Leading
Generators: 6.300 -2.000 6.610 95.3 Leading
Total Demand: 5.769 1.311 5.916 97.5 Lagging
--------- --------- --------- --------------
Total Motor Load: 5.306 1.040 5.407 98.1 Lagging
Total Static Load: 0.437 0.125
Apparent Losses: 0.026 0.146
System Mismatch: 0.000 0.001
Number of Iterations = 171
Operation Technology, Inc. 15-38 ETAP PowerStation 4.0
Load Flow Analysis Alert View
15.7 Alert View The Alert View’s functional objective is to provide an immediate list of all the alerts generated by the Load Flow calculation. The Alert View Window may be configured to automatically display as soon as the Load Flow calculation is over by selecting the Auto Display check box in the alarm page of the Load Flow study case. It may also be accessed by a left click on the Alert View Icon. The Alert View provides several tabulated sections of information about the reported alerts. You may refer to Section 16.2.2 Alert Page for detailed information on alerts for each type of elements.
Device ID The Device Identification section of the Alert View lists the names of all the components that qualified as alerts after the Load Flow calculation.
Type The type section of the Alert View displays information about the type of the device having the displayed alert.
Rating The rating section of the Alert View provides the rating information being used by the load flow program to determine whether an alert should be reported and of what kind. Section 16.2.2 Alert Page provides detailed information on alerts for each type of elements.
Calculated The calculated section of the Alert View displays the results from the Load Flow calculation. The results listed here are used in combination with those displayed in the ratings section to determine the operating
Operation Technology, Inc. 15-39 ETAP PowerStation 4.0
Load Flow Analysis Alert View
percent values. These values are then compared to those entered in the Load Flow study case editor alarm page.
%Value This section displays the percent operating values calculated based on the Load Flow results and the different element ratings. The values displayed here are directly compared to the percent of monitored parameters entered directly into the Alert Page of the Load Flow Study Case Editor. Based on the element type, system topology and given conditions, the Alert Simulation Program uses these percent values to determine if and what kind of alert should be displayed.
Condition The conditions section of the Alert View provides a brief comment about the type of alert being reported. In the case of Load Flow alerts, the different conditions reported are Overloads, Over Voltage, Under Voltage, Over Excited, and Under Excited.
Operation Technology, Inc. 15-40 ETAP PowerStation 4.0