Page 1
8/7/2019 Ethanol manufacturing
http://slidepdf.com/reader/full/ethanol-manufacturing 1/26
1 of 25
COVERED SOURCE PERMIT REVIEW - NO. 0620-01-CInitial Permit - 12 MM Gallon/Year Ethanol Plant
Application No. 0620-01
Applicant: Kauai Ethanol LLC.
Facility: 12-million gallon per year ethanol manufacturing plant Equipment Location: TMK 1-7-06-1, Kaumakani, Kauai
Responsible Official: William M. Maloney Consultant: Nancy Matthews
Title: Managing Director
Sierra Research
206.300.6795916.444.6666
Applicant's Mailing Address: P. O. Box 330100
Kahului 96733
SICC: 2869
Proposed Project: Kauai Ethanol LLC (KE) is proposing to build and operate a 12 million gallon per year ethanol
manufacturing facility on Kauai. The fuel grade ethanol will be manufactured by processing
molasses. The basic process involves fermenting, distilling, and dehydrating. Support processes
include power and steam generation and ethanol storage and distribution. The facility is
expected to operate 24 hours per day and 8,360 hours per year.
Process Description:
Manufacturing ethanol from molasses consists of 3 main processes - yeast propagation andfermentation, distillation, and dehydration.
Yeast Propagation and Fermentation
Soon after the initial start-up of the plant, yeast culture will be propagated in culture and
activation vessels. The mature yeast is mixed with molasses in fermenters. During the reaction
period, the mixture is circulated through coolers to remove reaction heat. Once the reaction
period is complete, the fermented 'mash' is sent to a yeast settling tank where the yeast is
separated from the fermented mash. The separated yeast is a concentrated'cream' that isreactivated by adding air and molasses. Once reactivated, the yeast is sent back to the fermenters
to start another fermented mash cycle. During the fermentation process, the gases are vented to a
CO2 scrubber. The gases include ethanol, CO2, air and water. The CO2 scrubber uses water to
remove the entrained alcohol and then vents the scrubbed CO2 to the atmosphere.
Page 2
8/7/2019 Ethanol manufacturing
http://slidepdf.com/reader/full/ethanol-manufacturing 2/26
2 of 25
The fermented mash from the settling tank is pumped to the distilling section where it is heated
and pumped into a mash column. An evaporator in the column removes the vapors from the
fermented mash. The remainder of the fermented mash is called'vinasse' . Some of the vinasse
is recycled back into the fermentation process to reduce the quantity of dilution water required.
The remaining portion is sent to an evaporator to be concentrated to approximately 60 percent
solids and then disposed of as solid waste. Two 172,700 gallon fixed roof storage tanks will be
used to store the vinasse.
Distillation
The vapors from the mash column are then fed to a rectifier column which condenses the vapors.
The condensate from the rectifier is returned to the mash column as reflux. Both of the columns
operate under a vacuum and do not have any emission points. Uncondensed gases are drawn
through a ethanol scrubber. The counter-current sieve tray scrubber uses water to remove
alcohol and water from the uncondensed distillation gases. The ethanol scrubber will exhaust
CO2, air, water, and ethanol to the atmosphere.
An intermediate product called 'fusel oils' is drawn from the mash column and stored in a
3,000-gallon fixed roof storage tank. Fusel oils are higher order alcohols that are formed during
the fermentation process and has a vapor pressure of 0.9 psi at 20º C. With the plant running at
design capacity, KE expects to draw 50 gallons of fusel oil per day.
The hydrous ethanol vapor from the distillation columns are sent to a feed preheater and then fed
to a vaporizer flash tank. The vapors are then drawn through a molecular sieve superheater.
Heat to the superheater is provided by condensing steam. The heated vapor then passes through
the molecular sieve dehydrator. Water vapor is adsorbed by the molecular sieve media and the
ethanol that passes through is dehydrated. The dehydrated ethanol vapors are then drawn
through two condensers. The heat from the condensing ethanol is used to heat process water.
Before being stored in the day storage tanks, the ethanol is further cooled by sending it though a
heat exchanger.
Page 3
8/7/2019 Ethanol manufacturing
http://slidepdf.com/reader/full/ethanol-manufacturing 3/26
Page 4
8/7/2019 Ethanol manufacturing
http://slidepdf.com/reader/full/ethanol-manufacturing 4/26
4 of 25
A diesel engine generator will provide back-up power to the facility when the boiler is not
operating. A 2,083 bhp Caterpillar diesel engine will drive a 1.45 MW generator. The diesel
engine will fire on fuel oil no. 2 and will operate for 266 hours per year.
Equipment Description:
The following equipment will be covered under this permit.1. One (1) Praj Industries Carbon Dioxide Scrubber with six (6) sieve trays.
2. One (1) Praj Industries Ethanol Scrubber with eight (8) sieve trays.
3. One (1) 70 MMBtu/hr stoker-fired steam boiler, Alpha Boilers Inc., model Alpha ATT 25-27MP, with lime injection system.
4. Air Pollution Control Equipment for the Boiler:
a. Limestone injection system;b. Selective non-catalytic reduction (SNCR) with ammonia/urea injection system;
c. One 2,500 gallon urea storage tank; and
d. Baghouse5. Bottom-loading petroleum tank truck loading rack with of two (2) 650 gpm loading arms.6. John Zink Vapor Combustion Unit, model no. ZCT-1-4-20-X-1/4.
7. One (1) 1.45 MW Caterpillar Diesel Engine Generator set, model no. 3516B
8. One (1) 145 bhp Clark diesel engine fire pump, model no. JU4H-UF54.9. One (1) Marley Sigma F Series cooling tower, model no. F1262, and its' associated
appurtenances
Air Pollution Controls: The 70 MMBtu/hr steam boiler will utilize the following post-combustion control devices.
SNCR with Urea Injection
NOX emissions will be controlled with SNCR using urea injection. This process breaks downthe NOX into water and atmospheric nitrogen.
Limestone InjectionSO2 emissions will be controlled with the injection of limestone into the combustion zone. The
limestone absorbs the SO2 and forms gypsum. The lighter particles of limestone and gypsum are
carried by the flue gases
Baghouse
Particulate emissions will be controlled with a baghouse. The baghouse utilizes filter bags tocapture the particulates from the combustion of coal and the lighter particles limestone/gypsum
that are carried by the flue gases.
Vapor Combustion UnitA John Zink vapor combustion unit (VCU) will be used to capture and burn the VOC vapors
from the bottom-loading tank truck load rack. The VCU uses two pilot burners, firing on
propane, to ignite the VOC vapors collected during tank truck loading operations. The system,which includes the vapor collection system, has a guaranteed VOC destruction efficiency of
Page 5
8/7/2019 Ethanol manufacturing
http://slidepdf.com/reader/full/ethanol-manufacturing 5/26
5 of 25
98 percent. John Zink also guarantees that the VCU will emit no more than 10 mg of CO per
liter of fuel loaded and 4 mg of NOX per liter of product loaded.
Applicable Requirements:
Hawaii Administrative Rules (HAR):
Chapter 11-59, Ambient Air Quality Standards
Chapter 11-60.1 Air Pollution ControlSubchapter 1, General RequirementsSubchapter 2, General Prohibitions
11-60.1-31 Applicability
11-60.1-32 Visible Emissions
11-60.1-33 Fugitive Dust11-60.1-37 Process Industries
11-60.1-38 Sulfur Oxides from Fuel Combustion
11-60.1-41 Pumps and CompressorsSubchapter 5, Covered Sources
Subchapter 6, Fees for Covered Sources, Noncovered Sources, and Agricultural Burning
11-60.1-111 Definitions11-60.1-112 General Fee Provisions for Covered Sources
11-60.1-113 Application Fees for Covered Sources
11-60.1-114 Annual Fees for Covered Sources11-60.1-115 Basis of Annual Fees for Covered Sources
Subchapter 8, Standards of Performance for Stationary Sources
11-60.1-161 New Source Performance Standards
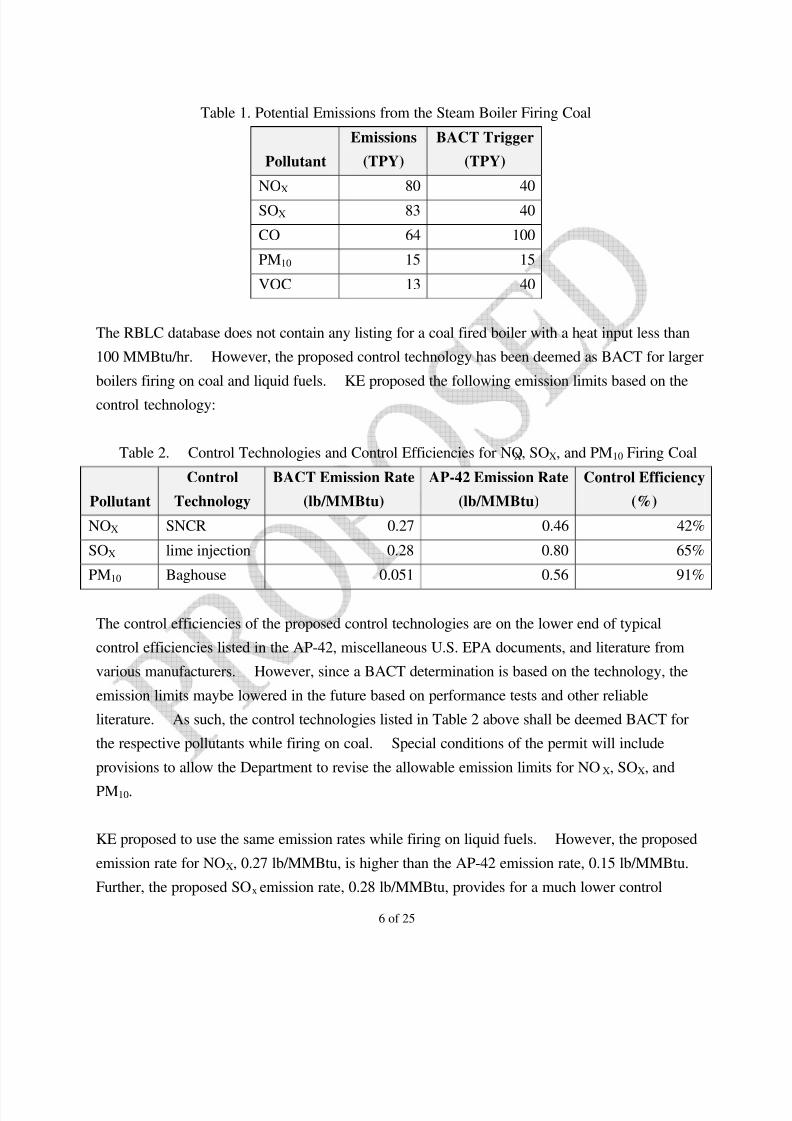
BACT:
A Best Available Control Technology (BACT) analysis is required for each new or modified
emissions unit located within a stationary source that has a net emissions increase equal to or
greater than the significant levels defined in HAR §11-60.1-1. As shown in Table 1 below, the
steam boiler is subject to a BACT analysis for NOX, SOX, and PM10. KE has proposed to use
selective noncatalytic reduction (SNCR), lime injection, and a baghouse as BACT for NOX, SOX,
and PM10 respectively.
Page 6
8/7/2019 Ethanol manufacturing
http://slidepdf.com/reader/full/ethanol-manufacturing 6/26
6 of 25
Table 1. Potential Emissions from the Steam Boiler Firing Coal
Pollutant
Emissions
(TPY)
BACT Trigger
(TPY)
NOX 80 40
SOX 83 40
CO 64 100
PM10 15 15
VOC 13 40
The RBLC database does not contain any listing for a coal fired boiler with a heat input less than
100 MMBtu/hr. However, the proposed control technology has been deemed as BACT for larger
boilers firing on coal and liquid fuels. KE proposed the following emission limits based on the
control technology:
Table 2. Control Technologies and Control Efficiencies for NOX, SOX, and PM10 Firing Coal
Pollutant
Control
Technology
BACT Emission Rate
(lb/MMBtu)
AP-42 Emission Rate
(lb/MMBtu)
Control Efficiency
(%)
NOX SNCR 0.27 0.46 42%
SOX lime injection 0.28 0.80 65%
PM10 Baghouse 0.051 0.56 91%
The control efficiencies of the proposed control technologies are on the lower end of typical
control efficiencies listed in the AP-42, miscellaneous U.S. EPA documents, and literature from
various manufacturers. However, since a BACT determination is based on the technology, the
emission limits maybe lowered in the future based on performance tests and other reliable
literature. As such, the control technologies listed in Table 2 above shall be deemed BACT for
the respective pollutants while firing on coal. Special conditions of the permit will include
provisions to allow the Department to revise the allowable emission limits for NOX, SOX, and
PM10.
KE proposed to use the same emission rates while firing on liquid fuels. However, the proposed
emission rate for NOX, 0.27 lb/MMBtu, is higher than the AP-42 emission rate, 0.15 lb/MMBtu.
Further, the proposed SOx emission rate, 0.28 lb/MMBtu, provides for a much lower control
Page 7
8/7/2019 Ethanol manufacturing
http://slidepdf.com/reader/full/ethanol-manufacturing 7/26
7 of 25
efficiency. Since SO2 emissions are a direct function of the amount of sulfur in the fuel and the
sulfur content per MMBtu is much lower for oil as compared to coal, the SO2 emissions from the
boiler should be much lower than the proposed emission limit. Also, since the proposed control
technologies are post-combustion controls, the control efficiencies of the control devices should
be relatively consistent regardless of the fuel fired. In addition, the Department has reviewed
other BACT determinations and in all instances the maximum allowable emission rates are lower
than what the permittee is proposing. The permittee has stated that the manufacturer will not
provide a guarantee for emission rates below the proposed limits. As such, the Department will
initially use the proposed coal emission limits for the boiler while firing liquid fuels. The
Department will reevaluate the emission limits after the initial source performance test and has
incorporated a condition to lower the allowable emission limits based on the test results.
NSPS:
40 CFR Part 60, Standards of Performance for New Stationary Sources, Subpart Dc, Standards
of Performance for Small Industrial-Commercial-Institutional Steam Generating Units.
40 CFR Part 60, Standards of Performance for New Stationary Sources, Subpart VV, Standards
of Performance for Equipment Leaks of VOC in the Synthetic Organic Chemicals Manufacturing
Industry.
40 CFR Part 60, Standards of Performance for New Stationary Sources, Subpart IIII, Standards
of Performance for Stationary Compression Ignition Internal Combustion Engines.
Synthetic minor:
A synthetic minor is a facility that without limiting conditions, physical or operational, emits
above the major triggering levels as defined by HAR 11-60.1-1 for either criteria pollutant(s) or
hazardous air pollutant(s). Without operational limits on the diesel engine generator, the facility
would be a major source for CO and NOx. Thus, KE is a synthetic minor.
Non-Applicable Requirements:
CAM:
The purpose of Compliance Assurance Monitoring (CAM) is to provide a reasonable assurance
that compliance is being achieved with large emissions units that rely on air pollution control
device equipment to meet an emissions limit or standard. Pursuant to 40 Code of Federal
Regulations, Part 64, for CAM to be applicable, the emissions unit must: (1) be located at a
Page 8
8/7/2019 Ethanol manufacturing
http://slidepdf.com/reader/full/ethanol-manufacturing 8/26
8 of 25
major source; (2) be subject to an emissions limit or standard; (3) use a control device to achieve
compliance; (4) have potential pre-control emissions that are 100% of the major source level;
and (5) not otherwise be exempt from CAM. Since the facility is not a major source, CAM does
not apply.
CERR (Consolidated Emission Reporting Rule):
40 CFR part 51, Subpart A – Emission Inventory Reporting Requirements, determines the annual
emissions reporting frequency based on the actual emissions of each pollutant from any
individual emission point within the facility that emits at or above the triggering levels. Since
the trigger levels are at or above the major source levels and this facility is not a major source,
the facility is not subject to annual emission reporting under CERR.
The Department does however, require facilities to report their annual emissions if the facility-
wide emissions exceed the Department's trigger levels. The Department uses the data for in-
house recordkeeping purposes. The ethanol manufacturing plant exceeds the Department's
trigger levels and is required to submit annual emissions. Table 3 below summarizes the
Department's trigger levels and illustrates the facility's applicability.
Table 3 Comparison of Emissions to CAB Trigger Levels
Pollutant
Steam Boiler
(TPY)
CAB
trigger
(TPY)
NOX 80 25
SOX 83 25
CO 64 250
PM10 15 25
VOC 13 25
NSPS:
40 CFR Part 60, Subpart Kb - Standards of Performance for Volatile Organic Liquid Storage
Vessels (Including Petroleum Liquid Storage Vessels) for Which Construction, Reconstruction,
or Modification Commenced After July 23, 1984. The storage tanks that contain VOLs with avapor pressure greater than 3.5 but less than 15 kPa are exempt because the storage capacity of
each tank is less than 40,000 gallons. None of the storage tanks with a storage capacity of at
least 20,000 gallons store a VOL with a vapor pressure greater than 15 kPa.
40 CFR 60, Subpart XX - Standards of Performance for Bulk Gasoline Terminals. The tank
Page 9
8/7/2019 Ethanol manufacturing
http://slidepdf.com/reader/full/ethanol-manufacturing 9/26
9 of 25
truck load rack is not subject to Subpart XX because the facility is not considered a Bulk
Gasoline Terminal.
40 CFR Part 60, Subpart III - Standards of Performance for Volatile Organic Compound (VOC)
Emissions From the Synthetic Organic Chemical Manufacturing Industry (SOCMI) Air
Oxidation Unit Processes. The facility is not subject to Subpart III because ethanol and yeast are
not listed as chemicals subject to Subpart III.
40 CFR Part 60, Subpart NNN - Standards of Performance for Volatile Organic Compound
(VOC) Emissions From Synthetic Organic Chemical Manufacturing Industry (SOCMI)
Distillation Operations. Ethanol is listed as one of the chemicals subject to Subpart NNN.
However, as stated in the Federal Register volume 67 no. 7, published on January 10, 2002, the
U.S. EPA exempts ethanol manufacturing by biological synthesis from Subpart NNN. Since the
ethanol is produced by fermentation, a biological synthesis, the facility is not subject to Subpart
NNN.
40 CFR Part 60, Subpart RRR, Standards of Performance for Volatile Organic Compound
Emissions from Synthetic Organic Chemical Manufacturing Industry (SOCMI) Reactor
Processes. Ethanol is listed as one of the chemicals subject to Subpart RRR. However, as with
Subpart NNN, the U.S. EPA exempts ethanol manufacturing by biological synthesis from
Subpart RRR. Since the ethanol is produced by fermentation, a biological synthesis, the facility
is not subject to Subpart RRR.
NESHAP/MACT:
40 CFR 63, Subpart ZZZZ National Emission Standards for Hazardous Air Pollutants for
Reciprocating Internal Combustion Engines is not applicable to the diesel engines because the
facility is not a major source of HAPs.
PSD:
PSD does not apply since this facility is not a major stationary source.
Page 10
8/7/2019 Ethanol manufacturing
http://slidepdf.com/reader/full/ethanol-manufacturing 10/26
10 of 25
Insignificant Activities:
The facility will have the following insignificant activities.
1. Five 39,000 gallon fixed roof ethanol storage tanks. These tanks are less than
40,000 gallons. HAR 11-60.1-82(f)(1).
2. One 5,000 gallon above ground gasoline storage tank. This tank is less than 40,000 gallons.
HAR 11-60.1-82(f)(1).
3. Two 172,700 gallon fixed roof vinasse storage tanks. The vapor pressure of the vinasse is
less than 1.5 psia and the total emissions from storing vinasse will be less than 2 tons per
year VOC. HAR 11-60.1-82(f)(7).
4. Two 172,700 gallon fixed roof molasses storage tanks. The vapor pressure of the molasses is
less than 1.5 psia and the total emissions from storing molasses will be less than 2 tons per
year VOC. HAR 11-60.1-82(f)(7).
5. One 10,000 gallon above-ground diesel fuel storage tank. This tank is less than
40,000 gallons. HAR 11-60.1-82(f)(1).
6. One 5,000 gallon above-ground diesel fuel storage tank. This tank is less than
40,000 gallons. HAR 11-60.1-82(f)(1).
7. One 5,000 gallon above-ground waste ethanol storage tank. This tank is less than
40,000 gallons. HAR 11-60.1-82(f)(1).
8. One 5,000 gallon above-ground spec used oil storage tank. This tank is less than
40,000 gallons. HAR 11-60.1-82(f)(1).
9. One 10,000 gallon above-ground spent lees storage tank. This tank is less than
40,000 gallons. HAR 11-60.1-82(f)(1).
10. Yeast propagator. The yeast propagator vents to the atmosphere, but the process and reaction
only emits water and CO2.
Page 11
8/7/2019 Ethanol manufacturing
http://slidepdf.com/reader/full/ethanol-manufacturing 11/26
11 of 25
Alternate Operating Scenarios:
The applicant listed firing the boiler on either coal, fuel oil, or a combination of the two. When
the boiler is firing on coal, the maximum heat input will be 70 MMBtu/hr continuous and
77 MMBtu/hr peak for 3 hours in a 24-hour period. When the boiler is firing on fuel oil, the
maximum heat input will be 55.3 MMBtu/hr.
KE may also burn spec used oil in the boiler. The spec used oil will be blended with the fuel oil.
As such, the maximum heat input to the boiler while firing spec used oil will be same as firing
fuel oil, 55.3 MMBtu/hr. The applicant self-imposed a consumption limit of 161,812 MMBtu/yr,
or 1,181,110 gallons per year of spec used oil. All spec used oil must be received from approved
sources.
The Department is allowing KE to temporarily replace the 1.45 MW Caterpillar diesel engine
with a similar diesel engine should the Caterpillar diesel engine need repairs that would require
the engine to be removed. The Department is also allowing KE to use alternate fuels and fuel
additives provided prior written approval from the Department is obtained.
Project Emissions:
Steam Boiler - firing coal
Emissions from the steam boiler while firing on coal were estimated using the BACT emission
limits and AP-42 section 1.1, revised 9/98. For NOX, SOX and PM10, the emission limits from
the BACT analysis were used to calculate the potential emissions. CO and VOC emissions were
estimated using tables 1.1-3 and 1.1-19, respectively, of the AP-42. Heat input and fuel
consumption were calculated by using the fuel feed rate, a HHV of 11,800 Btu/lb, and assuming
the 70 MMBtu/hr boiler will operate at peak load, 77 MMBtu/hr, for 3 hours each day. The
boiler will operate for 8,360 hours per year, or 1,045 hours at peak load and 7,315 hours at
continuous load. With a continuous feed rate of 3 tons per hour and a peak feed rate of 3.3 tons
per hour, the total coal consumption is 25,394 tons per year. The table 4 below summarizes the
emissions from the steam boiler firing on coal.
Page 12
8/7/2019 Ethanol manufacturing
http://slidepdf.com/reader/full/ethanol-manufacturing 12/26
12 of 25
Table 4. Steam Boiler Emissions - Firing Coal
Emissions
Pollutant Emission Factor g/s3
lb/hr3
TPY4
NOX 0.27 lb/MMBtu 2.62 20.80 80.0
SOX 0.28 lb/MMBtu 2.72 21.60 83.0
CO 5 lb/ton 2.08 16.50 63.5
PM101 0.051 lb/MMBtu 0.50 3.93 15.1
VOC 2 1.0 lb/ton 0.42 3.30 12.7
1 - all particulates assumed to be PM10
2 - as methane
3 - based on peak load, 77 MMBtu/hr
4 - based on 7,315 hours at continuous load and 1,045 hours at peak load
Steam Boiler - firing fuel oil and spec used oil
Emissions from the steam boiler while firing on fuel oil no. 2 and spec used oil were estimatedusing the BACT emission limits and AP-42 section 1.3, revised 9/98. The emission rates from
the BACT analysis were used to calculate the emissions of NOX, SOX, and PM10. VOC
emissions were estimated using the emission factors listed in sections 1.3 and 1.11 of the AP-42.
The emission rate for CO is from the manufacturer and is higher than the AP-42. Heat input was
based upon the fuel feed rate and the HHV values of the various liquid fuels. The HHV value
used for fuel oil and spec used oil was 137,000 Btu/gal. With a fuel feed rate of 404 gallons per
hour, the maximum heat input into the boiler is 462,709 MMBtu per year. The table below
summarizes the emissions from the steam boiler firing on liquid fuels.
Table 5. Steam Boiler Emissions - Firing Liquid Fuels
Emissions
Pollutant Emission Factor g/s
lb/hr TPY
NOX1 0.27 lb/MMBtu 1.88 14.94 62.5
SOX1 0.28 lb/MMBtu 1.95 15.50 64.8
CO 6.3 lb/1,000 gal 0.32 2.55 10.6
PM101
2 lb/1,000 gal 0.10 0.81 3.4
VOC 2 1 lb/1,000 gal 0.01 0.40
VOC 3 0.252 lb/1,000 gal 0.74
1 - NOX and SOX emission factors are the emission limits from the BACT analysis.
2 - VOC emission factor is for used oil, table 1.11-3 of the AP-42, used for short-term emissions
3 - VOC emission factor from table 1.3-3 of the AP-42. Annual emissions based on843,650 gallons of spec used oil and 2,533,790 gallons of fuel oil no. 2.
Page 13
8/7/2019 Ethanol manufacturing
http://slidepdf.com/reader/full/ethanol-manufacturing 13/26
13 of 25
Ammonia Emissions
KE proposed a ammonia slip rate of 20 ppmvd at 3 percent O2 or 0.01 lb/MMBtu. For the boiler
firing on coal, the ammonia emissions based on that slip rate would be 3 tons per year. The
proposed slip rate is slightly higher than what is being reported for similar systems. The
Department will impose an ammonia emission limit of 0.7 lb/hr and 20 ppmvd at 3 percent O2
while firing coal at 70 MMBtu/hr, 0.8 lb/hr and 22 ppmvd at 3 percent O2 while firing coal at
77 MMBtu/hr, and 0.6 lb/hr and 20 ppmvd at 3 percent while firing liquid fuels. Maximum
ammonia emissions are based on firing coal for 7,315 hours at 70 MMBtu/hr and 1,045 hours at
77 MMBtu/hr.
NH3 = {[0.7 lb/hr * 7,315 hours] + [0.8 lb/hr * 1,045 hr]} / 2,000 lb/ton
= 3.0 tons per year
Diesel Engine Generator
Except for SO2, emissions from the diesel engine generator were estimated using the not to
exceed emissions data from the manufacturer. SO2 emissions were estimated assuming all of the
sulfur in the vapor converts to SO2. The molecular weight of sulfur is 32 lb/lb mole and for SO2,
the molecular weight is 64 lb/lb mole. As such, the emissions of SO2 will be twice the sulfur
content. SO2 emission factor was calculated using the sulfur content of the fuel, the fuel
consumption rate, and the fuel density. The diesel engine generator is subject to NSPS Subpart
IIII and as required by Subpart IIII, the diesel engine will fire on diesel fuel no. 2 with a sulfur
content not to exceed 0.05 percent by weight. The table below summarizes the emissions from
the diesel engine generator operating for 266 hours per rolling 12-month period.
Table 6. Diesel Engine Generator Emissions
Pollutants
Emission Factor
(lb/hr)
Emissions - 266 hours
(TPY)
NOX 26.50 3.52
CO 24.44 3.25
SO21 0.72 0.10
PM10
2
0.71 0.09VOC 3 0.65 0.09
1 - emission factor = 0.05% sulfur * 2 * 7.1 (lb/gal) * 101.6 (gal/hr)
2- all particulate assumed to be PM10
3 - all hydrocarbons, including non-methane hydrocarbons assumed to be VOC
Page 14
8/7/2019 Ethanol manufacturing
http://slidepdf.com/reader/full/ethanol-manufacturing 14/26
14 of 25
Ethanol Processes
Emissions from the production of ethanol were estimated using information provided by the
process manufacturer, Praj Industries. Most of the processes involved in producing ethanol are
closed systems. The sources of emissions from the ethanol production are from the CO2
scrubber, the ethanol scrubber, and the molecular sieve regenerator.
The gases from the fermentation process are vented to the atmosphere through the CO2 scrubber.
The scrubber uses water to capture the ethanol and releases CO2 and uncaptured ethanol to the
atmosphere. Using the vapor feed rate to the scrubber, the concentration of ethanol in the vapor,
and the efficiency of the scrubber, the emissions from the CO2 scrubber are:
VOC (lb/hr) = vapor feed rate * ethanol concentration * [1 - efficiency]
where: vapor feed rate = 7,850 lb/hr
ethanol concentration = 1.19%
recovery efficiency = 95%
VOC (lb/hr) = 7,850 lb/hr * 0.0119 * 0.05 = 4.67 lb/hr
The ethanol plant will operate for 8,360 hours per year. So,
VOC (TPY) = 4.67 lb/hr * 8,360 hr/yr / 2,000 lb/ton = 19.5 tons per year
Uncondensed gases from the distillation process are vented to the atmosphere through the
ethanol scrubber. The sieve tray scrubber is 99 percent efficient and water to scrub the ethanol
from the vapor. Emissions from this scrubber were estimated using the same equation above
where:
vapor feed rate = 645 lb/hr
ethanol concentration = 53.5%
recovery efficiency = 99%
VOC (lb/hr) = 645 lb/hr * 0.535 * 0.01 = 3.45 lb/hr
VOC (TPY) = 3.45 lb/hr * 8,360 hours / 2,000 lb/ton = 14.4 tons per year
In the dehydration process, ethanol vapors are used to regenerate the molecular sieve media.
Ethanol vapor is drawn through the media and the ethanol vapor desorbs the water from the
media. The water laden vapor is then condensed and the remaining vapor that does not condense
is discharged to the atmosphere. The manufacturer estimates that no more than 2 kg/day of
ethanol is emitted. Assuming 24 per day operation and 8,360 annual operating hours,
VOC (lb/hr) = 2 kg/day * 2.2 lb/kg / 24 hr/day = 0.18 lb/hr
VOC (TPY) = 0.18 lb/hr * 8,360 hrs / 2,000 lb/ton = 0.8 tons per year
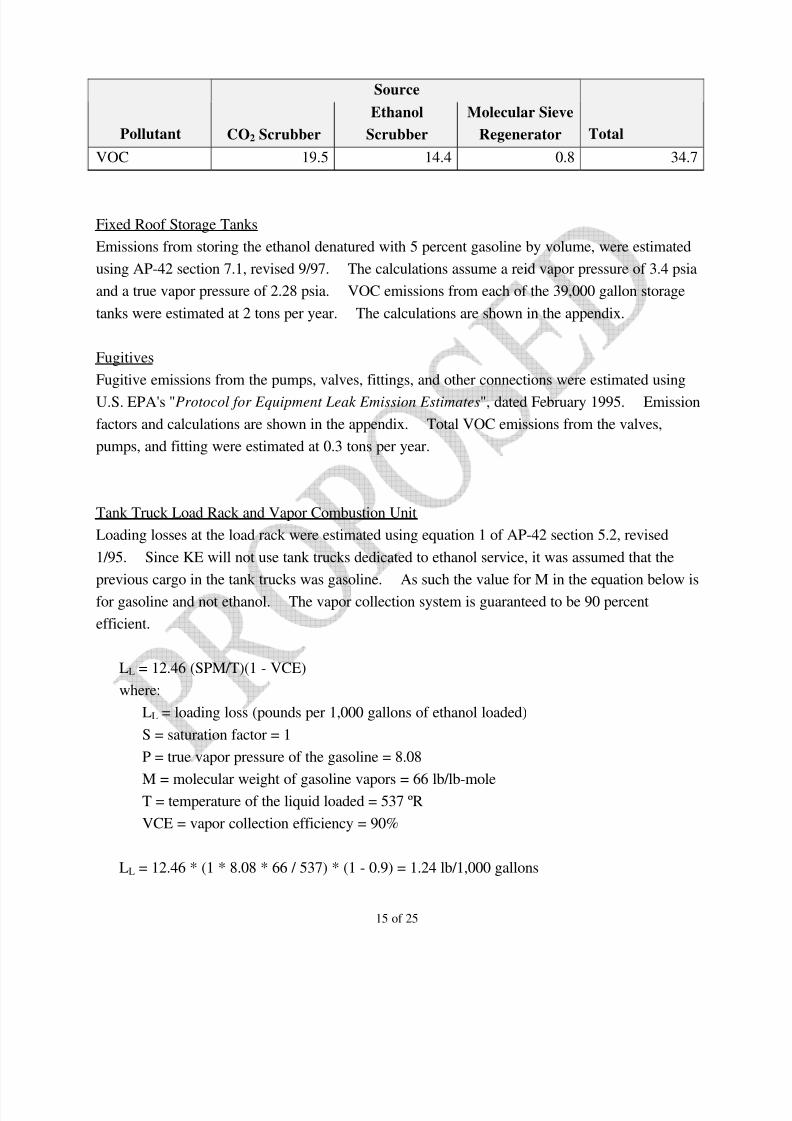
Table 7. Ethanol Production Emissions
Page 15
8/7/2019 Ethanol manufacturing
http://slidepdf.com/reader/full/ethanol-manufacturing 15/26
15 of 25
Source
Pollutant CO2 Scrubber
Ethanol
Scrubber
Molecular Sieve
Regenerator Total
VOC 19.5 14.4 0.8 34.7
Fixed Roof Storage Tanks
Emissions from storing the ethanol denatured with 5 percent gasoline by volume, were estimated
using AP-42 section 7.1, revised 9/97. The calculations assume a reid vapor pressure of 3.4 psia
and a true vapor pressure of 2.28 psia. VOC emissions from each of the 39,000 gallon storage
tanks were estimated at 2 tons per year. The calculations are shown in the appendix.
Fugitives
Fugitive emissions from the pumps, valves, fittings, and other connections were estimated using
U.S. EPA's "Protocol for Equipment Leak Emission Estimates", dated February 1995. Emission
factors and calculations are shown in the appendix. Total VOC emissions from the valves,
pumps, and fitting were estimated at 0.3 tons per year.
Tank Truck Load Rack and Vapor Combustion Unit
Loading losses at the load rack were estimated using equation 1 of AP-42 section 5.2, revised
1/95. Since KE will not use tank trucks dedicated to ethanol service, it was assumed that the
previous cargo in the tank trucks was gasoline. As such the value for M in the equation below is
for gasoline and not ethanol. The vapor collection system is guaranteed to be 90 percent
efficient.
LL = 12.46 (SPM/T)(1 - VCE)
where:
LL = loading loss (pounds per 1,000 gallons of ethanol loaded)
S = saturation factor = 1
P = true vapor pressure of the gasoline = 8.08
M = molecular weight of gasoline vapors = 66 lb/lb-moleT = temperature of the liquid loaded = 537 ºR
VCE = vapor collection efficiency = 90%
LL = 12.46 * (1 * 8.08 * 66 / 537) * (1 - 0.9) = 1.24 lb/1,000 gallons
Page 16
8/7/2019 Ethanol manufacturing
http://slidepdf.com/reader/full/ethanol-manufacturing 16/26
16 of 25
For an annual production rate of 12 millions gallons of ethanol plus the 5 percent gasoline by
volume denaturant, the total loading loss per rolling 12 months will be:
12,600,000 gal / 1,000 gal * 1.24 lb/1,000 gal * 1/2,000 ton/lb = 7.8 VOC
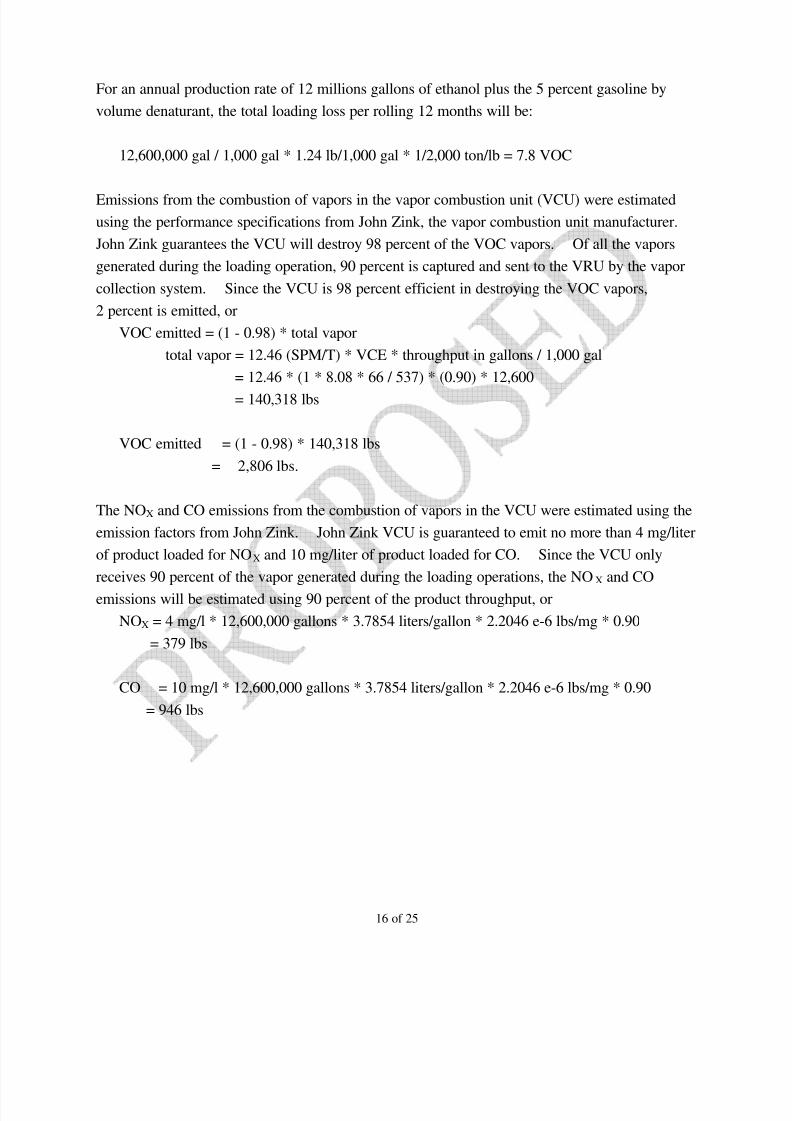
Emissions from the combustion of vapors in the vapor combustion unit (VCU) were estimated
using the performance specifications from John Zink, the vapor combustion unit manufacturer.
John Zink guarantees the VCU will destroy 98 percent of the VOC vapors. Of all the vapors
generated during the loading operation, 90 percent is captured and sent to the VRU by the vapor
collection system. Since the VCU is 98 percent efficient in destroying the VOC vapors,
2 percent is emitted, or
VOC emitted = (1 - 0.98) * total vapor
total vapor = 12.46 (SPM/T) * VCE * throughput in gallons / 1,000 gal
= 12.46 * (1 * 8.08 * 66 / 537) * (0.90) * 12,600
= 140,318 lbs
VOC emitted = (1 - 0.98) * 140,318 lbs
= 2,806 lbs.
The NOX and CO emissions from the combustion of vapors in the VCU were estimated using the
emission factors from John Zink. John Zink VCU is guaranteed to emit no more than 4 mg/liter
of product loaded for NOX and 10 mg/liter of product loaded for CO. Since the VCU only
receives 90 percent of the vapor generated during the loading operations, the NOX and CO
emissions will be estimated using 90 percent of the product throughput, or
NOX = 4 mg/l * 12,600,000 gallons * 3.7854 liters/gallon * 2.2046 e-6 lbs/mg * 0.90
= 379 lbs
CO = 10 mg/l * 12,600,000 gallons * 3.7854 liters/gallon * 2.2046 e-6 lbs/mg * 0.90
= 946 lbs
Page 17
8/7/2019 Ethanol manufacturing
http://slidepdf.com/reader/full/ethanol-manufacturing 17/26
17 of 25
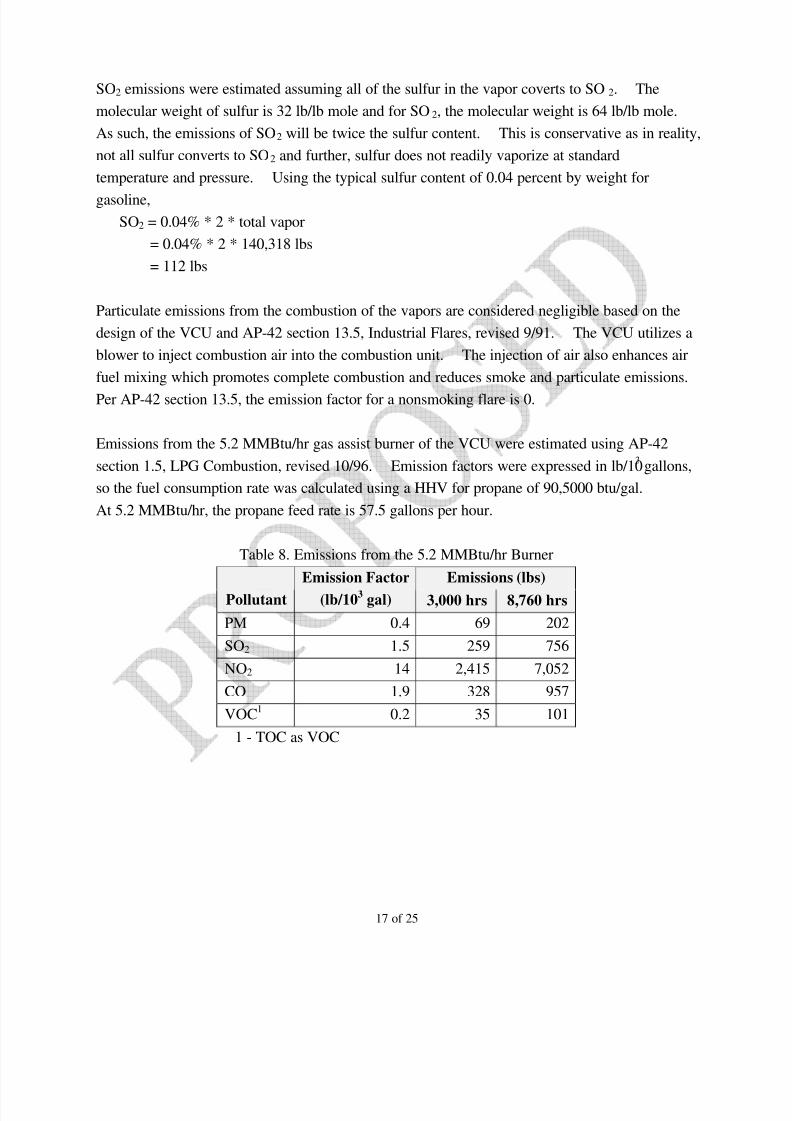
SO2 emissions were estimated assuming all of the sulfur in the vapor coverts to SO2. The
molecular weight of sulfur is 32 lb/lb mole and for SO2, the molecular weight is 64 lb/lb mole.
As such, the emissions of SO2 will be twice the sulfur content. This is conservative as in reality,
not all sulfur converts to SO2 and further, sulfur does not readily vaporize at standard
temperature and pressure. Using the typical sulfur content of 0.04 percent by weight for
gasoline,
SO2 = 0.04% * 2 * total vapor
= 0.04% * 2 * 140,318 lbs
= 112 lbs
Particulate emissions from the combustion of the vapors are considered negligible based on the
design of the VCU and AP-42 section 13.5, Industrial Flares, revised 9/91. The VCU utilizes a
blower to inject combustion air into the combustion unit. The injection of air also enhances air
fuel mixing which promotes complete combustion and reduces smoke and particulate emissions.
Per AP-42 section 13.5, the emission factor for a nonsmoking flare is 0.
Emissions from the 5.2 MMBtu/hr gas assist burner of the VCU were estimated using AP-42
section 1.5, LPG Combustion, revised 10/96. Emission factors were expressed in lb/103
gallons,
so the fuel consumption rate was calculated using a HHV for propane of 90,5000 btu/gal.
At 5.2 MMBtu/hr, the propane feed rate is 57.5 gallons per hour.
Table 8. Emissions from the 5.2 MMBtu/hr Burner
Emissions (lbs)
Pollutant
Emission Factor
(lb/103
gal) 3,000 hrs 8,760 hrs
PM 0.4 69 202
SO2 1.5 259 756
NO2 14 2,415 7,052
CO 1.9 328 957
VOC1 0.2 35 101
1 - TOC as VOC
Page 18
8/7/2019 Ethanol manufacturing
http://slidepdf.com/reader/full/ethanol-manufacturing 18/26
18 of 25
The table below represents the total emissions from the operations at the tank truck load rack.
Table 9. Emissions from Tank Truck Loading Operations
Point Emissions (TPY) Area Source (TPY)
Pollutant
Vapor
Combustion
VCU Burner
(3,000 hrs) Total
Fugitives from
Collection System
PM10 1 negligible 0.03 0.03 n/a
SO2 0.06 0.13 0.19 n/a
NO2 0.19 1.21 1.40 n/a
CO 0.47 0.16 0.63 n/a
VOC 2 1.40 negligible 1.40 7.8
1 - includes PM
2 - includes TOC
Cooling Tower
Emissions from the cooling tower were estimated using the total dissolved solids (TDS)
concentration of the cooling water, the drift rate of the mist eliminator, and the feed rate of the
cooling water. Multiplying the TDS, or the amount of solids in the cooling water, by the drift
rate, which is the percent of cooling water that passes through the mist eliminator, will estimate
how much solids are exhausted to the atmosphere by the cooling fan. It is assumed that the
water in the drift evaporates and the remaining solids are PM10.
PM10 = TDS (mg/l) * drift (%) * recirculation rate (gpm) * 8.345e-6 (lb-l/mg-gal) * 60 (min/hr)
= 5,000 * 0.00005 * 7,640 * 8.345e-6 * 60
= 0.96 lb/hr
For operating hours of 8,360 hours per year,
PM10 = 0.96 * 8,360 / 2,000 (lb/ton)
= 4.0 tons per year
Diesel Engine Fire Pump
Emissions from the diesel engine fire pump were estimated using the emission factors from the
manufacturer. The 145 hp diesel engine is manufactured by John Deere and could be considered
an insignificant activity as it will be operated only during testing, maintenance, and emergency
conditions. However, the diesel engine is subject to NSPS Subpart IIII and will be included in
the operating permit. As required by Subpart IIII, the diesel engine will fire on diesel fuel no. 2
Page 19
8/7/2019 Ethanol manufacturing
http://slidepdf.com/reader/full/ethanol-manufacturing 19/26
19 of 25
with a sulfur content not to exceed 0.05 percent by weight. The diesel engine is limited by
Subpart IIII to operating 100 hours per year for maintenance and readiness testing. The table
below shows the emissions from operating the diesel engine for 100 hours per rolling 12-month
period.
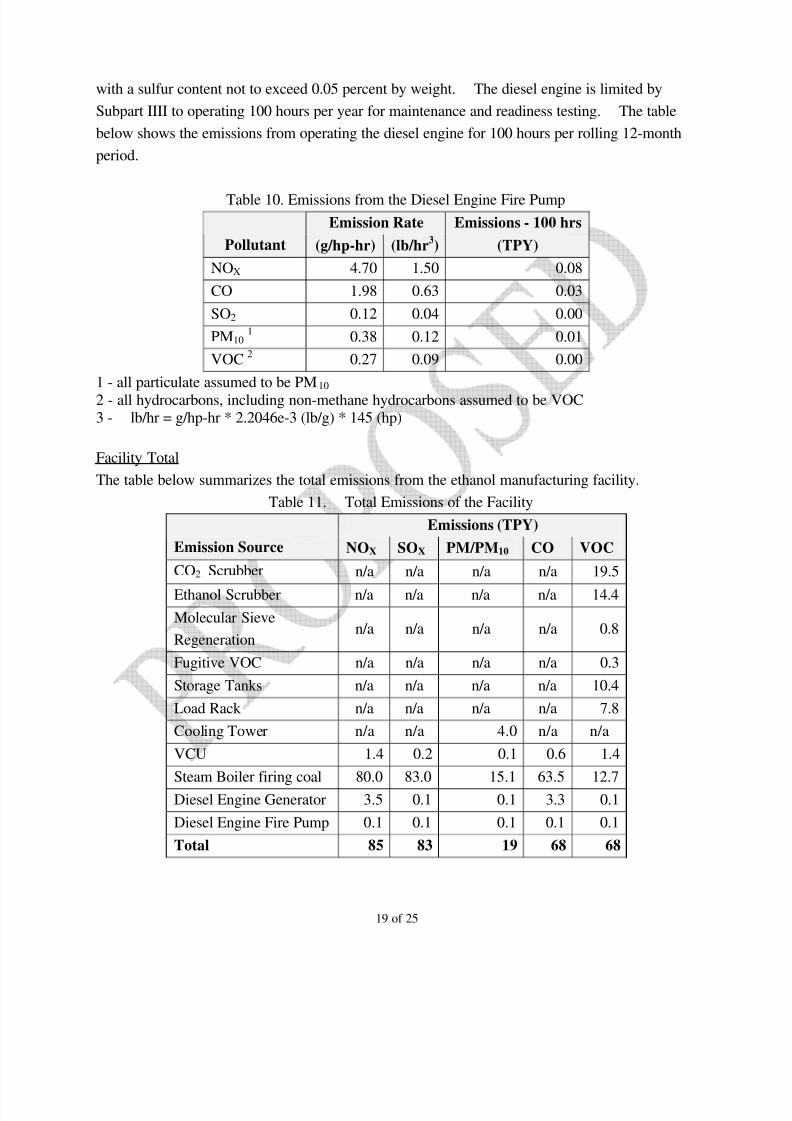
Table 10. Emissions from the Diesel Engine Fire Pump
Emission Rate Emissions - 100 hrs
Pollutant (g/hp-hr) (lb/hr3) (TPY)
NOX 4.70 1.50 0.08
CO 1.98 0.63 0.03
SO2 0.12 0.04 0.00
PM10 1 0.38 0.12 0.01
VOC 2 0.27 0.09 0.00
1 - all particulate assumed to be PM10
2 - all hydrocarbons, including non-methane hydrocarbons assumed to be VOC3 - lb/hr = g/hp-hr * 2.2046e-3 (lb/g) * 145 (hp)
Facility Total
The table below summarizes the total emissions from the ethanol manufacturing facility.
Table 11. Total Emissions of the Facility
Emissions (TPY)
Emission Source NOX SOX PM/PM10 CO VOC
CO2 Scrubber n/a n/a n/a n/a 19.5
Ethanol Scrubber n/a n/a n/a n/a 14.4
Molecular Sieve
Regenerationn/a n/a n/a n/a 0.8
Fugitive VOC n/a n/a n/a n/a 0.3
Storage Tanks n/a n/a n/a n/a 10.4
Load Rack n/a n/a n/a n/a 7.8
Cooling Tower n/a n/a 4.0 n/a n/a
VCU 1.4 0.2 0.1 0.6 1.4
Steam Boiler firing coal 80.0 83.0 15.1 63.5 12.7
Diesel Engine Generator 3.5 0.1 0.1 3.3 0.1
Diesel Engine Fire Pump 0.1 0.1 0.1 0.1 0.1
Total 85 83 19 68 68
Page 20
8/7/2019 Ethanol manufacturing
http://slidepdf.com/reader/full/ethanol-manufacturing 20/26
20 of 25
Air Quality Assessment:
KE conducted an ambient air quality analysis with the Lakes Environmental software package
using ISCST3, a U.S. EPA approved model, to determine source compliance with federal and
state ambient air quality standards (AAQS). The maximum model-predicted concentrations were
calculated to determine the maximum ambient air impacts. The model, methodology and
assumptions used by KE in the ambient air quality analysis were determined to be consistent
with state and federal guidelines as discussed below.
ISCST3 was run with the regulatory default option selected. The default options include the use
of rural dispersion coefficients, stack tip downwash, default wind speed profile exponents, upper
bound concentrations for downwash, and the calm processing routine.
The meteorological data used by KE for the analysis was collected by Kauai Island Utility
Cooperative in 1991. The data was collected at Burns Field, approximately two miles from the
project site. The upper air data set from Lihue airport was used with the Burns field data set in
the model.
Wake effects from downwash were considered in the model. Wake effects are treated in the
ISCST3 model by including direction specific building dimensions and locations for each
emission source. The dimensions and locations were analyzed using the Lakes Environmental
software which processes the data using the EPA Building Profile Input Program (BPIP). The
BPIP program determines the dominant structure for each 10-degree increment. The dominant
structure could be a building or a combination of buildings.
In the initial screening analysis, receptors were placed in a 25-meter spacing grid at the fence
line and in a 180-meter grid elsewhere to locate the areas of high concentrations. Refined
modeling used receptors spaced at 30-meter increments in areas of high concentrations predicted
in the initial coarse grid modeling. Terrain features and ground level elevations were taken from
the applicable U.S.G.S. DEM data and 7.5 minute topographic maps.
The tables below shows the input values for the parameters used in the model. The higher
emission rates for the short-term averaging periods for the boiler reflect the three-hour peak load
per day of 77 MMBtu/hr. The difference in the short-term emissions for the diesel engine reflect
the throughput limit of 194,245 gallons in any rolling 12-month period. Emission of SO2 and
PM10 were deemed negligible for the vapor combustion unit. Annual emission of PM10 from the
cooling tower were corrected to reflect annual operating hours of 8,360 hours per year.
Page 21
8/7/2019 Ethanol manufacturing
http://slidepdf.com/reader/full/ethanol-manufacturing 21/26
21 of 25
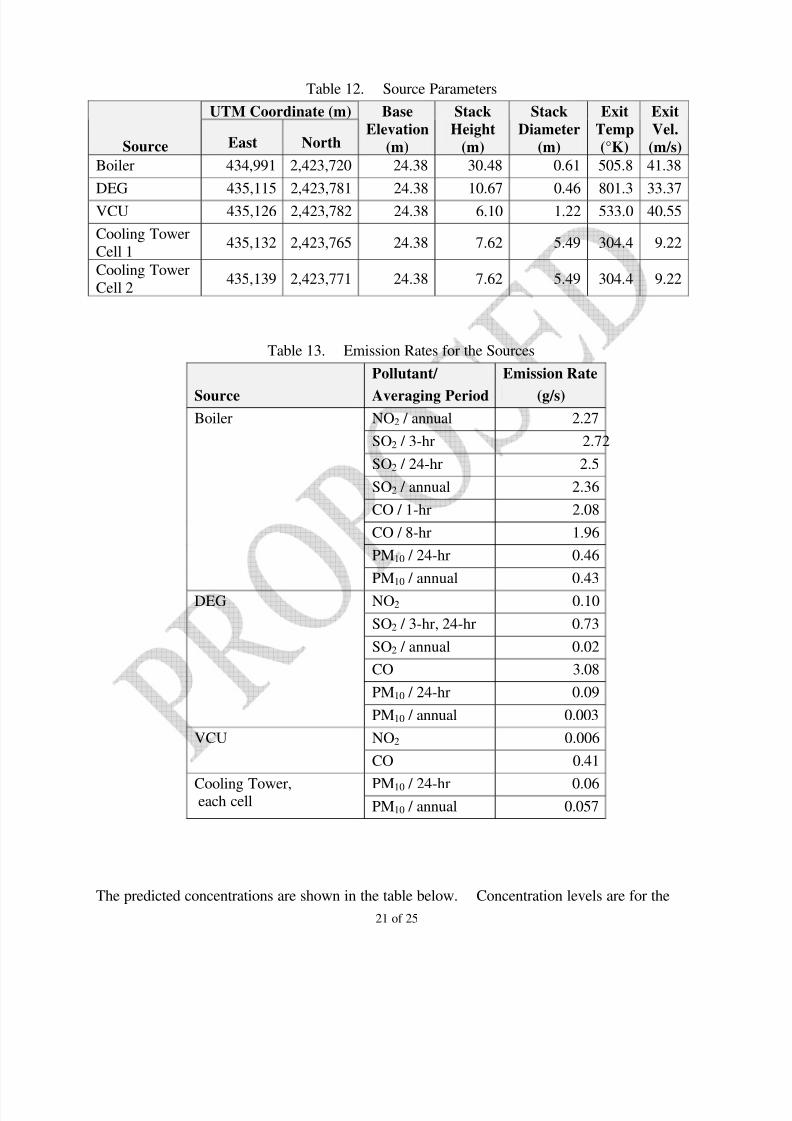
Table 12. Source Parameters
UTM Coordinate (m)
Source East North
Base
Elevation
(m)
Stack
Height
(m)
Stack
Diameter
(m)
Exit
Temp
(°K)
Exit
Vel.
(m/s)
Boiler 434,991 2,423,720 24.38 30.48 0.61 505.8 41.38
DEG 435,115 2,423,781 24.38 10.67 0.46 801.3 33.37VCU 435,126 2,423,782 24.38 6.10 1.22 533.0 40.55
Cooling Tower
Cell 1435,132 2,423,765 24.38 7.62 5.49 304.4 9.22
Cooling Tower
Cell 2435,139 2,423,771 24.38 7.62 5.49 304.4 9.22
Table 13. Emission Rates for the Sources
Source
Pollutant/
Averaging Period
Emission Rate
(g/s)
NO2 / annual 2.27
SO2 / 3-hr 2.72
SO2 / 24-hr 2.5
SO2 / annual 2.36
CO / 1-hr 2.08
CO / 8-hr 1.96
PM10 / 24-hr 0.46
Boiler
PM10 / annual 0.43
NO2 0.10
SO2 / 3-hr, 24-hr 0.73
SO2 / annual 0.02
CO 3.08
PM10 / 24-hr 0.09
DEG
PM10 / annual 0.003
NO2 0.006VCU
CO 0.41
PM10 / 24-hr 0.06Cooling Tower,each cell PM10 / annual 0.057
The predicted concentrations are shown in the table below. Concentration levels are for the
Page 22
8/7/2019 Ethanol manufacturing
http://slidepdf.com/reader/full/ethanol-manufacturing 22/26
22 of 25
annual operations of 8,360 hours per year. Ozone Limiting Method was used to estimate NO2
concentrations. Based on these assumptions, the facility should comply with state and federal
ambient air quality standards for SO2, NO2, CO, and PM10.
Table 14. Maximum Projected Impacts
Concentrations (µg/m3)
Pollutant/
Averaging Time Facility Background Total
State
Standard
Percent of
Standard
NO2 / annual 1.7 9 10.7 70 15%
SO2 / 3hr 711 10 721 1,300 55%
SO2 / 24- hr 283 4 287 365 79%
SO2 / annual 1.0 0.3 1.3 80 2%
CO / 1-hr 3,591 2,394 5,985 10,000 60%
CO / 8-hr 1,880 983 2,863 5,000 57%
PM10 / 24-hr 34.7 28 62.7 150 42%
PM10 / annual 3.6 16 19.6 50 39%
Although ammonia is not a criteria pollutant, there is a threshold limit value (TLV) set by the
American Congress of Governmental Industrial Hygienists (ACGIH). The TLV is a
concentration level which the ACGIH believes that workers may be repeatedly exposed to day
after day without any adverse health effects. The TLV concentrations are time-weighted
averages (TWA) for an eight hour day. The ACGIH TLV-TWA for ammonia is 25 ppm, or
17.7 mg/m3.
Although not listed as a hazardous air pollutant (HAP), the Department at its' discretion will treat
ammonia as a non-carcinogenic HAP and assess the emission concentration in accordance with
§11-60.1-179(c) of the HAR. Under that portion of the HAR, emission concentrations of non-
carcinogenic HAPs are compared to fractions of the TLV-TWA. Because the TLV-TWA is
based on a healthy worker and not the general public, the Department requires the 8-hour
average emission concentration of a HAP to be lower than 1/100 of the TLV-TWA and the
annual average emission concentration to be lower than 1/420 of the TLV-TWA. In other words,
the 8-hour ammonia concentration must be below 177 µg/m3
and the annual average ammonia
concentration must be below 42.2 µg/m3.
KE modeled the ammonia concentrations for 1-hour and annual time averages. For the model
inputs, the stack parameters remained the same. The emission rate used for the 1-hour time
average was 0.257 g/s which reflects the boiler firing on coal at peak load, 77 MMBtu/hr, and the
Page 23
8/7/2019 Ethanol manufacturing
http://slidepdf.com/reader/full/ethanol-manufacturing 23/26
23 of 25
ammonia slip at 20 ppmvd at 3 percent O2. The emission rate used for the annual concentration
was 0.224 g/s which was calculated assuming 1,045 hours of peak operation (77 MMBtu/hr) and
7,315 hours of continuous operation (70 MMBtu/hr).
The predicted 1-hour maximum concentration was 7.68 µg/m3. Using a scaling factor of 0.7 to
convert the 1-hour average to an 8-hour average, the 8-hour average concentration for ammonia
was 5.38 µg/m3. The predicted 8-hour average for ammonia is much less than the 1/100 of the
TLV-TWA.
5.4 µg/m3 << 177 µg/m3
The model predicted the maximum annual concentration for ammonia was 0.10 µg/m3
and is
much less than the 1/420 of the TLV-TWA.
0.10 µg/m3
<< 42.2 µg/m3
The predicted 8-hour average and annual average ammonia concentrations are much less than the
significant ambient air concentration specified in HAR §11-60.1-179. As such, it can be
concluded that the ammonia emissions will not adversely impact the surrounding ambient air
quality.
Other Issues:
Support Facility
The KE ethanol production plant will be located next to the Gay and Robinson (G&R) sugar mill
on Kauai. There are ownership overlaps that between G&R and KE that can be construed as
common ownership and control. As such, since molasses will be the feedstock for the ethanol
production, the issue of the sugar mill being a support facility needs to be addressed.
As defined in 40 CFR §52.21(b)(5), a stationary source is defined as any building, structure,
facility, or installation which emits or may emit any air pollutant subject to regulation under the
Act . The terms building, structure, facility, or installation are defined in 40 CFR§52.21 (b) asall
of the pollutant-emitting activities which belong to the same industrial grouping, are located on
one or more contiguous or adjacent properties, and are under the control of the same person (or
persons under common control) except the activities of any vessel. Pollutant-emitting activities
shall be considered as part of the same industrial grouping if they belong to the same "Major
Group" (i.e. which have the same first two digit code) as described in the Standard Industrial
Classification Manual . . .. In essence, a support facility must be deemed a building, structure,
facility, or installation as defined above and all of the pollutant-emitting activities must meet all
of the following criteria:
Page 24
8/7/2019 Ethanol manufacturing
http://slidepdf.com/reader/full/ethanol-manufacturing 24/26
24 of 25
1. must belong to the same "Major Group" as defined in the Standard Industrial
Classification Manual (SIC);
2. must be located on one or more contiguous or adjacent properties; and
3. must be under common control.
If any of the criteria are not met, then the facilities are considered separate stationary sources for
regulatory purposes.
The SIC code is a system for classifying businesses by the type of economic activities its'
engaged in. The classification of an emission unit or pollutant-emitting activity is based on the
primary activity which an emissions unit is able to introduce a principle product into commerce
or provide a service. G&R's principle activity is sugar refining, SIC 2062, and the principle
product is sugar. KE's principle activity is the production of ethanol, SIC 2869, and the principle
product is ethanol. Since the SIC codes are not of the same major group, G&R's sugar mill and
KE's ethanol production plant should not be considered as one stationary source.
However, there are instances where sources from different major groups are considered as one
source. In all instances the support facility contributed fifty percent or more of its' inputs or
outputs to another source. One of the criterion that the U.S. EPA is proposing to use in its'
definition of "Support Facility" is that a facility whose operation is integrally related to another
facility's activities such that fifty percent of more of the facility's inputs or outputs are dedicated
to activities at the other facility. Currently G&R produces 55,000 tons per year of sugar and
15,000 tons of molasses. Molasses is a by-product of the sugar refining process and represents
20 percent of the sugar mill sales. G&R currently ships the molasses to California where it is
sold as cattle feed or ethanol feedstock. Although KE will purchase all of G&R's molasses, the
15,000 tons of molasses represents only 12 percent of KE's projected annual feedstock. Since
KE needs to purchase more than 80 percent of the feedstock from outside sources, KE's ethanol
production facility is not totally dependent upon G&R's sugar mill and further, the ethanol
production facility could continue to operate if G&R's sugar mill shuts down. This
non-dependency makes it difficult to classify G&R's sugar mill as a support facility. With this
information, it is determined that G&R's sugar mill is not a support facility of KE's ethanol
production facility.
Emission Limits for the Steam Boiler
The emission limits for the steam boiler while firing on coal were determined from the BACT
analysis and AP-42 tables. KE used these emission limits in estimating the total emissions.
When estimating the total emission from the steam boiler while firing liquid fuels, KE proposed
to use the same BACT emission limit for NOX and SOX. As discussed in the BACT section
Page 25
8/7/2019 Ethanol manufacturing
http://slidepdf.com/reader/full/ethanol-manufacturing 25/26
25 of 25
above, the Department will reluctantly accept these limits, but will revise the limits once the
initial source performance test has been completed. In estimating the VOC emissions, KE used a
much higher emission rate than that listed in the AP-42. In determining the emission limit for
VOCs while firing on liquid fuels, the AP-42 emission factor for used oil was used. This
emission rate is higher than the AP-42 emission rate for fuel oil no. 2, but is much lower than the
emission rate used by KE in estimating emissions.
The proposed ammonia slip rate of 20 ppmvd at 3 percent O2 is slightly high as compared to
reported ammonia slip rates for similar systems. Typical ammonia slip rates for SCR/SNCR are
below 5 ppmvd at 15 percent O2. Excess ammonia slip is not desirable because the excess
ammonia will react with other pollutants, such as sulfur, to form undesirable compounds, such as
ammonium bisulfate. Ammonium bisulfate is a sticky, tar-like compound that accumulates on
the ductwork and heat recovery surfaces down stream. In short, excessive ammonia slip
increases operational and maintenance costs and at high slip rates, increases the opacity and
exhaust plume density. With that, the Department will agree to the proposed maximum
allowable ammonia emission rate.
Conclusion and Recommendation:
KE is proposing to build the first ethanol plant in the state on the island of Kauai. The
production process and associated emission units will utilize add-on pollution control devices.
The main emission unit is the steam generator which will provide process steam and electricity.
The steam generator will be fired primarily upon coal and will use lime injection , SNCR, and a
baghouse to control emissions. Emissions from the production and distribution of ethanol will
be controlled by sieve tray scrubbers and a vapor combustion unit. Although emissions were
based heavily upon manufacturer guarantees, the initial source performance tests should validate
the manufacturers' guarantees. Additionally, as stated previously, the Department will reevaluate
the maximum allowable emission rates after the initial source performance test and subsequent
annual source performance tests.
Issuance of a Covered Source Permit is recommended based on the information provided by the
applicant.
Page 26
8/7/2019 Ethanol manufacturing
http://slidepdf.com/reader/full/ethanol-manufacturing 26/26
Appendix
Emissions Calculations