ETHIOPIA ECONOMIC UPDATE OVERCOMING INFLATION, RAISING COMPETITIVENESS the World Bank Public Disclosure Authorized Public Disclosure Authorized Public Disclosure Authorized Public Disclosure Authorized Public Disclosure Authorized Public Disclosure Authorized Public Disclosure Authorized Public Disclosure Authorized
List of Acronyms ........................................................................................................................................ v
Economic ovErviEw .................................................................................................................................. 1The External Sector ...................................................................................................................................................2Fiscal Policy ...............................................................................................................................................................7The Growth and Transformation Plan (GTP) ............................................................................................................9Monetary Policy ......................................................................................................................................................10Inflation Rate ..........................................................................................................................................................11
in dEpth: infLAtion And its impAct on thE poor .................................................................. 15Background .............................................................................................................................................................15The 2010/11 Inflation Situation in Ethiopia ............................................................................................................16Distributive Impact of the Rise in Consumer Prices between July 2010 and October 2011 .....................................18
in dEpth: AggLomErAtion And compEtitivEnEss in EthiopiA ........................................ 25Agglomeration and Economic Growth ....................................................................................................................25Financing the Development of Addis Ababa ............................................................................................................27Improving Competitiveness in Ethiopia ...................................................................................................................29Lessons from East Asian Experiences .......................................................................................................................31Specific Recommendations to Increase Ethiopia’s Competitiveness in Light Manufacturing ....................................32Summary: Unfolding the Potential of a Thriving Economy .....................................................................................39
List of BoxEsBox 1: Ethiopia’s Development Experience Compared to China and Korea: Selected Indicators and Policies .................4Box 2: Ethiopia’s Services Exports ..................................................................................................................................8Box 3: Welfare Impact of Recent Price Shocks in Ethiopia based on Nationally Representative Datasets .....................16Box 4: Impact of Inflation: Methodology and Data .....................................................................................................18Box 5: Increases of Electricity Tariffs in Ethiopia – Insights on the Possible Effects on the Poor ...................................20Box 6: Business Services to Improve Competitiveness ..................................................................................................31Box 7: Korea’s Experience in Special Economic Zones: Masan Free Export Zone ........................................................34Box 8: Privatization Strategies in China and Korea ......................................................................................................35
List of figurEsFigure 1: Ethiopia GDP Growth Rates, 2004 to 2011 ...................................................................................................1Figure 2: Ethiopian Exports by Commodity Groups, 2010/11 vs. 2011/12 ...................................................................2Figure 3: Ethiopian Imports, by Import Categories, 2010/11 vs. 2011/12 .....................................................................3Figure 4: Development of the Exchange Rate in Ethiopia ..............................................................................................7
Figure 5: Services Exports from Ethiopia .......................................................................................................................8Figure 6: Ethiopia’s fiscal deficit and debt, 2009/10 to 2011/12 ....................................................................................9Figure 7: Base and Broad Money Growth in Ethiopia, Jul/Nov 2010 to May 2012 .....................................................11Figure 8: Inflation Rate in Ethiopia, Jan 2005 to Oct 2012 .........................................................................................12Figure 9: Inflation and GDP Growth Rates in China, 1991–2010 ..............................................................................12Figure 10: Inflation Rates in Ethiopia, Jan 2001 to Oct 2011 ......................................................................................17Figure 11: Food Prices between Jul 2010 and Oct 2011, by Item and Region, Percentage Change ..............................17Figure 12: Consumer Prices, Food Indices (2000 = 100) .............................................................................................18Figure 13: Comparison of Average Effective Inflation Rates .........................................................................................22Figure 14: Effective Inflation Rates between July 2010 and October 2011,
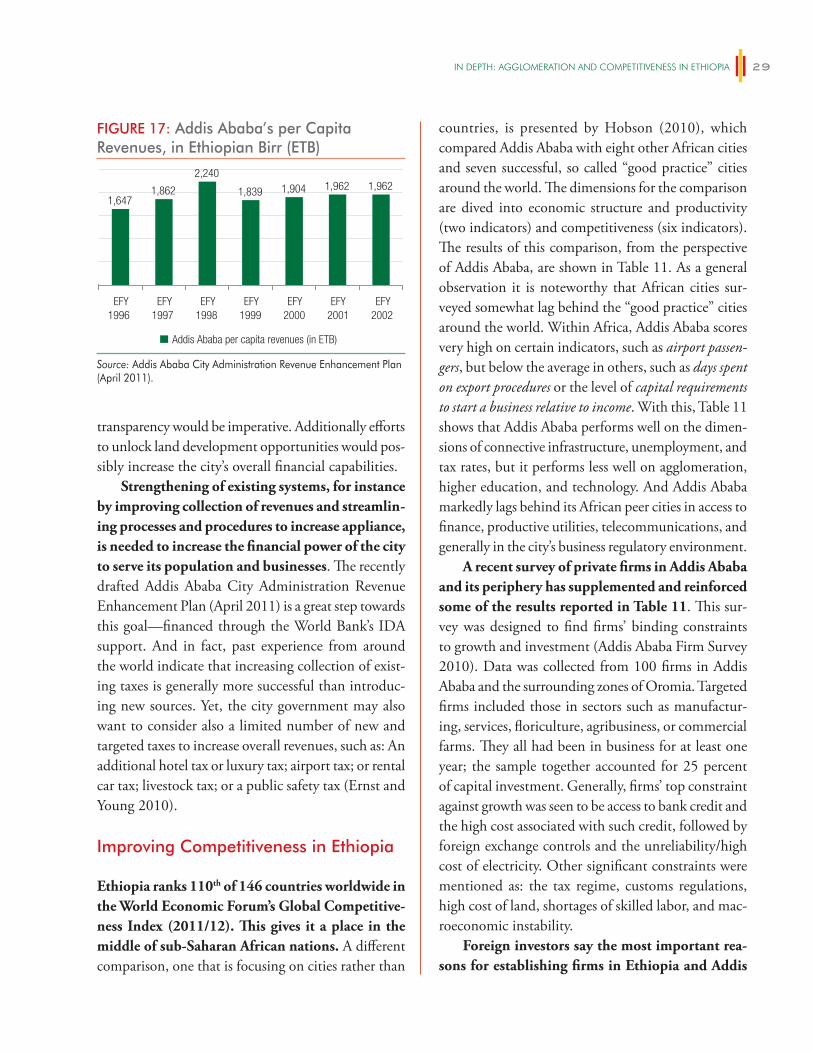
by Region, Average and Min and Max by Quintile, based on HICES 2004/05 ..........................................23Figure 15: Addis Ababa’s Economic Density Compared to its Immediate Neighbors ...................................................26Figure 16: Addis Ababa’s Economic Density Compared to Selected International Cities ..............................................26Figure 17: Addis Ababa’s per Capita Revenues, in Ethiopian Birr (ETB) ......................................................................29Figure 18: Average productivity of users vs. non-users of IT and professional services in Ethiopia ...............................31Figure 19: Development Trends in Masan FEZ (Korea) ...............................................................................................34
List of tABLEsTable 1: Population below the National Poverty Line (less than US$0.6 per day) ..........................................................2Table 2: Ethiopia, China, Korea, and Vietnam: Main Growth Periods and their Indicators ...........................................4Table 3: A Comparison of Chinese and Ethiopian FDI Regulation ...............................................................................5Table 4: Total Service Trade and Service Subsector as a Share of Total Trade, 2000–2010 ..............................................8Table 5: Revealed Comparative Advantage of Ethiopia’s Services Exports in Selected Subsectors ....................................9Table 6: Selected Macroeconomic Targets of the GTP .................................................................................................10Table 7: Self-food Expenditure as Share of Total Food Expenditure, 2005 ...................................................................19Table 8: Food Expenditure Share by Area and Poverty Status .......................................................................................19Table 9: Simulated Changes in Poverty Indices due to Electricity Tariff Adjustments, Three Scenarios, 2005/06 .........21Table 10: Food Expenditure Share by Area and Quintiles of the Population ................................................................23Table 11: Addis Ababa’s Competitiveness Relative to 8 other African Cities .................................................................30Table 12: Challenges for Manufacturers in Six Selected Ethiopian Industries, 2010 .....................................................32Table 13: Productivity and Cost-related Constraints for Firms and Industries in Ethiopia, 2010 .................................32
KEPCO Korea Electric Power CompanyKT Korea Telecom CorporationMOFED Ministry of Finance and Economic
DevelopmentNBE National Bank of EthiopiaNEER Nominal Effective Exchange RatePOSCO Pohang Steel and Iron CorporationRCA Revealed Competitive AdvantageREER Real Effective Exchange RateSADC Southern African Development
CommunitySEZ Special Economic ZoneSNNPR Southern Nations, Nationalities,
and People‘s RegionSOE State-owned EnterpriseSSA Sub-Saharan AfricaUS United StatesVAT Value Added TaxWTO World Trade OrganizationMoFED Ministry of Finace and Economic
DevelopmentNBE National Bank of Ethiopia
AACAREP Addis Ababa City Administration Revenue Enhancement Plan
COMESA Common Market for Eastern and Southern Africa
CSA Central Statistics Agency of Ethiopia
EAC East African CommunityEEPCO Ethiopia Electric Power CompanyEFY Ethiopian Fiscal YearETB Ethiopian Birr (currency)EU European UnionFDI Foreign Direct InvestmentFEZ Free Export ZoneFIE Foreign Invested EnterpriseFTA Free Trade AgreementGDP Gross Domestic ProductGoE Government of EthiopiaGTP Growth and Transformation PlanHICES Household Income Consumption
and Expenditure SurveyIMF International Monetary FundJV Joint Venture
list of acronyms
Economic ovErviEw
and government-led development investments. The initial double digits growth rates have now manifested slightly lower but remain at high single-digit levels. The economy is expected to stabilize at around seven to eight percent in 2012, largely owing to improved performance in the agriculture sector. GDP growth is likely to stay around that margin up until 2016 (EFY 2008) driven by rising foreign investment and exports (Economist Intelligence Unit 2012).
High inflation persists, but is on a slightly decreasing trend. Headline inflation rates, which were beyond 33 percent on average over the full year 2011, started to ease at the end of last year, and reached 29.8 percent in April, stood at 20.8 percent in June and 20.2 percent in August 2012. It was 15.8 percent in October 2012. The reduction in inflation rates reflects the tightening fiscal stance and monetary base growth induced by the Government of Ethiopia (GoE) in the second and third quarters of 2011.
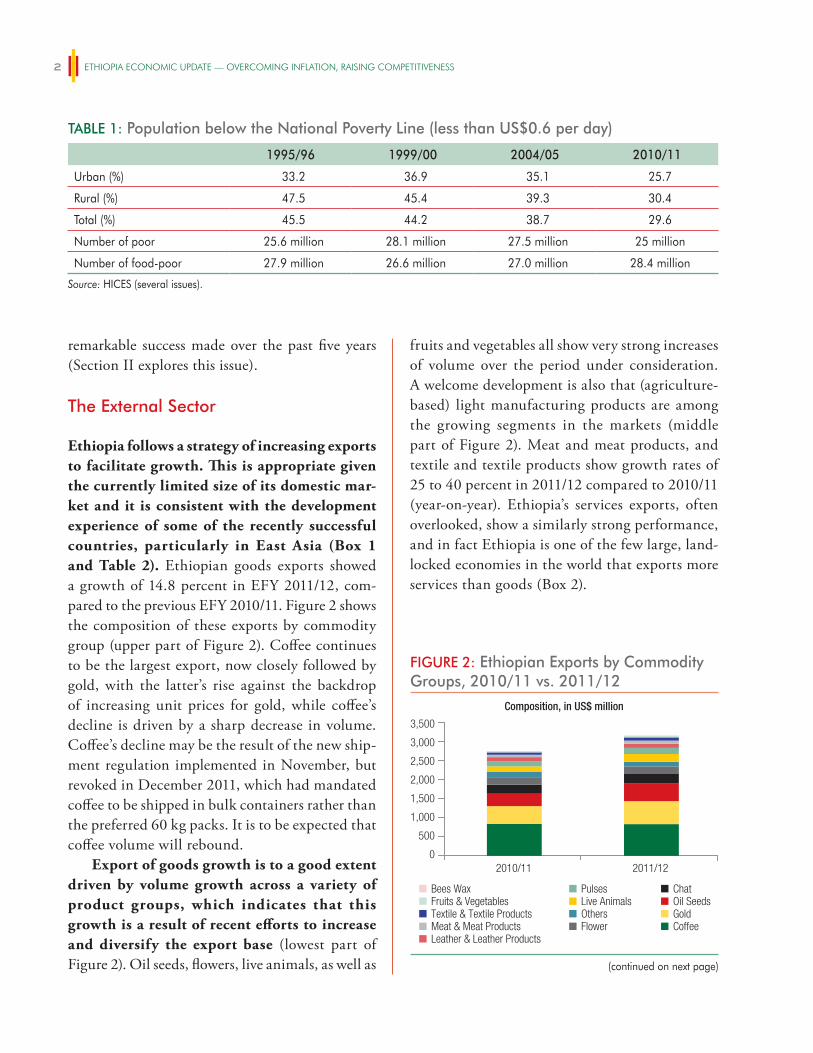
Economic growth brought with it positive trends in reducing poverty, in both urban and rural areas. While 38.7 percent of Ethiopians lived in extreme poverty in 2004/05, five years later this was 29.6 percent, which is a decrease of 9.1 percentage points as measured according the national poverty line, of less than US$0.6 per day (see Table 1). Using the Growth and Trans-formation Plan (GTP), the target is to reduce this further to 22.2 percent by 2014/15, which would be another decrease of 7.4 percentage points over five years. There is some concern that the recent and high inflation rates would reverse some of this
Since 2004 (Ethiopian Fiscal Year (EFY) 1997), Ethiopia has experienced strong and generally broad-based real economic growth
of around 10.6 percent on average between then and 2011(Figure 1). Growth over the last nine years was far beyond the growth rates recorded in aggre-gate terms for Sub-Saharan Africa (SSA), which on average only reached 5.2 percent, less than half of Ethiopia’s average real GDP growth rate during that period. Inspired by the East Asian experiences (see Box 1 for a comparison of selected indicators and policies of Ethiopia and China/Korea),1 growth was induced through a mix of factors including agri-cultural modernization, the development of new export sectors, strong global commodity demand,
1
Figure 1: ethiopia gDP growth rates, 2004 to 2011
Ethiopia real GDP growth (annual %)Ethiopia real GDP per capita growth (annual %)
SSA real GDP growth (annual %)
SSA real GDP per capita growth (annual %)
–2%0%2%4%6%8%
10%12%14%16%
2004 2005 2006 2007 2008 2009 2010 2011
Source: World Bank, World Development Indicators (2012); and IMF, World Economic Outlook (2011).Note: World Bank staff estimate for SSA real GDP per capita growth in 2011. Government growth estimates and projections differ for 2010/11 and beyond and are above 11% per year (e.g.: 2010/11 estimate 11.4%, and 2012/13). 1 Korea in this document refers to the Republic of Korea.
fruits and vegetables all show very strong increases of volume over the period under consideration. A welcome development is also that (agriculture-based) light manufacturing products are among the growing segments in the markets (middle part of Figure 2). Meat and meat products, and textile and textile products show growth rates of 25 to 40 percent in 2011/12 compared to 2010/11 (year-on-year). Ethiopia’s services exports, often overlooked, show a similarly strong performance, and in fact Ethiopia is one of the few large, land-locked economies in the world that exports more services than goods (Box 2).
remarkable success made over the past five years (Section II explores this issue).
The external Sector
Ethiopia follows a strategy of increasing exports to facilitate growth. This is appropriate given the currently limited size of its domestic mar-ket and it is consistent with the development experience of some of the recently successful countries, particularly in East Asia (Box 1 and Table 2). Ethiopian goods exports showed a growth of 14.8 percent in EFY 2011/12, com-pared to the previous EFY 2010/11. Figure 2 shows the composition of these exports by commodity group (upper part of Figure 2). Coffee continues to be the largest export, now closely followed by gold, with the latter’s rise against the backdrop of increasing unit prices for gold, while coffee’s decline is driven by a sharp decrease in volume. Coffee’s decline may be the result of the new ship-ment regulation implemented in November, but revoked in December 2011, which had mandated coffee to be shipped in bulk containers rather than the preferred 60 kg packs. It is to be expected that coffee volume will rebound.
Export of goods growth is to a good extent driven by volume growth across a variety of product groups, which indicates that this growth is a result of recent efforts to increase and diversify the export base (lowest part of Figure 2). Oil seeds, flowers, live animals, as well as
Table 1: Population below the National Poverty line (less than uS$0.6 per day)
1995/96 1999/00 2004/05 2010/11
Urban (%) 33.2 36.9 35.1 25.7
Rural (%) 47.5 45.4 39.3 30.4
Total (%) 45.5 44.2 38.7 29.6
Number of poor 25.6 million 28.1 million 27.5 million 25 million
Number of food-poor 27.9 million 26.6 million 27.0 million 28.4 million
Source: HICES (several issues).
Figure 2: ethiopian exports by Commodity groups, 2010/11 vs. 2011/12
0
Composition, in US$ million
3,000
3,500
2,000
2,500
1,000
1,500
500
2010/11 2011/12
Growth by Product Group
Change in Unit Price Change in Volume
CoffeeChat
FlowerLeather & Leather Products
Meat & Meat ProductsGold
–10% 0% 20%10% 30% 40% 50%
Changes in Unit Price and Volume by selected Product Groups
Coffee
PulsesChat
Flower
Leather & Leather
Meat & Meat Products
Oil Seeds
Live Animals
Gold
Fruits & Vegetables
–20% 0% 20% 40% 60%
CoffeeGold
ChatOil Seeds
OthersFlower
Live AnimalsPulses
Leather & Leather Products
Textile & Textile Products
Textile & Textile Products
Meat & Meat Products
Fruits & VegetablesBees Wax
Pulses
Oil Seeds
Live AnimalsFruits & Vegetables
(continued on next page)
Economic ovErviEw 3
Overall export and import developments result in a significantly increased trade deficit by 43 percent, up from US$5.5 billion in 2010/11 to US$7.9 billion. The trade balance is in deficit due to the large recovery of imports (33 percent) against a rise in exports of 14.8 percent. Likewise, the current account balance is negative, even though it had improved temporarily in 2010/11, when it recorded a small surplus. This was owed to a significant decline in imports of capital and consumer goods, reflecting a temporary slowing of investment activities. Yet, all import categories have recovered since. Thus, the current account turned into deficit again (around US$2.4 billion), and is likely to stay there given the import requirements of the GTP and increasing demand for imported consumer goods. The current account balance also represents the excess of investment over savings (see Table 2), which is substantial given the very low level of domestic savings (Box 1).
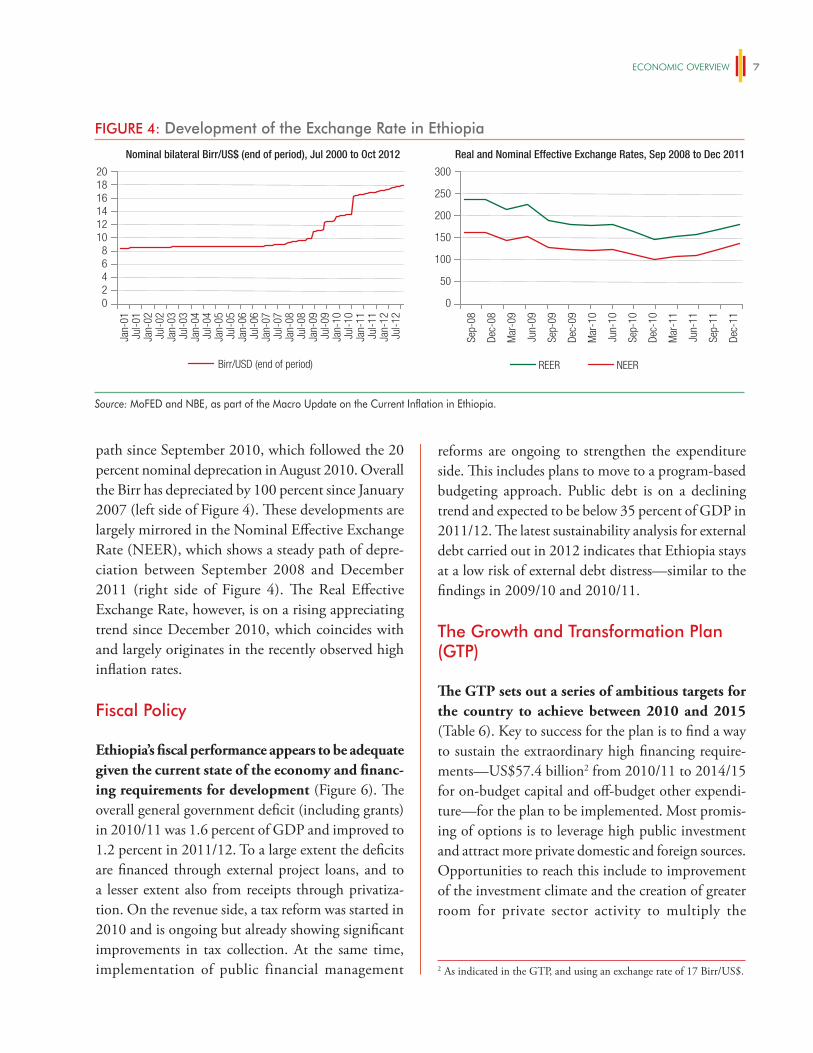
The nominal bilateral exchange to the US$ hit its preliminary high in October 2012 with Birr/US$ 18.0. The rate keeps on its steady deprecation
Figure 2: ethiopian exports by commodity groups, 2010/11 vs. 2011/12 (continued)
0
Composition, in US$ million
3,000
3,500
2,000
2,500
1,000
1,500
500
2010/11 2011/12
Growth by Product Group
Change in Unit Price Change in Volume
CoffeeChat
FlowerLeather & Leather Products
Meat & Meat ProductsGold
–10% 0% 20%10% 30% 40% 50%
Changes in Unit Price and Volume by selected Product Groups
Coffee
PulsesChat
Flower
Leather & Leather
Meat & Meat Products
Oil Seeds
Live Animals
Gold
Fruits & Vegetables
–20% 0% 20% 40% 60%
CoffeeGold
ChatOil Seeds
OthersFlower
Live AnimalsPulses
Leather & Leather Products
Textile & Textile Products
Textile & Textile Products
Meat & Meat Products
Fruits & VegetablesBees Wax
Pulses
Oil Seeds
Live AnimalsFruits & Vegetables
Source: MoFED and NBE, as part of the Macro Update on the Current Inflation in Ethiopia.
Ethiopian annual goods imports increased by 33.5 percent in 2011/12. Capital goods is the only major import category that recorded less than 8 percent growth (Figure 3). Within capital goods, industrial goods showed a marginal increase of 1.3 percent, while transport and agricultural capital goods increased strongly with 17.7 and 87.7 percent, respec-tively. The latter is an important driver to facilitate export diversification into agricultural based light manufacturing. The growth rate recorded for con-sumer goods is high with 54 percent. This, however, is mainly driven by non-durable food imports such as cereals (increase of 233 percent) and other food items (increase by 53 percent). The largest portion of durable imports are vehicles, which increased by 24 percent.
Figure 3: ethiopian imports, by import Categories, 2010/11 vs. 2011/12
Growth by categories (in %) Overall growth (in %)
10%
0%
20%
30%
40%
50%
60%
70%
80%
90%
Raw
Mat
eria
ls
Sem
i-fin
ishe
dGo
ods
Fuel
Capi
tal
Good
s
Cons
umer
Good
s
Mis
cella
neou
s
Source: MoFED and NBE, as part of the Macro Update on the Current Inflation in Ethiopia.
box 1: ethiopia’s Development experience Compared to China and Korea: Selected indicators and Policies
overview
Ethiopia’s development policies are clearly inspired by the success of East Asian countries, and particular the two high growth countries from the past and the present, the Republic of Korea and the People’s Republic of China (New African 2011 and The Africa Report 2012). Given this focus, insight is provided by a look at some of the indicators and policies that are currently carried out in Ethiopia and comparing them to the same outcomes during growth periods of Korea and China (and for reference also to Vietnam and the US). This box makes
those comparisons. Table 2 shows a total of seven indicators in Ethiopia between 2004 and 2010—the seven years in which GDP per capita grew at the very high level of 8.6 percent per year. This is unique for Ethiopia, but not unusually high in the overall development experience of countries. China I from 1982 to 1988 and China II from 1991 to 2010 showed 9.9 and 9.6 percent GDP per capita growth respectively. Likewise, Korea reached GDP per capita rates of 7.0 and 7.3 percent during the 1968 and 1979 period (Korea I) as well as from 1982 to 1996 (Korea II). All these growth periods were identified by consecutive years of GDP per capita growth exceeding five percent per year.
Table 2: ethiopia, China, Korea, and Vietnam: Main growth Periods and their indicators
Cou
ntry
Tim
e
gD
P pe
r ca
pita
*
infla
tion
rate
*
expo
rts*
*
inve
stm
ent*
*
Fore
ign
Dire
ct
inve
stm
ent*
*
gro
ss
dom
estic
sa
ving
s**
Tota
l re
serv
es**
*
Ethiopia 2004–2010 8.6 15.1 12.9 22.9 2.0 3.2 2.5
Korea I 1968–1979 (Break in 1972/75)
7.0 14.6 22.6 26.8 0.2 21.1 na
Korea II 1982–1996 (Break in 1992)
7.3 5.2 30.9 33.1 0.3 34.3 1.8
China I 1982–1988 9.9 na 11.5 30.0 0.6 35.7 7.7
China II 1991–2010 9.6 4.8 26.0 37.0 3.9 44.1. 11.1
Vietnam 2000–2010(Break in 2009)
6.0 6.9 66.8 33.1 5.7 28.3 2.7
Memo:
US 1970–2010 1.8 4.5 9.4 18.6 0.9 17.0 2.6
SE Asia**** 1981–2000 4.3 5.3 78.7 31.5 4.5 36.0 4.1
Source: World Bank staff own calculations, based on World Development Indicators (WDI).Notes: Time definition: GDP per capita growth exceeding 5 percent per year.* average % per year** average per year in % of GDP*** in months of export**** Indonesia, Singapore, Malaysia, and Thailand
investment
Investment rates (measured by gross fixed capital formation) reached an average of 22.9 percent of GDP per year of the
seven years under consideration. This is just short of investment rates in Korea I, but it is markedly lower than investment rates in Korea II, China I and China II, which were all above 30 percent of GDP. It is clear from Table 2, that high investment
Economic ovErviEw 5
(continued on next page)
ratios in China and Korea were (and are) driven by high gross savings rates—in China II beyond 40 percent of GDP, and beyond 30 percent in both Korea I and Korea II. In contrast, Ethiopia’s gross savings rate was a mere 3.2 percent in the period 2004 to 2010. Total reserves are relatively lower than in China, and by not small margins, mainly because the Chinese reserve accumulation was driven by a heavily managed and somewhat undervalued exchange rate. In Ethiopia, however, the exchange rate tends to be overvalued and hence has been on a deprecation path since 2007/08, with limitation of further depreciation due to the practice of selling foreign exchange in the market to soak up liquidity in much of 2011/12.
Foreign Direct investment (FDi)
FDI in percentage of GDP in Ethiopia is at a relatively mid-level of 2.0 percent, higher than in Korea I and China I, both times of lower levels of globalization and generally lower FDI levels across the world than nowadays observable. During the overlapping period of China II with Ethiopia, however, there is a significant gap between the two countries: China’s FDI in percentage of GDP reached 3.9 percent, which was double the value of Ethiopia’s. Vietnam stands out with 5.7 percent of GDP for incoming FDI between 2000 and 2010. FDI is not only important to sustain high investment rates, a key feature of the East Asian development experience, but also for knowledge and technology transfer.
Table 3 compares the FDI policies of the 1990s in China with the current policies in Ethiopia. FDI policies in China had a
largely decentralized character that allowed local authorities to attract foreign investors through localized incentives. While this is partly also the case in Ethiopia, where regional governments can provide variations in local incentive packages, such as in the area of land access, the general FDI regime seems to be more centralized in nature. This is a difference by design due to the rather low capacity of regional governments; in fact, according to the federal government, regional states requested the federal level to administer FDI issues to overcome those capacity constraints. Another difference is the openness of the economy as such. In China in the 1990s, geographical and sectoral restrictions had been largely eliminated, while in Ethiopia 25 sectors are still closed for foreign investments. It is to be expected, however, that an opening up of various sectors could come about once the ongoing WTO accession negotiations of Ethiopia are finalized.
Based on policies observed in China in the 1990s, there are a series of “quick-wins” that could be used to increase the potential for FDI inflows into Ethiopia. These could entail: decentralizing the approval authority of small-scale FDI projects to the provincial level; introducing more discretional power for local levels to negotiate the terms and incentives; providing more longer-term incentives such as favorable taxation in special economic zones (SEZs), which currently is time bound; encouraging more joint-ventures to happen between state-owned enterprises (SOEs) and foreign investment enterprises (FIEs) to enhance technological transfer; and to broaden the FDI base by opening-up more sectors
box 1: ethiopia’s Development experience Compared to China and Korea: Selected indicators and Policies (continued)
FDi policies in China in the 1990s
Since 1978, China has implemented a series of policies and regulations to attract foreign direct investment (FDI). With rapid economic development and lessons learned, the focus of these policies evolved from quantity to quality. At the beginning of Reform and Opening-up Policy in late 70s to early 80s, China’s strategy was attracting FDI by establishing Special Economic Zones with preferential policies towards FDI. This period is characterized by a top-down policy targeting at reform and opening up. From late 80s to early 90s, China’s FDI policy focused on increasing its volume by establishing more Economic Development Zones and formulating preferential policies in the aspects of tax, land leasing fees, labor fees and profit distribution. Since 1993, China became the second largest outward FDI destination country after the US. Since that time, China’s strategy on FDI changed so that the focus was on the quality of FDI. Policies were formulated to direct FDI into strategic sectors, including agriculture, energy, transport, new material, and new technology. In addition, special attention was paid to setting up research and development centers for technology transfer. From the joining of the World Trade Organization (WTO) to the present, China has emphasized on attracting new technology, human capital and management methods. Since 2010, in response to the initiative on industrial upgrade, new policies are directing FDI to provinces in Western China.
Source: Xiao and Zhao (1998); MOFCOM (2012); and China FDI (2012).
Developments in the savings rate in Ethiopia is one of the areas in Table 2 where a fundamental difference to the Chinese and Korean growth periods can be observed. Gross domestic savings—as reported in the World Development Indicators—in both East Asian countries were beyond 25 percent of GDP and even close to 45 percent of GDP in the case of China II (in Vietnam 28.3 percent of GDP). In contrast, in Ethiopia the gross savings rate was a mere 3.2 percent in the period between 2004 and 2010 (there are indications that this has increased to levels between 9 and 13 percent in 2011/12). On the other hand, and given the ambitious investment program in the current GTP, which is clearly inspired by the East Asian experience, the investment rates in Ethiopia are expected to get closer to the ones observed in China and Korea. To achieve this, however, more domestic resource mobilization than in the past is required. A higher gross domestic savings rate would be an integral part of such an approach. In fact, it will be impossible to follow the East Asian experience of high investment-cum-state-led development policy if the savings rate is close to the one in the US.
Academic literature widely agrees that saving behavior can be explained by income growth beyond subsistence level of consumption, demographic change and, to a lesser degree, the level of financial development. The superb saving performances in China and Korea can be mostly explained by these factors. Even though Ethiopia achieved high income growth it is striking that the country has not reached the subsistence level beyond which people start to save in earnest. Much more, the level of financial development in Ethiopia, often measured by the extent of monetization and the real
interest rate, indicates that persistent negative real interest rates in fact have reduced the private savings rate further. In Korea, on the other hand, the authorities managed to maintain positive real interest rates through much of the development period by keeping inflation low and flexibly adjusting nominal interest rates; and this was achieved even during the two oil shock periods in the 1970s. Looking at China, gives another example of keeping inflation low even during very high growth periods. The write-up of the main text about inflation provides some insights on that above.
Trade and industrial Policy
Exports played a major role in the East Asian development experience, and developing a larger export base in an overall market system provides a unique opportunity for Ethiopia. But Table 2 shows that the country’s exports measured in percent of GDP really lack Korea’s experiences, and also China’s development path since the 1990s. China’s exports in the 1980s were not higher than Ethiopia’s are, which is not surprising given the large focus on domestic agriculture in China in the 1980s. Ethiopia has had a similar focus on the beginning of its reforms a decade ago, but it is time to shift gears for another level. Section III of this Economic Update provides various insights of a recent analysis carried out to identify growth sectors in light manufacturing as a way to respond to the relatively low levels of exports in Ethiopia. There are six sectors (garment, leather products, wood products, metal products, wheat flour, and processed milk), which could lead the way based on the insight that industries can be developed if a country identifies and follows its comparative advantage in an overall market environment.
box 1: ethiopia’s Development experience Compared to China and Korea: Selected indicators and Policies (continued)
Table 3: a Comparison of Chinese and ethiopian FDi regulation
China in 1990s ethiopia now
Motivation and driver for the government to attract more FDI
• Private sector constrained by credits• Technology transfer• Focus on strategic industries
• Low savings rates in the economy at large• Technology transfer• Focus on strategic industries
• Rather centralized FDI approval framework• Rather centralized administration of incentives,
which are largely time bound (e.g. two-year tax holidays)
Benefits for foreign invested enterprises (FIE)
• Encourage joint-ventures (JVs) between state-owned enterprises (SOE) and FIEs
• Removable of geographic and sectoral restrictions on the FDI activities
• Improved private property rights protection
• Lower capital requirement for JVs, but JVs barely happen between SOEs and FIEs
• 25 sectors are still closed for foreign investors• Guarantee against expropriation
Source: World Bank staff compilation, based on Huang 1998, and EthioInvest 2012.
Economic ovErviEw 7
path since September 2010, which followed the 20 percent nominal deprecation in August 2010. Overall the Birr has depreciated by 100 percent since January 2007 (left side of Figure 4). These developments are largely mirrored in the Nominal Effective Exchange Rate (NEER), which shows a steady path of depre-ciation between September 2008 and December 2011 (right side of Figure 4). The Real Effective Exchange Rate, however, is on a rising appreciating trend since December 2010, which coincides with and largely originates in the recently observed high inflation rates.
Fiscal Policy
Ethiopia’s fiscal performance appears to be adequate given the current state of the economy and financ-ing requirements for development (Figure 6). The overall general government deficit (including grants) in 2010/11 was 1.6 percent of GDP and improved to 1.2 percent in 2011/12. To a large extent the deficits are financed through external project loans, and to a lesser extent also from receipts through privatiza-tion. On the revenue side, a tax reform was started in 2010 and is ongoing but already showing significant improvements in tax collection. At the same time, implementation of public financial management
reforms are ongoing to strengthen the expenditure side. This includes plans to move to a program-based budgeting approach. Public debt is on a declining trend and expected to be below 35 percent of GDP in 2011/12. The latest sustainability analysis for external debt carried out in 2012 indicates that Ethiopia stays at a low risk of external debt distress—similar to the findings in 2009/10 and 2010/11.
The growth and Transformation Plan (gTP)
The GTP sets out a series of ambitious targets for the country to achieve between 2010 and 2015 (Table 6). Key to success for the plan is to find a way to sustain the extraordinary high financing require-ments—US$57.4 billion2 from 2010/11 to 2014/15 for on-budget capital and off-budget other expendi-ture—for the plan to be implemented. Most promis-ing of options is to leverage high public investment and attract more private domestic and foreign sources. Opportunities to reach this include to improvement of the investment climate and the creation of greater room for private sector activity to multiply the
2 As indicated in the GTP, and using an exchange rate of 17 Birr/US$.
Figure 4: Development of the exchange rate in ethiopia
0 0
Nominal bilateral Birr/US$ (end of period), Jul 2000 to Oct 2012 Real and Nominal Effective Exchange Rates, Sep 2008 to Dec 2011
Birr/USD (end of period)
2468
101214161820
50
100
150
200
250
300
REER NEER
Dec-
08
Mar
-09
Jun-
09
Sep-
08
Dec-
09
Mar
-10
Jun-
10
Sep-
09
Dec-
10
Mar
-11
Jun-
11
Sep-
10
Dec-
11
Sep-
11
Jan-
01Ju
l-01
Jan-
02Ju
l-02
Jan-
03Ju
l-03
Jan-
04Ju
l-04
Jan-
05Ju
l-05
Jan-
06Ju
l-06
Jan-
07Ju
l-07
Jan-
08Ju
l-08
Jan-
09Ju
l-09
Jan-
10Ju
l-10
Jan-
11Ju
l-11
Jan-
12Ju
l-12
Source: MoFED and NBE, as part of the Macro Update on the Current Inflation in Ethiopia.
Ethiopia is one of the few large, land-locked economies in the world that exports more services than goods (left side of Figure 5). Also, in 2010 Ethiopia’s services exports as a percentage of GDP were higher than the ratios registered by countries at similar levels of development (right side of Figure 5). In the scatter diagram that plots each country‘s overall services openness measured as the percentage of services exports in GDP against its per capita income Ethiopia lies above the trend line, implying that the country’s services exports are
above the sample average conditional on the level of per capita income (despite a slight decrease in Ethiopia’s services exports between 2009 and 2010). Yet, there is widespread perception that the comparative advantage of a low-income country like Ethiopia lies in export of primary products and labor intensive, low-skill manufacturing goods. There has been, however, no rigorous assessment of Ethiopia’s capacity to become a niche player in global services market.
Figure 5: Services exports from ethiopia
% Serv X/Total X %Serv M/Total M
0%
10%
20%
30%
40%
50%
60%
70%
Ethiopia’s services exports and imports as shares of total exports and imports, 2000–2010 Service export openness and per capita income, 2010
Source: World Bank National Account Data (2012); and IMF Balance of Payment Statistics (2011).
Source: World Bank staff own calculations, based on IMF Balance of Payment Statistics (2011) and World Bank WDI (2012)
At this stage of development, Ethiopia’s services exports consist mainly of travel and transportation services, whereas the country tends to be less competitive in exporting higher value added services such as computer or business services. Table 4 presents the sectoral composition of services exports and the compound growth rate of several service subsectors from
2000 to 2010, while Table 5 shows the revealed comparative advantage (RCA) of Ethiopia’s services exports in selected subsectors. These facts confirm that Ethiopia has potential to develop its trade in services but the country has only just begun to take advantage of the growing opportunities awarded by global trade in business services.
Table 4: Total Service Trade and Service Subsector as a Share of Total Trade, 2000–2010
Service sectors 2000 2005 2010 Compound annual growth rates 2000–2010
Total Services exports (millions uS$) 506 1012 2244 16.1
Transportation (%) 42.5 46.0 52.4 18.5
Travel (%) 11.2 16.6 23.3 24.8
Communication services (%) 3.5 4.1 4.5 19.0
Construction services (%) 2.1 1.2 0.6 3.0
Insurance services (%) 0.2 0.5 0.2 12.5
Financial services (%) 0.7 2.5 0.0 –25.4
Computer & information services (%) 0.1 0.0 0.0 4.6
Other business services (%) 15.8 6.9 7.7 7.9
Source: World Bank staff own calculations, based on IMF Balance of Payment Statistics (2011).
(continued on next page)
Economic ovErviEw 9
box 2: ethiopia’s Services exports (continued)
Table 5: revealed Comparative advantage of ethiopia’s Services exports in Selected Subsectors
Service sectors rCa
Transportation 42.5
Travel 11.2
Communication services 3.5
Financial services 0.7
Computer & information services 15.8
Source: World Bank staff own calculations, based on IMF Balance of Payment Statistics (2011).
impact of the large public infrastructure program on growth, employment, and tax revenue. Likewise, more FDI inflows could fill some of the gap in domestic resources. In both areas—unleashing the private sector and attracting FDI—the experiences in East Asia, as discussed in Box 1, provide unique insights to better manage the transition.
There is an opportunity to adjust some poli-cies that are framing the environment for FDI into Ethiopia. Compared to China, for instance, in Ethiopia many of the incentives established for foreign investments seem to be more centralized nature, which may inhibit ability to respond flexibly to foreign needs
in making investment decisions. More decentralized decision-making of FDI projects could tap more into the local specifics through the provision of localized incentives. Likewise, the existence of a large number of sectors still closed to foreign investment could be rethought to provide greater opportunities for invest-ment from foreign sources.
There is another opportunity to trigger higher domestic savings through efforts to increase the real interest rate, which currently is negative. In fact, it will be impossible to follow the East Asian experi-ence of high investment-cum-state-led development policy, if the savings rate stays close to the one in the
Figure 6: ethiopia’s fiscal deficit and debt, 2009/10 to 2011/12
over the ten months from July 2011 to May 2012, base money declined by a total of ETB 5.9 billion or 8.5 percent. This was largely driven by a decline of the credits from the National Bank of Ethiopia to the Government.
While broad money growth has lowered its rate of increase compared to the previous year, it did not follow the declining trend seen in base money growth. Still, the high growth of broad money in 2010/11 was stopped (right side of Figure 7). Over ten months from July 2011 to May 2012, base money increased by 21 percent compared to 31 percent between November 2010 and June 2011. Still, the rates of increase in broad money originate from continued strong credit growth to public enterprises.
The lowering of the reserve requirement ratio by 5 percentage points is also indicative of a slightly looser stance of monetary policy. This move, which occurred in January 2012, may weaken the tightening effects on base money as it frees resources to increase lending through the banking system. This is a welcome policy change for private banks, which are subject to a restrictive policy that has, since April 2011, required them to hold certain levels of central bank bills. But it will also enable the Commercial Bank of Ethiopia to
US. Increasing the real interest rate would not only require higher nominal interest rates, but also better management of those rates to allow setting interest rates according to changes in the prevalent economic situation. Granting the central bank more flexibility in the management of the nominal interest rate is, for example, one of the Korean ingredients to maintaining its relatively high savings rate. Another insight from China is that a holistic plan for managing inflation makes a big difference during a transition period that could possibly extent beyond the central bank. In fact, given the current stage of Ethiopia’s development the Chinese experiences especially in the 1990s could be very relevant.
Monetary Policy
Starting July 2011 a policy was implemented to use base money (reserve money) as a nominal anchor for monetary policy and to stabilize base money growth for better inflation control. As a result, over the second half of 2011 the base money growth has reversed its previous trend (left side of Figure 7), after having increased by more than 42 percent from July 2010 to June 2011. In contrast,
Table 6: Selected Macroeconomic Targets of the gTP
Targets Start (2010) end (2015)
Real GDP growth 10.1 11.5
Real Per capita income (US$) 235.0 354.7
Inflation (%) 36.0 < 10.0
Share of total consumption in GDP (%) 90.6 82.6
Share of total national investment in GDP (%) 23.7 31.5
Share of total export in GDP (%) 10.5 12.5
Share of total import in GDP (%) 273.0 26.7
Share of national saving in GDP (%) 9.4 17.4
Share of national revenue in GDP (%) 12.9 17.3
Share of tax revenue in GDP (%) 9.7 15.3
Share of total poverty reduction expenditure in GDP (%) 12.5 14.2
Percentage of the population living below poverty line 29.6 22.2
Source: Growth and Transformation Plan of Ethiopia.
Economic ovErviEw 11
increase its lending volume, which in turn may refuel broad money growth.
inflation rate
Headline inflation rates in Ethiopia are largely driven by developments in food price inflation. Since 2005, there are two major spikes observ-able—in 2008 and 2011, respectively (Figure 8). In 2008, headline inflation peaked at 61.6 percent in August, driven by 79.2 percent in food price inflation; likewise, inflation in 2011 peaked at 40.7 and 40.2 percent in August and September, respectively, at a time when food inflation reached almost 50 percent. Food inflation kept rising to more than 50 percent in November 2011; but then headline inflation started to ease slowly already, driven by a tightening stance of monetary conditions (see Figure 7, which shows the stabilization of base money growth at the end of 2011).
Looking at non-food inflation, a measure of core inflation shows a relatively high “socket” level, which indicates that inflation in Ethiopia is not purely a food price problem. In both spikes of 2008 and 2011 non-food inflation passed 20 per-cent, yet did not hit the 30 percent marker. In the 84 months between January 2005 and December
2011, core inflation was between 10 and 20 percent in 34 months, and above 20 percent in 25 months. Non-food inflation could potentially have several drivers in Ethiopia and may include: the overall relatively high monetary growth in the system; the role of inflation expectations (which could be further fuelled by food price inflation); and cur-rency devaluation, which increases the prices for imported goods.
Recent high inflation rates are a particular concern for Ethiopia and its economy. Inflation has a negative impact on poverty, possibly pushing poverty up by as much as 0.5 percent for each increase in the inflation rate by 1 percent (Lopez, 2004). Fur-ther, inflation negatively affects the domestic savings rate, which for the past decade (2000–10) has been in single-digit levels (Table 2), as well as the private investment rate, both of which are vital to finance the much needed infrastructure in Ethiopia. Finally, it is important to note that high growth rates and low inflation rates are possible—as for instance is shown in many of the East Asian experiences in Table 2. Look-ing specifically at the case of China, Figure 9 provides a close illustration of this and shows that there really does not need to be a conflict between growth and inflation.
Figure 7: base and broad Money growth in ethiopia, Jul/Nov 2010 to May 2012
0
10,000
20,000
30,000
40,000
50,000
60,000
70,000
80,000
0
Base money growth Broad money growth
20,000
Currency in circulation Commercial Bank reserves with NBE
Base money (reserve money)
40,00060,00080,000
100,000120,000140,000160,000
200,000180,000
Money Quasi money Broad money
Nov-
10
Jun-
11
Jul-1
1
Aug-
11
Sep-
11
Oct-
11
Nov-
11
Dec-
11
Jan-
12
Feb-
12
Mar
-12
Apr-
12
May
-12
Jul-1
0
Jun-
11
Jul-1
1
Aug-
11
Sep-
11
Oct-
11
Nov-
11
Dec-
11
Jan-
12
Feb-
12
Mar
-12
Apr-
12
May
-12
Source: MoFED and NBE, as part of the Macro Update on the Current Inflation in Ethiopia.
Comparing experiences in Ethiopia again with developments in East Asia at times of simi-lar high growth rates shows that inflation rates in Ethiopia at the moment are indeed at a very high end (Box 1). In Korea, inflation between 1982 and 1996 was a mere 5.2 percent at a time with GDP per capita growth rates on average reaching 7.3 percent (Table 2). Likewise, in China between 1991 and 2010, inflation rates reached 4.8 percent with GDP per capita growing at 9.6 percent, even higher than the current rates in Ethiopia at 8.6 percent. This creates an opportunity to look at the developments there and draw lessons for Ethiopia on how to manage a high growth economy and at the same time keep inflation under control. In China the authorities, over much of the 1990s and into the new millennium, were able to manage the inflation rate with non-orthodox instruments that essentially freed monetary policy from the strict obligation of inflation control without sacrificing the inflation target as such (Flassbeck, Dullien, and Geiger 2005).
For instance in China, in order to keep inflation low in a high growth environment, monetary policy applied (and to some extent still applies) two broad sets of monetary policy instruments in an overall market environment but against the backdrop of a tightly managed exchange rate: There are instruments
of the central bank, and there are non-central bank policy instruments. The former includes price-based indirect and quantity-based direct instruments, and the latter includes non-central bank policy instruments, especially in the earlier years of the 1990s. There is no doubt that with the ever-increasing marketization of the economy in China, the simultaneous usage of all these instruments leads to various distortions that ultimately prevent monetary transmission to function properly and that a shift away from the current hybrid
Figure 8: inflation rate in ethiopia, Jan 2005 to oct 2012
Source: Central Statistics Agency of Ethiopia (CSA).
Figure 9: inflation and gDP growth rates in China, 1991–2010
GDP growth (%)Inflation rate (%)
0%
–5%
5%
10%
15%
20%
1991
1992
1993
1994
1995
1996
1997
1998
1999
2000
2001
2002
2003
2004
2005
2006
2007
2008
2009
2010
Source: World Bank, World Development Indicators.Note: 3 year moving average.
Economic ovErviEw 13
model is needed (Geiger 2010). However, given the current stage of Ethiopia’s development, the Chinese experiences in controlling inflation over much of its
development period and especially in the 1990s could well be very relevant.
background
As was described in the earlier section, Ethiopia experienced a strong acceleration in inflation in 2010 and 2011. While inflationary pressures have slightly, it is important to analyze the impact of the recent high inflation on poverty reduction efforts in Ethiopia. For the illustration and analysis in this sec-tion, data is being used from July 2010 to October 2011. During this period national consumer retail prices increased by 48 percent; rates at this magnitude call to mind the 2008 price shock; back then consumer prices rose by 72 percent between June 2007 and Sep-tember 2008. Comparing both situations—2011 and 2008—food prices saw even more marked upswings with increases by 60 and 100 percent, respectively.
High inflation poses a serious threat to pov-erty reduction and food security. High inflation causes protracted stress on household budgets and increases the vulnerability of any household, especially poor ones. In addition, coping behaviors of households, such as withdrawing children from school—even temporarily—might have long-term consequences. Moreover, despite some geographical differentiation, price shocks represent covariate shocks to which households and other community enti-ties have only limited ability to respond. Faced with repeated price shocks of such a magnitude in 2008 and 2011, Ethiopian households likely had compromised their ability to rely on sustainable and effective coping strategies, which in turn may have increased their risk of falling into a poverty trap.3 The combination of all these factors may have hindered(or halted) progress in rural poverty reduction, slowed down any improve-ments in urban poverty reduction, and exacerbated urban inequality.4
In Ethiopia, and in line with evidence of other countries, the negative effects of food price shocks are usually more evident in urban areas where people are net food consumers; this is particularly true for the poor and the near-poor who spend larger shares of their budget on food. For instance, a food security assessments conducted by the World Food Program in Addis Ababa in 2008 indicated that the proportion of households consuming an adequate diet decreased from 64 to 40 percent between January and July 2008 (World Food Program 2008), which exactly coincides with the past peak of food prices. Similarly, analyzing a panel dataset on 567 households
in dEpth: inflation and its impact on thE poor
2
3 Indeed, based on household panel data from 1994 to 2004, Bigsten and Shimeles (2008) found that the likelihood of escaping poverty considerably declines as the time spent in the state of poverty increases.4 In Ethiopia, an estimated 38.7 percent of the population was living below the official poverty line in 2004/05. Rural Ethiopia, where about 80 percent of the population lives, had a higher poverty incidence (39.3) than urban Ethiopia (35.1). Yet rural areas experienced robust poverty reduction (a decline of nine percentage points since 1995/96), while a strong rise in inequality resulted in a marginal increase in poverty in urban areas (two percentage points since 1995/96). Despite the overall reduction in poverty, the number of poor people grew by an estimated 1.9 million people in the decade up to 2005.
Scope of this analysis
• July 2010 to October 2011• Data from the 2004/05 WMS-HICES, the latest
nationally representative household survey available for this analysis.
• No consideration of substitution effects (consumers’ demand) and second round effects (change in labor market participation, in saving and investment patterns, in production costs, and in returns to economic activities due to inflation).
• Comparison of 2007/08 situation (analyzed in Ticci, 2011) with 2010/11.
in four major cities (Addis Ababa, Awassa, Dessie and Mekelle) Alem and Söderbom (2010) find that 89 percent of the households interviewed in 2008/2009 regarded food price inflation as the main adverse shock facing them between 2004 and 2008; 60
percent reported that their food consumption was very negatively affected and 38 percent stated that they reduced the quantity of food consumed because of the price shock.5
The impact of food price inflation in rural areas is less straightforward, especially in situations where food prices dominate and overshoot overall inflation rates. Netsellers of food, for instance, could experience an increase in their incomes.6 Rising food prices could help farmers to accumulate savings and they could generate positive incentives to expand production, and to invest in agricultural productivity and in high value crops. Yet, the positive potential of increasing food prices might be offset by other factors such as growing production costs, uncertain returns due to price volatility, rising non-food prices, higher shares of net food buyers also in rural areas7 and the concentration of net food sellers among the rural bet-ter off.8 Overall, however, it is important to note that effects of food price shocks on the welfare of rural and urban populations are varied and complex (Box 3).
The 2010/11 inflation Situation in ethiopia
After the spike in inflation rates in 2007 and 2008, inflation slowed down in 2009 and then remained
5 Alem and Söderbom’s regression results also indicate that households with little assets and workers with uncertain earnings, such as casual workers, were more adversely affected by the 2008 food price shock suggesting that in urban areas the poor were the most vulnerable to the food price spurt.6 Based on a panel data set on 354 households in six rural communities in Ethiopia and collected in 1989 and in 1994–1995, Dercon (2006), for instance, found that favorable changes in the terms of trade for crop producers (average real producer prices increased by 26 percent) explain about 60 percent of growth in real food consumption among the house-holds in the sample over the 1989–1995 period.7 The 2005 Poverty Assessment (World Bank, 2005) and Loening and Oseni (2007) have drawn attention to the low share of net food sellers even in rural areas.8 Ticci (2011) finds that, according to data from the 2000 WMS/HICES, the share of net cereal sellers is increasing in income. Analogously, based on the same data source, the analysis carried out by Levinsohn and Mac-Millan (2007) indicates that there are more net buyers of wheat than net sellers of wheat at all levels of income and the proportion of wheat net sellers is increasing in living standards.
box 3: Welfare impact of recent Price Shocks in ethiopia based on Nationally representative Datasets
Empirical literature on the welfare impact of recent price shocks based on nationally representative datasets, has not led to univocal findings. Using the Almost Ideal Demand System model and data from the 2000 WMS/HICES, Ulimwengu et al. (2009) derive demand elasticities with respect to income and to food price and indirectly estimate the overall change in food consumption and calorie intake due to hypothetical food-price increases. They found that welfare losses show a great deal of heterogeneity across regions, are relatively higher in rural than in urban areas (with the exception of SNNPR) and for a price rise of cereals than for other food items. Household cereal consumption, for instance, is estimated to fall by 0.82 and 0.86 percent in rural and urban areas, respectively, for a one percent increase in the price. Under these conditions, the 2008 cereal price shock might have had severe costs for food security in both rural and urban areas. Loening and Oseni (2007), based on data from the 2000 WMS/HICES and applying a net benefit ratio approach, found that, on average, the rise in food prices occurred between 2000 to 2007 was likely to produce a positive effect in rural areas and a negative impact in urban areas but vulnerability to food inflation varies across expenditure quintile. In rural areas better-off households were likely to benefit relatively more than lower-income households, while in urban centers the middle-income groups were hit the most. In rural areas, moreover, the households’ net food market positions are crucial in determining the sign of welfare effect due to the price increase: net buyer rural households, especially the poorest, were most harmed by food inflation, while net sellers gained from the food price increase. Ticci (2011) applied a similar approach but it included the effect of non-food prices and of cereal production increase, used more recent data, and focused on the period between 2006 and 2008. The work concluded that in urban areas, high inflation between 2007 and 2008 significantly worsened all poverty dimensions (incidence, depth, and severity), while the results were more ambiguous in rural areas: incidence of poverty might have decreased but the severity of poverty increased even under the most optimistic hypotheses. According these results, therefore, the main risk in rural areas was a further impoverishment of the poorest.
in dEpth: inflation and its impact on thE poor 17
stable for the larger part of 2010. Within 2009, food prices showed more pronounced variations than non-food prices: food inflation became nega-tive in May 2009 fluctuating around negative or low positive rates until July 2010 when it started to climb again. Annual food inflation (end-of-period) jumped from –1.9 percent in July 2010 to 8.7 per-cent in December 2010, 38.6 percent in May 2011 and to 51.9 percent in October 2011 (Figure 10, left side). Moreover, despite the reversal in inflation in 2009, both food and non-food prices have never returned to levels in line with price dynamics prior to the 2008 peak (Figure 10, right side). In addition, the inflation rates are particularly high for those items that relatively weigh more on the budget of the poor. Figure 11, shows that, over the period of consideration (July 2010 to October 2011), the price of cereals and pulses, on average, has grown more rapidly than the price of other food items such as meat, milk, eggs, and cheese; these latter items tend to be more intensively used by the better off.9
Similarly to the situation observed in 2008, Ethiopia’s domestic food prices in 2011 have increased more rapidly than international food prices and prices in other African countries (Figure 12). In 2010, Ethiopian food consumer prices
had already experienced higher growth rates than in several African countries and this gap has further widened since the beginning of 2011. Such a gap sug-gests that the inflation acceleration might be due to a combination of external and country-specific factors.
Figure 10: inflation rates in ethiopia, Jan 2001 to oct 2011
Non-food inflation Overall inflationFood inflation National retail food price index National retail non-food price index
0%
Food and non-food inflation rates(end of period)
National Retail Price Indices(December 2006 = 100)
–40%
–20%
20%
40%
60%
80%83.4%
51.9%
24.2% 22.8%
100%
Jan-
01Au
g01
Mar
-02
Oct-0
2M
ay-0
3De
c-03
Jul-0
4Fe
b-05
Sep-
05Ap
r-06
Nov-
06Ju
n-07
Jan-
08Au
g-08
Mar
-09
Oct-0
9M
ay-1
0De
c-10
Jul-1
1
0
50
100
150
200
250
300
Jan-
01Ju
l-01
Jan-
02Ju
l-02
Jan-
03Ju
l-03
Jan-
04Ju
l-04
Jan-
05Ju
l-05
Jan-
06Ju
l-06
Jan-
07Ju
l-07
Jan-
08Ju
l-08
Jan-
09Ju
l-09
Jan-
10Ju
l-10
Jan-
11Ju
l-11
Source: Central Statistical Agency of Ethiopia.
Figure 11: Food Prices between Jul 2010 and oct 2011, by item and region, Percentage Change
Cereals Pulses Meat Milk, Cheese and Egg
0%
50%
100%
150%
200%
250%
Tigr
ay
Hara
ri
Addi
s Ab
aba
Dire
Daw
a
Afar
Orom
yia
Som
ali
SNNP
Gam
bela
Amah
ara
Beni
shan
gul
Gum
uzSource: Central Statistical Agency of Ethiopia.
9 Berhane et al. (2011) find that the main cereals account for 46 and 47 percent of total food expenditure of the bottom 40 percent of income dis-tribution in urban and rural areas, compared to 36 and 43 percent of food expenditure of the top 60 percent rural and urban population, respectively.
The latter may include monetary policy related factors (see Section I), but also factors such as the unusual pace of increase in fuel prices in Ethiopia (fuel prices drive crop prices), which at the end of 2011 were
higher than in most other African countries (FAO-GIEWS 2011).
Distributive impact of the rise in Consumer Prices between July 2010 and october 2011
The distributional impact—at the aggregate level—of a rise in consumer prices depends on the consumption patterns of different income groups and on the pace at which the prices of different goods increase. Figure 13 presents the effective infla-tion experienced by individuals in different quintiles of the adult equivalent expenditure from July 2010 to October 2011 and from December 2006 to July 2008, based on the consumption bundles households were consuming in 2004/05 net of own-consumed items. The figure shows both the national effective inflation rates (upper side of Figure 13) as well as the rural/urban effective rates (lower side of Figure 13). During both periods of high inflation, poorer parts of the population faced significantly higher inflation
Figure 12: Consumer Prices, Food indices (2000 = 100)
The standard approach (Deaton 1997) to examine the impact of the rise in the price of good x is based on the assumption that a household will be affected in proportion to the share of its total expenditure devoted to good x. Such an impact will be at least partially offset if the household produces good x or if the household’s labor income increases due to the increase in the price of x. This methodology can be generalized to the case of overall inflation by summing up the effects of the increases in prices of the various goods (or groups of goods).
This approach makes a number of simplifying assumptions such as the absence of substitution effects (i.e., adjustments in the consumption choices across goods), of changes in marketing behavior of agricultural goods (i.e., the assumption that, following the price shock, households relied just as much as before on food that they had produced themselves), or in production. These assumptions make it possible to extrapolate the impact of inflation on the consumption bundles that households were consuming/producing before the inflation spurt, thereby providing a first order approximation of the effects. This analysis follows this approach, but with further
simplifications due to data issues. The most recent nationally representative survey that is available for this analysis is the HICES survey from 2004/2005, which was collected by the Central Statistical Agency of Ethiopia (CSA). The survey provides detailed information on household expenditures, but income information has not been released and thus limits the analysis on the income side. This analysis, therefore analyzes the distributive impact of the rise in consumer prices alone, focusing only on the expenditure side. Since positive effects of inflation on income sources and households’ defensive strategies are not accounted for, the estimates provided can be regarded as the upper limit of the poverty impact caused by the food price shock in 2010/11.
In a low income and largely agricultural country such as Ethiopia, many households rely on their own production for a significant share of their consumption, particularly of food. In rural areas, where the majority of population lives, in-kind food consumption represents about 30 percent of total expenditure and more than half of food expenditure, compared with an in-kind food share of four per cent among urban households (Table 7).
in dEpth: inflation and its impact on thE poor 19
Table 7: Self-food expenditure as Share of Total Food expenditure, 2005
Quintiles rural urban
1 0.53 0.05
2 0.56 0.06
3 0.57 0.06
4 0.56 0.04
5 0.52 0.03
All 0.55 0.04
Source: HICES-WMS, 2004/2005. Note: Food self-expenditure defined as all in kind food expenditure from household agricultural enterprises.
The analysis excludes own-consumption from the impact of inflation. The main reason for doing so is that own-consumed goods can be seen as “insulated” from fluctuations in market prices as they contribute to household budgets from both perspectives of consumption and income.a This way of proceeding should ensure that estimates of the impact of inflation are more plausible. At the same time, this is likely to affect the relative impact between rural and urban areas of food inflation on consumption only (i.e. whether rural or urban areas are more affected). Table 8 helps illustrating this point: Excluding food own-consumption lowers the food share by areas and by poverty status. But it results in food expenditure shares which are higher in urban than in rural areas. Finally, it is worth observing that the poor spend a higher share of their budget on food than the non-poor, regardless of the area of residence and the treatment of food own-consumption. This implies they are more vulnerable to food price shocks than the non-poor.
Table 8: Food expenditure Share by area and Poverty Status
Poverty status
Without own-consumption
With own-consumption
National Non-poor 33.7% 51.4%
Poor 40.7% 59.4%
Rural Non-poor 32.4% 53.0%
Poor 38.3% 59.5%
Urban Non-poor 41.6% 42.6%
Poor 57.2% 58.9%
Source: HICES-WMS, 2004/2005. Note: Food self-expenditure defined as all in kind food expenditure from household agricultural enterprises.
a It is assumed that all households spend in final goods all additional incomes that they earn thanks to real economic growth and inflation and that income rises at the same rate as the nominal GDP. This sce-nario starts out with an optimistic initial estimate of poverty. In fact, it assumes equally distributed gains of growth, while empirical evidence suggest that, in the past, inequality increased reducing the pro-poor impact of economic growth (DPRD\MOFED 2008). In urban areas, the opportunities coming from economic expansion between 1995 and 2004 were benefited mainly by the better off who experienced higher consumption growth rates than the rest of urban population (World Bank, 2010). Thus, sustained economic growth in the decade up to 2004/05 was associated with poverty reduction stagnation and a marked rise in income inequality in urban areas where Gini coefficient increased by 10 percentage points (from 0.34 to 044).
b Of course households can change their consumption and selling behaviors in response to the different dynamics of consumer and producer prices—ote however that the assumption that they do not (which we are implicitly adopting) is consistent with the methodology broader assumption that households do not substitute items in their consumption baskets and do not change their selling behavior.
box 4: Methodology and Data (continued)
Should the CPi in ethiopia include households’ own consumption?
For national accounts, the International Labor Organization (ILO) suggests treating “…the goods acquired by households on the market for use as inputs into the various kinds of households production activities as if they were themselves final outcomes” (ILO, 2004). For the calculation of the CPI, however, the ILO suggests that this approach is doubtful. In simple terms, the ILO suggests that the CPI records the actual input prices or the imputed output prices, but not both. Also, if the imputed output prices for “subsistence agriculture” are included in the CPI, the prices of purchased inputs should be excluded.
In Ethiopia, the way the CPI is measured, it appears, incorporates own consumption given how similar results are when we compare the weight of the food component of the CPI to the food expenditure shares with own consumption (calculated from the household survey). This in principle is not a problem, but it would require that acquisitions of goods that are used as inputs in the production of the staples for household consumption are eliminated from the calculations. This is quite complex and for that reason current practice in most countries is not to include households’ own consumption, and instead to consider all goods purchased by the household in the market.
Incorporating own consumption into the calculation of the CPI has implications not only for the comparison of how much more inflation the poorest households face, but also for the calculation of the inflation rate in Ethiopia.
rates than the richest quintile of the population. In the 2006/08 period the difference between the poorest and the richest quintile was 9.1 percentage points, and in the 2010/11 period the difference was 3.1 percent-age points. Overall, rural areas experienced slightly lower inflation than urban ones. The rural-urban gap is less evident for individuals in the highest quintile of expenditure distribution.10 Given the current debate on the possible need of revisions in the electricity tar-iff structure, Box 5 also gives a short overview of the impact of tariff increases on inflation and the poor.
The current price shock, as that of 2008, is likely to hit the poor and the households close to the poverty line relatively harder than the better off.
In 2008, the rise in prices was more marked and the distribution of effective inflation rates was less uniform with a larger gap between rural and urban areas and between the top and the bottom expenditure quintiles. In 2008, therefore, the price shock was probably more adverse for the poor and the urban households than the 2011 price acceleration has been up to now. These differences in effective relative price variation across
10 Note that if own-consumed items were included inflation would be higher, ranging from 48 percent (for the second quintile) to 43 percent (in the top quintile) in rural areas and from 44–45 percent (for individuals in the lowest three quintiles) to 38 percent in the top quintile in urban areas. The basic pattern with lower inflation for the top quintile would however be the same.
(continued on next page)
box 5: increases of electricity Tariffs in ethiopia – insights on the Possible effects on the Poor
background
Ethiopia Electric Power Company (EEPCO) is coming under financial pressure in its efforts to serve the ambitious targets laid out in the GTP; this may create significant fiscal challenges for the GoE. Under the GTP, EEPCO has been leading an US$11 billion energy sector expansion program, of which US$3.5 billion has already been raised. In the coming years, these maturing loans may amount to such a large annual debt service obligation that EEPCO will not be able to meet from its current and future operating cash flows. This shortfall would then place an additional burden of about US$2 billion on the GOE’s budget in FY2012–20 (cumulatively), which is equivalent to three to four percent of the GOE’s annual budget expenditure.
Policy options
Alternatively, the shortfall could be met with additional tariff for services of EEPCO of about US$0.03–0.04/kWh. Such an increase over time would allow the tariff to reflect full cost recovery (estimated to be US$ 0.06–0.07/kWh) and thereby ensure financial health of EEPCO and the sector. So to reach cost recovery levels, this would translate into an increase of 233 percent from the current effective electricity tariff rate of US$ 0.03/kWh to US$ 0.06–0.07/kWh. At the current exchange rate, the revised tariff would be equivalent to 1.21 Birr/kWh, which would mean a 390 percent increase with respect to the 2005 tariff (0.31 Birr/kWh). But if the proposed tariff adjustment is reported in 2005 prices, instead, it would correspond to 0.61 Birr/kWh, which would be a 196 percent rise. The question then is how an increase of such a magnitude would impact
on the consumers of EEPCO’s services and especially the poor segments of the population. A short analysis of the three hypothetical tariff increases mentioned—196, 233, and 390 percent—shows the potential impact on both inflation and poverty.
impact
An increase of the electricity tariff by 196, 233 and 390 percent, respectively, is found to have limited effects on inflation and the poverty incidence. Simulated inflation rates in 2005/06 would have reached 13.3 percent (196 percent increase in tariff) and 13.8 percent (with a 390 percent increase in tariffs) compared to the actual inflation rate of 12.7 percent. Likewise, doubling or quadrupling the electricity tariffs would have negligible effects on the poverty incidence because most of the poor and near poor do actually not have access to electricity; in 2009, only 17 percent of population had access.
The main findings on poverty impact under the three scenarios are reported in Table 9. The results suggest that the implications of the simulated tariff structure revision in terms of rural poverty incidence, depth and severity are minimal. In urban areas, the impacts are higher but they are still quite limited. A 233 percent increase in electricity prices, for instance, would lead to a rise by 0.23, 0.27 and 0.11 percentage points in urban headcount poverty, poverty gap and squared poverty gap indices, respectively and the impact of a 390 percent rise on the same poverty indices is estimated to be 0.27, 0.32 and 0.13 percentage points. Since most of people live in rural areas, the effects at national level are also expected to be marginal.
in dEpth: inflation and its impact on thE poor 21
areas and expenditure quintiles are likely to be driven by the incidence of food expenditure in the budgets of different households.
Food inflation presents higher rates than non-food inflation in both periods of soaring prices
(Figure 8) and food shares are lower for the highest two quintiles, regardless of the area of residence; the same is true for rural households once food own-consumption is excluded (Table 10). Moreover, com-pared to the latest rise in prices, the 2008 price shock
Table 9: Simulated Changes in Poverty indices due to electricity Tariff adjustments, Three Scenarios, 2005/06
Scenario Poverty index
before the rise in tariffsafter the hypothetical
rise in tariffsChange in percentage
points
rural urban National rural urban National rural urban National
196 percent increase
Headcount Poverty Index
39.4 35.2 38.8 39.4 35.4 38.8 0.0 0.2 0.0
Poverty Gap Index
8.5 7.7 8.4 8.5 8.0 8.4 0.0 0.3 0.0
Severity Poverty Index
2.7 2.5 2.7 2.7 2.7 2.7 0.0 0.1 0.0
233 percent increase
Headcount Poverty Index
39.4 35.2 38.8 39.4 35.4 38.8 0.0 0.2 0.0
Poverty Gap Index
8.5 7.7 8.4 8.5 8.0 8.4 0.0 0.3 0.0
Severity Poverty Index
2.7 2.5 2.7 2.7 2.7 2.7 0.0 0.1 0.0
390 percent increase
Headcount Poverty Index
39.4 35.2 38.8 39.4 35.4 38.8 0.0 0.3 0.0
Poverty Gap Index
8.5 7.7 8.4 8.5 8.0 8.4 0.0 0.3 0.1
Severity Poverty Index
2.7 2.5 2.7 2.7 2.7 2.7 0.0 0.1 0.0
Source: World Bank staff calculations, based on HICES 2004/05.
analysis approach
The impact of the electricity tariff revision is assessed—using HICES 2004/05 data—through an estimation of the effect on rural and urban poverty rates and the impact on the national consumer price index (CPI) due to the three different increases in electricity tariff for residential uses. The analysis focuses on observed consumption patterns in 2004/05 without taking
into account demand responses, such as substitution effects, which households could undertake as a reaction to the increase in electricity price. This simplification does not alter the interpretation of the results since the share of electricity expenditures is very low. The counterfactual analysis is set at the time of the latest national survey. It therefore estimates what would have been the poverty implications, if the electricity tariff had been revised in 2005.
box 5: increases of electricity Tariffs in ethiopia – insights on the Possible effects on the Poor (continued)
Regional location contributes to variations in the effective inflation rates households experienced between July 2010 and October 2011. Figure 14 details average inflation by region and the minimum and maximum rates by quintile and region. With the exception of Harari, in all regions the minimum infla-tion was experienced by the richest quintiles, while in eight cases the maximum rates were experienced by either of the two bottom quintiles, but regional het-erogeneity was even higher than differences by quintile.
was characterized by a larger divergence between non-food prices and food inflation rates. In July 2008, food inflation jumped to more than 90 percent (annual end-of period inflation) while non-food inflation rates stood constantly below 30 percent; and there was a gap between the two in the order of above 50 percent-age points between June and September 2008. In the period under consideration 2011, on the contrary, the difference between food and non-food inflation has never surpassed 28 percentage points.
Figure 13: Comparison of average effective inflation rates
Inflation rates, by quintileDec 2006 to Jul 2008
Inflation rates, by quintileJuly 2010–October 2011
1 2 3 4 5
Quintiles
Rural Urban
63% 65% 63%58%
54%
75% 76% 75%
65.5% 65.4%63.5%
60.7%
56.4%
42.9% 42.8%42.2%
41.2%
39.8%
69%
40% 40% 39% 37% 36%43% 44% 44% 42%
38%
57%
1 2 3 4 5
Quintiles
Rural Urban
Urban and rural effective inflation rates
Inflation rates, by quintileDec 2006 to Jul 2008
Inflation rates, by quintileJuly 2010–October 2011
1 2 3 4 5
Quintiles
Quintile of expenditure
1 2 3 4 5
Quintiles
Quintile of expenditure
National effective inflation rates
Source: World Bank staff calculations, based on HICES 2004/05.Note: Effective inflation rates are based on the consumption bundles that households were consuming in 2004/05 net of own-consumed items, and constant spending patterns and constant own-consumption is assumed since 2004/05. Quintiles are calculated in terms of quintiles of the adult equivalent expenditure. Effective inflation rates refer to the relative price variation in the entire periods from December 2006 and July 2008 and from July 2010 to October 2011.
in dEpth: inflation and its impact on thE poor 23
even if marketing infrastructure has improved and transaction costs have been reduced (Rashid 2011), market integration among regions faces continues to face barriers12 with some regional marketsbeing better integrated than others.13 In this context, not all regions might be equally capable of transmitting or capturing price signals and shocks from other regions. Differ-ences in weather conditions and, as a consequence, on harvests, might also help to explain the regional price heterogeneity, at least for food products. All these fac-tors can contribute to regional heterogeneity of infla-tion effective rates, but a better understanding of the differences in price dynamics across regions requires further analysis.14
Overall, the impact of rising consumer prices on expenditures in both rural and urban areas is non-negligible and leads to an estimated increase in the number of poor people of around 1.8 million.15 Much more, it is to be expected that the consumer price inflation between July 2010 and October 2011 led to a greater increase in both the depth (the aver-age difference between the income of the poor and the poverty line) and the severity of poverty (i.e. the extent to which some of the poor are very far from the poverty line) in urban than in rural areas. The latter is likely to be more pronounced in urban areas, however,
These regional differences are probably related with a range of factors from the level of market integration and spatial connectivity to the degree of reliance on local production11 and households’ production for meeting their own food requirements. Moreover,
Figure 14: effective inflation rates between July 2010 and october 2011, by region, average and Min and Max by Quintile, based on HiCeS 2004/05
Max inflation rateMinimum inflation rateRegional inflation rate
Tigr
ay
Hara
ri
Addi
s Ab
aba
Dire
Daw
a
Afar
Orom
yia
Som
ale
SNNP
Amah
ara
Beni
shan
gul
Gum
uz
0.30
0.35
0.40
0.45
0.50
0.55
Source: World Bank staff calculations, based on HICES 2004/05Note: Effective inflation rates are based on the consumption bundles that households were consuming in 2004/05 net of own-consumed items, and they assume constant spending patterns and constant own-consumption since 2004/05. Quintiles are calculated in terms of quintiles of the adult equivalent expenditure. For each region, the Figure shows average inflation and the inflation rates experienced by the two quintiles that faced the smallest and greatest effective price rise. Effective inflation rates refer to the relative price variation in the entire period from July 2010 to October 2011.
11 Rashid (2010) notes that Amhara and Oromoyia account for 87 percent of teff and wheat production, and for 82 percent of maize pro-duction. These surplus regions, therefore, can rely on local production to a greater extent than cereal deficit areas that are more dependent on cereals transported in from other regions. This might translate on dif-ferent pressure on food prices.12 Ulimwengu et al. (2009), for instance, find no evidence of market integration among Ethiopian regional maize markets.13 Rashid (2011) finds that the maize, wheat, and teff markets in the center, southwest, and south central areas more integrated than those in the north and east.14 In the light of the regional differences observed, it is important to note that this analysis relies on regional price indices. More precisely, regional monthly consumer prices are used, disaggregated by item group to deflate consumption expenditure from July 2010 to October 2011. This choice is also in line with earlier research (Ulimwengu et al. 2009), which found a great deal of heterogeneity across regions in terms of consumption and calorie-intake loss due to foodprice increases.15 This is estimated by calculating the elasticity of growth and poverty reduction in Ethiopia based on the last 10 years, which is around 0.65. This is then compared to an estimated loss in real income for the poorest quintiles by comparing the national effective inflation rates by quintile (Figure 13) with the national CPI (excluding own consumption).
Table 10: Food expenditure Share by area and Quintiles of the Population
Quintiles rural urban National
1 37.7% 57.3% 40.1%
2 38.0% 56.3% 40.1%
3 36.6% 54.9% 37.9%
4 32.6% 48.7% 34.5%
5 27.2% 35.6% 29.5%
All 34.7% 47.1% 36.4%
Source: World Bank staff calculations, based on HICES 2004/05.Note: Food self-expenditure is excluded.
suggesting that the urban poorest are among the most vulnerable to the food price shock due to the fact that urban poor tend to be net food consumers.
Comparing these estimates for 2010/11 with earlier findings based on a similar methodology (Ticci 2011) shows that the recent surge in prices has had a slightly lower poverty impact than the protracted period of rising prices in 2007 and 2008. This is not surprising since the inflation bout was much more pronounced at that time. But simi-lar to the past shock, the largest risk due to the price acceleration is to lead to further impoverishment of the already poor segments of population in urban areas and a greater vulnerability to poverty for those near to the poverty line in rural areas.
The greater poverty impact of food prices on poverty in urban than in rural areas is driven by the fact that this analysis considers own-con-sumption as “unaffected” by the price dynamics. It is noteworthy, however, that even using a defini-tion of food consumption which “insulates” rural households more than urban ones from the impact of very high food prices, the overall poverty impact is considerable also in rural areas where in-kind food expenditure from household agricultural enterprises account for more than half of food expenditure. This underscores the importance of non-food inflation in rural areas.
Since its foundation in 1886, Addis Ababa has emerged as Ethiopia’s main political, admin-istrative, economic, financial, and communi-
cation center. About 2.7 million people live in Addis Ababa. This is 3.7 percent of Ethiopia’s population of 73 million, and 22.5 percent of Ethiopia’s urban population of 12 million. Addis Ababa is an impor-tant center of production, a gateway to information and technology, and the major internal market for goods and services. To serve its role, Addis Ababa is transforming to a service economy—financial services, wholesale and retail trade, hotel and restaurants, trans-port and communications, and real estate service—and the service sector accounts for an estimated 71 percent of Addis Ababa’s output (EEA 2010).
Addis Ababa is central to Ethiopia’s growth prospects. It is both the hub that connects inter-nal markets to each other and the gateway to external markets, making its markets central to determining national competitiveness. For rural areas that depend on agricultural production, Addis is the reference market where domestic agricultural prices are set. Many of the opportunities for growth in agriculture, therefore, depend on Addis Ababa. Similarly, the scope and growth of the manufacturing sector depend on linkages to urban markets, and the size and purchasing power of Addis Ababa make it a vital catalyst in development.
Addis Ababa is in the early stages of expansion and development and it has yet to reach the eco-nomic size and density to reap the benefits it poten-tially could for its inhabitants and, in fact, for Ethiopia at large. It is the principal destination for internal migration as it offers the best prospects to young people. Its growth, however, has led to problems of inadequate public services and a financial gap between public
revenues and desirable investments. It has not drawn sufficient investment to provide jobs for its expand-ing population and the weak infrastructure has been a deterrent. The problems that have deterred investment are not confined to Addis Ababa, but are evident in low investment levels throughout the country.
agglomeration and economic growth
No country has advanced to middle income sta-tus without significant urbanization and indus-trialization (World Bank 2009). Rising densities of human settlements and mobility of workers and entrepreneurs shorten the distances to markets and are essential for economic development and prosperity. Growing cities, mobile people, and vigorous internal and external trade were the catalyst for progress in the developed world over the last two centuries. And the same market forces of agglomeration, migration, and specialization are changing the economic landscape of today’s most successful developing countries such as Brazil, China, and India.
Concentration of economic activity increases the productivity of all resources: land, labor, and capital. When resources are in close proximity, they generate external economies through specialization, diversity and depth of skills, concentrated demand, innovation, technology transfers, and other mutually reinforcing factors. Firms and workers are synergistic, becoming mutually more productive and prosperous when they are located in concentrated areas, rather than in isolation.
Addis Ababa and Ethiopia are early in the pro-cess of agglomeration. Figure 15 shows East Africa’s economic density (GDP per square kilometer), where the vertical lines represent the value of production per
in dEpth: agglomEration and compEtitivEnEss in Ethiopia
square kilometer of land. There are tall peaks where large production volumes occur in small areas: Cairo and the Nile Valley, Tripoli and Benghazi. There are modest peaks around Khartoum, Nairobi, and Kam-pala. Addis Ababa’s small peak dominates Ethiopia’s economy, but trails these other more significant centers. Figure 16 the East Africa panorama in a larger context, showing economic densities in Africa, the Middle East, South Asia, and Australia. Ethiopia, like most of Africa,
lacks the economic density that is a characteristic of more dynamic and prosperous economies.
There are important synergies between Addis Ababa and the rest of the country, and as Ethiopia develops the interdependence and inter-linkages will deepen. Addis Ababa has two significant roles in Ethiopia’s economic growth. First, it introduces new sources of growth because of its scale economies and agglomeration, skilled workers and entrepreneurs, supe-rior infrastructure and financial sectors, and its gateway to external markets. It is where goods and services are most readily conceived, financed, and developed—be it rose flower exports, bottled water for domestic con-sumption, or ATMs and internet banking. Second, Addis Ababa, along with other urban centers, links pro-ducers in rural areas with urban consumers and export markets. It has an inherent geographical advantage as the center of the radial structure of major roads, with other urban agglomerations at the periphery connect-ing the rural areas, and is the site of Ethiopia’s only international airport. For Ethiopian goods and services to become more competitive, Addis Ababa’s economy, along with other urban centers, must flourish.
Addis Ababa’s role in sustaining Ethiopia’s double-digit growth should not be underesti-mated. Addis Ababa’s ability to introduce services and
Figure 15: addis ababa’s economic Density Compared to its immediate Neighbors
Source: World Bank (2009).Note: Economic density is measured with GDP per square kilometer.
Figure 16: addis ababa’s economic Density Compared to Selected international Cities
Source: World Bank (2009).Note: Economic density is measured with GDP per square kilometer.
aDDiS ababa
aDDiS ababa
in dEpth: agglomEration and compEtitivEnEss in Ethiopia 27
products could be strengthened through better access of its citizens to city-specific modern and innovative technologies such as reliable and low-cost transport and communication, modern banking systems, or first-rate educational institutions and hospitals. Like-wise, in agriculture, reducing transportation, logistics, and marketing costs along with improving linkages between rural producers and urban consumers and investors are equally important to crop-centric efforts such as reducing production costs and increasing farm efficiency. And the Government is active to address those challenges. For instance, Addis Ababa and its surrounding area makes one of six growth corridors in Ethiopia, based on a National Framework for Economic Growth Corridors (MoFED 2006, and MoFED 2009). At the same time the role of urbaniza-tion in transforming agriculture is being recognized the government’s core strategy of Agricultural Devel-opment Led Industrialization (ADLI).
Financing the Development of addis ababa
Ethiopia has one of the lowest levels of urbaniza-tion in Africa. It is predominantly agrarian with an urban population of 14.3 million, less than 20 per-cent of the total population. Yet the urban areas have accounted for about 80 percent of recent economic growth and over 58 percent of GDP is produced in towns and cities. And urban areas attract the produc-tive and educated labor force: 90 percent of degree and above graduates live in urban areas. Ethiopia’s real GDP growth accelerated from a five-year average rate of 6.3 percent before 2004/05 to an 11 percent aver-age during 2005/06–2009/10. This was largely driven by the service sector, which accounted for 55 percent of the overall GDP growth. Agriculture grew at an average rate of 8.4 percent, contributing 33 percent to growth, and the industrial sector accounted for the balance, 12 percent of the overall growth (EEA 2010).
Addis Ababa is home to about a quarter of Ethi-opia’s urban population.16 Its city economy accounts for about 30 percent and 25 percent, respectively,
of the Ethiopian services and industrial output. Addis Ababa’s real GDP growth has averaged about 10 per-cent since 2003 (similar to the national economy). With population growth rates at around two percent this overall economic growth in Addis Ababa has implied significant gains in productivity and in living standards (AACAREP 2011). Per capita income of Addis Ababa is estimated to about US$1,200.17
Yet, the city’s economic performance has been uneven, and growth volatile. The gap between rich and poor in the city has widened, and the Gini coef-ficient increased from 0.34 in 1995/96 to 0.44 in 2004/05. Addis Ababa’s inhabitants have a literacy rate of 86.2 percent, but at the same time more than half of Addis Ababa’s population lives in absolute poverty. Still, pressures to migrate to Addis Ababa—the eco-nomic center of the nation—are on the rise. This is driven by factors such as changing aspirations of the young, population pressure on rural land, environ-mental degradation, biased road and transportation networks, and the general momentum of development that requires people.
Despite Addis Ababa’s growth, its public services and utilities are lagging behind. For instance, the 2007 national census found that 32 percent of residents have to get water from private sources of some kind, and 38 percent need to access water from public taps due to lack of household connections to water systems. The same census showed that in 2007, 14 percent of households had no sanitary facilities. Since residents use rivers, ditches, and open spaces instead, the lack of sani-tary facilities contributes to environmental pollution, contamination, and health problems. Household waste in Addis Ababa is either collected by the municipality (for 34 percent of households) or private firms (for 36
16 According to the 2007 Population and Housing Census, Addis Ababa’s population stood at 2.74 million people, while the total urban population stood at 11.96 million people.17 With a nominal GDP of US$31.27 billion and a population of 77.7 million in 2009, Ethiopia’s per capita income stands at about US$400. On average, most urbanized centers tend to have a per capita income that is three times larger than the national level. Using this insight, Addis Ababa’s per capital income can be estimated to have reached around US$1,200.
percent), but the 2007 census found that the remainder of households (up to 30 percent) must dispose waste elsewhere or burn or dump it. Less than 50 percent of households in Addis Ababa use electricity for cooking, with kerosene, charcoal, firewood, and dung among the more widely used alternatives.18 Overall, and according to data from EEPCO, households consumed 45 percent of electricity in the city,19 industries consumed 23 per-cent, and other service sectors accounted for 39 percent of consumption. The share of industrial consumption in Addis Ababa has stagnated in recent years perhaps due to widespread power rationing.
Addis Ababa has not had sufficient resources to invest in new projects to transform and modern-ize the city. Four percent of Ethiopians live in Addis Ababa but they generate nearly 70 percent of national finances. The city does not receive direct fiscal trans-fers from the federal government, but can access value added tax proceeds that are collected on the federal level from businesses and public enterprises within its jurisdiction. Addis Ababa can borrow but only from domestic sources, which significantly limits the scope of debt financing (AACAREP 2011). As a result the city almost entirely relies on its own resources, which haven’t grown as rapidly as the needs of the city. In fact, Addis Ababa faces an imbalance between its revenues and the rising demands for public invest-ment to maintain and improve public infrastructure and services. Capital investment has been lacking for new infrastructure and there is limited financing to improve services. Insufficient investment may have deterred private investors and reduced the current growth rate below its potential.
While Addis Ababa’s revenues grew by 225 percent in nominal terms from Birr 1.6 billion to Birr 5.2 billion between EFY 1996 (2003/04) and EFY 2002 (2009/10), in real terms growth over the period was only 33 percent, which in fact is below the rate of growth of the city’s economy. The city’s budget shows that the nominal increase from EFY 2002 to EFY 2003 was about seven percent, indicating a real slowdown in the rate of increase of the growth rate. But then, total city revenues are budgeted to reach ETB
11.5 billion in EFY 2004 (2011/12), a steep planned increase from ETB 5 billion in EFY 2003 (2010/11). This, in fact, raises real concern over the actual revenue increase, which probably was smaller in EFY 2004.
An evaluation of per capita revenues for the city of Addis Ababa shows yet a different picture with per capita revenues in real terms essentially being static (Figure 17); since EFY 2000 these remained just under ETB 2,000 (in EFY 2003 price levels). Much more, Addis Ababa’s revenues from its own sources dominate and increased from 93 percent of total rev-enues in EFY 1996 to 98 percent in EFY 2002. This is in contrast to other cities in the world. Especially in capital cities, quite often 30 to 50 percent of revenues are from external sources.
There are four principal sources of revenue: taxes on wages and salaries (personal income tax), taxes on profit to individuals (income or profit tax), urban land leases, and value added tax (VAT) on services. In fact, Addis Ababa has most of the revenue sources at its disposal that are used by cities around the world.20 But the actual revenue performance seems far below potential. A recent study from Ernst & Young esti-mated that Addis Ababa has a revenue potential up to Birr 20 billion (equivalent to US$1.15 billion) in the medium- to long-term from tax and non-tax revenue streams (Ernst and Young 2010). To reach this, how-ever, improved and better collection processes, inte-grated data management systems, and increased fiscal
18 Household, Income, Consumption and Expenditure Survey, Central Statistical Agency (CSA), 2004/05.19 Nationwide more than 80 percent of the population has no access to electricity. So electricity is just one of the sources of households access to energy and other sources dominate: kerosene, charcoal, firewood, dung, gas, and bio-gas.20 In the current charter of the Addis Ababa city government, which was approved in EFY 2003 (2010/11), a totality of 16 sources of city revenues are defined. These include: income tax from employment; land use fees; tax on income from agriculture; profit, excise and turnover taxes from businesses; urban land rent; tax on income from rented houses and other properties; stamp duty on contracts, agreements, and title deeds; profit, excise and turnover taxes from city-owned public enterprises; road user-vehicle charges; rentals from city-owned housing and other property; income tax, royalty and land rentals on small scale mining; royalty on the use of forest resources; fees on licenses issued and services delivered by the city; municipal taxes, duties and service charges; income tax on gains from renting patent rights; and capital gains tax on property.
in dEpth: agglomEration and compEtitivEnEss in Ethiopia 29
transparency would be imperative. Additionally efforts to unlock land development opportunities would pos-sibly increase the city’s overall financial capabilities.
Strengthening of existing systems, for instance by improving collection of revenues and streamlin-ing processes and procedures to increase appliance, is needed to increase the financial power of the city to serve its population and businesses. The recently drafted Addis Ababa City Administration Revenue Enhancement Plan (April 2011) is a great step towards this goal—financed through the World Bank’s IDA support. And in fact, past experience from around the world indicate that increasing collection of exist-ing taxes is generally more successful than introduc-ing new sources. Yet, the city government may also want to consider also a limited number of new and targeted taxes to increase overall revenues, such as: An additional hotel tax or luxury tax; airport tax; or rental car tax; livestock tax; or a public safety tax (Ernst and Young 2010).
improving Competitiveness in ethiopia
Ethiopia ranks 110th of 146 countries worldwide in the World Economic Forum’s Global Competitive-ness Index (2011/12). This gives it a place in the middle of sub-Saharan African nations. A different comparison, one that is focusing on cities rather than
countries, is presented by Hobson (2010), which compared Addis Ababa with eight other African cities and seven successful, so called “good practice” cities around the world. The dimensions for the comparison are dived into economic structure and productivity (two indicators) and competitiveness (six indicators). The results of this comparison, from the perspective of Addis Ababa, are shown in Table 11. As a general observation it is noteworthy that African cities sur-veyed somewhat lag behind the “good practice” cities around the world. Within Africa, Addis Ababa scores very high on certain indicators, such as airport passen-gers, but below the average in others, such as days spent on export procedures or the level of capital requirements to start a business relative to income. With this, Table 11 shows that Addis Ababa performs well on the dimen-sions of connective infrastructure, unemployment, and tax rates, but it performs less well on agglomeration, higher education, and technology. And Addis Ababa markedly lags behind its African peer cities in access to finance, productive utilities, telecommunications, and generally in the city’s business regulatory environment.
A recent survey of private firms in Addis Ababa and its periphery has supplemented and reinforced some of the results reported in Table 11. This sur-vey was designed to find firms’ binding constraints to growth and investment (Addis Ababa Firm Survey 2010). Data was collected from 100 firms in Addis Ababa and the surrounding zones of Oromia. Targeted firms included those in sectors such as manufactur-ing, services, floriculture, agribusiness, or commercial farms. They all had been in business for at least one year; the sample together accounted for 25 percent of capital investment. Generally, firms’ top constraint against growth was seen to be access to bank credit and the high cost associated with such credit, followed by foreign exchange controls and the unreliability/high cost of electricity. Other significant constraints were mentioned as: the tax regime, customs regulations, high cost of land, shortages of skilled labor, and mac-roeconomic instability.
Foreign investors say the most important rea-sons for establishing firms in Ethiopia and Addis
Figure 17: addis ababa’s per Capita revenues, in ethiopian birr (eTb)
1,6471,862
2,240
1,839 1,904 1,962 1,962
EFY 1996
EFY 1997
EFY 1998
EFY 1999
EFY 2000
EFY 2001
EFY 2002
Addis Ababa per capita revenues (in ETB)
Source: Addis Ababa City Administration Revenue Enhancement Plan (April 2011).
Ababa were family or social links to the city. Other factors that investors cited included duty-free import of investment capital, low labor costs, and relatively good infrastructure with access to foreign markets. The emphasis on social linkages is somewhat worrying. It appears that many firms in the sample invested despite the bad investment climate, not because of favorable conditions. This indicates that Addis Ababa really could attract investors from a larger pool than those with social ties to the city through a more favorable investment climate. Firms were also asked to rank the policies that they think have facilitated their operations; strikingly, most firms in the sample did not respond to the question. Those that responded said that providing incentives related to investment was among the most important support from the government. The next mentioned policies were related to taxation, logistics, and infrastructure.
Light manufacturing, including agribusiness, has been used as an escalator in many developing
countries to achieve the gradual shift from purely agrarian-based economies towards the develop-ment of a industrial sector. Light manufacturing employs low cost labor in export production and develops skills, technology, and business acumen for more advanced production. The World Bank recently analyzed the integrated value chains for six Ethiopian products: garments, leather products, wood products, metal products, wheat flour, and processed milk (World Bank 2011). Table 12 summarizes the findings for the six product chains, and it can be used to rank possible priorities for government action. The six most widespread and costly problems relate to inputs (cost, quality, and availability), trade logistics, competition policies, and firms’ abilities to produce and deliver large volumes of timely and export-quality outputs.
The study estimated product cost structures and looked at problems on factory floors as well as in supply chains and policies. The chal-lenges subsumed under firm and industry level
Table 11: addis ababa’s Competitiveness relative to 8 other african Cities
Competitiveness Dimension indicator
addis ababa relative to african Comparators
(#1=best)
Economic structure and productivity
Agglomeration Population growth rate over previous 10 years #8 of 9
Unemployment Unemployment as % of working age population #3 of 6
Drivers of Competitiveness
Infrastructure Total terminal passengers in main airport #1 of 8
Percent of households with access to telephone #5 of 8
Electricity per capita consumption #4 of 4
Financial sector Number of private banks #7 of 7
Human capital Percent of population with post-secondary education #4 of 4
Technology Internet users per 100 people Low (inadequate comparison data)
Institutional quality Corruption perceptions index #5 of 9
Regulatory environment for business
Days spent on export procedures #9 of 9
Capital requirement to start a business as a percentage of income per capita
#9 of 9
Corporate income statutory tax rate #3 of 9
Source: Hobson (2010).
in dEpth: agglomEration and compEtitivEnEss in Ethiopia 31
in Table 12 essentially are about productivity and cost. Firms can usually control productivity if the policy environment is conducive and enabling enough to adopt good practices. Causes for costs (other than those due to management decisions), are typically beyond the control of firms, but they can be affected by public policies related to taxes, tariffs, labor, and capital goods. The study delivers a series of noteworthy insights both on productivity and cost
level constraints in Ethiopia; these are highlighted in Table 13.
lessons from east asian experiences
The light manufacturing study also provides useful insights and comparisons to experiences in China, Vietnam and other East Asian economies, many of which, in the 1980’s, were similar to Ethiopia
box 6: business Services to improve Competitiveness
The World Bank recently conducted an enterprise survey: Survey of Users of Business Services,a which shows the importance of these services for Ethiopia’s competitiveness. Greater usage of IT and professional services (accounting, legal, and engineering) is associated with higher labor productivity for firms in Ethiopia. Data from the survey show that firms that use accounting, legal, engineering, and IT services—whether externally outsourced or
provided in-house—have higher average labor productivity than firms without professional or IT services linkages. The average labor productivityb of Ethiopian users of professional and IT services is higher than that of non-users by about 40 percent to 50 percent for accounting and legal services and about 75% for engineering and IT services.
Similar results have been reported by Li (2011). The paper analy-ses the usage of several services, including selected profession-al services, for a larger sample of 2020 manufacturing firms. Li (2011) shows that total outputs and net value added per worker of users of accounting and legal services is higher than that of non-users and finds that the estimated premiums for users’ labor productivity is 33 percent for accounting and legal services.
a In 2010–2011 the World Bank conducted firm surveys covering 72
users of professional and IT services in Ethiopia. For the profes-sional service users’ survey, the sample frames are the Addis Ababa Business Directory 2008–2010 and the Ethiopian Information and Shopping Directory—Third Edition 2010/11. The survey instrument was developed by the World Bank and was implemented by Precise Consult International PLC. The survey covers the following: IT/com-puter, accounting, legal, and engineering business services.
b Labor productivity is computed as the revenue of a firm divided by the number of its employees.
Figure 18: average Productivity of users vs. Non-users of iT and Professional Services in ethiopia
Table 13: Productivity and Cost-related Constraints for Firms and industries in ethiopia, 2010
Productivity related issues Cost related issues
Labor efficiency. On average, labor efficiency in medium and large Ethiopian firms is about 50 percent of Chinese and Vietnamese levels. This is largely due to training, smaller-scale operations, poor organiza-tion, and productivity bonuses.
Capital efficiency. Capacity utilization in Ethiopian firms averages 60 percent, compared with 90 percent in China and about 80 percent in Vietnam. The differences stem from less continuous order flow, old equipment, and power shortages.
Input efficiency. Average waste and product rejection rates are often up to 15 percent in Ethiopia, compared with around 5 percent in China and Vietnam. This is mostly due mostly to poor training.
Product quality. Ethiopian products are sold at low prices on world markets. For polo shirts the price is 40 percent lower than for Chinese shirts; for high-end men’s leather shoes it is 25 percent lower. The lower prices are due to lower product quality, longer and uncertain delivery times, inability to fulfill large and diverse orders, and poor reputation.
Labor costs. The wages for low-skilled Ethiopian workers are a tenth of those in China and less than half those in Vietnam. The wage gaps for skilled labor are much smaller, but this is only a small share of the workforce in light manufacturing.
Capital costs. Industrial machines are imported but they cost about 50 percent more in Africa than in Asia because import duties and taxes are high.
Input costs. Ethiopian firms enjoy a significant cost advan-tage in leather inputs, but they have difficulties in finding large volumes at consistent quality. Textiles are cheaper but they cannot be exported because of poor quality. Wood costs twice as much in Ethiopia as in China, steel more than 25 percent more (most must be imported), and domestically produced wheat 74 percent more because of lower yields. Milk costs are high because of lower-yielding breeds.
Source: World Bank (2011).
Table 12: Challenges for Manufacturers in Six Selected ethiopian industries, 2010
issue Not a problem Problem important Problem
Firm and industry level # of industries
Input quality, cost, and volume — — 6
Input efficiency — 3 3
Quality, volume, delivery time — 4 2
Labor efficiency — 5 1
Indirect costs — 6 —
Capital technology & efficiency 1 4 1
Capital cost 1 5 —
Labor cost 6 — —
Policy level # of industries
Input industry policies — — 6
Competition policies — 3 3
Trade logistics — 3 3
Land and infrastructure policies — 6 —
Labor and technology policies — 6 —
Financing policies — 6 —
Source: World Bank (2011): 20.Note: Summary statistics of the findings of a World Bank study of six light manufacturing industries: garment, leather products, wood products, metal products, wheat flour, and processed milk.
in dEpth: agglomEration and compEtitivEnEss in Ethiopia 33
today. Through these comparisons, the study finds that “many of the root causes of the productivity and cost issues (…) can be traced to policy problems relating to competition and input industries. These problems cannot be solved by the private sector alone. Nor can they be solved by the public sector alone” (World Bank 2011).
Looking at East Asian countries, there are a series of lessons that may help to unveil the poten-tial of light manufacturing in Ethiopia. First, for-eign direct investment is important to introduce good managerial practices and of competition to dif-fuse those practices, particularly among small firms. Special Economic Zones can play a role in this, and there is an opportunity to adopt proven insights from other countries, such as Korea (see Box 7 for Korea’s experience in the Masan Free Export Zone). It also found that good trade logistics is a must to be glob-ally competitive, both in cost and quality. By con-trast, policies facilitating bank financing and those facilitating skills training in the formal sector were less important. Second, the cost and quality of inputs represent significant challenges across the six product chains. Problems can be traced to policies related to entry barriers to competitive producers and to tariffs on imported inputs. Potentially competitive industries such as agricultural products, wood, livestock, and leather would benefit significantly from lower-cost and higher quality inputs.
Third, there is a deep divide between the few formal exporting firms and the larger number of small, informal industrial firms. The Chinese
economy benefitted from promoting competition and linkages between the two groups. Large firms could reduce their costs and increase their flexibility by building networks of small subcontractors, while small firms could grow stronger from working and competing with larger ones. And fourth, there is a range of policy issues for the light manufacturing industries, but not all of them are equally impor-tant. The government should set priorities based on careful analysis to achieve the best results. Global competitors have increased scale and scope such that Ethiopia can learn from their successes to improve its policies. Finally, it appears that the light manufactur-ing industries with the greatest new-term potential are in leather, garment, and metal products.
Specific recommendations to increase ethiopia’s Competitiveness in light Manufacturing
Ethiopian competition policies create an uneven playing field and discriminate between a few large exporters and the many small informal firms pro-ducing low-quality products for the domestic mar-ket. Exporters enjoy government support through duty-free imports of inputs, tax incentives, access to export-oriented industrial zones, land, and finance. However they pay for this with limited access to the domestic market. Large firms, particularly state enterprises, may also benefit from government pro-curement practices and subsidies. By contrast, small non-exporting firms are subject to numerous taxes
raising the level of competition
• Improve the investment climate and reduce regulatory burdens (including tax policy and administration). • Exit from state-owned enterprises and abolish the investment licensing list (see Box 8 on privatization strategies in China and
Korea).• Liberalize and remove or reduce tariffs, taxes, and duties on imported inputs and machinery for all firms whether for the
domestic market or for export. • Harmonize of domestic taxes for both exporters and non-exporters, and reduce delays in reimbursement of value added tax.• Accede to the World Trade Organization.
box 7: Korea’s experience in Special economic Zones: Masan Free export Zone
Special Economic Zones (SEZs) in Korea were introduced in the early 1970s and contributed to promoting exports and technological spillovers through attracting foreign direct investment. During that time Korea was suffering from serious external imbalances and high employment, leading to internal reserves drain and increasing external debt problems. Masan Free Export Zone (FEZ) was established in 1971 on the Southern coastal area of the Korean peninsula as the first FEZ, with the objective of promoting export and employment and inducing technological knowledge transfer among local firms through attracting FDIs in the manufacturing and chemical industries (see 2008).
Foreign firms operating in the zone were given wide range of benefit including special exemptions from various regulations on foreign investment that prevailed during the time. Incentives given to foreign firms in Masan FEZ include the following:
• Tax incentives. Tax breaks and holidays were most typical types of incentives offered to foreign investors in the zone. The Korean government provided various tax incentives: (i) Exemption from custom duties was given to imported capital goods; (ii) Complete exemption from national and local taxes was provided during the first five years, including corporate income tax, individual business income tax and property tax, and then 50 percent tax reduction was provided for the next three years.
• Reduced user fees and basic service cost. Rental fees for factory sites or standard factory building were completely exempted (for firms with high level technology) or significantly reduced. User fees for basic services (i.e., electricity, water) were also greatly discounted and basic facilities (i.e. fire station, postal service, bank) were provided within the zone.
• One-stop service system. An administrative office centrally handled various administrative processes (permits and incentives), significantly reducing firms’ administrative cost from dealing with different central and local government departments.
• Restriction on labor dispute. Endowing foreign companies in the zone with the legal status as public enterprises, the government in effect banned labor dispute in the zone.
Masan FEZ became one of the most successful free economic zones in Korea in the 1970s and 1980s (in fact until the late 1980s when broad-based growth of the Korean economy gained momentum and the relative economic contribution of the zone started to decline). Business activities in Masan FEZ grew rapidly with the number of foreign companies operating in the zone reaching its fully capacity of 115 firms in 1973 only three years after its inception in 1971. The number of companies remains in the range of 70–100 ever since 1974 and currently 100 firms are operating in the zone. Key indicators of the zone
show its success (Figure 19), especially during the early years of the 1970s and 1980s:
• Foreign investment and employment. Foreign capital invested in the zone started with meager US$0.5 million in 1971 but jumped to US$100 million in 1980, with the annual average new foreign investment amounting to US$11 million during the period. The majority of the foreign investors were from Japan, followed by American firms. The number of workers in zone climbed to 31,000 in 1979 and reached its peak of 36,000 in 1987. Thus, the zone achieved its objective of job creation in the local area.
Figure 19: Development Trends in Masan FeZ (Korea)
0
5,000
10,000
15,000
20,000
25,000
30,000
35,000
0
20
40
60
80
100
120
Net FDI (millions of US$) – Left Axis Number of workers – Right Axis
Trends of FDI and Employment in Masan FEZ(1971–1980)
0
200400600800
1,0001,2001,4001,6001,8002,000
1971
1972
1973
1974
1975
1976
1977
1978
1979
1980
1971
1972
1973
1974
1975
1976
1977
1978
1979
1980
1981
1982
1983
1984
1985
1986
1987
1988
1989
Export from Masan FEZ(millions of US$, 1971–1989)
Source: Administration Agency of Masan Free Trade Zone.
(continued on next page)
in dEpth: agglomEration and compEtitivEnEss in Ethiopia 35
cost is for moving it the 700 kilometers between the port of Djibouti and Addis Ababa. Moving the same container from Guangzhou to Los Angeles costs only $2,000. Poor trade logistics increase production costs, delivery times, and uncertainty, which forces Ethio-pian manufacturers to accept lower prices for their exports. Other countries have built their export sectors on the back of good trade logistics.
and high tariffs on machines and inputs. This forces many firms into the informal sector, making it even more difficult for them to compete in formal markets as sellers or as purchasers of skills, land, and utility or financial services.
Ethiopia’s trade logistics are weak. For example, moving a 20-foot, 10-ton container between Addis Ababa and Guangzhou costs $4,000, and half that
box 8: Privatization Strategies in China and Korea
… in China (1984–2010):
Reform of China’s state-owned enterprises (SOEs) has been a major aim since urban reforms began in 1984. Although there were calls to privatize the SOEs, the Government’s initial emphasis was on boosting performance by changing the internal governance of SOEs and improving the market environment in which they operated. By the late 1980s the Government had decided that the best way to reform small SOEs was to lease them out, with the manager paying the state a fixed proportion of the firm’s profit. Incorporation was another significant measure that led to privatization (Kikeri and Kolo 2005, referring to Garnaut et al. 2005).
Particular bold reforms under the 9th Five Year Plan (5YP) 1995–2000 led to a greatly expanded role of the private and other non-state sectors (World Bank 2012a). With this, reform has accelerated and acquired some qualitatively new features. First, the scale of change has expanded to affect almost every kind of SOE—small, medium, large, and very big; under both central and local control. Second, ownership diversification has been so extensive that the wholly state-owned non-financial company has become an endangered species in China. Third, the range of restructuring mechanisms being used has expanded dramatically to include bankruptcies, liquidations, listings and de-listings, debt-for-equity swaps, sales to private parties (domestic and foreign), auctioning of state firms and their assets
(continued on next page)
• Contribution to export. Foreign exchange earnings through exports is one of the primary gain expected from SEZs in many developing and low income countries. Masan FEZ was not an exception to this. In fact, exports from the zone increased greatly from mere US$70 million in 1973 to over US$628 million in 1980. Exports continued the steady growth trend thereafter and until 1989. The export share of Masan FEZ among Korea’s total exports reached its peak of 4.1 percent of total exports in 1979.
Technological spillovers were made through strong backward linkages. One of the important benefits expected from foreign investment is to realize positive spillovers of advanced technology and knowledge into the broader economy. But technological spillovers in Masan FEZ were not significant during the 1970s due to the labor-intensive nature of most foreign invested production and the tendency
of foreign investors to limit the access of local workers to their technological assets. Then transfers of managerial know-how and techniques became more significant in Masan FEZs through training of local employees provided by foreign companies operating in the zone (Warr 1984). Finally, in the 1980s, stronger backward linkages between foreign invested firms in the zone and local firms in the region (suppliers) provided an appropriate channel to transfer technologies; much more, the zone eventually became a driving force for job creation outside its boundaries. By 1988, 525 local firms with 16,686 workers were involved in the production of basic materials/goods needed (inputs) for the final manufacturing process of foreign firms operating in the zone (Cho 1990). Additionally, many Korean companies accumulated technological capabilities through complying with the technological standards and demands from their business counterparts in the zone.
box 7: Korea’s experience in Special economic Zones: Masan Free export Zone (continued)
or liabilities, standard corporate governance techniques, and so on. Finally, mass layoffs—unheard off in the earlier years of the reforms—have become a widespread phenomenon (Kikeri and Kolo 2005, referring to Garnaut et al. 2005).
In sectors of strategic importance, such as infrastructure and energy, where the regulatory framework keeps evolving, monopolies have been broken and competition has been introduced. Many companies have been corporatized, and some have been listed on local and international exchanges. Through this China has nurtured over 20 giant corporations and conglomerates that have proven competitive in the international market. Some of these companies are laying off tens—or even hundreds—of thousands of employees, not because they are in financial distress (some of them are hugely profitable) but because they wish to position themselves as important international players (Kikeri and Kolo 2005, referring to Garnaut et al. 2005).
Many small and medium-sized SOEs became privately owned. In line with these developments, the new policy direction has been to diversify the ownership of state enterprises. Indeed, many large state enterprises have been “corporatized” and some of the biggest (including those directly monitored by the central government) are now not only listed on stock exchanges but have also improved their governance structure, managerial professionalism, and profitability. But while the profitability of state enterprises has improved, it has still remained well below non-state firms, including pure private firms (World Bank 2012a).
As a result, the state sector’s share in the total number of industrial enterprises (with annual sales over 5mn RMB) fell from 39.2 percent in 1998 to 4.5 percent in 2010. During this same period, SOEs’ share in total industrial assets fell from 68.8 percent to 42.4 percent, while their share in employment was slashed from 60.5 percent to 19.4 percent. Their share in China’s exports fell from 57 percent in 1997 to 15 percent in 2010. Thus, the non-state sector has become not only the main generator of output (an estimated 70 percent of GDP) and employment, and strongest growth engine, but also the most active sector for innovation (World Bank 2012a).
… in Korea (1968–2002):
The privatization of SOEs in Korea went through several phases and the objective of privatization also evolved as the economic and social environment changed along with development. Korea’s experience showcases the difficulty of privatization especially amidst strong political resistance; in fact, ambitious privatization plans announced by the government achieved only partial successes or had to be delayed and/or modified in many cases because of political opposition. The most notable progress
in privatization occurred only after the 1997/98 Asian crisis when the economy was in immediate danger, and supporting voices for public sector reform were particularly strong. Looking at more than three decades of development, privatization efforts in Korea can be summarized in five phases (KDI 2010; and MSF 2008):
• 1st Phase (1968–1973): The number of SOEs in Korea had rapidly increased from 35 at the end of 1950 to 120 in 1970. Back then, SOEs existed and played a dominant role in most key sectors of the economy, including: transportation, energy, mining, manufacturing, chemical production, construction, and finance. As the strong market intervention of the government through SOEs had increasingly been criticized for creating inefficiency in the market, the first earnest privatization plan in Korea was implemented in 1968, largely through the sale of government shares to strategic buyers. Eleven SOEs in aviation, surface transportation, mining and manufacturing were privatized between 1968–1973 including Korean Air Lines and one large commercial bank (out of five).
• 2nd Phase (1980–1983): Privatization in the 1980s put large emphasis on privatizing four remaining commercial banks owned by the government through general competitive bidding process of the government shares. However, the original purpose of banking sector privatization was only partially fulfilled as government intervention continued in the operation of the privatized banks through strong
box 8: Privatization Strategies in China and Korea (continued)
Chaebols are large corporate groups in Korea and at the heart of the unique development path of the country. Many of them were family controlled, but all of them are fully private companies. Famous current examples include global enterprises such as Samsung, Hyundai and LG. Since the 1960s, Chaebols increased their influence on the Korean economy with the support of the government at times of credit rationing and industrial policy. Economic dominance of Chaebols in Korea was largely regarded as one of the underlying causes of the 1997 economic crisis. In the aftermath of the crisis, the Korean government announced its intention to break the myth of “too-big-to-fail” and implemented strong restructuring processes in the area of corporate governance. As a result, many Chaebols went bankrupt or were dismantled into smaller corporate groups. One of the more famous examples is Daewoo, which grew rapidly during the 1980s but eventually went out of business in the early 2000s.
(continued on next page)
in dEpth: agglomEration and compEtitivEnEss in Ethiopia 37
Local inputs are of low quality so Ethiopia is not using its natural resources as a competitive advantage. This was the case in each of the six value chains that were studied. Government control and protection has undermined the competitiveness of textiles. Diseases and access to land have led to low quality and low volumes of leather skins. Poor management of wood plantations has raised the price of wood and threat-ened natural forests. Import tariffs on steel penalize domestic buyers. Low quality seeds, fertilizers, and irrigation lead to a rise in the cost of domestically pro-duced wheat. And low-yield breeds and entry barriers for large-scale animal farms increase the cost of milk.
Lack of access to rural land has hindered poten-tial investments to produce inputs such as leather, wood, wheat, and milk. Similarly competitive, reli-able utility services are not widely available, with the power and telecommunications sectors still to be fully liberalized and opened to foreign investors.
Finance and investment are required when a firm starts up and when it expands. For light manufactur-ing firms in Ethiopia the main source of financing has been retained earnings. The second biggest source has been supplier or customer credit. Industry value chains
political influence on management appointment, and asset management until the 1990s. The oil industry was another key sector of the privatization plan, which led to privatizing the Korea Petroleum Corporation (1980).
• 3rd Phase (1987–1989): A grand privatization plan was established in 1987 to target SOEs with significant size and economic influence. The plan included privatization through stock market issuances of Korea Telecom Corporation (KT), Korea Electric Power Corporation (KEPCO), Pohang Steel and Iron Corporation (POSCO) and Korea Stock Exchange. However, the ambitious original plan was again only partially completed, due to two primary concerns: (i) the supply of stocks from the large SOEs would put too large burden for the still weak stock market to bear; and (ii) there was strong opposition from political circles and labor unions due to potential economic power concentration to Chaebols which were considered most likely buyers of the large SOEs. By 1989 the Korea Stock Exchange was fully privatized as its government shares were sold to financial companies and the government shares of KEPCO and POSCO were partially sold to the general public.
• 4th Phase (1993–1997): The new administration in 1993 announced another full-scale privatization plan envisioning the sales of government shares in 55 SOEs.
Due to rising concerns on the growing economic power concentration to Chaebols, the plan excluded the energy and telecommunication sector from the privatization target. Concerns over the economic dominance of a few large conglomerates again led to strong political resistance and the implementation of the privatization plan fell far short of the original design: only 22 SOEs were fully or partially privatized by 1997. But the plan eventually led to the adoption of “Public Enterprise Privatization Act” in 1997.
• 5th Phase (1998–2002): Privatization was more extensive and effective than in any past experience, strongly driven by the urgent needs to address the then omnipresent economic crisis of 1997/98. A Government Reform Bureau was established for that purpose. It envisioned immediate full privatization of five large SOEs in steel and heavy manufacturing industries and a phased-in privatization of six large SOEs in telecommunication, energy and tobacco industries. Plans were announced for fifteen large SOEs to go through a so-called self-restructuring process. However, re-emergence of public concern about some large SOEs that were regarded as public goods providers halted privatization in electricity, gas industries, and railroad services.
box 8: Privatization Strategies in China and Korea (continued)
improving trade logistics for apparel exports
• Ethiopia has the potential to compete globally in apparel thanks to a significant and growing labor cost advantage, access to a state-of-the-art and well-located container port in Djibouti, and duty-free access to the US and EU markets.
• To address the binding constraint of trade logistics, the government could consider establishing a green channel for apparel at customs, providing free and immediate access to foreign exchange, reducing the cost of letters of credit, and setting up an industrial zone closer to Djibouti.
and industrial clusters generate the trust and peer pres-sure for this to work effectively. Financing from family and friends as well as the diaspora has been important, especially at start-up. Bank financing plays virtually no role in the start-up phase in any country. It would be extremely risky for banks to finance start-ups with little collateral and no track record. It has had a bigger role in expansions. The Ethiopian government has a policy of facilitating access to finance only for export-ers in preferred industries.
Additional, Ethiopia has considerable potential to export services but sustaining and broadening of this kind of export growth will require a more sup-portive policy framework. At the same time, services are crucial for Ethiopia’s overall competitiveness, and opening up services can help diversify into exporting agricultural and manufactured goods with higher value added as previously recommended. A clear services strategy that focuses on better coordination across ministries and deeper dialogue with stakeholders may provide the required stimulus of such exports.
A recent study provides concrete recommen-dations for the reform of business services (World Bank 2012c). The report shows that a successful reform of business services requires policy action at the national and international levels in the fol-lowing areas: education, domestic regulation, trade
liberalization and labor mobility. Ethiopia has made commitments to pursue regional integration in the context of the COMESA and the Tripartite21 pro-cess. Ethiopia’s participation in the WTO accession process, the COMESA negotiations on professional services and the recently established Professional Ser-vices Knowledge Platform can help the country with the development of a meaningful reform program that includes the elimination of explicit barriers and regulatory, education and immigration reforms.
Summary: unfolding the Potential of a Thriving economy
Growth requires agglomeration and the scale economies it offers: specialization, diversity and depth of skills, concentrated demand, innovation, and technology transfers. This section shows that Addis Ababa is the only urban area in Ethiopia that
21 The Tripartite agreement between COMESA, SADC and EAC aims at forming a common FTA among the three regional groupings. The decision by the three RECs to form the FTA has been described as a big political commitment and a landmark decision in Africa’s regional integration efforts.
overcoming input shortages for leather products
• Ethiopia has even greater potential in leather, which is more labor-intensive than apparel. But the immediate constraint is limited access to high-quality processed leather.
• Enabling imports of high-quality processed leather would be an easy and immediate solution to the acute shortage of leather in the industry.
• Removing restrictions on the exports of leather would increase the incentives to invest in the Ethiopian leather supply chain.
• Facilitating access to rural land for good practice animal farms, promoting better breeds, controlling cattle disease, and enabling the use of cattle as collateral would further stimulate the supply of quality leather.
Source: World Bank (2012b).
addressing land and finance issues for wood and metal products
• Ethiopia has the natural resources to develop a competitive wood supply, which currently is unreliable, unsustainable, and poorly organized.
• The price of steel in Ethiopia is 30 percent above the price in China due to poor trade logistics and high import tariffs. Even in the better-managed firms, labor productivity is low.
• The potential lies not in exports (at least initially) but in the growing domestic market and in the high weight-to-value ratio of finished wood and metal imports.
• For wood, the government should facilitate access to rural land and financing for private wood plantations.
• For metals, eliminating the 10 percent import tariff on steel should reduce the cost of inputs, and enabling the exploitation of the vast proven reserve of iron ore combined with hydro-energy, could make the domestic steel industry competitive.
Source: World Bank (2012b).
in dEpth: agglomEration and compEtitivEnEss in Ethiopia 39
is capable of delivering these scale economies, but its small economic density is insufficient to realize the economies that are necessary for a strong impact on Ethiopia’s growth. Addis Ababa’s economic profile is insignificant compared to productive and prosperous cities in East Africa, the Middle East, South Asia, and Australia (Figure 17). For Ethiopia to develop, Addis Ababa will have to increase its economic density as other, more dynamic cities have.
Greater investment, public and private, will lead to greater economic density as land and other factors are used more intensively. Addis Ababa’s public services and infrastructure—water, sanitation, sewerage, electricity and communications—are inad-equate. They do not compare well to other African cities, and they substantially trail comparator cities outside Africa. Addis Ababa has a gap between the revenues it is collecting and the investments that would be required to improve public services. There are several options for raising revenues from existing taxes to adequate levels by modernizing and improving the city’s revenue collection systems, policies, proce-dures, and staffing.
Attracting new private investment will require a better investment climate. Addis Ababa does not stand out as a city that can facilitate large-scale inflow
of foreign investment into the country. Ethiopia ranks 110th of 146 countries in the World Economic Forum’s Global Competitiveness Index and in the middle of sub-Saharan African nations. A developing nation’s goal is to attract investors who are drawn by a favor-able investment climate, and there are lessons from East Asia on how to better achieve this.
Light manufacturing, including agribusi-ness, has been used to raise developing coun-tries from agrarian-based economies. It employs low-cost labor in export production and develops skills, technology, and business methods for more advanced production. Ethiopia has had some success with light manufacturing but analysis of six product chains revealed several problems that are reducing productivity and competitiveness: inputs (cost, quality, and availability), trade logistics, competition policies, and firms’ abilities to produce and deliver large volumes of timely and export-quality outputs. There are several policy options to alleviate these problems. These policies would not only improve the competitiveness of these firms and product lines, but they would also improve the investment climate, attract new investors, and build develop-ment momentum to raise the economic profile of Addis Ababa and Ethiopia.
Section i
Economist Intelligence Unit (EIU). 2012. Country Report Ethiopia, March.
EthioInvest. 2012. Available at: http://www.ethioin-vest.org/Investment_Regime.php
Flassbeck, H., S. Dullien, and M. Geiger. 2005. China’s Spectacular Growth Since the Mid-1990s, Ma-croeconomic Conditions and Economic Policy Challenges. In: China in a Globalizing World, United Nations Conference on Trade and Devel-opment. New York and Geneva.
Geiger, M. 2010. Monetary Policy in China: Institu-tions, Targets, Instruments and Strategies. Doctoral Dissertation. University of Würzburg, Würzburg.
HICES: Household Income Consumption and Expenditure Survey. 1995/96, 1999/00, 2004/05 and 2010/11. Central Statistics Agency (CSA), Addis Ababa, Ethiopia.
Huang,Yasheng. 1998. FDI in China: An Asian Per-spective. The Chinese University, Singapore.
Lopez, J. Humberto. 2004. Pro-growth, Pro-poor: Is there a Tradeoff? The World Bank (PRMPR). Available at: http://www-wds.worldbank.org/external/default/WDSContentServer/WDSP/IB/2004/09/22/000160016_20040922152917/addi-tional/130530322_20041117143606.pdf
Ministry of Commerce of the People’s Republic of China. 2012. China Foreign Direct Investment (FDI). Available at: http://www.fdi.gov.cn/
New African. 2011. Interview with Prime Minister Zenawi. Available at: http://www.newafricanmaga-zine.com/special-reports/country-reports/ethiopia-focus-on-investment/zenawi-were-on-the-right-track
The Africa Report. 2012. “The rise and rise of Ethio-pia: From starvation to industrialization in two decades, Ethiopia is clearly booming. But can it avoid the curse of the oligarchs.” May.
Xiao, Geng, and Haiying Zhao. 1998. “Characteristics in Chinese FDI and Trade Policy: Lessons Learnt and Policy Implications.” in International Trade Issues. July. Available at: http://www.econ.hku.hk/~xiaogeng/research/Paper/Chinese/China-trade.pdf
Section ii
AfDB, OECD, UNDP, UNECA. 2011. African Economic Outlook 2011, Ethiopia Country Note. Available at: http://www.africaneconomicoutlook.org/en/countries/east-africa/ethiopia/
Alem, Y. and M. Söderbom. 2010. “Household-Level Consumption in Urban Ethiopia: The Impact of Food Price Inflation and Idiosyncratic Shocks.” CSAE Working Paper Series 2010–24, Oxford: Centre for the Study of African Economies.
Berhane, G., Z. Paulos, K. Tafere, and S. Tamiru. 2011. “Foodgrain Consumption and Calorie Intake Patterns in Ethiopia.” Ethiopia Strategy Support Program II (ESSP II) Working Paper No. 23. Washington, D.C.: International Food Policy Research Institute.
Bigsten, A. and A. Shimeles. 2008. “Poverty Transition and Persistence in Ethiopia: 1994–2004.” World Development, 36(9): 1559–1584.
Deaton, A. 1997. The Analysis of Household Surveys: A Microeconometric Approach to Development. Washington DC: World Bank and John Hopkins University Press.
Dercon, S. 2006. “Economic Reform, Growth and the Poor: Evidence from Rural Ethiopia.” Journal of Development Studies. 81 (1): 1–24.
DPRD and MOFED. 2008. Dynamics of Growth and Poverty in Ethiopia (1995/96–2004/05), Addis Ababa: Development Planning and Research Department and Ministry of Finance and Eco-nomic Development.
Durevall, D., J. L. Loening, and Y.A. Birru. 2010. “Inflation Dynamics and Food Prices in Ethiopia”. Working Papers in Economics 478, Göteborg University, Department of Economics.
FAO-GIEWS. 2011. Global food price monitor. Food and Agriculture Organization, under the Global Information and Early Warning System on Food and Agriculture. 9 December: Rome
FAOSTAT. 2011. http://faostat.fao.org/. Statistics downloaded in December 2011.
ILO. 2004. “Consumer Price Index Manual: Theory and Practice.” Available at http://www.ilo.org/pub-lic/english/bureau/stat/guides/cpi/index.htm. The chapter Concepts and Scope, number 3, includes explicit recommendations on “subsistence agri-culture” in the calculation of the CPI in page 47.
International Monetary Fund. 2011. “The Federal Democratic Republic of Ethiopia: Joint Staff Advisory Note on the Growth and Transformation Plan 2010/11–2014/15.” IMF Country Report No. 11/303, Washington D.C.: International Monetary Fund.
Levinsohn, J. and M. MacMillan. 2007. “Does Food Aid Harm the Poor? Household Evidence from Ethiopia.” In A. Harrison (ed.), Globalization and Poverty. University of Chicago Press.
Loening, J. L. and G. Oseni. 2007. “Approximating Rural and Urban Welfare Effects of Food Price Inflation in Ethiopia.” Unpublished paper, Wash-ington D.C.: World Bank.
Loening, J. L., D. Durevall, and Y.A. Birru. 2009. “Inflation Dynamics and Food Prices in an Agri-cultural Economy: The Case of Ethiopia.” Policy Research Working Paper Series 4969, Washington D.C.: World Bank.
Rashid, S. 2010. “Staple Food Markets in Ethiopia.” Paper prepared for the for the COMESA policy workshop on food price variability, January 25–26, Maputo. Available at: http://www.aec.msu.edu/fs2/aamp/semi-nar_3/AAMP_Maputo_27_Ethiopia_ppr.pdf
Rashid, S. 2011. “Inter-commodity Price Transmis-sion and Food Price Policies: An Analysis of Ethiopian Cereals Markets.” IFPRI Discussion paper 1079. Washington, D.C.: International Food Policy Research Institute.
Tafere, K., P. Zelekawork, A. S. Taffesse, T. Nigussie, and T. Seneshaw. 2009. “Food Demand Elastici-ties in Ethiopia: Estimates using 2004/05 House-hold Income, Consumption Expenditure (HICE) Survey Data.” Ethiopia Strategy Support Program II Discussion Paper 11. Addis Ababa: Interna-tional Food Policy Research Institute.
Ticci, E. 2011. “Can inflation be a good thing for the poor? Evidence from Ethiopia.” Development in Practice. 21(4–5): 629–641.
Ulimwengu, J. M., S. Workneh, and Z. Paulos. 2009. “Impact of Soaring Food Price in Ethiopia. Does Location Matter?” IFPRI Discussion Paper 00846, Washington, D.C.: International Food Policy Research Institute.
World Bank. 2005. Ethiopia Well-Being and Poverty in Ethiopia. The Role of Agriculture and Agency, Washington D.C.: World Bank.
World Bank. 2010. Re-Igniting Poverty Reduction in Urban Ethiopia through Inclusive Growth, Report No. 52848-ET. Washington D.C.: World Bank.
World Food Program. 2008. “Summary of Price Impact Security Assessment Findings.” Food Security Analysis Group. Available at: http://home.wfp.org/stellent/groups/public/documents/ena/wfp186310.pdf
Section iii
AACAREP. 2001. Addis Ababa City Administration Revenue Enhancement Plan, Draft Final Report, April 2011, p. 3. (project background report – unpublished).
rEfErEncEs 43
Ethiopian Economics Association, Ethiopian Eco-nomic Policy Research Institute. 2010. Unleashing Addis Growth Potential: Recent Economic and Social Trends in Addis Ababa, p. 21. (project background report – unpublished).
Ernst & Young. 2010. Project: Study of Revenue Gap and Potential of the City of Addis Ababa. Ernst & Young, Addis Ababa (project background report – unpublished).
First Consult. 2010. Addis Ababa Firm Survey: Identi-fying the Binding Constraints to Firm Growth and Investment, November, 2010. (project background report – unpublished).
Garnaut, Ross, Ligang Song, Stoyan Tenev, and Yang Yao. 2005. China’s Ownership Transformation: Pro-cess, Outcomes, Prospects. IFC: Washington D.C.
Hobson, Emma Wadie. 2010. Addis Ababa: Towards a Globally Competitive City, August, 2010. (project background report – unpublished).
KDI 2010. The Korean Economy – Six Decades of Growth and Development.
Kikeri, Sunita, and Aishetu Fatima Kolo. 2005. “Privatization: Trends And Recent Developments” World Bank Policy Research Working Paper 3765, November 2005. Available at: http://rru.worldbank.org/Documents/Privatization/Privatiza-tion_paper.pdf
Kwang-kuk, Cho. 1990. “The Outprocessing Linkages in Korean EPZs”, in R. L. Bolin (ed.) Linking the Export Processing Zone to Local industry. The Flagstaff Institute.
Lee. 2008. “Feasibility Study on Establishing Special Economic Zones in Uzbekistan.” Policy Research Issue Paper, Ministry of Finance and Economy, May.
Li, Yue. 2011. “Are the users of services inputs in Sub-Sahara African countries better and
why?—Evidence from the manufacturing indus-tries in Ethiopia.” World Bank, mimeo.
Ministry of Finance and Economic Development. 2006. A Plan for Accelerated and Sustained Devel-opment to End Poverty.
Ministry of Finance and Economic Development. 2009. Terms of Reference for Preparing a National Framework for Development and Operation of Eco-nomic Growth Corridors in Ethiopia.
Ministry of Strategy and Finance. 2008. Progress in Public Sector Reform Plan: Republic of Korea
Warr, Peter G. 1984. “Korea’s Masan Free Export Zone: Benefits and Costs.” The Developing Eco-nomics.
World Bank. 2009. World Development Report 2009: Reshaping Economic Geography. The World Bank: Washington, DC.
World Bank. 2011. Development Economics, Opera-tions and Strategy; Africa Finance & Private Sector Development, Light Manufacturing in Africa: Creating Jobs and Prosperity by Fostering Competition, Volume I, The World Bank Group, January 31, 2011 (draft unpublished report for discussion).
World Bank. 2012a. China 2030: Building a Mod-ern, Harmonious, and Creative High-Income Society. Available at: http://www.worldbank.org/en/news/2012/02/27/china-2030-executive-summary.
World Bank. 2012b. Development Economics, Operations and Strategy; Africa Finance & Pri-vate Sector Development, Light Manufacturing in Africa: Creating Jobs and Prosperity by Fostering Competition. Volume I. The World Bank Group.
World Bank. 2012c. Developing Business Services in Ethiopia: How trade and International Inte-gration Can Help. World Bank, Africa Region (forthcoming).