PROJECT REPORT 01 July 2019 Serosurveys in Three Woredas of Ethiopia that Accompanied Immunization Coverage Surveys and Training of Ethiopian Public Health Institute Serologists Report prepared by: James Campbell and Rebecca Krey Overall coordinating investigator Myron M. Levine, M.D., D.T.P.H. Principal investigators James D. Campbell, M.D., M.S. Mark Travassos, M.D., M.P.H. Site principal investigator Berhane Beyane, M.S. Site coordinating investigator Amha Kebede, Ph.D. Site lead co-investigator Mesfin Tefera Collaborating investigators William Blackwelder, Ph.D. Rebecca Krey, M.D. Vladimir Mishcherkin Lisa Oot, M.P.H Marcela Pasetti, Ph.D. Mardi Reymann Robert Steinglass, M.P.H. Adam Zenaw, Ph.D. A grant from the Bill and Melinda Gates Foundation was awarded to JSI Research and Training Institute (JSI), which issued a sub-contract to the Center for Vaccine Development of the University of Maryland School of Medicine (CVD), Baltimore, MD. CVD, in turn issued a sub- subcontract to the Ethiopian Public Health Institute (EPHI), Addis Ababa, Ethiopia.
Transcript
PROJECT REPORT 01 July 2019
Serosurveys in Three Woredas of Ethiopia that Accompanied Immunization Coverage Surveys
and Training of Ethiopian Public Health Institute Serologists
Report prepared by: James Campbell and Rebecca Krey
Overall coordinating investigator Myron M. Levine, M.D., D.T.P.H.
Principal investigators James D. Campbell, M.D., M.S.
Mark Travassos, M.D., M.P.H.
Site principal investigator Berhane Beyane, M.S.
Site coordinating investigator Amha Kebede, Ph.D.
Site lead co-investigator Mesfin Tefera
Collaborating investigators William Blackwelder, Ph.D.
Rebecca Krey, M.D.
Vladimir Mishcherkin
Lisa Oot, M.P.H
Marcela Pasetti, Ph.D.
Mardi Reymann
Robert Steinglass, M.P.H.
Adam Zenaw, Ph.D.
A grant from the Bill and Melinda Gates Foundation was awarded to JSI Research and
Training Institute (JSI), which issued a sub-contract to the Center for Vaccine Development of the University of Maryland School of Medicine (CVD), Baltimore, MD. CVD, in turn issued a sub-subcontract to the Ethiopian Public Health Institute (EPHI), Addis Ababa, Ethiopia.
OUTLINE
1. ACRONYMS
2. EXECUTIVE SUMMARY a. Introduction b. Methods c. Key results d. Successes e. Challenges
3. INTRODUCTION
a. Vaccination coverage survey and serosurvey b. Vaccination in Ethiopia c. Background on serologic responses after vaccination
i. Tetanus vaccine ii. Hib vaccine iii. Measles vaccine
d. Background on dried blood spots and strips (DBS)
4. METHODS a. Vaccination coverage survey
i. Study population and sample size ii. Knowledge, attitude and practice surveys iii. Team composition iv. Workflow v. Definition of various surveys, coverage and protection
b. Vaccination serosurvey i. Selection and preparation ii. Team composition
1. Team leader and deputy team leader 2. Local health worker 3. Phlebotomist 4. Medical technologist 5. Driver
iii. Equipment iv. Workflow
1. Coordination with coverage survey team, setup and consent 2. Phlebotomy and venipuncture 3. Serum collection and sample processing 4. Treatment for anemia and vitamin A supplementation 5. Data collection and quality control
v. Serum processing and analysis c. DBS processing, elution and analysis
i. DBS elution and processing ii. DBS samples from healthy US adult volunteers iii. DBS sensitivity analysis
d. Correlation between documented coverage and serologic protection
5. RESULTS a. Coverage survey and serosurvey duration and enrollment
b. Tetanus vaccination
i. Tetanus vaccination coverage and seroprotection in toddlers in 2013 and 2016 surveys
a. Administrative coverage b. Traditional survey coverage c. JSI survey coverage d. Documented coverage e. Seroprotection tetanus antitoxin antibody ≥ 0.15 IU/mL f. Seroprotection tetanus antitoxin antibody ≥ 0.05 IU/mL g. Comparison of seroprotection tetanus antitoxin titers ≥ 0.05 IU/mL vs. ≥
0.15 IU/mL h. Tetanus coverage vs. protection i. Comparison 2013 vs. 2016 tetanus coverage and serosurvey results
ii. Prevalence of protective tetanus antitoxin antibodies in relation to the number of doses of pentavalent vaccine administered to a toddler
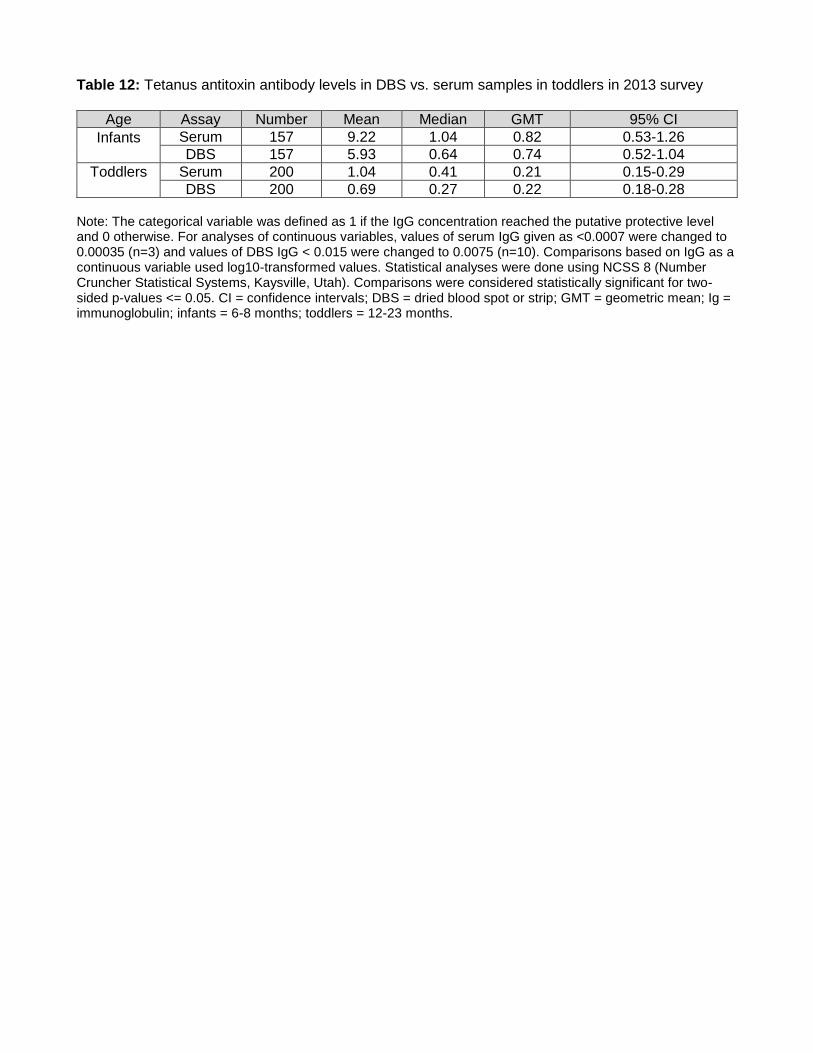
iii. Measurement of tetanus antitoxin antibodies in DBS samples in toddlers
c. Hib vaccination i. Hib vaccination coverage and seroprotection in infants in 2013 survey ii. Prevalence of protective anti-PRP antibodies in relation to the number of doses
of pentavalent vaccine administered to an infant iii. Measurement of anti-PRP antibodies in DBS samples in infants in 2013 survey
d. Measles vaccination
i. Measles vaccination coverage and seroprotection in infants and toddlers in 2013 and 2016 surveys
a. Administrative coverage b. Traditional survey coverage c. JSI survey coverage d. Documented coverage e. Seroprotection f. Measles coverage vs. protection g. Comparison 2013 vs. 2016 measles coverage and serosurvey results
ii. Prevalence of protective measles antibodies in relation to the number of doses of measles vaccine administered to a toddler or infant
iii. Measurement of measles antibodies in DBS samples in toddlers a. 2013 survey b. 2016 survey
iv. Measurement of serum measles antibodies via PRN vs. ELISA v. Interpretations of measles antibody levels measured via ELISA and PRN by two
different technicians in a subset of 39 toddlers from Hintalo Wajerate in the 2016 survey
vi. Correlation of timing of measles vaccination and serum sample collection a. Age in days until measles vaccination b. Time from measles vaccination until serum sample collection c. Time to measles vaccination and correlation with seroprotection
6. DISCUSSION a. Serosurvey enrollment success
i. Community buy in ii. Integration of coverage and serosurveys
b. Serosurvey serum collection success c. Vaccination failure and discrepancies between coverage and protection d. DBS processing and use
i. Single vs. multiple spot testing ii. Differences between DBS samples from adult US volunteers and Ethiopian
children e. Future directions
7. CONCLUSIONS
a. Vaccination coverage survey and serosurvey successes b. Poor agreement in vaccination coverage and seroprotection
8. LIST OF FIGURES
9. LIST OF TABLES
10. REFERENCES
11. TABLES AND FIGURES
12. SUPPLEMENTAL MATERIALS
1. ACRONYMS
® registered trademark
°C degrees Celsius
Addis Ababa Capital of Ethiopia, headquarters for JSI and EPHI
administrative coverage
proportion of children in a targeted population who are reported by authorities to have been vaccinated
Arbegona woreda located in SNNPR region
Assaieta woreda located in Afar region
BCG Bacillus Calmette-Guérin tuberculosis vaccine
coverage survey systematic survey to check documentation of coverage via EPI registry, vaccination cards or parental recall
coverage/covered Reported vaccination by one or more means of obtaining vaccination history: EPI registry, vaccination cards or parental recall
CRF case report form
CS coverage survey
CVD Center for Vaccine Development located in Baltimore, MD
DBS dried blood spot or strip; blood sample collected by fingerprick on filter paper or strip
dL deciliter
documented coverage
evidence of vaccination by vaccination card or EPI registry (i.e., written individual evidence of vaccination)
DTP diphtheria, tetanus and pertussis vaccine
DTwP diphtheria tetanus and whole cell pertussis vaccine
EHNRI Ethiopian Health and Nutrition Research Institute
Invalid Invalid doses of pentavalent vaccine are those given before day of life 39. Invalid doses of measles vaccine are those given before day of life 267.
IPV inactivated polio vaccine
IU international unit
JSI Inc. John Snow Research and Training Institute, Inc
JSI survey coverage
Evidence of vaccination by vaccination card, EPI registry or parental recall
mcg micrograms
MD Maryland
mIU milli- international unit
mL milliliter
mm millimeter
MOH Ministry of Health
NPV negative predictive value
OPV oral poliovirus vaccine
Parental recall parents or caregivers stating vaccine given
PBS phosphate buffered saline
PC personal computer
PCV Pneumococcal 10 conjugate vaccine
Pentavalent vaccine
DTwP-HBV-Hib combination vaccine
PPV positive predictive value
PRN plaque reduction neutralization assay for detection of measles antibodies
PRP polyribosylribitol phosphate, the hib capsular polysaccharide
Record documentation in the epi registry
rpm rotations per minute
Seroprotection evidence of vaccine-specific or pathogen-specific antibodies above threshold demonstrating protection from that pathogen
Serosurvey systematic survey to collect serum samples to test for specific antibodies to vaccines to document seroprotection
SIA supplemental immunization activities
SNNPR Southern Nations, Nationalities and People’s Region
SOP standard operating procedure
SS serosurvey
SST serum-separating tube
TM trademark
Toddler child 12-23 months of age
Traditional coverage survey
evidence of vaccination by card or parental recall
TT tetanus toxiod
U units
US United States
V volts
Vaccination cards family-held vaccination record documenting the vaccinations that an infant or child has received
Valid first pentavalent vaccine on day of life 39 or later; first measles vaccine on day of life 267 or later.
W watts
WHO World Health Organization
Woreda district, third-level administrative division in Ethiopia
µl microliter
2. EXECUTIVE SUMMARY
A. Introduction
Effective, timely vaccinations are key to reducing vaccine-preventable diseases. Documentation of vaccination can be estimated by administrative means, review of local healthcare facility registries and/or hand-held personal vaccination cards, and parental recall. Although there may be high reported vaccination coverage (i.e., evidence of vaccination by one of the means above), actual serologic protection (seroprotection), as documented by serum vaccine-specific (in the case of tetanus) or either pathogen-derived or vaccine-derived specific antibody titers (in the case of measles and Haemophilus influenzae type b (Hib)), may not correlate with reported coverage rates, potentially leaving documented covered children vulnerable to these diseases. However, obtaining serum blood samples from children poses challenges and requires coordination of resources to ensure appropriate collection and handling of blood specimens. Increasing the accuracy of estimations of vaccination coverage and seroprotection against vaccine-preventable diseases can help to improve vaccination practices and improve children’s health. B. Methods
Coverage surveys in combination with serosurveys were conducted in three woredas in
Ethiopia in 2013 and 2016. Funding for the project was provided by the Bill & Melinda Gates Foundation, the Federal Ministry of Health of Ethiopia, and the Ethiopian Public Health Institute (EPHI). The work was performed by JSI Research and Training Institute, Inc. (JSI) and its contractors and by the Center for Vaccine Development of the University of Maryland School of Medicine (CVD). Toddlers (age 12-23 months) were randomly selected using World Health Organization (WHO) survey protocols in 2013 and 2016 (1); infants (age 6-8 months) were studied in 2013 only. Vaccination coverage was estimated using publicly reported administrative data, the Expanded Programme on Immunization (EPI) vaccine registers at health facilities, vaccination cards, and parental recall. Serum antibody levels directed against antigens from three vaccine components (tetanus, Hib, and measles) were then measured in toddlers and infants participating in the coverage survey. This approach provides objective serologic evidence of whether the Ethiopian toddlers and infants have immunity against tetanus, Hib, and measles.
The collection of serum samples requires an experienced phlebotomist to obtain venous blood
as well as someone to separate the serum or plasma from cells. The serum or plasma specimens must then be maintained in a reverse cold chain during transport to the laboratory. Because of the complexity of this process, and in anticipation of potential future serosurveys that could be performed using simpler techniques, we also assessed the utility of obtaining dried blood spots (DBS) by collecting a drop of blood from a finger prick onto a filter paper or strip. The proportion of children with evidence of coverage was compared to the proportion with antibodies in the seroprotected range. DBS were compared to serum antibody titers to determine if DBS (which are simpler to collect and do not require a reverse cold chain) could be used instead of serum obtained from venipuncture. Throughout the report, we refer to “coverage” when we are describing the proportions of children deemed vaccinated based on review of administrative data, vaccination cards, EPI registers, parental recall, or some combination of these. We refer to “seroprotection” when we describe children with antibody concentrations that exceed a threshold correlate of protection. C. Key Results
1. We were able to meet or exceed our estimates of enrolled children. In 2013, 87% of children who participated in the coverage survey enrolled in the serosurvey, and serum
samples were successfully collected from 96% of the enrolled children. In 2016, 91% of children who participated in the coverage survey enrolled in the serosurvey, and serum samples were successfully collected from 97% of them.
2. There is significant variability in estimates of vaccination coverage and seroprotection by woreda, year, and vaccine. For each of the vaccines and the diseases they are intended to prevent, there was significant variability in the reported vaccination coverage rates compared to rates of seroprotection. For example, in Arbegona in 2016 the various methods for estimating coverage showed measles coverage in toddlers to be 50-80%. However, only about 36% of toddlers had seroprotective titers of measles antibodies using the gold standard assay. Similar discordance between estimates of vaccination coverage and seroprotection are seen in the other woredas as well. There was a statistically significant difference between the proportions “covered” by various methods of coverage estimation and proportions seroprotected.
3. There is poor agreement, in general, between data supporting “vaccination coverage” and
data showing “seroprotection.”
4. The interventions to improve vaccination and record keeping instituted after the 2013 survey led to evidence of seroprotection against tetanus (a marker for vaccination with pentavalent vaccine) in most children in all woredas, but only modest levels of seroprotection against measles. During the period from 2013 to 2016, JSI worked with the Ethiopian Ministry of Health (MOH) and others to improve vaccination coverage. From 2013 to 2016, the proportion of toddlers seroprotected against tetanus increased in all three woredas leading to approximately 80% to 98% of all toddlers having evidence of seroprotection. However, compared to 2013, in 2016 the proportion of children with seroprotection against measles increased in all woredas, but was still too low to prevent outbreaks.
5. More work needs to be done to evaluate the use of DBS vs. serum samples. For tetanus
antibodies, DBS had a high specificity but low sensitivity when compared to serum samples. For the 2013 survey, DBS had good overall high sensitivity, negative predictive value (NPV) and overall accuracy. However, these results were not duplicated in 2016. In 2016 the DBS had a low correlation with serum antibodies and overall variable sensitivity, specificity, positive predictive value, NPV and accuracy. All estimates of concordance between the techniques were significantly lower than the 2013 results. This suggests the need to collect more data to ascertain the accuracy of DBS compared to serum antibodies.
D. Successes This study shows that it is possible to run simultaneous coverage surveys and serosurveys to assess vaccination coverage and seroprotection, respectively. We used a carefully defined team of personnel, and each member had specific roles. We also used a detailed list of materials required to complete the surveys. The surveys were completed within a space of 47 days in 2013 and 41 days in 2016. Involving local guides and engaging the community were key to the high enrollment in both sections of the study. Community buy-in, through the use of local guides and members of the Ethiopian health department, contributed substantially to this project’s success. Traveling to the children and parents and performing the coverage survey and serosurvey on the same day helped to ensure easy enrollment. Drawing blood on children is stressful and challenging for children, parents, and health care team members in any situation. The expertise of the phlebotomists was one key reason for the impressive success rate in collection of serum from the children and infants. E. Challenges
Conducting a study in rural Ethiopia presents a number of challenges. Serum samples needed to be processed quickly and kept frozen to ensure that antibody levels did not degrade. This can be difficult when power supplies are unreliable, but we were able to do so using portable freezers, quality control checks, back-up generators, and frequent shipping. Appropriate processing required that team members be trained to handle specimens—inadequate handling could result in falsely low antibody levels, leading to underestimation of seroprotection. In addition, for Hib in toddlers and measles in both age groups, it is not known which children studied had prior infections with the pathogens that could explain their elevated antibody titers, instead of vaccination. This study also highlights the need to improve the effectiveness of infant immunization services in Ethiopia. Understanding the causes of the low proportions of infants and toddlers with evidence of seroprotection in certain regions and higher proportions in other regions may enable interventions that improve coverage and protection levels everywhere in Ethiopia. This study provides a vision for how to perform coverage surveys and serosurveys in the future.
3. INTRODUCTION A. Vaccination coverage survey and serosurvey Ensuring that vaccinations are given at the appropriate time, are effective, and are documented appropriately is an essential component of reducing vaccine-preventable diseases. One means to evaluate the proportion of targeted persons who have received specific vaccines or vaccine series is by calculating “coverage.” Reported coverage estimates may vary drastically with actual serologic protection, which may be demonstrated by the presence of target levels of antibodies. Immunization services in developing countries administer multiple vaccines to children and pregnant women through routine immunization schedules that follow the Expanded Programme on Immunization (EPI) guidelines (Table 1), and through supplemental immunization activities (SIAs) that include periodic mass vaccination campaigns. Estimating vaccination coverage in a region provides governmental and international partner agencies valuable information on the effectiveness of immunization services. Recognizing barriers to vaccination and areas of under-vaccination are key to improving vaccination coverage and preventing disease.
World Health Organization (WHO) guidelines for performing immunization coverage surveys
have traditionally relied on family-held vaccination records and parent recall (1). More recently, these surveys have focused on vaccination records held either by the family (vaccination cards) or by the local health facility (registries). Both cards and registries may be incomplete or missing, and parental recall may be inaccurate. In contrast, a serosurvey that measures antibodies produced in response to vaccination or stimulated by prior contact with the pathogen provides an objective measure of immunization coverage and protection from disease. However, serosurveys also pose notable challenges, including the need to obtain community and individual family participation; and difficulties in collecting venous blood samples from infants and toddlers in remote conditions and maintaining the integrity of specimens with a reverse cold chain. Effective strategies and tactics for implementing a serosurvey in conjunction with a coverage survey, particularly in remote conditions, had not previously been described before the 2013 portion of our project. This report describes the performance of simultaneously coordinated vaccination coverage surveys and serosurveys conducted in Ethiopia in 2013 and then again in 2016, focusing on the techniques that enabled successful execution of this challenging endeavor.
The Federal Ministry of Health of Ethiopia, in collaboration with JSI Research and Training
Institute, Inc. (JSI) and the Center for Vaccine Development of the University of Maryland School of Medicine (CVD), and with funding provided by the Bill and Melinda Gates Foundation, undertook this program. The program’s goal was to assess the effectiveness of immunization services for toddlers (12-23 months) and infants (6-8 months) in three woredas: Assaieta, Arbegona, and Hintalo Wajerate (Figure 1). JSI and its contractors performed vaccination coverage surveys, largely following the methodology recommended by the WHO. These surveys, which constitute standard public health practice, obtained information about the proportion of children with a history of having received vaccinations according to the Ethiopian EPI schedule (Table 1), including which vaccines, the number of doses and the age of receipt of the vaccines. Data on all recommended vaccinations were collected, but for the purposes of the serosurveys, the vaccinations targeted were the measles vaccine and pentavalent vaccine, targeting serologic tests for tetanus and Haemophilus influenzae type b (Hib) vaccination. The means of determining vaccination coverage were documentation on individual family-held vaccination cards, health facility vaccination registers (EPI registry), and parental recall. CVD and the Ethiopian Public Health Institute (EPHI) then performed a serosurvey, obtaining a blood specimen from each toddler or infant enrolled in the vaccination coverage survey whose parent provided permission. The serum was tested for levels of antibodies directed against up to three vaccine antigens, depending on the age group. The study’s primary objective was to measure serum antibody levels against specific vaccine antigens in order to derive an objective estimate of the
proportion of Ethiopian children who are protected against specific vaccine-preventable infectious diseases, and to compare those data with the coverage estimated by the coverage survey. B. Vaccination in Ethiopia
At the time of the survey, the Ministry of Health (MOH) directed that children in Ethiopia receive a series of vaccinations during the first year of life (Table 1). At birth, they were expected to receive Bacille Calmette-Guérin (BCG) to protect against tuberculosis and oral polio vaccine (OPV) to protect against polio. At 6, 10, and 14 weeks, they were expected to receive pentavalent vaccine (DTP-HBV-Hib), OPV, and pneumococcal conjugate vaccine (PCV) to protect against diphtheria, tetanus, pertussis, Haemophilus influenzae type b (Hib), hepatitis B, polio, and pneumococcus. At 6 and 10 weeks they were expected to receive the rotavirus vaccine. Since 2016, they also receive the inactivated polio vaccine (IPV) at 14 weeks to protect against polio. At 9 months, they were expected to receive measles vaccine. In some instances, SIAs are performed. These mass campaigns typically target children across an expanded age range, regardless of previous vaccination through the routine schedule. For example, the Assaieta woreda in the Afar region had a measles vaccination SIA a number of months prior to our 2016 study activities.
C. Background on serologic responses after vaccination i. Tetanus vaccine Tetanus antibodies are only formed after immunization, and not as a result of clinical tetanus illness. The presence of protective levels of tetanus antibodies in toddlers or infants is a classic indicator of immunization with tetanus vaccine. This phenomenon was studied in the 2013 study in toddlers (12 to 23 month olds) and infants (6 to 8 month olds) and only in toddlers in the 2016 study. Infants in developing countries typically receive tetanus vaccination from either DTwP vaccine or from pentavalent vaccine. The pentavalent vaccine contains antigens against five diseases: diphtheria, tetanus, pertussis, Hib, and hepatitis B. Interestingly, children may also mount tetanus antitoxin antibody responses when given vaccines that use tetanus toxoid as a carrier protein linked to capsular polysaccharide antigens, such as PRP-TT, the most common Hib conjugate used in pentavalent vaccine, and MenAfriVac-meningococcal A capsular polysaccharide conjugated to TT. ELISA, or Enzyme Linked Immunosorbent Assay, offers a high-throughput measurement for tetanus antitoxin antibody. A tetanus antitoxin antibody titer ≥ 0.15 IU/mL indicates that on the day of collection the subject had a level of tetanus antitoxin antibody 15 times the threshold level of protection (0.01 IU/mL), and the child is likely to remain protected for several years. Even levels of 0.05 IU/mL, which remain in the range of values reportable by our Applied Immunology Laboratory, provide evidence of protection among toddlers. By the age of 12-23 months, the ages at which we collected the blood of enrolled toddlers, there are no residual maternal antibodies, and using a cut-off of ≥ 0.05 IU/mL is an excellent indicator that the child has likely received at least two doses of pentavalent vaccine. Where prenatal care includes immunization of pregnant women with tetanus vaccine, some tetanus antitoxin antibody levels in infants below nine months of age can derive from maternally transferred antibodies or in response to immunization with pentavalent vaccine. A cut-off of tetanus antibody ≥ 0.05 or 0.15 IU/mL is not a reliable indicator of infant vaccination in infants 6-8 months of age, since multigravida mothers who have received multiple doses of prenatal tetanus vaccines can have quite elevated titers. Infants born to such women may have residual maternal antitoxin antibody at this level. Preliminary results suggest that a higher cut-off, such as ≥ 1.0 IU/mL, for tetanus antitoxin antibody, should be used for infants; but more work is needed to further clarify the cut-off. Few serosurvey data have been generated since the introduction of pentavalent vaccine into the EPI.
One may ask why the original cut-off for the serosurveys was a tetanus antitoxin antibody titer that is 15 times the protective threshold. There are two reasons. First, that cut-off has been used in
multiple published population-based serosurveys, thereby setting a precedent (2, 3). Second, it had been reported that, at serum tetanus antitoxin antibody titers below 0.15 IU/mL, some ELISAs did not give reliable results versus measurement of neutralizing antitoxin antibody in animal models, whereas above that value there was excellent concordance between ELISA titers and true neutralization titers. However, in 2017, Dr. Marcela Pasetti and Ms. Mardi Reymann did a detailed assessment of the CVD tetanus antitoxin ELISA and determined that it gives accurate results down to a cut-off of 0.02 IU/mL. Therefore, the 2013 and 2016 serosurvey specimens can also be analyzed at a cut-off of 0.05 IU/mL with confidence that the results are accurate in predicting protection in toddlers with antibodies surpassing the threshold. In this report, we will discuss the results using both a seroprotective threshold of 0.15 IU/mL and 0.05 mIU/mL for tetanus antitoxin antibodies and compare the two values. ii. Hib vaccine Measurement of Hib anti-PRP antibodies can be used as a marker for Hib vaccination in specimens of serum from infants 6-8 months of age. Toddlers and older children may have elevated Hib anti-PRP antibodies due to other causes, such as upper respiratory tract colonization with Hib or other bacteria (e.g., certain strains of Escherichia coli) that produce PRP or other capsular polysaccharide antigens that cross-react with PRP. They can also derive anti-PRP antibodies from vaccination with Hib conjugate vaccine. Hib vaccine seroprotection in infants was studied in the 2013 survey but not in the 2016 survey since in the 2016 survey, only toddlers were enrolled. A high concentration of anti-PRP antibody (≥ 1.0 mcg/mL) in infants 6-8 months of age constitutes a sensitive and specific objective indicator of timely immunization with two or three doses of pentavalent vaccine; and of enduring protection against invasive Hib disease. Serosurveys for Hib anti-PRP antibodies in infants offer advantages over the measurement of tetanus antitoxin antibody in toddlers because the Hib anti-PRP antibody in this age group provides evidence of the timeliness of immunization with pentavalent vaccine. Timely immunization is critical to protect young infants against pertussis, hepatitis B, and Hib, infectious diseases that cause peak morbidity in infants. Epidemiologic and seroepidemiologic studies carried out by CVD-Mali (Centre pour le Développement des Vaccins du Mali) in Bamako, Mali, West Africa showed the incidence of invasive Hib disease (meningitis, sepsis, etc.) peaks at 6-7 months of age in sub-Saharan Africa (4). High titers of Hib anti-PRP antibody are uncommon in unvaccinated infants even after invasive Hib disease. Prior to the introduction of pentavalent vaccine into the EPI in Bamako, only 0.5% of infants had Hib anti-PRP antibody ≥ 1.0 mcg/mL (4). At a point 30 months after introduction of Hib vaccine into the EPI in Bamako, the Hib disease burden had fallen by 88% and 82% of infants had Hib anti-PRP antibody titers ≥ 1.0 mcg/mL. iii. Measles vaccine Measles antibodies in toddlers derive either from measles infection or from immunization with measles vaccine (in infants, they may represent maternally-derived antibodies). The presence of measles antibodies in toddlers at a titer ≥ 120 mIU/mL indicates that the child is protected from the measles virus and thus will contribute to an epidemiologic barrier to dampen transmission of wild-type virus in the community. Measles antibodies were tested in the 2013 survey in toddlers and infants and only in toddlers in 2016. CVD ELISA measles antibody concentrations ≥ 120 mIU/mL have correlated closely with titers ≥ 120 mIU/mL measured using the “gold standard” measles PRN assay and WHO International Serum Standards 2 or 3. Performance of PRN assays is expensive, technically demanding, and not readily available for high throughput. The performance of PRN assays requires a facility that can maintain cell cultures, infect cell cultures with live wild-type measles virus, and report on the serum dilutions able to reduce plaques in cell culture when comparing virus inocula alone with virus inocula incubated with subject serum. Another challenge is that there may be inter-reader variability in the PRN assays based on the interpretation of the assay. This will be discussed later in
the results section. With large serosurveys, measles antibodies are better measured via ELISA and calibrated using WHO International Serum Standards 2 or 3. In this report, we provide data on ELISA and PRNs, but we consider the PRN results the most accurate when determining protection. D. Background on dried blood spots and strips (DBS)
DBS methods have been used to measure antibodies acquired through infection with other pathogens (e.g., HIV) or antibodies to vaccine antigens, such as measles in children living in industrialized countries and tetanus antitoxin in adults. One entire circular dried blood spot on filter paper or one dried blood strip on the tip of a thin plastic holder is typically necessary to measure antibodies to one antigen. Figure 2A shows examples of the dried blood spots. Figure 2B shows examples of dried blood strips. The existing DBS methods do not enable reliable, quantitative measurement of antibodies to the vaccine antigens in these key target groups (infants and toddlers). To our knowledge, the use of DBS has not been validated to determine immune status in infants and toddlers living in low-resource areas compared to traditional serosurvey methods. In our study, we investigated the use of DBS for measurement of antibodies to vaccine antigens, as an objective tool to assess the performance of immunization services and the proportion of Ethiopian children protected against three vaccine-preventable infectious diseases (tetanus, Hib, and measles). Filter paper was used in the 2013 survey; and filter paper strips adherent to the distal end of a thin rectangular plastic strip were used in the 2016 survey.
The DBS method would be more practical and less invasive than collection of blood by venipuncture. With the DBS, a significantly smaller volume of blood is needed, drops rather than milliliters for a serum sample. The DBS blood may be obtained by finger or heel stick rather than from venipuncture, which requires specialized training and phlebotomists. The DBS method is also simpler and more cost-effective than standard serology performed in serum samples because it avoids the need for serum separation in the field, which is more involved and requires equipment and trained personnel. DBS samples can be conveniently stored and transported in plastic bags with dry packs to absorb moisture. This avoids the need for cold chain and reduces expenses of specimen transportation. The secondary objective of this study was to measure antibody levels to tetanus, Hib, and measles in infants and toddlers by both serum samples and DBS. A tertiary objective was to correlate antibody titers measured in serum thawed from frozen aliquots with antibody titers measured in eluates of the dried blood stored on filter paper. 4. METHODS A. Vaccination coverage survey i. Study population and sample size Three districts, or woredas, in Ethiopia were studied; Assaieta in the Afar region, Arbegona in the Southern Nations, Nationalities and People’s Region (SNNPR), and Hintalo Wajerate in Tigray region (Figure 1). In each of the three woredas, a target of 300 toddlers (12-23 months) were surveyed with a goal of enrolling 900 toddlers in total. In the 2013 study, infants (6-8 months) were also surveyed, with a goal of enrolling 100 infants in each woreda, for a total of 300 infants. In 2016, no infants were targeted or enrolled. Table 2 summarizes the coverage survey design. In 2013, study participants (infants and toddlers) were surveyed once over a period of approximately three months (February to early April); then in early 2016, a distinct group of toddlers only (no infants) residing in the same woredas were surveyed over approximately the same time period (February to late March). ii. Knowledge, attitudes, and practice surveys
JSI obtained information on immunization services in Ethiopia through community-based interviews with parents, frontline workers, and district health officials; and through focus group discussions (FGDs) with mothers, fathers, and other caregivers. FGDs were intended to help researchers learn if and how deficiencies within the health services impacted vaccination coverage, parents’ knowledge and attitudes towards vaccination, and vaccination services; and to understand how family dynamics influence care-seeking behaviors. The knowledge, attitudes, and practices FGDs explored the knowledge and behaviors of guardians of fully vaccinated children, partially vaccinated children, and completely unvaccinated children and other groups who influence the use and quality of vaccination services. JSI used this information to develop and implement interventions to address challenges and improve vaccination coverage. iii. Team composition
The coverage survey in each woreda was conducted by JSI in conjunction with an experienced team from a contracted partner, including Matrix Health and Development Solutions during the 2013 survey, and the Institute for Education, Health and Development during the 2016 survey. A coverage survey team typically included two enumerators. There was one supervisor and one local guide per two teams. Prior to the start of work in each woreda, enumerators and supervisors were recruited and given comprehensive training on EPI essentials, survey tools (including use of a Global Positioning System (GPS) navigation device), and ethics, with role play exercises and actual field practice. Training also included a mock survey exercise to determine the optimum number of households and time needed to administer questionnaires and collect blood specimens. Table 3 lists the responsibilities of the coverage survey team. iv. Workflow
The coverage survey was executed following the traditional WHO immunization coverage cluster survey reference manual (1) with the following differences:
1) All households surveyed were randomly selected, not selected based on proximity to the
first household surveyed. Data collection based on proximity to the first household surveyed was part of the traditional WHO survey instructions. which were in effect in 2013, but is not part of the revised WHO protocol currently in use.
2) Focused group discussions were conducted to tailor the survey to the needs of the community by assessing caregiver immunization knowledge, attitudes, and practices.
3) In addition to vaccination cards and parental or caregiver recall, the study team used vaccination registers at the health facilities where vaccinations were administered to children to help estimate coverage.
The coverage survey team initially visited each cluster, canvassing all homes for children
either 6-8 months old (in the 2013 survey only) or 12 to 23 months old (in both the 2013 and the 2016 surveys). During the visits to households with children in the eligible age ranges, the team recorded the data from vaccination cards and completed the questionnaires for the coverage survey with parents or caregivers. The team also verified immunization records of children at the local health facility if parents or caregivers reported vaccination verbally but could not present the child’s vaccination card, and when there was no card and no parental recall.
The team also recorded the latitude, longitude, and altitude of each household with a GPS
navigation device. Figure 3 shows the GPS locations for the coverage survey participants in the 2016 survey in thee three woredas. v. Definition of various surveys, coverage and protection
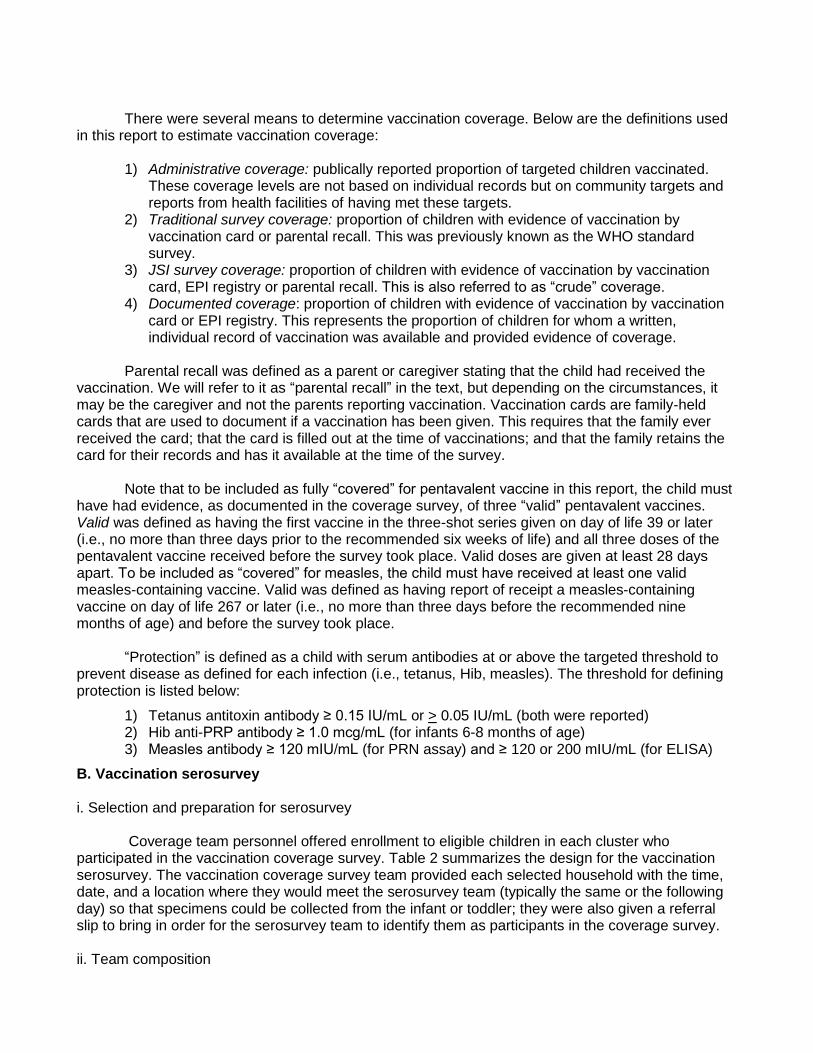
There were several means to determine vaccination coverage. Below are the definitions used in this report to estimate vaccination coverage:
1) Administrative coverage: publically reported proportion of targeted children vaccinated. These coverage levels are not based on individual records but on community targets and reports from health facilities of having met these targets.
2) Traditional survey coverage: proportion of children with evidence of vaccination by vaccination card or parental recall. This was previously known as the WHO standard survey.
3) JSI survey coverage: proportion of children with evidence of vaccination by vaccination card, EPI registry or parental recall. This is also referred to as “crude” coverage.
4) Documented coverage: proportion of children with evidence of vaccination by vaccination card or EPI registry. This represents the proportion of children for whom a written, individual record of vaccination was available and provided evidence of coverage.
Parental recall was defined as a parent or caregiver stating that the child had received the
vaccination. We will refer to it as “parental recall” in the text, but depending on the circumstances, it may be the caregiver and not the parents reporting vaccination. Vaccination cards are family-held cards that are used to document if a vaccination has been given. This requires that the family ever received the card; that the card is filled out at the time of vaccinations; and that the family retains the card for their records and has it available at the time of the survey.
Note that to be included as fully “covered” for pentavalent vaccine in this report, the child must have had evidence, as documented in the coverage survey, of three “valid” pentavalent vaccines. Valid was defined as having the first vaccine in the three-shot series given on day of life 39 or later (i.e., no more than three days prior to the recommended six weeks of life) and all three doses of the pentavalent vaccine received before the survey took place. Valid doses are given at least 28 days apart. To be included as “covered” for measles, the child must have received at least one valid measles-containing vaccine. Valid was defined as having report of receipt a measles-containing vaccine on day of life 267 or later (i.e., no more than three days before the recommended nine months of age) and before the survey took place.
“Protection” is defined as a child with serum antibodies at or above the targeted threshold to
prevent disease as defined for each infection (i.e., tetanus, Hib, measles). The threshold for defining protection is listed below:
1) Tetanus antitoxin antibody ≥ 0.15 IU/mL or > 0.05 IU/mL (both were reported) 2) Hib anti-PRP antibody ≥ 1.0 mcg/mL (for infants 6-8 months of age) 3) Measles antibody ≥ 120 mIU/mL (for PRN assay) and ≥ 120 or 200 mIU/mL (for ELISA)
B. Vaccination serosurvey i. Selection and preparation for serosurvey
Coverage team personnel offered enrollment to eligible children in each cluster who
participated in the vaccination coverage survey. Table 2 summarizes the design for the vaccination serosurvey. The vaccination coverage survey team provided each selected household with the time, date, and a location where they would meet the serosurvey team (typically the same or the following day) so that specimens could be collected from the infant or toddler; they were also given a referral slip to bring in order for the serosurvey team to identify them as participants in the coverage survey. ii. Team composition
The serosurvey group was based at a local health facility where equipment and supplies were
stored and serum samples were processed, aliquoted, and kept in cold storage. Two identically structured serosurvey groups worked simultaneously so that subjects could be surveyed from two clusters at once. The responsibilities of each team member overlapped so that a member could provide backup as needed (Table 3). 1. Team leader and deputy team leader
The team leader was a physician or nurse with field experience in performing surveys and
collecting specimens in the field. The leader managed overall logistics of each day’s activity and supervised the workflow and provided troubleshooting, as needed. Each team leader had a mobile phone and a satellite phone for use when outside of the cellular network to communicate with each other and with the vaccination coverage team and health facility. At times there was a deputy team leader who would serve as a supplemental leader, phlebotomist and support data collection and DBS preparation. 2. Local health worker
A local health worker was selected by the local health office to serve on the team. This
individual was fluent in the local languages and was already known to the community, including potential participants. Under the direction of the team leader, the local health worker assisted in field site setup, informed consent, and phlebotomy; and also located participants who did not appear at the serosurvey gathering site. 3. Phlebotomist
A phlebotomist for each serosurvey team was chosen from the EPHI based on pediatric
phlebotomy experience, the most important criterion for this position. The phlebotomists were experienced in assuaging a caregiver’s concerns during a blood draw, a potentially stressful situation. Some phlebotomists were experienced persons who worked at the local health facility. 4. Medical technologist
One or more medical technologists worked at each field site, processing samples from both
serosurvey teams and entering information from case report forms into a database. These individuals had previous laboratory experience and were responsible for aliquoting the serum. When available, the medical technologist would also assist the serosurvey team in the field. 5. Driver
A driver was primarily responsible for maintenance of the vehicle and navigating to the blood
collection sites in the field. The driver also assisted with collecting and preparing supplies each day, and helped to keep curious village onlookers from crowding the phlebotomy sites. The driver, who was usually fluent in the local language, also acted as a community liaison and interacted directly with participants and their families, including providing their transport to and from the study gathering site. iii. Equipment
Reliable equipment with backup supplies enabled the serosurvey team to anticipate shortages
and emergencies (Table 4). Most of these supplies were purchased in the United States and shipped to Ethiopia. Equipment was chosen to give each team the capacity to set up a sheltered field site with
a canopy, cot, tarp, and stools where informed consent and venipuncture could occur. Phlebotomy supplies included the option for venous blood draws with either a butterfly needle or needle and syringe combination, depending on the phlebotomist’s preference. Two portable refrigerator/freezers were set up at the local health facility, filled with cold packs, and set to the lowest temperature setting so that the contents could be frozen. One unit was used for daily sample processing. The other unit was used for storage of aliquoted samples. This unit was opened as infrequently as possible, allowing its temperature to remain at or below -20°C. A portable generator was stored at the local health facility for use in the event of a power outage and failure of the facility’s backup generator. A portable label-maker gave each serosurvey team the capacity to prepare pre-printed adhesive labels in indelible ink for serum separator tubes and aliquot vials, as well as for the storage bags for the dried blood spots/strips. iv. Workflow 1. Coordination between the coverage survey team, set-up, and consent
Each morning, the coverage survey and serosurvey team leaders verified the day’s activities,
including the serosurvey gathering site and time and the logistics for travel. They also reviewed information collected from the previous day’s participants and resolved any discrepancies in data between the coverage survey and serosurvey. With the aid of a checklist, each serosurvey team assembled equipment and supplies for the day’s activities.
Using the supplies (Table 4), the teams would travel to the sites either via vehicle or on foot.
The teams set up temporary workstations in school and religious compounds, health facilities including health posts, individual homes, and, on rare occasions where no shelter was available, under the shade of trees. At the time of the administration of the coverage survey questionnaire, the coverage survey team informed potential serosurvey participants to meet the serosurvey team at these workstations at a specified time. Once the parent or caregiver arrived at the serosurvey site, the referral slip was verified and the parent or caregivers listened to an audio recording of the consent form in the local language, which provided information about the rationale for collecting blood from the child, the precise procedures, and potential risks and benefits. After listening to the audio recording, each parent or caregiver was given an opportunity to have any questions answered; and they were then asked to sign the consent form. Illiterate parents or caregivers were asked to “sign” with a thumbprint after pressing their thumb on an inkpad, in the presence of a witness.
Each evening, the coverage survey team and serosurvey teams met to discuss logistics and
planning. Representatives from the local health office joined these discussions. Topics discussed included the pace of each team’s activities, to maximize coordination between the two groups; timing and locations of serosurvey visits; accessibility of sites, and incorporation of input and feedback from the local health office. Using a detailed woreda map, three to four clusters were grouped into zones and movement plans were jointly drawn by coverage survey supervisors, serosurvey team leaders, and participating woreda health officers. 2. Phlebotomy and venipuncture
A venous blood sample (maximum volume 3.5 mL) was drawn from each participant.
Venipuncture was performed by local or EPHI phlebotomists with pediatric experience. The local health worker and team leader assisted with each blood draw, securing the child and assisting in the sample collection and processing. Though “papooses” (devices to restrain an infant to facilitate venipuncture) were available, the only tenable means for drawing blood from a child was found to be a caregiver holding the child with assistance from the serosurvey team. When a venous blood draw was unsuccessful, a fingerpick was still obtained. Ten microliters of blood were used to fill a cuvette for point-of-care hemoglobin measurement. Additional drops of blood were used to blot filter paper,
(circles on a filter paper sheet in 2013 and rectangular filter paper strips at the distal end of a plastic strip in 2016), completely filling each filter paper circle or rectangle, with up to five circles or strips filled for each child participant (Figures 2A and 2B). Each filter paper or series of strips was labeled with the participant’s serosurvey identification number. After air-drying for at least four hours, the filter papers or strips were placed in a sealable plastic bag with a desiccant pack. 3. Serum collection and sample processing
Venous blood was drawn either directly into a serum separator tube (SST) or into a syringe
that was then used to fill an SST. When centrifuged, the SST assures that serum is physically separated from the clot by a gel layer. This means that when the centrifuged tubes are put into a refrigerated transport box, should cold hemolysis of erythrocytes occur (as happens in a proportion of refrigerated clot specimens), the serum remains separated from the hemolyzed erythrocyte fragments. One member of the serosurvey team, usually the medical technologist, centrifuged the serum separator tubes on-site using a portable centrifuge (Portafuge™) that plugged into the field vehicle to derive electrical current. The centrifuged SSTs were kept in a cooler with ice packs until further processing later that day. This approach kept the specimens at refrigerator temperature until brought back to the temporary laboratory where they were aliquoted and frozen.
Once or twice each day, the centrifuged SSTs in coolers were brought to a temporary
laboratory set up at the local woreda health center. There, the medical technologist prepared aliquots of each subject’s serum and transferred these aliquots to vials for frozen storage, following a standard operating procedure (SOP). Specimens yielded a maximum of 1.6 mL of serum, from which four aliquots were prepared, with each vial containing approximately 0.4 mL of serum (or less, depending on the actual volume of blood collected from the individual child). A pre-printed specimen identifier sticker on the serum separator tube bearing the serosurvey identification number was matched to each of the four vials. 4. Treatment for anemia and vitamin A supplementation During the encounter with the child at the serosurvey gathering point, caregivers were questioned about their child’s health, including previous intestinal parasitic infections, nutrition, and any specific health concerns they had. A small amount of blood collected (10 microliters) was used to measure the child’s hemoglobin level on the spot at the time of blood collection using a portable device. The presence and severity of anemia was determined using Ethiopian Paediatric Society guidelines (Table 5). Every child with anemia was given HaemUp, a liquid medication containing iron, folic acid, vitamin B12, and minerals. Anemic toddlers and any children suspected of having intestinal parasitic diseases received a broad-spectrum oral anti-helminthic agent (mebendazole). All anemic children were referred to the health center for follow-up (Table 5). Vitamin A supplementation was provided to any child who had not received supplementation in the past month. Looking for and treating anemia provided a direct benefit to every child participating in the serosurvey. Serosurvey teams were equipped, in some instances, with medications to treat common pediatric conditions, such as scabies and diarrheal dehydration. Treatment was provided without charge when these conditions were suspected. 5. Data collection and quality control
Coverage survey enumerators recorded the woreda and district, enumeration code, household
list number, selection number, and GPS location for each participant. Participants also received a unique serosurvey identification number. The serosurvey team recorded data manually on a case report form (CRF) including the following: whether or not blood was obtained; the number of dried blood spots collected; and the degree of anemia and if treatment was given. Quality control on the paper forms was performed the same day as data were collected and before entry into the database.
The health center technician and other trained local EPHI research team members entered these data into an Epi Info 7 database using a laptop computer. Frequent reports enabled improved quality oversight and rapid corrections of transcription errors, logical mistakes, and other errors. This database was queried to produce weekly reports for the teams. v. Serum processing and analysis
The tetrad of vials holding the aliquots of serum was placed into a portable freezer and the samples were kept frozen at the site, prior to transport to EPHI in Addis Ababa. Freezer temperatures were reviewed and documented at least twice per day as part of quality control, carefully following an SOP. If the field site was within one day’s drive to Addis Ababa, samples were transported by vehicle within the portable refrigerator/freezer, which was filled with cold packs. Otherwise, samples were shipped by air courier to Addis Ababa to arrive on the same day, where they were picked up at the airport for storage at EPHI. Two of the four aliquots of serum were shipped frozen to the CVD Applied Immunology Section Laboratory in Baltimore, Maryland for definitive testing for antibodies against selected vaccine antigens. The remaining two aliquots of serum were stored at EPHI, where they were used for additional serologic training and for performance of the serological testing, with CVD serving as the Reference Laboratory. CVD performed preliminary training of Ethiopian serologists, in Baltimore and via video streaming in Addis Ababa for the 2013 survey and by video streaming for the 2016 survey.
Serum antibody titers to antigens from three vaccine components (tetanus, Hib, and measles)
were measured via ELISA. Since less serum may have been available per infant, in testing specimens from the infants in the 2013 survey, we followed a hierarchy of measurements, beginning with measurement of Hib anti-PRP antibodies then tetanus antitoxin antibodies and, if serum remained, measles antibodies (Table 2). Again, infants were not included in the 2016 survey. In both the 2013 and 2016 surveys, tetanus antitoxin and measles antibodies were tested in toddlers. There was not enough serum to perform Hib anti-PRP antibody testing in toddlers in the 2013 study and Hib anti-PRP antibody testing was not done in the 2016 survey. C. DBS processing, elution, and analysis
Paired venous blood and DBS samples (filter papers and strips) were obtained from toddlers and infants. Filter papers and strips were stored at room temperature in a secure, dry location at the temporary laboratory at the woreda health center until they could be transported to EPHI in Addis Ababa. They were then sent to the CVD Applied Immunology Section Laboratory in Baltimore for analysis. The DBS samples were preserved by the Applied Immunology Lab. Most of the DBS collection and elution procedures, as well as the ELISA optimization, had been performed in anticipation of running the Ethiopian samples, using cards and specimens obtained from US adult volunteers. In the 2013 survey, dried blood spots were used but in the 2016 survey dried blood strips were used. Figure 2 shows the difference between the blood spots and blood strips. i. DBS elution and processing
The DBS elution method involves cutting each individual spot first by the round circle and then into multiple pieces, which are then placed in elution buffer and tested for antibody content by ELISA. An exhaustive literature search was conducted, and different techniques were tested to optimize the elution procedure.
Single and multiple 3.2 mm diameter circular spots were cut from different parts of the DBS
spots instead of the entire spot as well as just using one spot. Most of the papers in the literature use one DBS circle for individual tests and this ultimately led to the choice of one six mm center punch for future tests. 50 µl of whole blood (equivalent to 25 µl of serum) is deposited onto one 12 mm circle
(Whatman 903 filter paper). One six mm circle (1/4 inch punch) contains approximately 6 µl of serum based on the calculation for area of a circle (π x r2). For the dried blood strips, the filter paper was cut off and used in a similar fashion.
Different buffer solutions were tested. The elution buffer adopted contains PBS pH 7.4 with
0.05% Tween-20. The blood eluted from the card into the buffer solution appears dark red and contains debris. We reasoned that the quality of the eluate might improve by using a larger volume of elution buffer and more tests could be run from the same eluate. Different elution volumes were tested in combination with various shaking and centrifugation conditions. Larger elution buffer volumes were easier to handle and allowed for a somewhat improved extraction. However, with large elution buffers the sensitivity was reduced and less antibody was detected. A volume of 250 µl of elution buffer was selected. DBS circles were cut and incubated in elution buffer overnight, at 4°C.
As the test of the field samples continued, we noticed that some eluates would bind non-
specifically to uncoated and blocked ELISA plates. We assumed that the debris and blood components in solution, especially the hemoglobin, might be responsible for this non-specific binding. To clarify the eluates, we performed an extensive literature and product search and selected two commercial reagents. The first one was HemogloBindTM, produced by Biotech Support Group. HemogloBindTM is used to remove hemoglobin in plasma/serum samples for analytical chemistry tests. HemogloBindTM was added to the elution buffer in various proportions starting at 1:2 (recommended by the manufacturer) and up to ~1:100. The mix was then centrifuged as described above and tested. Visually, the process appeared to help separate the debris and clarified the eluate. Unfortunately, in some instances, it interfered by reducing antibody titers of samples without non-specific binding (and whose titers matched those of serum). The second reagent tested was LowCross-Buffer® produced by Candor Bioscience GmbH, Limited. This reagent is used to reduce interference in immunoassays by minimizing reactivity of low or medium affinity antibodies (i.e. HAMAs, rheumatoid factors) and by reducing matrix effects. Addition of LowCross-Buffer® to the elution buffer did not improve the quality of the eluates nor the non-specific binding.
Different elution containers were also tested, including 96-well plastic plates, Eppendorf tubes,
and Sarstedt Z-Gel serum separator tube (gel tubes). The gel tubes were found to be more practical, as they allowed for the filter paper to be retained in the matrix gel (as opposed to floating in the liquid), facilitating the collection of the eluate. We determined that the eluates can be stored for one week. Immunoglobulin G (IgG) antibodies are stable in elution buffer for up to seven days at 4°C. To reduce the non-specific binding, different shaking and vortex conditions were tested using different shakers/vortex equipment and time intervals. None of these permutations seemed to show a consistent, significant improvement. No shaking is needed when using the gel tubes. After overnight resting, the eluates are centrifuged for 10 minutes, 10,000 rpm at 4oC. This step allows the removal of the filter paper and facilitates retrieving the supernatant.
ii. DBS samples from healthy US adult volunteers
In preparation for testing the DBS samples from the serosurvey, we performed exhaustive preliminary testing of assay conditions in DBS samples obtained from US adult volunteers (Figure 8). These results showed that the level of antibody correlated in the serum and DBS samples. However, the conditions in the experiments done in the US adult volunteers might not have been representative of those of the DBS samples collected in the field. The DBS eluates from samples collected in the field had non-specific binding which was not seen when testing the DBS from US volunteers, possibly due to a better handling and storage conditions compared with those used in the field.
iii. DBS sensitivity analysis
A problem associated with the DBS testing is that the elution factor (using a 6 mm circle in 250 µl of elution buffer) introduces a 1:44 dilution factor. Our recommended starting dilution to avoid non-specific binding is 1:5. Therefore, the detection of antibodies is already affected by a ~1:200 dilution. Serum samples are tested starting at 1:10, which represents 20 times higher sensitivity than DBS tests. The lowest quantity of antibodies that can be reported with the current DBS procedure, considering the dilution factors mentioned above, are as follows: 1) Tetanus antitoxin antibody 0.015 IU/mL 2) Hib anti-PRP antibody 0.8 mcg/mL 2) Measles antibody 50 mIU/mL
The antibody titers measured in DBS were compared with titers measured in serum through linear regression. Contingency tables were constructed comparing the DBS data with serum results as “gold standard,” using the following standardized cut-offs:
4) Tetanus antitoxin antibody ≥ 1 IU/mL for infants and 0.15 IU/mL for toddlers 5) Hib anti-PRP antibody ≥ 1.0 mcg/mL 6) Measles antibody ≥ 120 mIU/mL and ≥ 200 mIU/mL, as both thresholds are used by
authorities
D. Correlation between documented coverage and serologic protection
The statistical tests we used to evaluate the concordance between vaccination and serologic protection were the McNemar test and kappa statistic. These are described below.
In 2016, we performed a McNemar test and calculated a Kappa statistic as 2 approaches to determine corroboration or agreement between the means to determine vaccine coverage and the means to determine vaccine protection. The primary comparisons were between “documented coverage” (the current WHO standard using evidence found either on the family-held vaccination card or in the EPI register found at the health facility) and surpassing the threshold of serologic protection on antibody assay. The McNemar test analyzes the data in a 2-by-2 table that shows in each cell those toddlers in the following categories: vaccinated and serologically protected, unvaccinated and not serologically protected, vaccinated and not serologically protected, and unvaccinated and serologically protected.
If vaccination is indicative of serological protection (that is, if toddlers who have evidence of having been vaccinated also have evidence of serological protection), and not vaccinated indicative of not being serologically protected (that is, when there is no evidence of having been vaccinated, then the antibody levels are below the protective level), then we expect the number of children who deviate from this, i.e., those who are vaccinated but not serologically protected and those who are serologically protected but not vaccinated (known as discordant pairs) to be similar, as this would suggest that the discordance is due to chance rather than being driven by underlying factors. For paired nominal data, such as this, McNemar’s test can be used to assess discordance, where a statistically significant (p-value < 0.05) result would suggest that there is a difference between the number of children who are vaccinated but not serologically protected and the number of children who are serologically protected but not vaccinated, and that this difference is large enough to not be due to chance.
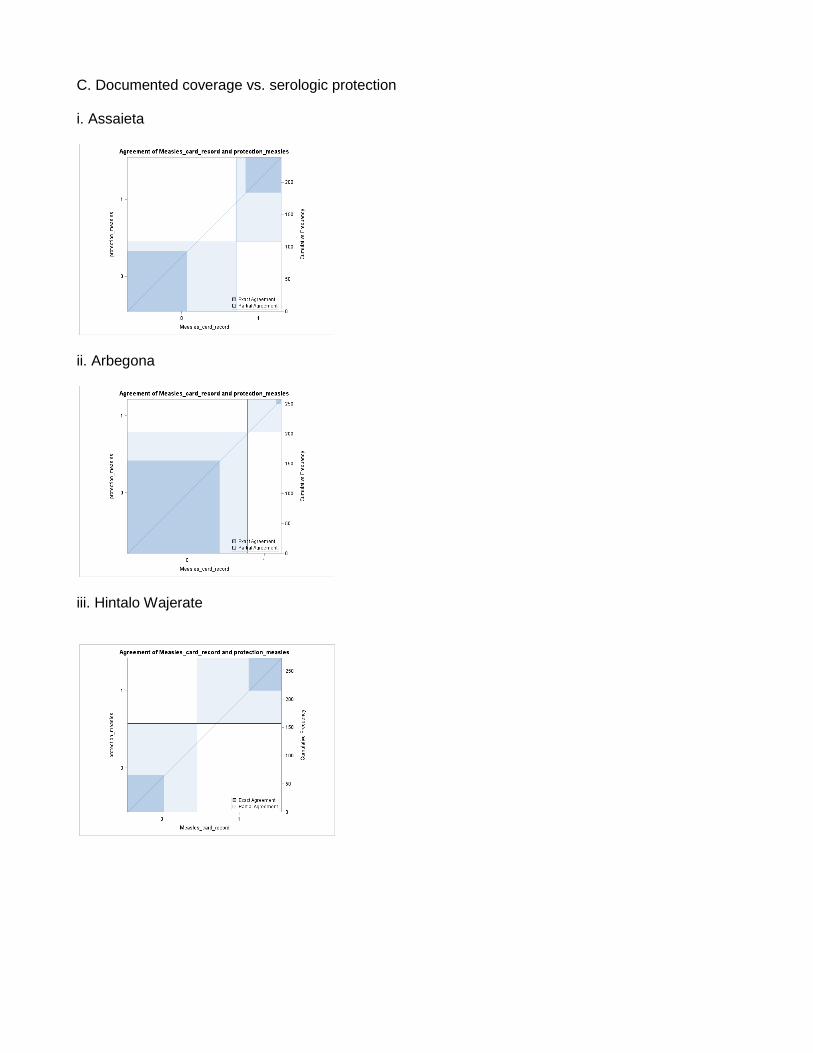
As noted in the summary of McNemar tests (p-values in Tables 7 and 17), for nearly all woredas and both antigens (tetanus and measles), the test is significant. This indicates that the coverage survey and serosurvey are not consistently providing us evidence of coverage/protection in the same children. Take for example the case of measles coverage and protection in Hintalo Wajerate. The table below provides a sample taken from Table S3, which illustrates the correlation between toddlers with “documented vaccinations” (those children with evidence of valid measles vaccination by card or register) with those who have demonstrated serologic protection.
Not serologically protected
Serologically protected Total
No documented vaccination
65 58 123
Documented vaccination
92 58 150
Total 157 116 273
If one looks at the row “Documented vaccination,” the marginal sum is 150. That is, 150 of the 273 toddlers in Hintalo Wajerate who participated in the coverage survey and had blood drawn for measles titers were found to have evidence of having been vaccinated for measles, by either card or register. That is, 150 of 273, or 55%, are “vaccinated (covered).”
If one now looks at the column labeled “Serologically protected,” the marginal sum is 116. That is, 116 of the 273 toddlers had antibody evidence of protection (or, stated another way, 42% of toddlers in this woreda sample had seroprotection).
The proportion vaccinated (55%) and the proportion serologically protected (42%) do not seem greatly different, and without this analysis, one might assume that most of the vaccinated are serologically protected and most of the serologically protected had been vaccinated. However, the table above shows us that is not the case. Of the 150 toddlers recorded in the EPI register or in vaccination cards as “vaccinated” by the survey, only 58 (39%) are serologically protected. And, of the 116 known to be serologically protected by antibody, only 58 (50%) are recorded as “covered” (written documentation of vaccination against measles on the card or in the register). If the cards and registers were an accurate reflection of serological protection, then the cells “no documented vaccination/not serologically protected” and “vaccinated/serologically protected” would subsume nearly all of the marginal sums.
For nearly all McNemar analyses, the evidence by card/register and by antibody are discordant, as described above for measles in Hintalo Wajerate.
An additional way to measure agreement is the Kappa statistic. This measurement provides a form of inter-rater (or inter-test, in this circumstance) reliability. When 2 raters or 2 approaches are taken to the same set of data or children, the agreement between raters or tests may range from very low to near perfect. That is, when one test calls a child vaccinated/serologically protected, the other agrees; and when one test calls a child not vaccinated/serologically not protected, the other also agrees. A Kappa statistic provides a numerical indicator of agreement, with 0 indicating no agreement and 1 indicating perfect agreement. One grading system uses the following scales for the Kappa statistic:
For the comparisons of documented vaccination versus serologically protected, the kappa statistics were typically in the “slight” range. This means that the 2 tests agree infrequently, and much of the agreement could be due to chance, when considered statistically. The implication of this finding
is that one cannot reliably expect that children with evidence of vaccination will also have evidence of seroprotection; and that children without evidence of vaccination will not reliably have evidence of lack of seroprotection. That is, our data support that documented vaccine “coverage” is not a good surrogate for objective evidence of immunologic protection.
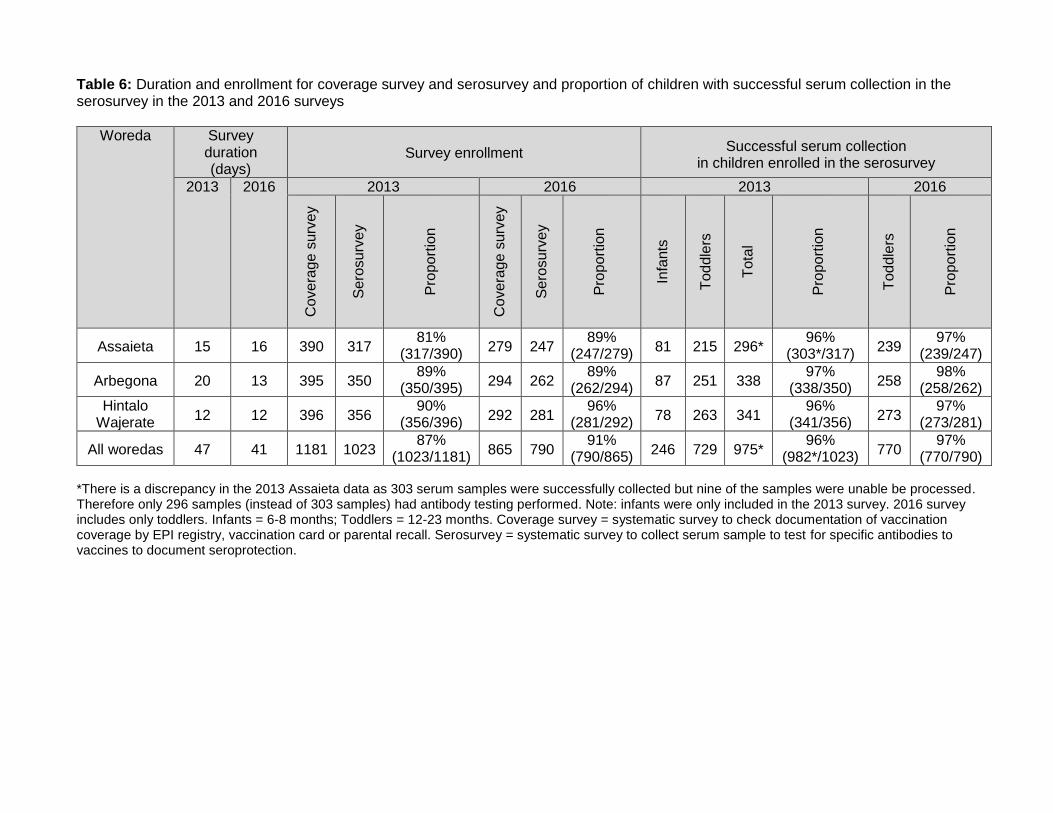
5. RESULTS A. Serosurvey enrollment and duration Survey duration and enrollment and the proportion of children with successful serum collection is summarized in Table 6. This information is also visually represented in flowcharts in Figure 4.
In the 2013 survey, the vaccination coverage survey team collected data on 1,181 children,
including both infants and toddlers across all three woredas. Of these children, 1,023 (87%) were enrolled in the serosurvey. Impressively, 81% to 90% of children enrolled in the vaccination coverage survey in each woreda also participated in the serosurvey. The duration for completion of the vaccination coverage survey and serosurvey in 2013, among approximately 400 children in each woreda, ranged from 12 days in Hintalo Wajerate to 20 days in Arbegona. Of the children enrolled in the serosurvey, serum was successfully collected from 96% to 97% of serosurvey enrollees in each woreda.
In the 2016 survey, the vaccination coverage survey team collected data on 865 toddlers across all three woredas. Infants were not included in the 2016 survey. Of these toddlers, 790 (91%) enrolled in the serosurvey. Impressively, 89% to 96% of children enrolled in the vaccination coverage survey in each woreda also participated in the serosurvey. The duration for completion of the vaccination coverage survey and serosurvey, among 279 to 294 toddlers in each woreda, ranged from 12 days in Hintalo Wajerate to 16 days in Assaieta. Of the toddlers enrolled in the serosurvey, serum was successfully collected from 97% to 98% of serosurvey enrollees in each woreda. GPS coordinates of the 2016 survey participants were recorded (Figure 3). B. Tetanus vaccination i. Tetanus vaccination coverage and seroprotection in toddlers in 2013 and 2016 surveys
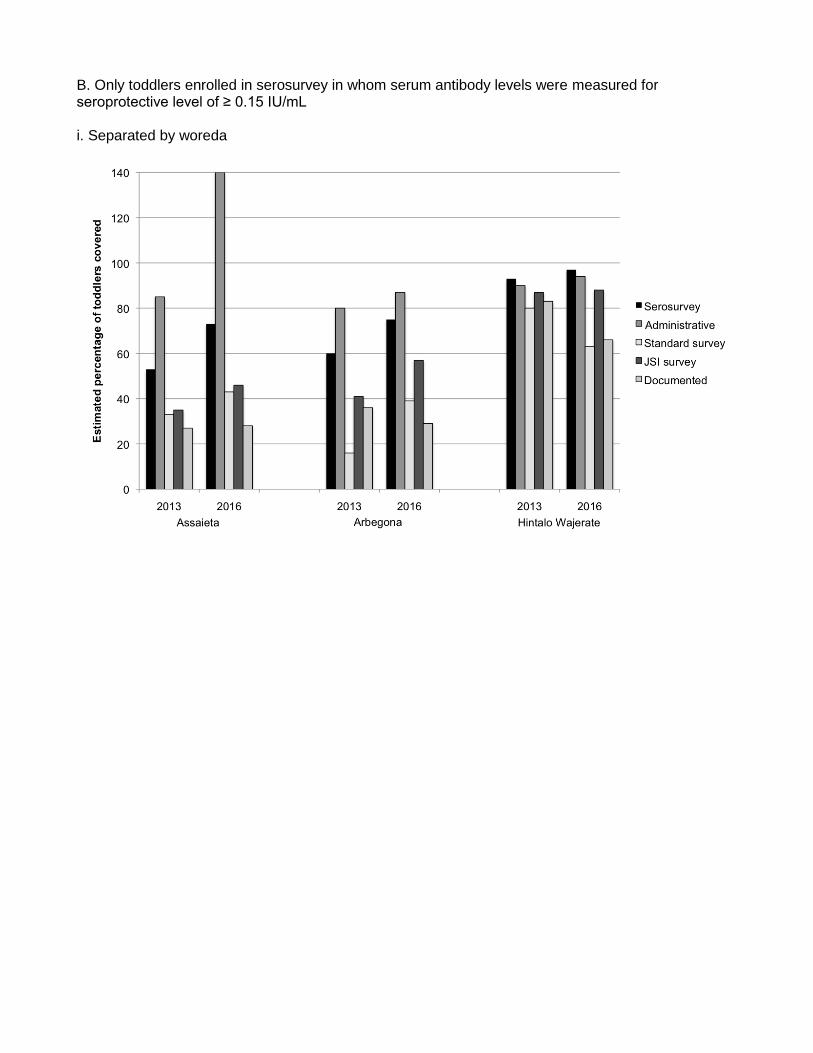
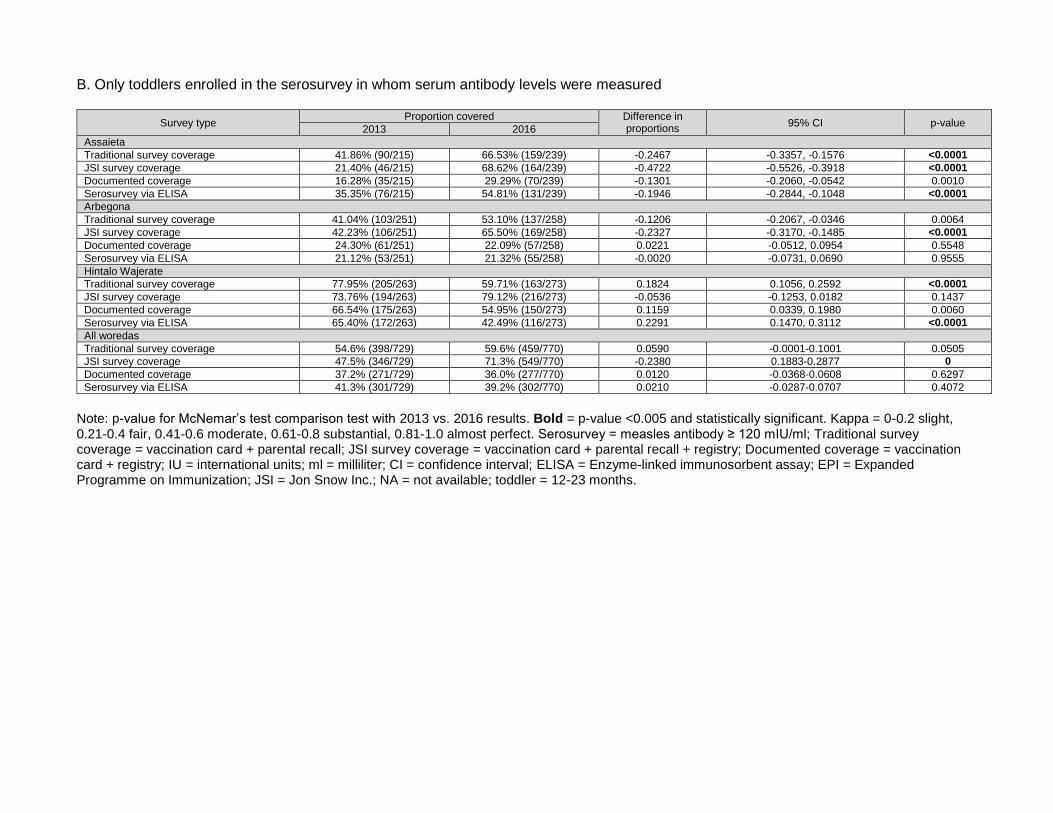
Table 7 summarizes, among toddlers, the pentavalent vaccination coverage estimated by traditional coverage survey (vaccination card or parental recall), JSI survey coverage survey (vaccination card, parental recall, or EPI register), documented coverage (vaccination card or EPI register), and the proportion of children who exhibit protective levels of tetanus antitoxin antibody in the 2013 and 2016 surveys. Table 7A includes all toddlers enrolled in the coverage survey. Table 7B is limited to toddlers enrolled in the serosurvey in whom successful tetanus anti-toxin antibodies were measured. These data are also visually displayed in Figures 5A and 5B. Note the data for tetanus in both the 2013 and 2016 surveys includes only toddlers and does not include infants. a. Administrative coverage
Administrative estimates of tetanus coverage obtained from government sources indicate that for the year 2012 (one year before the 2013 survey) 85% in Assaieta, 80% of toddlers in Arbegona, and 90% in Hintalo Wajerate had received three doses of pentavalent vaccine. The corresponding proportions in toddlers for 2013, the most recent data available to us prior to the 2016 survey, are as follows: 140% in Assaieta, 87% in Arbegona, and 94% in Hintalo Wajerate had received three doses of pentavalent vaccine. With administrative reports over-reporting can occur if estimations under-
estimate the number of children in woreda or multiple doses of vaccine are given to the same child. Thus, the estimates can be over 100%, such as the 140% estimate in Assaieta in 2016. b. Traditional survey coverage
The extent of pentavalent vaccination coverage based on a traditional coverage survey showed striking differences from the vaccination coverage estimates based on administrative data; and a wide disparity among the woredas was also observed (Table 7). For example, for all toddlers enrolled in the coverage survey, Hintalo Wajerate had the highest coverage level by traditional coverage survey estimates, with 79% in 2013 and 64% in 2016, which was not far below the administrative estimate (Table 7A). However, the traditional coverage survey estimates (2013/2016) for all coverage survey participants in Assaieta and Arbegona were 34%/42% and 16%/39%, respectively. These proportions are far below the corresponding administrative estimates of 80%/87% for Arbegona and 85%/140% for Assaieta. Similar results are seen when evaluating only toddlers enrolled in the serosurvey in whom serum was collected; estimates 2013/2016 were 33%/42% in Assaieta, 16%/39% in Arbegona and 79%/64% in Hintalo Wajerate (Table 7B). c. JSI survey coverage JSI modified the “traditional” WHO coverage survey method described above to include a review of vaccination records at EPI units and other health care facilities where vaccinations are administered and records are kept. In 2013, this modified “JSI-type coverage survey” increased slightly (by 1-7 percentage points) the estimates of pentavalent coverage in Assaieta and Hintalo Wajerate, but increased more substantially in Arbegona (40% from 16%) (Table 7A). This was seen among all coverage survey participants and among those toddlers enrolled in the serosurvey in whom antibodies were tested. In 2016, when comparing the JSI modified coverage estimation method to the traditional method in all coverage survey participants, the proportion with pentavalent vaccination coverage in Hintalo Wajerate increased from 64% to 87%: in Arbegona from 39% to 59%, and in Assaieta from 42% to 46% (Table 7A). For only serosurvey participants in whom serum antibodies were drawn there was a similar increase in the 2016 survey from traditional survey estimates to JSI survey estimates with an increase of 3-25% with the largest increase in Hintalo Wajerate and lowest increase in Assaieta (Table 7B). These data show that inclusion of data from registers at health facilities providing EPI vaccination services can complement the data obtained from vaccination cards and parental recall. d. Documented coverage Documented coverage was done in the 2016 survey for both all coverage survey participants and all serosurvey participants in whom antibodies were measured. Documented coverage was estimated only in 2013 survey serosurvey participants in whom serum antibodies were measured. This was due to the addition of analysis for “documented coverage” during the 2016 survey analysis.
For all coverage survey participants in the 2016 survey, documentation was 28% in Assaieta, 29% in Arbegona, and 65% in Hintalo Wajerate (Table 7A). For coverage survey participants, data from 2013 were not available. For all serosurvey participants in whom serum antibodies were drawn, the estimates from 2013 were similar in Assaieta (27% vs. 29%), and higher in Arbegona (36% vs. 29%) and Hintalo Wajerate (83% vs. 66%) (Table 7B vs. Table 7A). e. Seroprotection tetanus antitoxin antibody ≥ 0.15 IU/mL
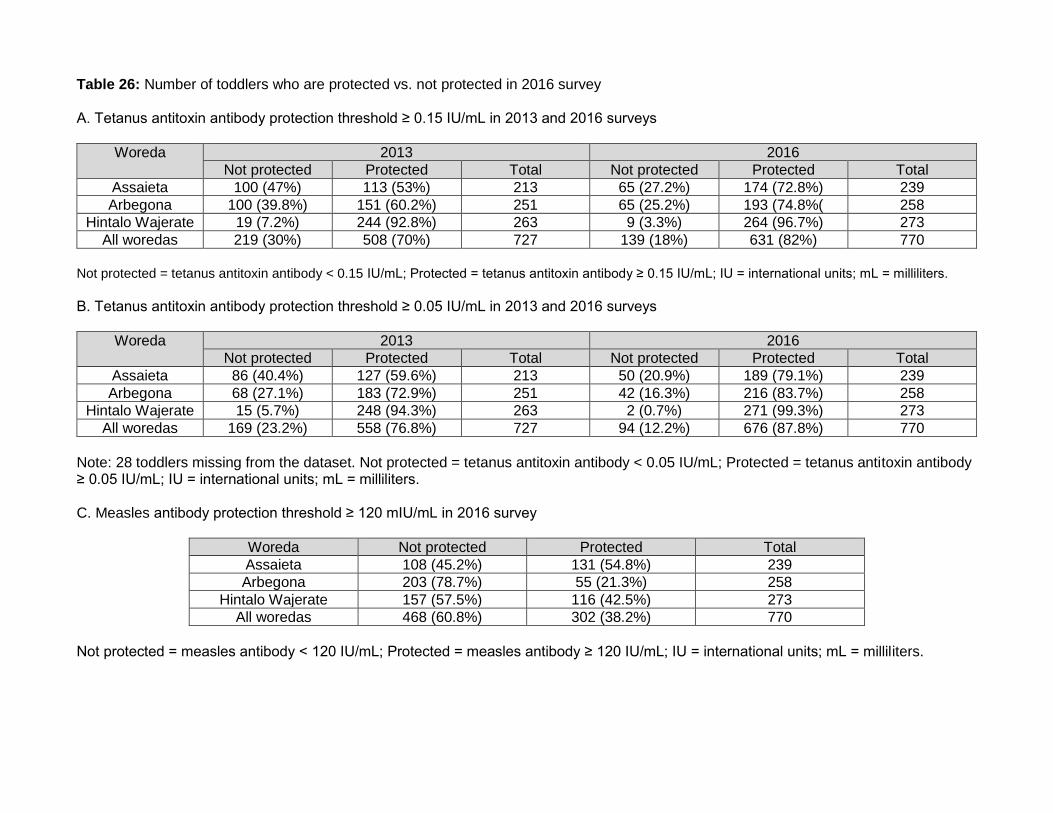
The proportion of toddlers with tetanus antitoxin titers ≥ 0.15 IU/mL increased in the interval between 2013 and 2016, in each woreda: from 53% to 73% (increase 20 percentage points) in Assaieta, from 60% to 75% in Arbegona (increase 15 percentage points), and from 93% to 97% in Hintalo Wajerate (increase of 4 percentage points) (Table 7, Figures 5A and 5B). Each of these
increases, when measured as differences of proportions, was statistically significant (p-value <0.05) (Table 10). Timely protection against tetanus, as evidenced by anti-tetanus antibodies, likely predicts protection against diphtheria, pertussis, Hib, and hepatitis B, the other diseases against which pentavalent vaccine is directed. Taken in aggregate, across all woredas, in 2013, 509 of 729 toddlers (70%) had tetanus antitoxin antibodies ≥ 0.15 IU/mL; in 2016, 631 of 770 toddlers (82%) had tetanus antitoxin antibodies. These data support the hypothesis that routine immunization services, directed towards infants at 6, 10, and 14 weeks of age, improved from 2013 to 2016 following targeted interventions by the Ministry of Health, with support from JSI. It is important to note that when compared to serologic protection (defined as tetanus antitoxin antibody ≥ 0.15 IU/mL), all of the coverage survey estimates (traditional, JSI survey, and documented) were significantly different in those enrolled in the coverage survey only (Table 7A). The p-value was calculated using a chi-squared comparison for each survey estimate compared to the serologic protection as determined by antibody titers. There was similarly a statistically significant difference (p-value <0.05) between all survey estimates (traditional, JSI survey, documented) when compared to serologic protection for only toddlers enrolled in the serosurvey in whom serum antibodies were tested (Table 7B). The p-value was calculated using a McNemar’s test comparing the coverage survey types (administrative, traditional, JSI survey, and documented) to true serologic protection. This was true for 2013 and 2016 estimates. The only exception was that the JSI survey 2013 estimate for Hintalo Wajerate was not statistically different from the serologic protection estimate.
These results suggest that coverage estimates are not correlating with or predicting accurately actual serologic protection. For tetanus, the coverage survey may actually underestimate protection, as seen in Assaieta, where the coverage survey estimates 28-43% coverage in 2016, compared to actual 73% serologic protection (Table 7B). This phenomenon is also seen in Arbegona, where coverage survey estimates are 16-57% in both 2013 and 2016 when compared to actual 60/75% serologic protection in 2013 and 2016, respectively (Table 7B). Hintalo Wajerate had high coverage survey estimates of 63-88% with an extremely high actual serologic protection of 93/97% in 2013 and 2016, respectively.
The coverage survey analysis identifies a pattern showing that Hintalo Wajerate woreda of Tigray Region achieved the best coverage and had the most smoothly operating and efficient immunization services. In Arbegona, inconsistencies were noted, and vaccination cards were either not given by health workers or were not retained by caregivers. In Assaieta, where a proportion of the population is nomadic, a similar lack of records was also observed, but the addition of the EPI register as a source of evidence of vaccination did not greatly increase the proportion covered. In 2016 and 2013, when data from the EPI registry were included – not just vaccination cards – there was a large increase in documented coverage in 2 of the 3 woredas (Arbegona and Hintalo Wajarete). f. Seroprotection tetanus antitoxin antibody ≥ 0.05 IU/mL
A threshold of protection at ≥ 0.05 IU/mL is acceptable when the laboratory performing the assay has shown it reliably predicts neutralizing antibodies at that level. Our Applied Immunology Laboratory has shown that. The actual level known to correlate with protection is lower than 0.15 IU/mL, but in the past, concentrations below that range were not as reliable. We re-analyzed the data using the lower threshold ≥ 0.05 IU/mL. Table 8 summarizes the estimates of serologic protection and comparison to the coverage survey estimates. Table 8 includes only serosurvey participants in whom serum antibodies were measured; it does not include all participants in the coverage survey. Using a tetanus antitoxin antibody ≥ 0.05 IU/mL, the serologic protection estimates were statistically significantly different from all of the coverage survey estimates (traditional, JSI survey, and documented), excluding the administrative data (Table 8). The p-value was calculated using the
McNemar’s test. Figure 5C graphs the comparison of the various estimates by woreda and survey type for a tetanus antitoxin antibody ≥ 0.05 IU/mL.
g. Comparison of seroprotection tetanus antitoxin titers ≥ 0.05 IU/mL vs. ≥ 0.15 IU/mL Table 9A summarizes the effect of reducing the presumed protective threshold of tetanus antitoxin antibody from the originally reported level of ≥ 0.15 IU/mL to lower levels of ≥ 0.10 IU/mL and ≥ 0.05 IU/mL. Using the original threshold of tetanus antitoxin antibody ≥ 0.15 IU/mL, 67% of toddlers were in the seroprotective range in 2013 (the individual woreda values ranged from 53% to 93%). In 2016, using the same threshold of tetanus antitoxin antibody ≥ 0.15 IU/mL the overall percentage of toddlers in the protected range rose to 83% (the individual woreda values ranged from 73% to 97%). Overall, there was a 16% point improvement in seroprotection over the three-year period. The individual woreda improvements ranged from 4% to 25%.
The percentage of toddlers deemed seroprotected using the threshold of tetanus antitoxin antibody ≥ 0.05 IU/mL is logically greater than the percentage deemed seroprotected at higher antibody levels. For all the woredas combined, the percentage of toddlers in the seroprotected range improved by 6% points in both 2013 (67% vs 73%) and 2016 (83% vs 89%) when using this measure. If we consider only the threshold of tetanus antitoxin antibody ≥ 0.05 IU/mL, the improvements from 2013 to 2016 were impressive in each woreda and overall. In Arbegona, the improvement was from 73% to 84% (11% point increase). In Assaieta, the improvement was from 60% to 79% (19% increase); and in Hintalo Wajerate, where the proportion protected in 2013 was already high (94%), the improvement was from 94% to 99% (5% increase). The aggregate proportion of toddlers protected in 2016 was 89% and the proportion of toddlers in each of the three woredas was 79% or greater. In Hintalo Wajerate, in 2016, nearly all toddlers (99%) had protective levels. These improvements likely reflect improvements in the proportions of infants receiving pentavalent vaccine as part of routine immunization services.
Evaluating a threshold of tetanus antitoxin antibody ≥ 0.10 IU/mL, one observes that the
values are in between the thresholds of ≥ 0.05 IU/mL and ≥ 0.15 IU/mL (Table 9A). Figure 6 compares the percentages of toddlers at various thresholds with serologic protection for each woreda and all woredas. Table 9B compares the estimates using tetanus antitoxin antibody ≥ 0.05 IU/mL vs. ≥ 0.15 IU/mL for each year. When comparing tetanus antitoxin antibody ≥ 0.05 IU/mL vs. ≥ 0.15 IU/mL for 2013, and 2016 in Assaieta there was no statistical difference between the estimates at different thresholds. P-values were calculated using McNemar’s test. For Arbegona, the estimates comparing tetanus antitoxin antibody ≥ 0.05 IU/mL vs. ≥ 0.15 IU/mL in 2013 and 2016 were statistically different, with more toddlers estimated to have seroprotection at the lower threshold of tetanus antitoxin antibody ≥ 0.05 IU/mL. In Hintalo Wajerate, only the 2016 comparisons were statistically different. However, of note, in Hintalo Wajerate there were again already high rates of seroprotection. Comparing the two thresholds (tetanus antitoxin antibody ≥ 0.05 IU/mL vs. ≥ 0.15 IU/mL) does not lead to great differences in estimates of seroprotection, but the lower cutoff value likely represents true seroprotection. h. Tetanus coverage vs. protection
Another analysis of particular interest allows us to examine the subjects in each woreda who had sera tested for tetanus antitoxin antibody, and determine the proportion who were recorded as having received 3 doses of pentavalent vaccine based on each of the coverage survey methods (traditional, JSI, and documented) Supplemental Tables 1 and 2 provide, by woreda, the frequencies of children who fall into each of four mutually exclusive categories:
1) Children with evidence of vaccination and serologic protection 2) Children without evidence of vaccination but who have serologic protection 3) Children with evidence of vaccination but not serologically protected 4) Children without evidence of vaccination who also are not serologically protected
Supplemental Table 1 provides the data for a threshold of tetanus antitoxin antibody ≥ 0.15
IU/mL. Supplemental Figure 1 shows the correlation for each woreda using linear regression models for a threshold of tetanus antitoxin antibody ≥ 0.15 IU/mL. Supplemental Table 2 provides the data for a threshold of tetanus antitoxin antibody ≥ 0.05 IU/mL. Supplemental Figure 2 shows the correlation for each woreda using linear regression models for a threshold of tetanus antitoxin antibody ≥ 0.05 IU/mL.
One would expect that most unvaccinated children would lack evidence of seroprotection and that most vaccinated children would be found seroprotected. The tables show that in many cases, there is discordance between evidence of vaccination and evidence of protection. i. Comparison 2013 vs. 2016 tetanus coverage and serosurvey results
Table 10 provides a comparison of the 2013 and the 2016 results. Table 10A shows estimates for all toddlers enrolled in the coverage survey. Table 10B shows estimates only for toddlers enrolled in the serosurvey in whom serum antibodies were measured. Comparing the 2013 results to the 2016 results, using a McNemar’s test, all estimates were statistically significantly (p-value <0.05) for coverage survey participants, except the JSI coverage estimates in Hintalo Wajerate. There were increases in all estimates in 2016 compared to 2013, except for the traditional survey in Hintalo Wajerate and overall documented vaccinations.
Overall in all woredas, for children in the serosurvey with antibodies tests from 2013/2016, the
traditional survey estimate increased by 4.5% (from 44.3% to 48.8%); JSI survey estimate increased by 8.6% (from 55.8% to 64.4%); and documented decreased by 8.1% (from 50% to 41.9%). Serologic protection increased for both thresholds (≥ 0.15 IU/mL and ≥ 0.05 IU/mL) by 12% and 11%, respectively. Comparing 2013 to 2016 estimates in all woredas, all coverage surveys except the traditional survey, and both thresholds for serologic protection, were statistically significant (p-value <0.05). In each woreda, at least one of the survey types was not statistically different in 2013 vs. 2016.
By all methods of coverage estimation in 2013 and in 2016, there was a clear gradient
observed, with Hintalo Wajerate showing markedly better coverage than the other two woredas. The other evident pattern is that the level of coverage estimated in each woreda typically increases as one goes from documented coverage to traditional coverage survey to JSI survey to objective serological evidence of having a protective level of tetanus antitoxin antibody. These themes held true in both 2013 and 2016. ii. Prevalence of protective tetanus antitoxin antibodies in relation to the number of doses of pentavalent vaccine administered to a toddler
In this section, we compare level of antibody concentration to reported numbers of vaccines received. A conventional means of reporting central tendencies (averages) of antibody data is to use the geometric mean titer (GMT) or geometric mean concentration, rather than arithmetic means. Arithmetic means are simply the sum of each individual concentration divided by the number of samples tested. Geometric means are the product of each individual concentration taken to the nth root, with n being the number of samples tested. This number is equivalent to taking the sum of the log of the concentrations, dividing by the number of samples, and then calculating the antilog.
Table 11 shows the GMT and proportion of toddlers with protective levels of tetanus antitoxin antibody, in relation to whether they received, as recorded in the coverage survey, one, two, or three doses of pentavalent vaccine, by woreda. With one exception in 2013 (Arbegona, where recipients of two doses had a slightly higher prevalence of protective titers and GMT than recipients of three doses), there was a clear dose-response effect; both the prevalence of tetanus antitoxin antibody ≥ 0.15 IU/mL (protection) and GMT increased with increasing number of doses of pentavalent vaccine received.
In toddlers in 2013, the prevalence of protective titers of tetanus antitoxin following
documented receipt of three doses of pentavalent vaccine was 91% in Assaieta, 96% in Hintalo Wajerate, and 80% in Arbegona. The prevalence of protective titers was also reasonably high in all three woredas after purported receipt of three doses (88%, 94% and 67%) in this toddler age group.
In 2016, the results were similar. However, in Hintalo Wajarate, where the tetanus antitoxin
antibody levels were quite high (with GMTs for 1, 2, or 3 doses all exceeding 2.43 IU/mL), there was no dose-response effect. However, nearly all children (264/273, 97%) were protected. In the other woredas, which both had more modest GMTs, and fewer toddlers in the protected range, there was more evidence of a dose response effect. Two or more doses as recorded by card or EPI register led to protective levels in 569 of 638 toddlers overall (89%). Figure 7 graphically depicts the percentage of toddlers with tetanus antitoxin antibody ≥ 0.15 IU/mL, depending on the number of doses of pentavalent vaccine they have received. iii. Measurement of tetanus antitoxin antibodies in DBS samples
Below are the results of the 2013 survey.
Both tetanus antitoxin antibodies and measles antibodies in DBS correlate with antibody levels in serum in healthy US volunteers (Figure 8). Using infants and toddlers from the 2013 survey in Ethiopia we see a similar correlation between DBS and serum tetanus antitoxin antibody levels (Figure 9). This suggests that environmental and handling issues may not play as much of a role as previously thought in the handling of samples in the US vs. more humid, hot climates.
Table 12 summarizes the data from the infants and toddlers in the 2013 survey. This work was done by Dr. William Blackwelder, Chief of the CVD Statistics Unit at the time. Tetanus antitoxin antibodies were measured in serum and in DBS, both as continuous and categorical variables. The categorical variable was defined as 1 if the IgG concentration reached the putative protective level and 0 otherwise. For analyses of continuous variables, values of serum IgG given as <0.0007 were changed to 0.00035 (n=3), and values of DBS IgG < 0.015 were changed to 0.0075 (n=10). Comparisons based on IgG as a continuous variable used log10-transformed values. Statistical analyses were done using NCSS 8 (Number Cruncher Statistical Systems, Kaysville, Utah). Comparisons were considered statistically significant for two-sided p-values <= 0.05 IgG concentrations as continuous variables
From both Table 12 and Figure 10, we see that the tetanus antitoxin IgG concentrations
tended to be higher in the serum assay than in DBS, and for both assays the concentrations tended to be higher in infants than in toddlers. By the Wilcoxon rank-sum test, the median serum IgG concentration was significantly higher than the median DBS concentration for both infants (p <0.0001) and toddlers (p=0.008). The geometric mean IgG concentration was significantly higher for infants than for toddlers for both serum and DBS IgG (p <0.0001 for both assays).
Figure 10 shows box plots of log10(serum IgG) and log10(DBS IgG) for each woreda, by age group. They show that serum IgG concentrations tend to be higher than DBS concentrations for both
age groups, and also that both serum and DBS IgG concentrations were higher on the average in Tigray than in the other woredas for both age groups.
In Kruskal-Wallis rank tests, within each age group there were significant differences among
woredas in both log10 (serum IgG) and log10(DBS IgG). By Dunn multiple-comparison tests, both serum and DBS IgG concentrations were significantly higher in Hintalo Wajerate than in Assaieta and Arbegona infants; in toddlers, serum and DBS IgG concentrations were significantly higher in Hintalo Wajerate than in Arbegona, and higher, but not significantly so, in Hintalo Wajerate than in Assaieta. There were no significant differences between concentrations in Afar and Arbegona.
To summarize, IgG concentrations tended to be higher in serum than in DBS, higher in infants
than toddlers, and higher in Hintalo Wajerate than in Assaieta and Arbegona. The protective level was assumed to be 1.0 IU/mL in 6-8 month olds and 0.15 IU/mL for 12-23
month olds. Table 13 shows the agreement in reaching the protective level for serum tetanus antitoxin antibody and DBS tetanus antitoxin antibody, as well as sensitivity, specificity, PPV, NPV and accuracy by age group and woreda. Figure 11 shows the graphic depiction of this data for toddlers nd infants.
In toddlers, specificity was high (96.8%) but not perfect; there was one false positive DBS IgG
concentration in Arbegona and one in Hintalo Wajerate. In all woredas combined, sensitivity was 90.6%; sensitivities in individual woredas (93.9% in Afar, 84.1% in Arbegona, and 93.4% in Hintalo Wajerate) were not significantly different (p=0.20, chi-square test). The lack of agreement was significant by the McNemar test (p=0.007).
We see that in infants, specificity was 100% in all woredas; i.e., taking serum IgG as the standard, there were no false positive concentrations of DBS IgG. However, there were false negative values of DBS IgG in all woredas, but mainly in Afar and Arbegona; there was only one false negative DBS IgG concentration in Hintalo Wajerate. The lack of agreement in this age group, reflecting the lower proportions meeting the protective level with DBS IgG than with serum IgG, was significant by the McNemar test (p < 0.001). In all three woredas combined, the sensitivity of DBS IgG was 86.1%; however, the sensitivities (61.5% in Afar, 75% in Arbegona, and 97.8% in Hintalo Wajerate) were significantly different among woredas by chi-square test (p<0.001).
In summary, the specificity of DBS IgG relative to serum IgG was high, though there were two false positive values of DBS IgG relative to serum IgG. However, the sensitivity of DBS was lower than the specificity in every woreda in both age groups; this was reflected in significant lack of agreement. The lack of sensitivity was especially noticeable in infants in Assaieta and Arbegona; sensitivity was also < 90% in toddlers in Arbegona. C. Hib vaccination i. Hib vaccination coverage and seroprotection in infants in 2013 survey
Examining data on pentavalent-3 coverage collected for infants age 6-8 months of age during the 2013 survey provides information about the timeliness of pentavalent vaccine administration in relation to the EPI schedule, in addition to providing estimates of coverage. These data are summarized in Table 14 and Figure 12, separated by all infants in the coverage survey including those without a serum sample and only infants enrolled in the serosurvey who also had serum antibodies measures. In either situation, the administrative coverage data give a very optimistic estimation of pentavalent-3 coverage (80-90%). In contrast, a very different picture is obtained from traditional coverage survey estimates for pentavalent-3 in this age group, as those estimates are quite low, ranging from a mere 10% in Arbegona, to 34% in Assaieta, to 57% in Hintalo Wajerate. The JSI
coverage survey, which includes data from examining records at health facilities, has little impact on altering the coverage estimates. Objective serological data estimates of vaccination with pentavalent vaccine, based on an anti-PRP IgG titer ≥ 1.0 mcg/mL, increase the coverage estimates slightly in Hintalo Wajerate (from 59% to 68%), somewhat more in Arbegona (from 27% to 41%), but drop the estimate very slightly in Assaieta (from 34% to 31%). There was a statistical difference between the administrative coverage estimates and actual serologic protection in all woredas. In Assaieta, however, the traditional coverage and JSI survey coverage estimates were not statistically different from the true serologic protection, suggesting that either vaccination cards or parental recall may be better in this woreda. In Arbegona, all there survey types (administrative, traditional and JSI survey) were statistically different from true serologic protection. In Hintalo Wajerate, only the JSI survey coverage estimates were not statistically different from serologic protection. Documented coverage estimates were not available in the 2013 survey.
Hib serologies were not performed in the 2016 analysis.
ii. Prevalence of protective anti-PRP antibodies in relation to the number of doses of pentavalent vaccine administered to an infant
In infants 6-8 months of age in the 2013 survey who had documentation of receipt of three doses of pentavalent vaccine, the prevalence of protective titers of anti-PRP antibody was high in Hintalo Wajerate (88%) but somewhat lower in Arbegona (58%) and Assaieta (53%) (Table 15, Figure 13). These data suggest that among infants with documentation of having received at least two doses of pentavalent vaccine, about half (>53%) have serologic protection against Hib infection. Of note, one child in Assaieta who had received two doses of pentavalent vaccine did not have protective anti-PRP antibodies. Given that the response to two doses of pentavalent vaccine was seen across all three woredas, this suggests that the serologic response occurs irrespective of nutritional state, possible genetic differences, and other host or vaccine delivery factors. The poor response of some infants to one to two doses of pentavalent vaccine may be due to timing of vaccination and collection of serum. Some infants may only have received their third dose of pentavalent vaccine shortly before the collection of serum and before antibody titers could boost to reach the protective cut-off. The presence of protective antibodies in infants who had received fewer than three vaccines is likely due to either prior infection or response to only a few doses of pentavalent vaccines. iii. Measurement of anti-PRP antibodies in DBS samples in infants in 2013 survey
DBS results for infants in the 2013 survey were performed to compare DBS vs. serum antibodies. DBS results for Hib in 2016 were not performed. In the 2013 results, the specificity and sensitivity values for the DBS Hib assay was very varied (Table 16, Figure 14). When compared to protective serum anti-PRP antibodies, the sensitivity was 35.7-88.9%, specificity was 36-100%, PPV was 44.8-100%, NPV was 55.9-84.2%, and accuracy was 50-75%. Overall for all three woredas, the sensitivity was 72.7%, specificity 62.8%, PPV 71.1%, NPV 50%, and accuracy 62%. Because the level of antibodies to these antigens is lower, further optimization is needed to improve the sensitivity and specificity of these assays. It remains unclear if dried blood spots could be used instead of serum samples to accurately measure anti-PRP antibodies, given the variability of the results. D. Measles vaccination i. Measles vaccination coverage and seroprotection in infants and toddlers in 2013 and 2016 surveys
We performed estimations of measles vaccination coverage among toddlers and infants. Of note: infants were not studied in the 2016 survey; thus there are only data for infants from the 2013 survey. An analysis was done for all participants in the immunization coverage survey (whether or not they also participated in the serosurvey) as well as for those children enrolled in the serosurvey who
had antibodies measured. The coverage estimates via administrative coverage, traditional survey coverage, JSI survey coverage and documented coverage were compared to objective serologic protection. Measles disease, including endemic transmission and outbreaks, are still reported periodically in various regions of Ethiopia. Table 17 summarized these results: Table 17A for all toddlers in coverage survey, Table 17B for toddlers with serologic antibodies measured, Table 17C for all infants in the coverage survey, and Table 17D for infants with serologic antibodies measured. Figure 15 depicts these same data visually separated by woreda and type of survey. a. Administrative coverage
Administrative estimates of measles vaccination coverage (2012) data among toddlers were
high in Arbegona (91%) and Hintalo Wajerate (85%) but very low in Assaieta (36%). Afar is one of the regions of Ethiopia where sporadic measles cases and outbreaks have been reported in recent years. For 2013, the corresponding administrative coverage was 140% for Assaieta, 78% for Arbegona, and 86% for Hintalo Wajerate. Administrative coverage rates exceeding 100% can occur from inaccurate recording of the numerator (number of vaccines administered) or denominator (targeted number of children to be vaccinated), or from inappropriate inclusion of mass campaign data into the numerator. Note the 2012 EPI registry data was used for the 2013 survey.
For infants, who were only studied in the 2013 survey, the administrative coverage estimates
were not available. b. Traditional survey coverage
The estimates of measles vaccine coverage, in 2013, obtained by traditional coverage survey for
toddlers in the coverage survey show a close similarity to the administrative coverage estimate in Assaieta (40% vs. 36%) and Hintalo Wajerate (78% vs. 85%), but a striking discrepancy in Arbegona (43% vs. 91%). In 2016, the corresponding proportions are as follows: Assaieta (69% versus 140%), Arbegona (59% versus 78%), and Hintalo Wajerate (60% vs 86%).
For only toddlers with serologic antibodies measured, the estimates are similar for both 2013 and
2016. For 2013, when compared to all toddlers in the coverage survey, the estimates were 42% vs. 40% in Assaieta, 41% vs. 43% in Arbegona, and the same in Hintalo Wajerate (78%). For 2016, when compared to all toddlers in the coverage survey, the estimates were 67% vs. 69% in Assaieta and the same in Arbegona (53%) and Hintalo Wajerate (60%).
For infants the traditional survey estimates were very low; 0-2% in each woreda in both all infants
in the coverage survey and only infants with serologic antibodies measured. c. JSI survey coverage
With respect to estimating measles vaccine coverage in the toddlers, in 2013, the JSI survey coverage showed identical estimates as the traditional coverage survey in Assaieta (40%) and Hintalo Wajerate (78%), and very similar coverage in Arbegona (49% versus 43%) in all toddlers in the coverage survey. In 2016, the use of the modified approach raised the estimate in Assaieta from 69% to 71%, in Arbegona from 59% to 73%, and in Hintalo Wajerate from 70% to 92% for all toddlers in the coverage survey.
For only toddlers with serologic antibodies measured, the estimates are similar for both 2013 and
2016. For 2013 for only toddlers with serologic antibodies measured when compared to all toddlers in the coverage survey the estimates were similar in Arbegona (42% vs. 49%) and Hintalo Wajerate (73% vs. 78%). There was a big difference in Assaieta between the coverage estimates in all toddlers in the coverage survey (40%) vs. toddlers in serosurvey with measured antibodies (21%). For 2016,
when toddlers with serum antibodies measured were compared to all toddlers in the coverage survey, the estimates were similar; 69% vs. 67.7% in Assaieta, 66% vs. 66% in Arbegona, and 79% vs. 78% in Hintalo Wajerate.
For all infants in the coverage survey, the JSI method of estimated coverage provided expected
low percentages, 0-3%, in the woredas. However, for infants only, in the serosurvey with antibodies measured, the estimates were slightly higher; 5% in Assaieta, 32% in Arbegona and 14% in Hintalo Wajerate. It is unclear why there is such a discrepancy between all infants in the coverage survey and those infants who had serologic testing done.
d. Documented coverage Documented coverage was done for all toddlers in the coverage survey only in 2016, and ranged from 22-53%. These reports were significantly lower (by about 50%) than the prior estimates via administrative coverage, traditional survey, and JSI survey. For 2013, the documented coverage was low (16% in Assaieta and 24% in Arbegona), but closer to traditional and JSI survey coverage estimates in Hintalo Wajerate (67%). In 2016, the documented coverage was low, and about 50% lower in Assaieta (29% vs. 67-69%) and Arbegona (22% vs. 53-66%) when compared to traditional and JSI survey coverage estimates. In Hintalo Wajerate the documented coverage was closer to traditional and JSI survey coverage estimates (55% vs. 60-79%, respectively). For infants there was no documented coverage reported. e. Seroprotection Of note: all measles antibody measurements were done via ELISA for the initial analysis. Below we will discuss the use of PRN and ELISA for measuring measles antibody. Reports of PRN antibodies were provided in two phases. In the first phase, a sample of serum specimens across the spectrum of ELISA antibody titers was analyzed for the purpose of comparing ELISA and PRN. In the second phase, a random sample of specimens was chosen from each woreda for each year (was chosen to estimate the level of protection among toddlers.
In 2013, measurement of measles antibody provided corroborating data in Assaieta, showing a low prevalence (35%) among toddlers with a protective titer ≥ 120 mIU/mL; this estimate, based on objective serological data, is very similar to the 36% administrative estimate and the 40% coverage estimates from traditional and JSI coverage surveys. The percent of toddlers in Arbegona with a protective titer of measles antibody, 21%, was less than half the estimates based on traditional (43%) and JSI-type coverage surveys (49%). This is one of many examples suggesting that either record keeping in Arbegona was faulty or perhaps handling of measles vaccine may have been sub-optimal. The prevalence of toddlers with a measles antibody ≥ 120 IU/mL in Hintalo Wajerate was 65%. This is somewhat lower than the estimates by coverage survey (78%) and may reflect the difficulties of handling measles vaccine in the field (which requires an impeccable cold chain) and the fact that a low percentage of infants who receive measles vaccine for the first time simply do not respond serologically.
In 2016, the proportions of toddlers with a protective measles antibody ≥120 mIU/mL in each woreda was as follows: Assaieta 55%, Arbegona 21%, Hintalo Wajerate 42%. In Hintalo Wajerate, the proportion covered, using ELISA IgG estimates fell by 23 percentage points from the proportion estimated in 2013. In Arbegona, the protected proportion of 21% remained unchanged from 2013 to 2016. And in Assaieta, the proportion with protective levels of antibodies increased by 20 percentage points from 2013 to 2016. In aggregate, in 2013, 301 of 729 toddlers (41%) had protective measles titers and in 2016, 302 of 770 (39%) had protective titers. That is, using ELISA IgG antibody tests, fewer than half of toddlers are fully protected against measles. Notably, the Afar region had a sub-
national supplemental measles vaccination campaign about six months prior to the 2016 survey, which may account for some of the gains in coverage and protective levels.
For both the 2013 and 2016 estimates, when compared to serologic protection, all of the coverage estimates were statistically different (p-value 0.05) calculated via chi-squared comparison test for all toddlers in the coverage survey. The majority of the estimates, when compared to serologic protection for only toddlers in whom antibody levels were measured, were statistically significant (p <0.05) via McNemar’s test. The notable exception was that the low reported documented coverage estimates were not statistically different from the serologic protection, except in Assaieta in 2013.
In Ethiopia, the target age for administering measles vaccine through the routine program is 9
months of age. All estimates of measles vaccination coverage for infants 6-8 months of age in all three woredas, when performed as part of the 2013 survey, were consistent, whether calculated by administrative method or by traditional or JSI-type coverage survey methods, and ranged from 0-3%. Similarly, the prevalence of infants with protective titers of measles antibody was very low, ranging from 4-10%. The occasional infants with antibody may reflect persisting maternal antibodies, earlier than optimal receipt of measles vaccine, the consequence of exposure to wild-type measles virus, or a limit in the specificity of the antibody assay. Under any circumstances, the measles antibody prevalence in infants was low in all woredas, and lowest in Hintalo Wajerate, which appears to have the best immunization services. Seeing these low measles coverage rates, both estimated by survey methods and objectively by presence of antibody, one can readily appreciate why measles virus is still circulating in these populations and continued transmission is occurring, according to notifications (3,322 confirmed cases nationwide in 2013).
For infants, when comparing coverage estimates (traditional survey and JSI survey) vs.
serologic protection, a majority of the estimates were not statistically different (p <0.05) using McNemar’s test. However, given the low estimates to begin with, this is not surprising. f. Measles coverage vs. protection
Supplemental Table 3 provides the frequencies of toddlers with coverage and protection by woreda. Supplemental Figure 3 provides the agreement with linear regression between coverage and protection. This is the individual data for each woredas based on serologic protection, as discussed above, and the estimated coverage based on coverage type (traditional survey, JSI survey, and documented).
g. Comparison 2013 vs. 2016 measles coverage and serosurvey results
Table 18 provides a comparison for each coverage survey type and serosurvey for 2013 estimates vs. 2016 estimates for toddlers. All comparisons were done via McNemar’s test, and a p-value of <0.05 was considered significant. For all toddlers in the coverage survey, there was a statistically significant increase from 2013 in 2016 in Assaieta. In Hintalo Wajerate there was a statistically significant decrease in the estimates from 2013 to 2016, except in the JSI survey estimate. In Assaieta, the estimates were not statistically different except for the JSI survey estimate, which increased from 50% to 66%. For toddlers in the serosurvey, the estimate trends were similar. In Assaieta, all of the estimates increased significantly, except for documented coverage, which was low to begin with. In Arbegona the estimates were statistically significantly similar, except for the JSI survey coverage estimates, which increased (42% to 65%). In Hintalo Wajerate, all of the estimates decreased, but only half were statistically different (traditional survey coverage and serosurvey). Overall, there was no significant change in the estimates from 2013 to 2016 in the three woredas.
ii. Prevalence of protective measles antibodies in relation to the number of doses of measles vaccine administered to a toddler or infant Table 19 summarizes the percentage of toddlers and infants who were documented as receiving at least one dose of measles vaccine and what percentage have serologic protection to measles (measles antibody ≥ 120 mIU/mL). Figure 16 graphically depicts these data for toddlers and infants.
In 2013, the prevalence of protective titers among toddlers with documentation of having received a dose of measles vaccine varied fairly widely; 69% in Assaieta, 44% in Arbegona, and 75% in Hintalo Wajerate. In 2016, in Hintalo Wajerate, only 42% of toddlers who had evidence of one or more measles vaccinations had protective antibodies, whereas nearly the same proportion, 42%, of those without evidence of any measles vaccination had protective levels. The GMTs of the vaccinated and unvaccinated were not greatly different: 107.87 mIU/mL vs. 98.86 mIU/mL. In Arbegona, in 2016, the GMT of toddlers with card or register evidence of measles vaccination was only 16.09 mIU/mL, leaving 77% of vaccinated and 82% of unvaccinated toddlers susceptible. In Assaieta, which had a recent measles vaccine campaign, toddlers with evidence of vaccination had the highest GMT (121.5 mIU/mL) when compared to toddlers living in other woredas, and they had the greatest proportion among woredas (62% of toddlers) with evidence of protective titers. Though nutritional issues, genetic variability, and timing of vaccination may account for some of these divergent responses, cold chain quality and record keeping are major explanations.
The 2013 data further corroborate the rarity of infants 6-8 months of age having received a
dose of measles vaccine, and the widespread serosusceptibility of Ethiopian children of this age as they approach the age (9 months), when a first dose of measles vaccine is indicated. This is seen in the low rates shown in Table 19B. iii. Measurement of measles antibodies in DBS samples in toddlers a. 2013 survey
For the 2013 survey, the specificity, sensitivity, PPV, NPV, and accuracy of DBS to detect serologic protection was compared to the standard serum measurement via ELISA (Table 20). Figure 17 graphically depicts these data. Note this analysis was done only in toddlers.
For seroprotection of measles antibody ≥ 120 mIU/mL, Table 20A shows that overall,
sensitivity was 100%; specificity 88.1% (84-91%); PPV was 85.8% (75-94.5%); NPV was 100%; and accuracy was 93% (90-95%) for DBS. This suggests that the DBS correlates very well with serum measles antibody measured via ELISA.
The protective level for measles-specific antibodies is considered to be measles antibody ≥
120 mIU/mL. In some studies however, and depending on the WHO standard used for data calculation, it is considered ≥ 200 mIU/mL. Table 20B shows that, at this higher threshold, overall, sensitivity and NPV are still 100%, with slightly lower specificity at 73.7% (52.9-83.3%), PPV at 61.9% (45-70.3%), and accuracy at 81.6% (77.8-85.3%). This suggests that perhaps the lower threshold of ≥ 120 mIU/mL is more accurate.
b. 2016 survey In the 2016 survey, the comparison of measles antibodies measured via serum ELISA (standard) vs DBS eluate ELISA was done only in toddlers, and only for a seroprotective threshold of ≥ 120 mIU/mL. Table 21A shows that overall, sensitivity was 81% overall (61-90%), specificity was 47% (41-53%), PPV was 50% (21-66%), NPV was 79% (69-87%), and accuracy was 60% (67-87%).
Comparing the percentage of children with serologic protection (measles antibody ≥ 120 mIU/mL) using serum ELISA vs DBS eluate ELISA, all of the estimates were statistically significant (p-value <0.05 for McNemar’s test) (Table 21B). Thus, for the 2016 results, DBS does not seem to correlate with serum measles antibody protection. iv. Measurement of serum measles antibodies via PRN vs. ELISA The gold standard for the measles antibody is by plaque reduction neutralizing (PRN) assays. As discussed in the introduction, previous studies done by the CVD showed that ELISA measles antibody concentrations ≥ 120 mIU/mL have correlated closely with titers ≥ 120 mIU/mL measured using the gold-standard measles PRN assays. Here we compare PRN antibody concentrations (standard) to ELSIA antibody concentrations for measles. PRN assays were performed on 300 toddlers from the 2016 survey; 100 from each woreda, with 25 per ELISA quartile (0-25%, 25-50%, 50-75%, 75-100%).
The sensitivity, specificity, PPV, NPV, and accuracy are reported in Table 22A. The overall sensitivity was 55% (39-81%), specificity was 95% (92-100%), PPV 96% (95-100%), NPV 49% (13-72%) and accuracy 67% (49-85%). Table 22B shows the number of toddlers with seroprotection based on ELISA vs. PRN. All of the estimates were statistically different in each woreda and overall (p-value <0.05 via McNemar’s test). The comparison of serum measles antibody level between PRN and ELISA was analyzed using Pearson and Spearman technique. Tables 22C and 22D shows the Pearson and Spearman correlation coefficients for the correlation of measles antibody (in mIU/ml) and log10-transformed measles antibody (in mIU/ml) according to PRN vs. ELISA and their respective p-values. If the raw value was <1.00 mIU/mL, a value of 0.5 was used, as this is the minimum value recognized by the system used for analysis. Using the Spearman’s technique does not change when you log-10 transform the values, because this technique uses ranked values, which will not change whether the data points are raw or log-transformed. The Pearson’s technique uses linear values and not ranked values and thus appears different with log-transformation. The graph on the left is the overall data and the graph on the right is a close-up version of the graph on the left and excludes outliers. Figure 18A shows the scatter plots by woreda and overall of measles antibody PRN vs. ELISA. Figure 18B shows the log-10 transformed data in scatter plots again subdivided by woreda. Overall, the Pearson and Spearman correlations were statistically significant when comparing PRN vs. ELISA to measure measles antibody. v. Interpretations of measles antibody levels measured via ELISA and PRN by two different technicians in a subset of 39 toddlers from Hintalo Wajerate in the 2016 survey and PRNs performed on a random sample in each woreda in 2013 and 2016 Because of discrepancies between assays and the unexpectedly low seroprotection rates, we performed a preliminary analysis on a subset of 39 toddlers from Hintalo Wajerate who participated in the 2016 coverage survey, and had measles ELISA concentrations and measles PRN concentrations performed by two different technicians. We studied the differences between ELISA and PRN interpretations at various thresholds (≥ 40 mIU/mL, ≥ 80 mIU/mL and ≥ 120 mIU/mL). The raw data are available for review in Supplemental Table 4.
It is important to note that there were 292 toddlers in Hintalo Wajerate in the coverage survey, among whom 281 joined the serosurvey; and 273 had serum processed for antibody assays. Among the 273 toddlers with serum collected, samples from 100 toddlers were chosen to perform PRNs (by randomly selecting 25 toddlers from each quartile of ELISA levels). Technician 1 performed these
analyses. From among the 100, 39 toddlers were chosen to have samples retested by PRN performed by technician 2. These 39 toddlers were enriched for samples in the mid-range for PRN (60 to 240) to review the assay reproducibility comparing technician 1 and technician 2. Therefore, the seroprotection rates calculated above may not be representative of the whole sample of toddlers from Hintalo Wajerate.
Table 23A summarizes the proportion of toddlers with measles antibodies at various thresholds for ELISA and PRN for two different technicians. If the threshold for protection is ≥ 40 mIU/mL, then both technicians found 97% protected by PRN. For ELISA for technician 1, there is a similar estimate of 87% vs. 97%. We do not have ELISA reports for technician 2. As one increases that cutoff value to ≥ 80 mIU/mL and ≥ 120 mIU/mL, the proportions predicted by ELISA fall off more quickly than the proportions predicted by PRN for technician 1. Also, the discrepancy gap between technicians 1 and 2 performing the PRN widens as the cutoff for protection increases from ≥ 40 mIU/mL to 120 mIU/mL. As one moves to a cutoff of ≥ 120 mIU/mL (which might be considered more definitive evidence of protection), the proportion predicted to be protected by ELISA is only 38%, and the proportion predicted by PRN is 87% when done by technician 1 and 64% when done by technician 2.
Table 23B shows the sensitivity, specificity, PPV and NPV for each technician for various PRN thresholds. Each calculation in the table is based on the ability of ELISA to predict PRN. Sensitivity, specificity, PPV and NPV were all defined as the proportions of samples that surpassed the denoted threshold by the gold-standard PRN (40, 80, or 120 mIU/mL) and the same threshold via ELISA. Overall, these data show that ELISA has high specificity and PPV across the range of threshold values. That is, when PRN is in the unprotected range, ELISA nearly always agrees (high specificity, 79 to 100%); and when ELISA is in the unprotected range, PRN nearly always agrees (high PPV, 80 to 100%). However, ELISA has poorer sensitivity and NPV. That is, when PRN is in the protective range, ELISA does not frequently agree, especially as the cutoff level goes higher (low sensitivity, 44 to 89%) and when ELISA is below the protective range, the PRN often does not agree (low NPV, 6% to 50%).
For midrange antibody levels assayed by PRN, there was enough variability by technician to lead to significant differences in the proportions of toddlers presumed seroprotected when using PRN > 120 mIU/mL as the threshold. In 23 samples of the 39 tested, both technicians read PRN ≥ 120 (concordant seroprotected). In three samples of the 39 tested, both technicians read PRN < 40 (or <8 0, both proportions are the same) (concordant serosusceptible). Table 23C shows the 13 samples in which one technician determined the PRN antibody to be above the threshold (120 mIU/mL) and the other technician determined the PRN antibody to be below that threshold (discordant samples). The range of PRN antibody among these discordant samples for technician 1 was 123 to 503. The range of PRN antibody among these discordant samples, for technician 2, was 62-158 mIU/mL. These data show that discrepancies between technicians in determining the proportion of toddlers with seroprotection against measles, when using a threshold of ≥ 120 mIU/mL as the correlate of protection, tend to cluster among toddlers whose PRN values are close to 120 mIU/mL (not greatly above or below that value).
To estimate protection in toddlers via PRN, we selected a random sample of specimens from
2013 and 2016 in each woreda. Repeat PRN assays showed higher percent of toddlers with neutralizing antibodies above the putative protective level of PRN>120 mIU/mL than had been reported using ELISA (above). Using ELISA, it was reported that the percent at or above 120 mIU/mL was, comparing 2013 to 2016, as follows: Arbegona, 21% to 21% (no change); Afar, 35% to 55% (improved); Tigray, 65% to 42% (fell). For the samples assayed by PRN in 2019 (last 2 columns in Table 23D), the improved outcomes are as follows: Arbegona 26% to 36% (improved); Afar 31% to 50% (improved); Tigray 63% to 76% (improved).
In summary, all three woredas had improvements in the point estimates of putative protection against measles using a cutoff value of 120 mIU/mL by PRN. Still, the woreda with the lowest percent of toddlers with antibody evidence of protection was at 36%, and the highest-scoring woreda was at 76%, much lower than needed to prevent ongoing measles transmission. vi. Correlation of timing of measles vaccination and serum sample collection a. Age in days when received measles vaccination
Given that there were such low rates of measles vaccination and serologic protection among toddlers, we analyzed the days from when a measles vaccine was received and the number of days between vaccination and serum sample collection to determine if this could possibly explain the low rates. Table 24A shows the age in number of days at which the toddler received the measles vaccine. This data contains only toddlers who had both vaccination cards and EPI registry data. Toddlers were classified as “valid card” if the vaccination card documented received measles vaccine and it was given at appropriate time (e.g., on day of life 267 or later and before the survey took place). “Invalid card” was defined as the vaccination card documenting the toddler received measles vaccine, but (before day of life 267). “Valid record” meant that the EPI registry documented that the toddler received the measles vaccine and it was given at appropriate time (on day of life 267 or later and before the survey took place). “Invalid record” meant that the EPI registry documented that the toddler received the measles vaccine but at an inappropriate time. Notably, some toddlers were omitted from this dataset, since there were erroneous data.
Figure 19A shows box plots of the data from Table 24A. About 50% of toddlers received their measles vaccination between 263 days (8.5 months) to 304 days (10 months). This period of time is much narrower than expected, and suggests that most toddlers are receiving the measles vaccination at the appropriate time, around 9 months. Table 24A shows that the mean age at which all toddlers received the measles vaccine was 289 days, with a range of 130-645 days and a median of 281 days. Of those toddlers with valid card, the mean was 298 days (range 267-455 days) and median 288 days. Of toddlers with a valid record the mean was 323 days (range 130-266 days) and the median 299 days. Figure 19A shows that the range was the largest for toddlers with a valid record, and the narrowest for those with an invalid card. b. Time from measles vaccination until serum sample collection Table 24B shows the number of days between receiving the measles vaccination and serum sample collection. Figure 19B shows box plots of the data from Table 24B. For 50% of toddlers, there were 260-300 days in between measles vaccination and serum sample collection. Most toddlers received their measles vaccine at 8.5 to 10 months, and had their serum sample collection at 17-18.5 months, which is in the range of the toddlers we were targeting (12-23 months). For all toddlers, the mean was with 228 days (range 3-480 days) with a median of 209 days. For toddlers with a valid card, the mean was 207 days (range 3-441 days) with a median of 193 days. For toddler with a valid record, the mean was 211 days (range 11-445 days) with a median of 197 days. c. Time to measles vaccination and correlation with seroprotection
Table 24C shows toddlers who had over 365 days (1 year) in between their measles vaccination and serum collection. The proportion of children with serologic protection is reported based on card and record validity. About half of the toddlers for each category have seroprotection for measles. Figure 20 shows scatter plots for woredas and by card and record status for time to measles vaccination and seroprotection. Figure 20Ai is all of the data and Figure 20Aii is zoomed in on the majority of the data and excludes the outliers. There appears to be no correlation between time to vaccination and seroprotection. These data suggest that even after a prolonged period of time (over
one year) in between measles vaccination and serum collection, there is no association with increased or decreased seroprotection. This means that is unlikely that the timing of measles vaccination, or time from measles vaccination to serum collection, was the reason for the low measles coverage rates in toddlers.
6. DISCUSSION A. Serosurvey enrollment success Several strategies contributed to this high level of participation, efficiency, and successful sample collection: i. Community buy-in
Enrollment exceeded 81% percent of coverage survey participants in each of the three woredas in 2013, including infants and toddlers, and 89% in each woreda in 2016, which included only toddlers. Community leaders’ sensitization of the local population to the project was integral to achieving community acceptance. and facilitated buy-in at each site. Local health workers, who were already known to the families of participants, described the study objectives in the local language. In consultation with the serosurvey team leaders, the local health workers responded to the questions and concerns of caregivers. Communities’ embrace of the serosurvey was also strengthened by the benefits available to participants, including detection and treatment of anemia, vitamin A supplementation, and evaluation of select medical conditions. Serosurvey team leaders provided medical evaluation of any children in the community with ailments, when requested by the child’s parents or caregiver.
ii. Integration of coverage and serosurveys
We successfully integrated serosurveys with vaccination coverage surveys in three remote regions of Ethiopia in 2013, and again in those same regions 2016. This work posed serious logistical challenges that were overcome by applying several broad strategies and implementing specific tactics. For example, the serosurvey team assigned clearly defined primary and back-up roles to each team member; needed equipment and supplies were anticipated and chosen with great care; steps were taken to continually maintain close coordination between the coverage survey and serosurvey teams; efforts were undertaken to ensure community buy-in at each field site, including by providing point-of-care measurement of hemoglobin levels to detect and treat anemia and to diagnose and treat other common pediatric ailments on request of the child’s parent or caregiver.
Whereas serosurveys have been successfully conducted in developing countries with pediatric
immunization schedules that follow EPI guidelines (5, 6), little information exists on how to overcome the substantial logistical challenges that such efforts entail. Importantly, the strategies for equipment and supply selection, team composition, and community buy-in described here have widespread application for the performance of serosurveys for any reason in isolated developing-country settings.
Tactics for future serosurveys include assigning a single survey code number, when possible,
for both the vaccination coverage survey and the serosurvey to facilitate harmonization of coverage survey and serosurvey databases. Additional actions to synchronize data collection forms and databases between the coverage survey and serosurvey prior to initiation will also expedite data analysis.
Efficient workflow for the serosurvey was highly dependent on the competence of the
phlebotomists. Thus, prior pediatric phlebotomy experience involving infants and toddlers was critical
to their success, and should be emphasized as the most important selection criterion when choosing a phlebotomist.
One potential limitation of these results is that the challenges encountered may be specific to
the study. Future serosurveys at other sites may encounter additional local challenges not anticipated in this study, such as freezing ambient temperatures, rather than the elevated temperatures we dealt with in Ethiopia. Freezing temperatures would pose distinct challenges to sample and cold chain maintenance not mentioned in this paper. A serosurvey may also face fewer challenges than were described here. For example, each of the Ethiopian field sites in this project had a different primary language, and consent forms and audio cassettes had to be translated to address these differences. If teams work in multiple sites where there is only one spoken language, audio cassette translations may be unnecessary, albeit still helpful in regions with low literacy.
The WHO immunization coverage cluster survey reference manual provides guidelines for
successful execution of a coverage survey. The serosurvey equipment and supplies, team composition, and close coordination with a coverage survey were critical to successfully performing a serosurvey in concert with a coverage survey. The strategies and tactics described here will be useful for future serosurvey planning and management. B. Serosurvey serum collection success
Prior to initiating the serosurveys, both public health officials at EPHI and Ethiopian pediatric colleagues estimated that because of local beliefs about collecting venous blood from children, it would be unlikely that the parents/caregivers of more than ~ 60% of children enrolled in the immunization program would grant permission for their child (or children) to participate in the serosurvey. In fact, as shown in Table 6, and for the reasons explained in the previous section of the report, fully 87% overall of the Ethiopian children who participated in the immunization coverage surveys in 2013, and 91% of those who participated in the immunization coverage surveys in 2016, were successfully enrolled into the serosurveys. Thus, the reality far exceeded predictions. Table 6 also attests to the skill of the phlebotomists in successfully obtaining venous blood specimens from the enrolled toddlers and infants; overall blood for separation of serum was collected from 96% (982/1023) of pediatric subjects in 2013, and from 97% (770/790) in 2016. C. Vaccination failures and discrepancies between coverage and protection There were numerous instances in which a child had been documented as receiving a vaccine but did not have serologic evidence of protection. There are many reasons for these “vaccination failures” and other discrepancies. These include errors in documentation, administration of vaccine that is not “potent,” or inadequate host response.
A vaccination card records an EPI contact and that a child was administered a vaccine (“vaccinated”). The vaccination card does not guarantee that the child was successfully immunized, that is, provided a vaccine that induced an immunologic response that primed or led to eventual serologic evidence of protection. Administration of vaccine to a child may also not get recorded or may not be recorded correctly on a vaccination card or in the health facility vaccine registry. This may be particularly true when supplemental immunization activities are performed, as they are high–volume, and separate from the local health care records.
It is also possible that a child was given the vaccine, but there may be a defective cold chain or other concerns with vaccine storage, transport, and administration. This would decrease the immunogenicity of the vaccine. There may also be a variation in the immunogenicity; and the efficacy of different vaccines can vary in diverse populations, depending on age, genetic make-up, and nutritional state. Even in industrialized countries, about 5% of children who receive their first measles
vaccination do not develop sufficient antibodies. It is possible that many of these children did not mount an adequate response. Alternatively, a child may respond immunologically but the titer achieved may remain below the protective cut-off that is considered the protective threshold, or may have waned by the time of the survey. Residual maternal antibodies can also interfere with this process and modulate a child’s immune response, such as with the measles vaccine. Also in the case of measles, antibodies in toddlers 12-23 months old may reflect previous immunization or previous infection with wild-type measles virus.
Administrative estimations of vaccination coverage are generated based on the number of doses of vaccine administered by such facilities to the target age group divided by the number of target age children in that woreda (often estimated, with adjustment, from the most recent population census). Administrative estimates are relatively simple and rapid to calculate, and are theoretically timely. However, if the numerator (i.e., the doses administered to the target age group) or the denominator (i.e., the number of subjects in the target population) is inaccurate, coverage can be over-estimated or under-estimated and, depending on the magnitude of the inaccuracy, the error can be gross. In this initial analysis, all children who participated in the immunization coverage survey were included to avoid any bias by excluding those who had not also participated in the serosurvey. However, the chance of bias is minimal, since the caregivers of 81% or more of all children participating in the immunization coverage survey in each woreda consented for them to participate in the serosurvey, and serum was obtained from 96% (2013) or 97% (2016) of enrolled children (Table 6).
D. DBS processing and use i. Single vs. multiple spot testing There were some advantages and disadvantages using one spot versus multiple small spots. In the initial testing, single and multiple 3.2 mm-diameter circular spots were cut from different parts of the DBS spots (instead of the entire spot), eluted and tested for antibody content by ELISA. By using a smaller surface area, this method enables preservation of a specimen for multiple tests. However, the use of 1-3 small spots, as opposed to the entire circle, resulted in lower sensitivity. Another problem encountered was that the blood was not always uniformly distributed, and a small surface area is not representative of the entire spot. Cutting multiple small spots (or punch) is also cumbersome and time-consuming. Limiting the manipulation of the sample is also preferable to avoid altering the spots or introducing contaminants.
Most of the papers in the literature use one DBS circle for individual tests. The use of a larger surface area ensures a more representative and homogeneous sample. As shown in the pictures (Figure 2), the blood was not always uniformly distributed in the DBS collected in the field. The use of an entire spot increases the sensitivity of the antibody measurements. However, this method consumes a substantial amount of sample. It is important to consider, in the preparation of the sample, that cutting only one spot reduces the manipulation of the sample. This technique is more practical and reduces the time of the assay. As the project progressed, we preferred the one-spot method to the single or multiple small-spot options, as it was more consistent and allowed for more sensitive antibody detection. ii. Differences between DBS samples from adult US volunteers and Ethiopian children
The samples from US volunteers did not show the non-specific binding noticed in some of the
Ethiopian field samples. Very strong correlations were found between serum and DBS antibody titers for tetanus and measles antibodies in the US volunteers (Figures 8 and 9). This would suggest that the quality of the Ethiopian DBS samples could have been compromised due to temperature in the field, humidity conditions, air contamination, etc.
Not all the cards had completely filled circles, as shown in Figure 2. In addition, DBS cards from a considerable number of children were missing. As a result, the laboratory could only perform limited troubleshooting using the DBS cards from the field. E. Future directions Additional experiments are needed to:
1. Define conditions to increase the quality of the DBS samples when collected in the field 2. Identify procedures to improve the quality of DBS eluates 3. Further study the cause of non-specific binding of eluates from DBS collected in the field 4. Improve the sensitivity and specificity of measles and Hib assays
7. CONCLUSIONS A. Vaccination coverage survey and serosurvey successes This project was very successful in enrollment and serum collection. In 2013, 87% of children who participated in the coverage survey enrolled in the serosurvey and serum samples were successfully collected from 96% of the children. In 2016, 91% of children who participated in the coverage survey enrolled in the serosurvey, and serum samples were successfully collected from 97% of them. Thus, showing that is possible to successfully perform a simultaneous coverage survey and serosurvey. The keys are adequate planning and community involvement and buy-in. These data are summarized in Table 25.
B. Poor agreement in vaccination coverage and seroprotection
For pentavalent vaccine protection, as evidenced by tetanus antibody concentrations, improvements were made in all three woredas from 2013 to 2016. These improvements were all statistically significant. All means and combinations of means of providing evidence of vaccination (EPI registry, vaccination card, EPI register, parental recall) are poorly predictive of serological protection. They may underestimate, overestimate, or provide near-accurate estimates. However, even when they provide near accurate estimates, they do not necessarily reflect vaccination/serological protection of the same children.
The measurement of protective titers of measles antibody revealed that the overwhelming proportion of infants 6-8 months of age fall within the window of vulnerability and are susceptible to measles.
Studies of measles antibody in toddlers revealed that, despite many with a documented history
measles vaccination, a large proportion of toddlers lack a protective titer of measles antibody. In 2016, when compared to 2013, the proportion serologically protected rose, but not to levels needed to prevent measles outbreaks. This information suggests that the shortfalls may be due in part to the need to strengthen the cold chain and otherwise improve handling of measles vaccine. It also suggests that the interventions for strengthening vaccination coverage that were implemented from 2013 to 2016 (between surveys) were more effective in improving the routine early-infant series at 6, 10, and 14 weeks (see below) than in improving the 9-month vaccination against measles. It is not yet possible to understand fully the contribution of lack of vaccination at all versus vaccination, but with inadequate protection due to vaccine failure for one reason or another.
Serological methods were able to clearly differentiate the woredas with respect to the effectiveness of vaccination services. Table 25 summarizes the number of children with seroprotection. This is also visually depicted in Figure 21. Understanding the causes behind low protection in certain regions and better protection in others may facilitate interventions that improve all coverage and serologic protection levels in Ethiopia.
As shown in Table 26, there is a large discrepancy in the number of children who are covered and
protected. The reasons behind this gap need to be better understood to further intervene to improve adequate protection against these vaccine preventable disease.
8. LIST OF FIGURES INTRODUCTION AND METHODS Figure 1: Location of the three woredas surveyed in Ethiopia Figure 2: Examples of correct and incorrect dried blood spot and strip (DBS) samples Figure 3: GPS locations for coverage survey participants in the three woredas in the 2016 survey RESULTS Figure 4: Flowchart of enrollment in the coverage survey and serosurvey, successful serum collection and serologic protection in 2013 and 2016 surveys TETANUS VACCINATION Figure 5: Tetanus coverage and protection estimates for 2013 and 2016 surveys in toddlers Figure 6: Comparison of toddlers with serologic protection against tetanus at various thresholds in the 2013 and 2016 surveys by woreda Figure 7: Percentage of toddlers in 2013 and 2016 surveys with tetanus antibody ≥ 0.15 IU/mL depending on number of pentavalent vaccine doses Figure 8: DBS serum antibody levels vs. serum antibody levels in US healthy adults for tetanus and measles Figure 9: Correlation of tetanus antitoxin antibody in DBS vs. serum samples in infants and toddlers in the 2013 survey Figure 10: Box plot graphs for tetanus antitoxin antibody levels in DBS and serum samples in infants and toddlers in 2013 survey separated by woreda Figure 11: Sensitivity, specificity, PPV, NPV and accuracy of tetanus antitoxin antibodies in serum vs DBS in the 2013 survey HIB VACCINATION Figure 12: Hib coverage and protection estimates for infants in the 2013 survey Figure 13: Percentage of infants in the 2013 survey with Hib anti-PRP antibody ≥ 1.0 mcg/mL depending on number of pentavalent vaccine doses Figure 14: Sensitivity, specificity, PPV, NPV and accuracy of Hib anti-PRP antibodies in serum vs. DBS in the 2013 survey
MEASLES VACCINATION Figure 15: Measles vaccinations estimates for 2013 and 2016 surveys in toddlers and infants Figure 16: Percentage of toddlers and infants in 2013 and 2016 surveys with measles antibody ≥ 120 mIU/mL depending on number of measles doses Figure 17: Sensitivity, specificity, PPV, NPV and accuracy of measles antibodies in serum ELISA (standard) vs. DBS elude ELISA in toddlers in the 2013 survey Figure 18: Scatter plots of serum measles antibody measured via PRN vs. ELISA Figure 19: Box plots and distribution of number of days until received measles vaccine and number of days between receiving measles vaccine and serum sample collection in toddlers from the 2016 survey based on validity of card and record status Figure 20: Scatter plot of time to receive measles vaccination and serum sample measles antibody levels measured via ELISA SUMMARY Figure 21: Percentage of children with serologic protection for tetanus, Hib and measles separated by toddlers and infants, woreda and vaccine SUPPLEMENTAL Figure S1: Agreement of reported tetanus coverage and protection (tetanus antitoxin antibody ≥ 0.15 IU/mL) in toddlers in whom serum antibodies were measured in 2016 survey Figure S2: Agreement of reported tetanus coverage and protection (tetanus antitoxin antibody ≥ 0.05 IU/mL) in toddlers in whom serum antibodies were measured in 2016 survey Figure S3: Agreement of reported measles coverage and protection (measles antibody ≥ 120 mIU/mL) in toddlers in whom serum antibodies were measured in 2016 survey
9. LIST OF TABLES INTRODUCTION AND METHODS Table 1: EPI vaccination schedule in Ethiopia for infants and women of childbearing age Table 2: Study design for 2013 and 2016 coverage survey and serosurvey Table 3: Responsibilities of coverage survey and serosurvey team members Table 4: Equipment for vaccination coverage survey and serosurvey Table 5: Guidelines for evaluation and treatment of anemia and vitamin A supplementation as recommended by the Ethiopian Paediatric Society RESULTS Table 6: Duration and enrollment for coverage survey and serosurvey and proportion of children with successful serum collection in the serosurvey in the 2013 and 2016 surveys TETANUS VACCINATION Table 7: Comparison of various survey estimates for tetanus coverage in toddlers compared to tetanus seroprotection (≥ 0.15 IU/mL) in the 2013 and 2016 surveys Table 8: Comparison of various survey estimates for tetanus coverage in toddlers compared to tetanus seroprotection (≥ 0.05 IU/mL) in the 2013 and 2016 survey Table 9: Comparison of toddlers with serologic protection against tetanus at various thresholds in the 2013 and 2016 surveys Table 10: Difference between 2013 and 2016 reported coverage and protection against tetanus in toddlers for various survey measures Table 11: Response to tetanus vaccination by number of doses in toddlers enrolled in the serosurvey in 2013 and 2016 surveys Table 12: Tetanus antitoxin antibody levels in DBS vs. serum samples in toddlers in 2013 survey Table 13: Sensitivity, specificity, PPV, NPV and accuracy of tetanus antitoxin antibodies in serum vs. DBS in infants and toddlers in the 2013 survey HIB VACCINATION Table 14: Comparison of various survey estimates for Hib coverage in infants compared to Hib seroprotection (≥ 1.0 mcg/mL) in the 2013 survey Table 15: Response to Hib vaccination by number of doses in infants enrolled in the serosurvey in the 2013 survey
Table 16: Sensitivity, specificity, PPV, NPV and accuracy of Hib anti-PRP antibodies in serum vs. DBS in infants in the 2013 survey MEASLES VACCINATION Table 17: Comparison of various survey estimates for measles coverage in infants and toddlers compared to measles seroprotection (≥ 120 mIU/mL via ELISA) in the 2013 and 2016 surveys Table 18: Difference between 2013 and 2016 reported coverage and protection against measles in toddlers for various survey measures Table 19: Response to measles vaccination by number of doses in toddlers and infants enrolled in the serosurvey in 2013 and 2016 surveys Table 20: Sensitivity, specificity, PPV, NPV and accuracy of measles antibodies (≥ 120 mIU/mL vs. ≥ 200 mIU/mL) measured via serum ELISA (standard) vs. DBS elute ELISA in toddlers in the 2013 survey Table 21: Comparison of using serum ELISA (standard) vs. DBS elute ELISA to measure measles antibodies (≥ 120 mIU/mL) in toddlers in the 2016 survey Table 22: Comparison of using serum PRN (standard) vs. serum ELISA to measure measles antibodies (≥ 120 mIU/mL) in toddlers in the 2016 survey Table 23: Interpretations of measles antibody levels measured via ELISA and PRN by two different technicians in a subset of 39 toddlers from Hintalo Wajerate in the 2016 survey and PRN estimates of protection in 2013 and 2016 in all 3 woredas Table 24: Number of days until received measles vaccine and number of days between receiving measles vaccine and serum sample collection in toddlers from the 2016 survey based on validity of card and record status SUMMARY Table 25: Summary of participants enrolled in the coverage survey, those with a serum sample collected and seroprotection for tetanus, Hib and measles Table 26: Number of toddlers who are protected vs. not protected in 2016 survey SUPPLEMENTAL Table S1: Comparison of reported tetanus coverage and protection (tetanus antitoxin antibody ≥ 0.15 IU/mL) in toddlers in whom serum antibodies were measured in 2016 survey Table S2: Comparison of reported tetanus coverage and protection (tetanus antitoxin antibody ≥ 0.05 IU/mL) in toddlers in whom serum antibodies were measured in 2016 survey Table S3: Comparison of reported measles coverage and protection (measles antibody ≥ 120 mIU/mL) in toddlers in whom serum antibodies were measured in 2016 survey
Table S4: Data used for interpretations of measles antibody levels measured via ELISA and PRN by two different technicians in a subset of 39 toddlers from Hintalo Wajerate in the 2016 survey
10. REFERENCES
1. Department of Immunization, Vaccines and Biologicals, WHO. Immunization coverage cluster survey - Reference manual. WHO/IVB/04.23, 1-115 (2005), Geneva: World Health Organization.
2. Schauer, Uwe, et al. "Levels of antibodies specific to tetanus toxoid, Haemophilus influenzae type b, and pneumococcal capsular polysaccharide in healthy children and adults." Clinical and diagnostic laboratory immunology 10.2 (2003);,202-207.
3. McQuillan, Geraldine M., et al. "Serologic immunity to diphtheria and tetanus in the United States." Annals of internal medicine 136.9 (2002), 660-666.
4. Sow, Samba O., et al. "Haemophilus influenzae type b conjugate vaccine introduction in Mali: impact on disease burden and serologic correlate of protection." The American journal of tropical medicine and hygiene 80.6 (2009), 1033-1038.
5. Enquselassie F, Ayele W, Dejene A, Messele T, Abebe A, Cutts FT, Nokes DJ. “Seroepidemiology of measles in Addis Ababa, Ethiopia: implications for control through vaccination.” Epidemiology and infection (2003), 130:507-19.
6. Murhekar MV, Bitragunta S, Hutin Y, Ckakravarty A, Sharma HJ, Gupte MD. “Immunization coverage and immunity to diphtheria and tetanus among children in Hyderabad, India.” Journal of infection (2009), 58:191-6.
11. TABLES AND FIGURES Table 1: EPI vaccination schedule in Ethiopia for infants and women of childbearing age
Vaccination for infants Vaccinations for women of child bearing age (15-49 years)
Age Vaccine Visit Vaccine
Birth BCG-1 OPV-0
1 - first contact TT-1
6 weeks Pentavalent-1 PCV-1 OPV-1 Rotavirus-1
2 - at least 4 weeks after TT-1
TT-2
10 weeks Pentavalent-2 PCV-2 OPV-2 Rotavirus-2
3 - at least 6 months after TT-2
TT-3
14 weeks Pentavalent-3 PCV-3 OPV-3* IPV-1*
4 - at least 1 year after TT-3 if not in subsequent pregnancy
TT-4
9 months Measles-1 5 - at least 1 year after TT-4 if not in subsequent pregnancy
TT-5
15 months Measles-2#
*New since 2016. Note: Oral bivalent polio vaccine introduced April 2016, replacing trivalent OPV. BCG = Bacillus Calmette-Guérin tuberculosis vaccine; DTP = Diphtheria, tetanus and whole cell pertussis combination vaccine; EPI = Expanded Programme on Immunization HBV = hepatitis B vaccine; Hib = Haemophilus influenzae type b vaccine; IPV = inactivated polio vaccine; OPV = oral poliovirus vaccine; Pentavalent = DTP-HBV-Hib vaccine; PCV = pneumococcal 10 conjugate vaccine; TT = tetanus toxoid. #The second MCV was added in 2019 (after the completion of this study)
Figure 1: Location of the three woredas surveyed in Ethiopia
Assaieta in Afar region, Arbegona in SNNPR and Hintalo Wajerate in Tigray region. SSNPR = Southern Nations, Nationalities and People’s Region.
Figure 2: Examples of correct and incorrect dried blood spot and strip (DBS) samples
A. Correct dried blood spot sample
B. Correct dried blood strip sample
C. Incorrect dried blood spot samples
1. Samples ran into each other 2. Irregular spots 3. Insufficient sample
DBS = dried blood spot or strips.
Table 2: Study design for 2013 and 2016 coverage survey and serosurvey
Age group Number of woredas
Target sample size
in each woreda
Tetanus antitoxin antibody
Hib anti-PRP antibody
Measles antibody
2013
Infants 6-8 months
3 100 Yes, if enough serum
available*
Yes Yes, if enough serum available
Toddlers 12-23 months
3 300 Yes Yes, if enough
serum available*
Yes
2016
Toddlers 12-23 months
3 300 Yes No Yes
*No data available as there was not sufficient serum for testing. Hib = Haemophilus influenzae; PRP = purified polyribosylribitol phosphate; Woredas = Assaieta, Arbegona and Hintalo Wajerate.
Table 3: Responsibilities of coverage survey and serosurvey team members
Coverage team members Responsibilities
Supervisor - Supervision of participant selection and data collection - Record GPS location for each child
Local guide - Guiding supervisor to correct households - Translation and communication services in local languages - Obtain informed consent from the child’s parent or caregiver - Help parents or caregivers complete questionnaire - Set up serosurvey meeting site and time - Assist with obtaining data
Serosurvey team members Responsibilities
Team leader - Supervision, logistics and workflow - Collection of data for each subject’s CRF - Interpretation of the child’s Hb level using the Hemocue® Hb 201+
Analyzer - Centrifuge blood so that serum can be separated - Oversight and quality of database - Backup phlebotomist - Backup for preparing DBS on filter paper - Backup for measurement of the child’s Hb level using the Hemocue®
Hb 201+ Analyzer - Backup for deworming treatment and iron supplementation
Deputy team leader (when available)
- Supervision, logistics and workflow as needed - Collection of data for each subject’s CRF - Backup phlebotomist - Backup for preparing DBS - Backup for Hb measurement and treatment
Local health worker - Translation and communication services in local languages - Obtain informed consent from the child’s parent or caregiver - Assist holding child during phlebotomy and comforting parents or
caregivers and child - Primary dispenser for deworming treatment and iron supplementation - Backup phlebotomist (if trained and experienced in collecting blood
from young children) - Backup for preparing DBS on filter paper
Phlebotomist - Collect and label serum in SST - Measure the child’s Hb level using the Hemocue® Hb 201+ Analyzer - Centrifuge blood so that serum can be separated - DBS filter paper preparation - Backup to set up the worksite - Backup to obtain informed consent from the child’s parent or caregiver
Medical technologist (at least one per woreda)
- Organize the collection of clinical specimens - Prepare logs for specimen collection - Maintain a log of all clinical specimens obtained from the subjects - Data entry and database maintenance - Store clinical specimens and arrange for shipping
Driver - Transportation for the team members and for moving clinical specimens to intermediate cold or frozen storage
- Assist in communicating in the local languages with parents, caregivers and others in the household and community
- Assist in setting up the work site - Backup for centrifuging blood specimens to separate and collect serum
CRF = case report form; DBS = dried blood spot; GPS = global positioning system; Hb = hemoglobin; SST = serum-separating tube; WHO = World Health Organization.
Figure 3: GPS locations for coverage survey participants in the three woredas in the 2016 survey A. Assaieta, Afar Region
B. Arbegona, SNNPR
C. Hintalo Wajerate, Tigray region
GPS = global positioning system; (Southern Nations, Nationalities and People’s Region).
Table 4: Equipment for vaccination coverage survey and serosurvey
Serum separator tubes (3.5 mL) 2 cases of 10 packs of 100 each
Safety box containers for used sharps
1 case of 24 containers
Papoose boards 5
Gloves (latex, nitrile, or equivalent) Small: 6 packs of 100 each; Medium: 2 cases of 10 packs of
100 each; Large: 10 packs of 100 each
Filter papers 35 packs of 100 each Whatman 903 Protein Saver cards
Sealable plastic bags 35 packs of 100 each Whatman plastic sample bags
Desiccant packs 35 packs of 100 each Whatman 903 desiccant packs
Paper towels
Biohazard bags 1 pack of 200
Biohazard bag holders 2
Serum processing
Test tube racks
Centrifuge 5 Portafuge™, Model E8-3000
Cooler for serum samples 2
Cold packs Multiple
Portable refrigerator/freezer 5 Engel portable fridge/freezer, Model #MT45F-U1
Screw cap cryovial 2 mL microcentrifuge tubes
3 cases of 5 packs Screw Cap Micro Tube
100-1000 μL pipettors and pipette tips
2 pipettors 3 cases of 960 pipette tips
Finnpipette F1 pipettors Finntip filtered pipette tips (100-1000 μL)
Clear tape
Freezer storage boxes with separators
9 packs of 12 boxes each Thermo Scientific Freezer Fiberboard Storage Boxes and Box Dividers
Bleach solution, 10%
Treatment
Iron supplement 1 bottle per participant HaemUp™ iron syrup with folate (Available locally)
Mebendazole 1 treatment per participant Available locally
Vitamin A 1 treatment per participant Available locally
Paperwork
Protocols
Informed consent forms 2 per participant
Case report forms (CRF) 1 per participant
SST sample log sheet
DBS filter paper sample log sheets
Hb measurement log sheets
Serum specimen log sheet
Paper pads 12
Black pens 6 dozen
Black permanent markers 24 Sharpie permanent markers
Scissors (5”) 4
Storage clipboard 5 OIC Slim Storage Clipboard CRF = case report form; DBS = dried blood spot; Hb = Hemoglobin; Hz = Hertz; mL = milliliter; PC = personal computer; TM = trademark; SST = serum separator tube; V = volts; W = watts; μL = microliter.
Table 5: Guidelines for evaluation and treatment of anemia and vitamin A supplementation as recommended by the Ethiopian Paediatric Society
Severity of anemia Hb level (g/dL)
Iron supplement (HaemUpTM) given?
Antihelminth agent (mebendazole) given?
Vitamin A given?* Caregiver should bring the child to the nearest health center
Mild 10.0-11.9 Yes Toddlers only Yes In 14 days
Moderate 5.0-9.9 Yes Toddlers only Yes Within the next few days
Severe <5.0 Yes Toddlers only Yes Same or next day *Vitamin A dosing = 100,000 U for infants and 200,000 U for toddlers if not administered in the previous 4 weeks. dL = deciliter; g = grams; Hb = Hemoglobin; Infants = 6-8 months; TM = trademark; Toddler = 12-23 months; U = units.
Table 6: Duration and enrollment for coverage survey and serosurvey and proportion of children with successful serum collection in the serosurvey in the 2013 and 2016 surveys
Woreda Survey duration (days)
Survey enrollment Successful serum collection in children enrolled in the serosurvey
2013 2016 2013 2016 2013 2016
Co
vera
ge
surv
ey
Se
rosu
rve
y
Pro
po
rtio
n
Co
vera
ge
surv
ey
Se
rosu
rve
y
Pro
po
rtio
n
Infa
nts
Tod
dle
rs
Tota
l
Pro
po
rtio
n
Tod
dle
rs
Pro
po
rtio
n
Assaieta 15 16 390 317 81%
(317/390) 279 247
89% (247/279)
81 215 296* 96%
(303*/317) 239
97% (239/247)
Arbegona 20 13 395 350 89%
(350/395) 294 262
89% (262/294)
87 251 338 97%
(338/350) 258
98% (258/262)
Hintalo Wajerate
12 12 396 356 90%
(356/396) 292 281
96% (281/292)
78 263 341 96%
(341/356) 273
97% (273/281)
All woredas 47 41 1181 1023 87%
(1023/1181) 865 790
91% (790/865)
246 729 975* 96%
(982*/1023) 770
97% (770/790)
*There is a discrepancy in the 2013 Assaieta data as 303 serum samples were successfully collected but nine of the samples were unable be processed. Therefore only 296 samples (instead of 303 samples) had antibody testing performed. Note: infants were only included in the 2013 survey. 2016 survey includes only toddlers. Infants = 6-8 months; Toddlers = 12-23 months. Coverage survey = systematic survey to check documentation of vaccination coverage by EPI registry, vaccination card or parental recall. Serosurvey = systematic survey to collect serum sample to test for specific antibodies to vaccines to document seroprotection.
Figure 4: Flowchart of enrollment in the coverage survey and serosurvey, successful serum collection and serologic protection in 2013 and 2016 surveys A. All woredas
*There is a discrepancy in the 2013 Assaieta data as 303 serum samples were successfully collected but nine of the samples were unable be processed. Therefore only 296 samples (instead of 303 samples) had antibody testing performed. Note: 2013 data includes infants and toddlers. 2016 data includes only toddlers. Not enrolled in coverage survey = unable to find child selected for coverage survey or parents or caregivers chose not to enroll in coverage survey; Not enrolled in serosurvey = did not show up for serum collection or parents or caregivers chose not to enroll in serosurvey; Unsuccessful serum collection = unable to get serum or problem with sampling processing; Serologic protection = serum antibodies demonstrating protection from (tetanus antibody ≥ 0.15 IU/mL; Hib anti-PRP antibody ≥ 1.0 mcg/mL; measles antibody ≥ 120 mIU/mL); Hib = Haemophilus influenzae type b; IU = international units; mcg = microgram; mIU = million international units; mL = milliliters; PRP = purified polyribosylribitol phosphate; Infant = 6-8 months; Toddler = 12-23 months.
B. Assaieta, Afar Region
*There is a discrepancy in the 2013 Assaieta data as 303 serum samples were successfully collected but nine of the samples were unable be processed so only 296 samples had antibody testing performed. Note: 2013 data includes infants and toddlers. 2016 data includes only toddlers. Not enrolled in coverage survey = unable to find child selected for coverage survey or parents or caregivers chose not to enroll; Not enrolled in serosurvey = did not show up for serum collection or parents or caregivers chose not to enroll in serosurvey; Unsuccessful serum collection = unable to get serum or problem with sampling processing; Serologic protection = serum antibodies demonstrating protection from (tetanus antibody ≥ 0.15 IU/mL; Hib anti-PRP antibody ≥ 1.0 mcg/mL; measles antibody ≥ 120 mIU/mL); Hib = Haemophilus influenzae type b; IU = international units; mcg = microgram; mIU = million international units; mL = milliliters; PRP = purified polyribosylribitol phosphate; Infant = 6-8 months; Toddler = 12-23 months.
C. Arbegona, SNNPR
Note: 2013 data includes infants and toddlers. 2016 data includes only toddlers. Not enrolled in coverage survey = unable to find child selected for coverage survey or parents or caregivers chose not to enroll in coverage survey; Not enrolled in serosurvey = did not show up for serum collection or parents or caregivers chose not to enroll in serosurvey; Unsuccessful serum collection = unable to get serum or problem with sampling processing; Serologic protection = serum antibodies demonstrating protection from (tetanus antibody ≥ 0.15 IU/mL; Hib anti-PRP antibody ≥ 1.0 mcg/mL; measles antibody ≥ 120 mIU/mL); Hib = Haemophilus influenzae type b; IU = international units; mcg = microgram; mIU = million international units; mL = milliliters; PRP = purified polyribosylribitol phosphate; Infant = 6-8 months; Toddler = 12-23 months.
D. Hintalo Wajerate, Tigray Region
Note: 2013 data includes infants and toddlers. 2016 data includes only toddlers. Not enrolled = unable to find child selected for coverage survey or parents or caregivers chose not to enroll; Not enrolled in serosurvey = did not show up for serum collection or parents or caregivers chose not to enroll in serosurvey; Unsuccessful serum collection = unable to get serum or problem with sampling processing; Serologic protection = serum antibodies demonstrating protection from (tetanus antibody ≥ 0.15 IU/mL; Hib anti-PRP antibody ≥ 1.0 mcg/mL; measles antibody ≥ 120 mIU/mL); Hib = Haemophilus influenzae type b; IU = international units; mcg = microgram; mIU = million international units; mL = milliliters; PRP = purified polyribosylribitol phosphate; Infant = 6-8 months; Toddler = 12-23 months.
Table 7: Comparison of various survey estimates for tetanus coverage in toddlers compared to tetanus seroprotection (≥ 0.15 IU/mL) in the 2013 and 2016 surveys A. All toddlers enrolled in coverage survey including participants with no serum collection
Note: p-value for chi-squared comparison test with serosurvey results. Bold = p-value <0.005 and statistically significant. p-values for 2016 data were not calculated. Note: The denominator in the coverage surveys (e.g. administrative coverage, traditional survey coverage, JSI survey coverage, documented coverage) is the number of children enrolled in the coverage survey and some children may not have had a serum sample collected. The denominator in the seroprotection category is the number of children with a successful serum sample. *With administrative reports over-reporting can occur if estimations under-estimate number of children in woreda or over-reporting number of children vaccinated. Seroprotection = tetanus antibody ≥ 0.15 IU/mL; Administrative coverage = EPI 2012 registry used for 2013 data and EPI 2013 registry used for 2016 data; Traditional survey coverage = vaccination card + parental recall; JSI survey coverage = vaccination card + EPI registry + parental recall; Documented coverage = vaccination card + EPI registry; EPI = Expanded Programme on Immunization; IU = international units; mL = milliliters; NA = not available; Toddler = 12-23 months.
B. Only toddlers enrolled in the serosurvey in whom serum antibody levels were measured
Woreda
Year
Serosurvey Administrative
coverage Traditional survey coverage JSI survey coverage Documented coverage
Tetanus antitoxin antibody
≥ 0.15 IU/mL Estim
ate
p-v
alu
e
Estim
ate
p-v
alu
e
Kappa
95%
CI
Estim
ate
p-v
alu
e
Kappa
95%
CI
Estim
ate
p-v
alu
e
Kappa
95%
CI
Assaieta 2013
53% (114/215)
85% NA 33%
(72/215) <0.0001 NA NA
35% (75/215)
<0.0001 NA NA 27%
(57/215) NA NA NA
2016 73%
(174/239) 140%* NA
43% (102/239)
<0.0001 0.2167 0.1439, 0.2895
46% (110/239)
<0.0001 0.3701
0.2714, 0.4688
28% (68/239)
<0.0001 0.3411 0.2466, 0.4355
Arbegona 2013
60% (151/251)
80% NA 16%
(40/251) <0.0001 NA NA
41% (103/251)
<0.0001 NA NA 36%
(91/251) NA NA NA
2016 75%
(193/258) 87% NA
39% (101/258)
<0.0001 0.0466 -0.0295, 0.1227
57% (147/258)
<0.0001 0.0672
-0.0464, 0.1809
29% (74/258)
<0.0001 0.0762 -0.0147, 0.1672
Hintalo Wajerate
2013 93%
(244/263) 90% NA
80% (211/263)
<0.0001 NA NA 87%
(229/263) 0.01 NA NA
83% (217/263)
NA NA NA
2016 97%
(264/273) 94% NA
63% (173/273)
<0.0001 0.0625 -0.0061, 0.1311
88% (239/273)
<0.0001 0.0431 -0.0756,
0.1619 66%
(181/273) <0.0001 -0.0253
-0.0750, 0.0243
Note: p-value for McNemar’s test comparison test with serosurvey results. Bold = p-value <0.005 and statistically significant. Kappa = 0-0.2 slight, 0.21-0.4 fair, 0.41-0.6 moderate, 0.61-0.8 substantial, 0.81-1.0 almost perfect. CI = confidence interval. *With administrative reports over-reporting can occur if estimations under-estimate number of children in woreda or multiple doses of vaccine are given to the same child. Serosurvey = tetanus antibody ≥ 0.15 IU/mL; Administrative coverage = EPI 2012 registry used for 2013 data and EPI 2013 registry used for 2016 data; Traditional survey coverage = vaccination card + parental recall; JSI survey coverage = vaccination card + EPI registry + parental recall; Documented coverage = vaccination card + EPI registry; EPI = Expanded Programme on Immunization; IU = international units; mL = milliliters; NA = not available; Toddler = 12-23 months.
Table 8: Comparison of various survey estimates for tetanus coverage in toddlers compared to tetanus seroprotection (≥ 0.05 IU/mL) in the 2013 and 2016 survey A. Only toddlers enrolled in the serosurvey in whom serum antibody levels were measured
Woreda
Year
Serosurvey Administrative
coverage Traditional survey coverage JSI survey coverage Documented coverage
Tetanus antitoxin antibody ≥ 0.05 IU/mL
Estim
ate
p-v
alu
e
Estim
ate
p-v
alu
e
Kappa
95%
CI
Estim
ate
p-v
alu
e
Kappa
95%
CI
Estim
ate
p-v
alu
e
Kappa
95%
CI
Assaieta
2013 59.6%
(127/213**) 85% NA
33% (72/215)
NA NA NA 35%
(75/215) NA NA NA
27% (57/215)
NA NA NA
2016 79.1%
(189/239) 140%* NA
41% (99/239)
<0.0001 0.2828 0.1977, 0.3680
78% (106/239)
<0.0001 0.3041 0.2133, 0.3950
28% (67/239)
<0.0001 0.1770 0.1166, 0.2374
Arbegona
2013 72.9%
(183/251) 80% NA
16% (40/251)
NA NA NA 41%
(103/251) NA NA NA
36% (91/251)
NA NA NA
2016 83.7%
(216/258) 87% NA
34% (88/258)
<0.0001 0.0487 -0.0095, 0.1070
49% (126/258)
<0.0001 0.0501 -0.0497, 0.1500
26% (66/258)
<0.0001 0.0487 -0.0095, 0.1070
Hintalo Wajerate
2013 94%
(248/263) 90% NA
80% (211/263)
NA NA NA 87%
(229/263) NA NA NA
83% (217/263)
NA NA NA
2016 99.3%
(271/273) 94% NA
63.4% (171/273)
<0.0001 -0.0146 -0.0346, 0.0054
87% (237/273)
<0.0001 -0.0140 -0.0326, 0.0045
66% (180/273)
<0.0001 0.0070 -0.0243, 0.0383
Note: p-value for McNemar’s test comparison test with serosurvey results. Bold = p-value <0.005 and statistically significant. Kappa = 0-0.2 slight, 0.21-0.4 fair, 0.41-0.6 moderate, 0.61-0.8 substantial, 0.81-1.0 almost perfect. CI = confidence interval. *With administrative reports over-reporting can occur if estimations under-estimate number of children in woreda or multiple doses of vaccine are given to the same child. **Note there is a discrepancy in the data as there should be 215 not 213 toddlers in Assaieta in 2013 for the number of toddlers enrolled in the serosurvey with successful serum collection. The data for the two missing infants were unable to be found. Serosurvey = tetanus antibody ≥ 0.05 IU/mL; Administrative coverage = EPI 2012 registry used for 2013 data and EPI 2013 registry used for 2016 data; Traditional survey coverage = vaccination card + parental recall; JSI survey coverage = vaccination card + EPI registry + parental recall; Documented coverage = vaccination card + EPI registry; EPI = Expanded Programme on Immunization; IU = international units; mL = milliliters; NA = not available; Toddler = 12-23 months.
Figure 5: Tetanus coverage and protection estimates for 2013 and 2016 surveys in toddlers A. All toddlers enrolled in coverage survey including participants with no serum collection for seroprotective level of ≥ 0.15 IU/mL i. Separated by woreda
ii. Separated by survey type
Note: No data available for 2016 documented. JSI = John Snow International Inc; Serosurvey = tetanus antibody ≥ 0.15 IU/ml; Traditional survey = vaccination card + parental recall; JSI = vaccination card + parental recall + registry; documented = vaccination card + registry;
B. Only toddlers enrolled in serosurvey in whom serum antibody levels were measured for seroprotective level of ≥ 0.15 IU/mL i. Separated by woreda
ii. Separated by survey type
Note: Serosurvey = tetanus antibody ≥ 0.15 IU/ml; Traditional survey = vaccination card + parental recall; JSI = vaccination card + parental recall + registry; documented = vaccination card + registry; IU = international units; ml = milliliter; JSI = Jon Snow Inc.; NA = not available; Toddler = 12-23 months.
C. Only toddlers enrolled in serosurvey in whom serum antibody levels were measured for seroprotective level of ≥ 0.05 IU/mL. i. Separated by woreda
ii. Separated by survey type
Note: Serosurvey = tetanus antibody ≥ 0.05 IU/ml; Traditional survey = vaccination card + parental recall; JSI = vaccination card + parental recall + registry; documented = vaccination card + registry; IU = international units; ml = milliliter; JSI = Jon Snow Inc.; NA = not available; Toddler = 12-23 months.
Table 9: Comparison of toddlers with serologic protection against tetanus at various thresholds in the 2013 and 2016 surveys A. Proportion of toddlers by woreda with tetanus antitoxin antibody greater than 0.05 IU/mL, 0.10 IU/mL and 0.15 IU/mL
Woreda
Proportion with tetanus antitoxin antibody
≥ 0.05 IU/mL
Proportion with tetanus antitoxin antibody
≥ 0.10 IU/mL
Proportion with tetanus antitoxin antibody
≥ 0.15 IU/mL
2013 2016 2013 2016 2013 2016
Assaieta 60% 79% 52% 77% 53% 73%
Arbegona 73% 84% 62% 78% 60% 75%
Hintalo Wajerate 94% 99% 91% 99% 93% 97%
All woredas 73% 89% 69% 86% 67% 83%
B. Statistical comparison between thresholds of ≥ 0.05 IU/mL vs. ≥ 0.15 IU/mL
Note: p-value for McNemar’s test comparison test with serosurvey results. Bold = p-value <0.005 and statistically significant. Kappa = 0-0.2 slight, 0.21-0.4 fair, 0.41-0.6 moderate, 0.61-0.8 substantial, 0.81-1.0 almost perfect. CI = confidence interval. *Note there is a discrepancy in that there should be 114 not 113 with serologic protection for tetanus in Assaieta in the 2013 survey. There was a discrepancy in the database during this statistical analysis. **Note there is a discrepancy in the data as there should be 215 not 213 toddlers in Assaieta in the 2013 survey for the number of toddlers enrolled in the serosurvey with successful serum collection. The data for the two missing infants were unable to be found. IU = international units; ml = milliliter.
Figure 6: Comparison of toddlers with serologic protection against tetanus at various thresholds in the 2013 and 2016 surveys by woreda
Table 10: Difference between 2013 and 2016 reported coverage and protection against tetanus in toddlers for various survey measures A. All toddlers enrolled in coverage survey including participants with no serum collection
Note: p-value for McNemar’s test comparison test with serosurvey results. Bold = p-value <0.005 and statistically significant. Kappa = 0-0.2 slight, 0.21-0.4 fair, 0.41-0.6 moderate, 0.61-0.8 substantial, 0.81-1.0 almost perfect. CI = confidence interval. *Note there is a discrepancy in that there should be 114 toddlers, not 113 toddlers, with serologic protection for tetanus in Assaieta in the 2013 survey. There was a discrepancy in the database during this statistical analysis. **Note there is a discrepancy in the data as there should be 215 toddlers, not 213 toddlers, in Assaieta in the 2013 survey for the number of toddlers enrolled in the serosurvey with successful serum collection. The data for the two missing infants were unable to be found. Serosurvey = tetanus antitoxin antibody above threshold reported; Traditional survey coverage = vaccination card + parental recall; JSI survery coverage = vaccination card + parental recall + registry; documented = vaccination card + registry; IU = international units; ml = milli liter; CI = confidence interval; JSI = Jon Snow Inc.; NA = not available; Toddler = 12-23 months.
B. Only toddlers enrolled in the serosuvey in whom serum antibody levels were measured
Note: p-value for McNemar’s test comparison test with serosurvey results. Bold = p-value <0.005 and statistically significant. Kappa = 0-0.2 slight, 0.21-0.4 fair, 0.41-0.6 moderate, 0.61-0.8 substantial, 0.81-1.0 almost perfect. CI = confidence interval. *Note there is a discrepancy in that there should be 114 not 113 with serologic protection for tetanus in Assaieta in the 2013 survey. There was a discrepancy in the database during this statistical analysis. **Note there is a discrepancy in the data as there should be 215 not 213 infants in Assaieta in the 2013 survey for the number of toddlers enrolled in the serosurvey with successful serum collection. The data for the two missing infants were unable to be found. Serosurvey = tetanus antitoxin antibody above threshold reported; Traditional survey coverage = vaccination card + parental recall; JSI survery coverage = vaccination card + parental recall + registry; documented = vaccination card + registry; IU = international units; ml = milliliter; CI = confidence interval; JSI = Jon Snow Inc.; NA = not available; Toddler = 12-23 months.
Table 11: Response to tetanus vaccination by number of doses in toddlers enrolled in the serosurvey in 2013 and 2016 surveys
Woreda Number of
doses Number of children GMT tetanus antitoxin antibody
(IU/mL)
Percentage with tetanus antitoxin antibody
≥ 0.15 IU/mL
2013 2016 2013 2016 2013 2016
Assaieta
0 58 62 0.01 0.04 24%
(14/58) 39%
(24/62)
1 15 24 0.04 0.10 40%
(6/15) 50%
(12/24)
2 9 37 0.22 0.82 67% (6/9)
81% (30/37)
3 57 112 0.89 1.95 91%
(52/57) 94%
(105/112)
Total 139 239 - - 56%
(78/139) 73%
(174/239)
Arbegona
0 44 22 0.004 0.06 23%
(10/44) 36%
(8/22)
1 13 9 0.34 0.04 62%
(8/13) 44% (4/9)
2 18 73 0.60 0.41 94%
(17/18) 81%
(59/73)
3 91 147 0.47 0.42 80%
(73/91) 78%
(115/147)
Total 166 258 - - 65%
(108/166) 75%
(193/258)
Hintalo Wajerate
0 1 0 0.01 - 0%
(0/1) NA
1 5 2 0.75 7.60 80% (4/5)
100% (2/2)
2 16 12 0.85 3.05 88%
(14/16) 100% (12/12)
3 217 257 0.95 2.43 96%
(209/217) 96%
(248/257)
Total 239 273 - - 95%
(227/239) 97%
(264/273)
Number of doses = number of pentavalent doses by card or EPI registry, 0 doses was based on card, EPI registry or parental recall; GMT = geometric mean titer; IU = international units; mL = milliliters.
Figure 7: Percentage of toddlers in 2013 and 2016 surveys with tetanus antibody ≥ 0.15 IU/mL depending on number of pentavalent vaccine dose
IU = international unit; mL = milliliter.
Table 12: Tetanus antitoxin antibody levels in DBS vs. serum samples in toddlers in 2013 survey
Age Assay Number Mean Median GMT 95% CI
Infants
Serum 157 9.22 1.04 0.82 0.53-1.26
DBS 157 5.93 0.64 0.74 0.52-1.04
Toddlers
Serum 200 1.04 0.41 0.21 0.15-0.29
DBS 200 0.69 0.27 0.22 0.18-0.28 Note: The categorical variable was defined as 1 if the IgG concentration reached the putative protective level and 0 otherwise. For analyses of continuous variables, values of serum IgG given as <0.0007 were changed to 0.00035 (n=3) and values of DBS IgG < 0.015 were changed to 0.0075 (n=10). Comparisons based on IgG as a continuous variable used log10-transformed values. Statistical analyses were done using NCSS 8 (Number Cruncher Statistical Systems, Kaysville, Utah). Comparisons were considered statistically significant for two-sided p-values <= 0.05. CI = confidence intervals; DBS = dried blood spot or strip; GMT = geometric mean; Ig = immunoglobulin; infants = 6-8 months; toddlers = 12-23 months.
Figure 8: DBS serum antibody levels vs. serum antibody levels in US healthy adults for tetanus and measles A. Tetanus B. Measles
Note: Data collected in 2013. DBS = dried blood spot or strip; IU = international units; mL = milliliters; mIU = million international units.
Figure 9: Correlation of tetanus antitoxin antibody in DBS vs. serum samples in infants and toddlers in the 2013 survey A. Infants B. Toddlers
Figure 10: Box plot graphs for tetanus antitoxin antibody levels in DBS and serum samples in infants and toddlers in 2013 survey separated by woreda A. Infants serum B. Infants DBS
Table 13: Sensitivity, specificity, PPV, NPV and accuracy of tetanus antitoxin antibodies in serum vs. DBS in infants and toddlers in the 2013 survey A. Toddlers
Note: Data for 2016 survey currently not available. DBS = dried blood spot or strip; IU = international unit; mL = milliliter; PPV = positive predictive value; NPV = negative predictive value; toddler = 12-23 months; infant = 6-8 months.
Figure 11: Sensitivity, specificity, PPV, NPV and accuracy of tetanus antitoxin antibodies in serum vs. DBS in the 2013 survey A. Toddlers
Table 14: Comparison of various survey estimates for Hib coverage in infants compared to Hib seroprotection (≥ 1.0 mcg/mL) in the 2013 survey A. All infants enrolled in coverage survey including participants with no serum collection
p value for chi-squared comparison test with serosurvey results. Bold = p-value <0.005 and statistically significant. Note: Infants were not enrolled in the 2016 survey. Serosurvey = Hib anti-PRP antibody ≥ 1.0 mcg/mL; Administrative coverage = EPI 2012 registry used for 2013 data and EPI 2013 registry used for 2016 data; Traditional survey coverage = vaccination card + parental recall; JSI survey coverage = vaccination card + EPI registry + parental recall; Documented coverage was not collected in the 2013 survey; EPI = Expanded Programme on Immunization; Hib = Haemophilus influenzae type b; infants = 6-8 months; mcg = microgram; mL = milliliter; NA = not available; PRP = purified polyribosylribitol phosphate.
B. Only infants enrolled in the serosurvey in whom serum antibody levels were measured
Woreda
Year
Serosurvey Administrative coverage Traditional coverage JSI survey coverage Documented coverage
Hib anti-PRP antibody
≥ 1.0 mcg/mL
Estimate
p-value
Estimate
p-value
Estimate
p-value
Estimate
p-value
Assaieta 2013 31%
(25/81) 85% <0.0001
40% (32/81)
0.13 40%
(32/81) 0.13 NA NA
Arbegona 2013 41%
(36/87) 80% <0.0001
13% (11/87)
<0.0001 29%
(25/87) 0.048 NA NA
Hintalo Wajerate
2013 68%
(53/78) 90% <0.0001
55% (43/78)
0.02 58%
(45/78) 0.06 NA NA
p value for McNemar’s test comparison with serosurvey results. Bold = p-value <0.005 and statistically significant. Serosurvey = Hib anti-PRP antibody ≥ 1.0 mcg/mL; Administrative coverage = EPI 2012 registry used for 2013 data and EPI 2013 registry used for 2016 data; Traditional survey coverage = vaccination card + parental recall; JSI survey coverage = vaccination card + EPI registry + parental recall; Documented coverage was not collected in the 2013 survey; EPI = Expanded Programme on Immunization; Hib = Haemophilus influenzae type b; infants = 6-8 months; mcg = microgram; mL = milliliter; NA = not available; PRP = purified polyribosylribitol phosphate
Figure 12: Hib coverage and protection estimates for infants in the 2013 survey A. All infants in coverage survey including participants with no serum collection i. Separated by woreda
ii. Separated by survey type
B. Only infants enrolled in serosurvey in whom serum antibody levels were measured i. Separated by woreda
ii. Separated by survey type
Note: No documented data available for 2013. Serosurvey = Hib anti-PRP antibody ≥ 1.0 mcg/mL; Administrative = EPI 2012 registry used for 2013 data and EPI 2013 registry used for 2016 data; Traditional survey = vaccination card + parental recall; JSI survey = vaccination card + EPI registry + parental recall; Documented = vaccination card + EPI registry; EPI = Expanded Programme on Immunization; Hib = Haemophilus influenzae type b; mcg = microgram; mL = milliliter; NA = not available; PRP = purified polyribosylribitol phosphate.
Table 15: Response to Hib vaccination by number of doses in infants enrolled in the serosurvey in the 2013 survey
Woreda Number of doses
Number of children
GMT Hib anti-PRP antibody (mcg/mL)
Percentage with Hib anti-PRP antibody ≥ 1.0 mcg/mL
Assaieta
0 30 0.08 7%
(2/30)
1 4 0.09 0%
(0/4)
2 1 0.38 0%
(0/1)
3 30 0.92 53%
(16/30)
Total 65 - 28%
(18/65)
Arbegona
0 25 0.08 8%
(2/25)
1 9 0.36 33% (3/9)
2 12 1.60 67%
(8/12)
3 24 1.51 58%
(14/24)
Total 70 - 39%
(27/70)
Hintalo Wajerate
0 4 0.09 25% (1/4)
1 12 0.16 25%
(3/12)
2 15 0.85 53%
(8/15)
3 43 5.50 88%
(38/43)
Total 74 - 68%
(50/74)
Note: Testing only done on some of the samples from the 2013 survey. Number of doses = number of pentavalent doses by card or EPI registry, 0 doses was based on card, EPI registry or parental recall; GMT = geometric mean titer; Hib = Haemophilus influenzae type b; PRP = purified polyribosylribitol phosphate; mcg = micrograms; mL = milliliters.
Figure 13: Percentage of infants in the 2013 survey with Hib anti-PRP antibody ≥ 1.0 mcg/mL depending on number of pentavalent vaccine doses
Table 16: Sensitivity, specificity, PPV, NPV and accuracy of Hib anti-PRP antibodies in serum vs. DBS in infants in the 2013 survey
Table 17: Comparison of various survey estimates for measles coverage in infants and toddlers compared to measles seroprotection (≥ 120 mIU/mL via ELISA) in the 2013 and 2016 surveys A. All toddlers enrolled in coverage survey including participants with no serum collection
p value for chi-squared comparison test with serosurvey results. Bold = p-value <0.005 and statistically significant. Note no documented data available for 2013 survey. *With administrative reports over-reporting can occur if estimations under-estimate number of children in woreda or multiple doses of vaccine are given to the same child. Serosurvey = measles antibody ≥ 120 mIU/mL via ELISA; Administrative coverage = EPI 2012 registry used for 2013 data and EPI 2013 registry used for 2016 data; Traditional survey coverage = vaccination card + parental recall; JSI survey = vaccination card + EPI registry + parental recall; Documented coverage = vaccination card + EPI registry; ELISA = Enzyme-linked immunosorbent assay; EPI = Expanded Programme on Immunization; mIU = million international units; mL = milliliter; NA = not available; toddler = 12-23 months.
B. Only toddlers enrolled in the serosurvey in whom serum antibody levels were measured
Woreda
Year
Serosurvey Administrative coverage
Traditional survey coverage JSI survey coverage Documented coverage
Measles antibody
≥ 120 mIU/mL
via ELISA
Estim
ate
p-v
alu
e
Estim
ate
p-v
alu
e
Kappa
95%
CI
Estim
ate
p-v
alu
e
Kappa
95%
CI
Estim
ate
p-v
alu
e
Kappa
95%
CI
Assaieta
2013 35%
(76/215) 36% NA
42% (90/215)
0.10 NA NA 21%
(46/215) 0.0001 NA NA
16% (35/215)
NA NA NA
2016 55%
(131/239) 140%* NA
67% (159/239)
0.0046 0.2677 0.1632, 0.3721
69% (164/239)
0.0006 0.2275 0.1077, 0.3474
29% (70/239)
<0.0001 0.2048 0.0832, 0.3265
Arbegona
2013 21%
(53/251) 91% <0.0001
41% (103/251)
<0.0001 NA NA 42%
(106/251) <0.0001 NA NA
24% (61/251)
NA NA NA
2016 21%
(55/258) 78% NA
53% (137/258)
<0.0001 -0.0719 -0.184, 0.0402
66% (169/258)
<0.0001 0.0128 -0.0672, 0.0928
22% (57/258)
0.9179 0.0718 -0.0236, 0.1672
Hintalo
Wajerate
2013 65%
(172/263) 85% <0.0001
78% (205/263)
0.0005 NA NA 73.7%
(194/263) 0.0001 NA NA
67% (175/263)
NA NA NA
2016 42%
(116/273) 86% NA
60% (163/273)
0.0001 -0.0828 -0.1978, 0.0321
79.1% (216/273)
0.0006 -0.0375 -0.1261, 0.0512
55% (150/273)
0.0069 -0.0607 -0.1727, 0.0514
p-value for McNemar’s test comparison test with serosurvey results. Bold = p-value <0.005 and statistically significant. Kappa = 0-0.2 slight, 0.21-0.4 fair, 0.41-0.6 moderate, 0.61-0.8 substantial, 0.81-1.0 almost perfect. *With administrative reports over-reporting can occur if estimations under-estimate number of children in woreda or multiple doses of vaccine are given to the same child. CI = confidence interval. Serosurvey = measles antibody ≥ 120 mIU/mL via ELISA; Administrative coverage = EPI 2012 registry used for 2013 data and EPI 2013 registry used for 2016 data; Traditional survey coverage = vaccination card + parental recall; JSI survey coverage = vaccination card + EPI registry + parental recall; Documented coverage = vaccination card + EPI registry; ELISA = Enzyme-linked immunosorbent assay; EPI = Expanded Programme on Immunization; mIU = million international units; mL = milliliters; NA = not available; Toddler = 12-23 months.
C. All infants enrolled in coverage survey including participants with no serum collection
p value for chi-squared comparison test with serosurvey results. Bold = p-value <0.005 and statistically significant. Note administrative and documented data not available for 2013 survey for infants. Serosurvey = measles antibody ≥ 120 mIU/mL via ELISA; Administrative coverage = EPI 2012 registry used for 2013 data and EPI 2013 registry used for 2016 data; Traditional survey coverage = vaccination card + parental recall; JSI survey coverage = vaccination card + EPI registry + parental recall; Documented coverage = vaccination card + EPI registry; ELISA = Enzyme-linked immunosorbent assay; EPI = Expanded Programme on Immunization; infants = 6-8 months; mIU = million international units; mL = milliliter; NA = not available.
D. Only infants enrolled in the serosurvey in whom serum antibody levels were measured
Woreda
Year Serosurvey Administrative coverage Traditional survey coverage JSI survey coverage Documented coverage
Measles antibody ≥ 120 mIU/mL
via ELISA
Estimate
p-value
Estimate
p-value
Estimate
p-value
Estimate
p-value
Assaieta 2013 10%
(8/81) NA NA
0% (1/81)
0.02 5%
(4/81) 0.25 NA NA
Arbegona 2013 10%
(9/87) NA NA
7% (6/87)
0.41 32%
(28/87) 0.0003 NA NA
Hintalo Wajerate
2013 4%
(3/78) NA NA
0% (0/78)
0.08 14%
(11/78) 0.03 NA NA
p-value for McNemar’s test comparison test with serosurvey results. Bold = p-value <0.005 and statistically significant. Kappa = 0-0.2 slight, 0.21-0.4 fair, 0.41-0.6 moderate, 0.61-0.8 substantial, 0.81-1.0 almost perfect. Note administrative and documented data not available for 2013 survey for infants. Serosurvey = measles antibody ≥ 120 mIU/mL via ELISA; Administrative coverage = EPI 2012 registry used for 2013 data and EPI 2013 registry used for 2016 data; Traditional survey coverage = vaccination card + parental recall; JSI survey coverage = vaccination card + EPI registry + parental recall; Documented coverage = card + EPI registry; ELISA = Enzyme-linked immunosorbent assay; EPI = Expanded Programme on Immunization; mIU = million international units; mL = milliliters.
Table 18: Difference between 2013 and 2016 reported coverage and protection against measles in toddlers for various survey measures A. All toddlers enrolled in coverage survey including participants with no serum collection
Serosurvey via ELISA 41.3% (301/729) 39.2% (302/770) 0.0210 -0.0287-0.0707 0.4072
Note: p-value for McNemar’s test comparison test with 2013 vs. 2016 results. Bold = p-value <0.005 and statistically significant. Kappa = 0-0.2 slight, 0.21-0.4 fair, 0.41-0.6 moderate, 0.61-0.8 substantial, 0.81-1.0 almost perfect. Serosurvey = measles antibody ≥ 120 mIU/ml; Traditional survey coverage = vaccination card + parental recall; JSI survey coverage = vaccination card + parental recall + registry; Documented coverage = vaccination card + registry; IU = international units; ml = milliliter; CI = confidence interval; ELISA = Enzyme-linked immunosorbent assay; EPI = Expanded Programme on Immunization; JSI = Jon Snow Inc.; NA = not available; toddler = 12-23 months.
Figure 15: Measles vaccinations estimates for 2013 and 2016 surveys in toddlers and infants A. All toddlers in coverage survey including participants with no serum collection i. Separated by woreda
ii. Separated by survey type
Note: No data available for 2013 documented. JSI = John Snow International Inc; Serosurvey = measles antibody ≥ 120 mIU/ml; Traditional survey = vaccination card + parental recall; JSI survey = vaccination card + parental recall + registry; Documented = vaccination card + registry; mIU = million international units; mL = milliliter; JSI = Jon Snow Inc.; NA = not available; Toddler = 12-23 months.
B. Only toddlers enrolled in the serosurvey in whom serum antibody levels were measured i. Separated by woreda
ii. Separated by survey type
Note: No data available for 2013 documented. JSI = John Snow International Inc; Serosurvey = measles antibody ≥ 120 mIU/ml; Traditional survey = vaccination card + parental recall; JSI survey = vaccination card + parental recall + registry; Documented = vaccination card + registry; mIU = million international units; mL = milliliter; JSI = Jon Snow Inc.; NA = not available; Toddler = 12-23 months.
C. All infants enrolled in coverage survey including participants with no serum collection i. Separated by woreda
ii. Separated by survey type
Note: No data available for 2013 documented. JSI = John Snow International Inc; Serosurvey = measles antibody ≥ 120 mIU/ml; Traditional survey = vaccination card + parental recall; JSI survey = vaccination card + parental recall + registry; Documented = vaccination card + registry; mIU = million international units; mL = milliliter; JSI = Jon Snow Inc.; NA = not available; Infant = 6-8 months.
D. Only infants enrolled in the serosurvey in whom serum antibody levels were measured i. Separated by woreda
ii. Separated by survey type
Note: No data available for 2013 documented. JSI = John Snow International Inc; Serosurvey = measles antibody ≥ 120 mIU/ml; Traditional survey = vaccination card + parental recall; JSI survey = vaccination card + parental recall + registry; Documented = vaccination card + registry; mIU = million international units; mL = milliliter; JSI = Jon Snow Inc.; NA = not available; Infant = 6-8 months.
Table 19: Response to measles vaccination by number of doses in toddlers and infants enrolled in the serosurvey in 2013 and 2016 surveys A. Toddlers
Woreda Number of
doses
Number of children GMT measles antibody (mIU/mL)
Percentage with measles antibody ≥ 120 mIU/mL
2013 2016 2013 2016 2013 2016
Assaieta
0 97 61 10.73 17.24 24%
(23/97) 36%
(22/61)
1 35 172 162.81 121.50 69%
(24/35) 62%
(106/172)
Total 132 239 - - 36%
(47/132) 55%
(131/239)
Arbegona
0 64 68 3.36 5.53 8%
(2/64) 18%
(12/68)
1 61 190 33.59 16.09 44%
(18/61) 23%
(43/190)
Total 125 258 26%
(32/125) 21%
(55/258)
Hintalo Wajerate
0 49 27 25.99 96.86 49%
(24/49) 44%
(12/27)
1 175 246 144.16 107.87 75%
(131/175) 42%
(104/246)
Total 224 273 - - 69%
(155/224) 42%
(116/273)
Number of doses = number of measles doses by card or EPI registry, 0 doses was based on card, EPI registry or parental recall; GMT = geometric mean titer; mIU = million international units; mL = milliliters.
B. Infants
Woreda Number of
doses Number of
children GMT measles
antibody (mIU/mL) Percentage with measles antibody ≥ 120 mIU/mL
Assaieta
0 65 11.51 11%
(7/65)
1 0 - -
Total 65 - 11%
(7/65)
Arbegona
0 44 10.62 7%
(3/44)
1 4 64.38 50% (2/4)
Total 48 - 10%
(5/48)
Hintalo Wajerate
0 61 5.74 7%
(3/44)
1 0 - 50% (2/4)
Total 61 - 10%
(5/48)
Number of doses = number of measles doses by card or EPI registry, 0 doses was based on card, EPI registry or parental recall; GMT = geometric mean titer; mIU = million international units; mL = milliliters.
Figure 16: Percentage of toddlers and infants in 2013 and 2016 surveys with measles antibody ≥ 120 mIU/mL depending on number of measles doses A. Toddlers
B. Infants
Table 20: Sensitivity, specificity, PPV, NPV and accuracy of measles antibodies (≥ 120 mIU/mL vs. ≥ 200 mIU/mL) measured via serum ELISA (standard) vs. DBS elute ELISA in toddlers in the 2013 survey A. Toddlers, measles antibody ≥ 120 mIU/mL
DBS = dried blood spot or strip; mIU = million international units; mL = milliliter; PPV = positive predictive value; NPV = negative predictive value; toddlers = 12-23 months.
Figure 17: Sensitivity, specificity, PPV, NPV and accuracy of measles antibodies in serum ELISA (standard) vs. DBS elude ELISA in toddlers in the 2013 survey A. Toddlers, measles antibody ≥ 120 mIU/mL via ELISA
B. Toddlers, measles antibody ≥ 200 mIU/mL via ELISA
Table 21: Comparison of using serum ELISA (standard) vs. DBS elute ELISA to measure measles antibodies (≥ 120 mIU/mL) in toddlers in the 2016 survey A. Sensitivity, specificity, PPV, NPV and accuracy of serum measles antibodies (120 mIU/mL) measured via serum ELISA (standard) vs DBS elute ELISA in toddlers in the 2016 survey
B. Statistical analysis of using serum ELISA (standard) vs. DBS elute ELISA to measure measles antibodies (protected ≥ 120 mIU/mL) in toddlers in the 2016 survey
Woreda Protected via serum
ELISA Protected via DBS elute
ELISA Statistic p-value Kappa 95% CI
Assaieta 55.4%
(62/112) 68.8%
(77/112) 6.0811 0.0201 0.3116 0.1396, 0.4837
Arbegona 20.7%
(23/111) 59%
(66/111) 30.3115 <0.0001 0.0105 -0.1222, 0.1433
Hintalo Wajerate 43%
(48/112) 65%
(73/112) 17.8571 <0.0001 0.401 0.2512, 0.5507
All woredas 39.7%
(133/335) 64.5%
(216/335) 51.797 <0.0001 0.2507 0.1614, 0.3399
p-value for McNemar’s test comparison test with serosurvey results. Bold = p-value <0.005 and statistically significant. Kappa = 0-0.2 slight, 0.21-0.4 fair, 0.41-0.6 moderate, 0.61-0.8 substantial, 0.81-1.0 almost perfect. DBS = dried blood spot or strip; mIU = million international units; mL = milliliter; PPV = positive predictive value; NPV = negative predictive value; toddlers = 12-23 months
Table 22: Comparison of using serum PRN (standard) vs. serum ELISA to measure measles antibodies (≥ 120 mIU/mL) in toddlers in the 2016 survey
A. Sensitivity, specificity, PPV, NPV and accuracy of serum measles antibodies measured via PRN (standard) vs. ELISA in toddlers in the 2016 survey
B. Statistical analysis of using serum PRN (standard) vs. serum ELISA to measure measles antibodies (protected = ≥ 120 mIU/mL) in toddlers in the 2016 survey
Woreda Protected via ELISA Protected via PRN Statistic p-value Kappa 95% CI
Assaieta 55%
(61/111) 65%
(72/111) 7.1176 0.0127 0.6844 0.5494, 0.8194
Arbegona 20%
(22/110) 51%
(56/110) 34 <0.0001 0.3885 0.2533, 0.5237
Hintalo Wajerate
43% (48/111)
91% (101/111)
49.2807 <0.0001 0.0754 -0.0143, 0.1651
All woredas 39.5%
(131/332) 69%
(229/332) 88.9259 <0.0001 0.3976 0.319, 0.4762
p-value for McNemar’s test comparison test with serosurvey results. Bold = p-value <0.005 and statistically significant. Kappa = 0-0.2 slight, 0.21-0.4 fair, 0.41-0.6 moderate, 0.61-0.8 substantial, 0.81-1.0 almost perfect. DBS = dried blood spot or strip; mIU = million international units; mL = milliliter; PPV = positive predictive value; NPV = negative predictive value; toddlers = 12-23 months.
C. Correlation of serum measles antibody (mIU/mL) PRN vs. ELISA in toddlers in 2016 survey
Woreda Pearson R Pearson p-value Spearman R Spearman p-value
Assaieta 0.47843 <0.0001 0.80831 <0.0001
Arbegona 0.64537 <0.0001 0.55928 <0.0001
Hintalo Wajerate 0.66173 <0.0001 0.57818 <0.0001
All woredas 0.47725 <0.0001 0.70301 <0.0001
D. Correlation of log 10-transformed serum measles antibody (mIU/mL) PRN vs. ELISA in toddlers in 2016 survey
Woreda Pearson R Pearson p-value Spearman R Spearman p-value
Assaieta 0.77049 <0.0001 0.80831 <0.0001
Arbegona 0.58947 <0.0001 0.55928 <0.0001
Hintalo Wajerate 0.66173 <0.0001 0.57818 <0.0001
All woredas 0.68362 <0.0001 0.57818 <0.0001
Note: Pearson and Spearman correlation coefficients for the correlation of measles antibodies (in mIU/ml) and log10-transformed measles antibodies (in mIU/ml) according to PRN vs. ELISA. If a raw titer value is < 1.00 an imputed value of 0.5 was used as this was the minimum value the analytical system would recognize.
Figure 18: Scatter plots of serum measles antibody measured via PRN vs. ELISA A. Scatter plot of measles antibody measured via PRN vs. ELISA i. Assaieta
ii. Arbegona
iii. Hintalo Wajerate
iv. All woredas
Note: Picture on the right the same as the picture on the left but zoomed in to capture most of the data excluding outliers.
B. Scatter plot of log-10 transformation of measles antibody measured via PRN vs. ELISA i. Assaieta
ii. Arbegona
iii. Hintalo Wajerate
iv. All woredas
Table 23: Interpretations of measles antibody levels measured via ELISA and PRN by two different technicians in a subset of 39 toddlers from Hintalo Wajerate in the 2016 survey A. Proportions of toddlers in the subset whose measles antibody levels surpass various thresholds by ELISA and PRN by two different technicians
Technician ELISA ≥ 40 mIU/mL
ELISA ≥ 80 mIU/mL
ELISA ≥ 120 mIU/mL
PRN ≥ 40 mIU/mL
PRN ≥ 80 mIU/mL
PRN ≥ 120 mIU/mL
Technician 1 87% 59% 38% 97% 97% 87%
Technician 2 - - - 97% 77% 64%
B. Sensitivity, specificity, PPV, and NPV of ELISA when compared to PRN (standard) using various thresholds for measles protection by two different technicians
C. Measles antibody PRN interpretation by two technicians in subset of 13 toddlers who were deemed seroprotected by one technician and not seroprotected by the other technician
D. Percent of toddlers 12-23 months old covered with at least one dose of measles vaccine and corresponding percent
exceeding thresholds of serologic measles protection in 3 Ethiopian woredas, 2013 and 2016
Table 24: Number of days until received measles vaccine and number of days between receiving measles vaccine and serum sample collection in toddlers from the 2016 survey based on validity of card and record status A. Number of days until received measles vaccine
Status Number of toddlers Mean (days) Median (days) Minimum (days) Maximum (days)
All toddlers* 417 289 281 130 645
Valid card** 208 298 288 267 455
Invalid card 78 251 256 216 266
Valid record*** 92 323 299 267 645
Invalid record 39 237 249 130 266
B. Number of days between receiving measles vaccine and serum sample collection
Status Number Mean (days) Median (days) Minimum (days) Maximum (days)
All toddlers* 387 228 209 3 480
Valid card** 188 207 193 3 441
Invalid card 74 274 247 120 479
Valid record*** 87 211 197 11 445
Invalid record 38 279 270 121 480
C. Seroprotection of toddlers in which time from measles vaccination and serum sample collection was over 365 days
Status Serum measles antibody ≥ 120 mIU/mL Serum measles antibody < 120 mIU/mL Total
Valid card 11 9 20
Invalid card 55 45 100
Valid record 7 3 10
Invalid record 5 4 9
Note: Data includes only toddlers who had both vaccination cards and EPI registry data. *Omitting 5 toddlers with erroneous data. **Omitting 1 toddler with erroneous data. ***Omitting 4 toddlers with erroneous data. Valid card = vaccination card documented received measles vaccine and measles vaccine given at appropriate time (e.g. on day of life 267 or later and before the survey took place); Invalid card = vaccination card document received measles vaccine but received measles vaccine at inappropriate time; Valid record = EPI registry documented that received measles vaccine and measles vaccine given at appropriate time (e.g. on day of life 267 or later and before the survey took place); Invalid record = EPI registry document received measles vaccine but received measles vaccine at inappropriate time; EPI = Expanded Programme on Immunization; mIU = million international units; mL = milliliters.
Figure 19: Box plots and distribution of number of days until received measles vaccine and number of days between receiving measles vaccine and serum sample collection in toddlers from the 2016 survey based on validity of card and record status A. Number of days until received measles vaccine i. Box plot of all toddlers
ii. Box plot based on validity of card and record status
iii. Distribution based on validity of card and record status
B. Number of days between receiving measles vaccine and serum sample collection i. Box plot of all toddlers
ii. Box plot based on validity of card and record status
iii. Distribution based on validity of card and record status
Figure 20: Scatter plot of time to receive measles vaccination and serum sample measles antibody levels measured via ELISA A. All toddlers i. All data ii. Zoomed in and excluding outliers
B. Valid card* C. Invalid card
D. Valid record** E. Invalid record
Note: Data includes only toddlers who had both vaccination cards and EPI registry data. *Omitting 1 toddler with erroneous data. **Omitting 4 toddlers with erroneous data. ELISA Valid card = vaccination card documented received measles vaccine and measles vaccine given at appropriate time (e.g. on day of life 267 or later and before the survey took place); Invalid card = vaccination card document received measles vaccine but received measles vaccine at inappropriate time; Valid record = EPI registry documented that received measles vaccine and measles vaccine given at appropriate time (e.g. on day of life 267 or later and before the survey took place); Invalid record = EPI registry document received measles vaccine but received measles vaccine at inappropriate time; EPI = Expanded Programme on Immunization; ELISA = Enzyme-linked immunosorbent assay.
Table 25: Summary of participants enrolled in the coverage survey, those with a serum sample collected and seroprotection for tetanus, Hib and measles A. Toddlers in 2013 and 2016 surveys
Woreda
Coverage survey Serum sample collected
Tetanus seroprotection ≥ 0.15 IU/mL
Tetanus seroprotection ≥ 0.05 IU/mL
Measles seroprotection ≥120 mIU/mL
2013 2016 2013 2016 2013 2016 2013 2016 2013 2016
Assaieta 284 279 215 239 114/215 (53%)
174/239 (73%)
127/213* (59.6%)
189/239 (79.1%)
76/215 (35%)
131/239 (55%)
Arbegona 297 294 251 258 151/251 (60%)
193/258 (75%)
183/251 (72.9%)
216/258 (83.7%)
53/251 (21%)
55/258 (21%)
Hintalo Wajerate 296 292 263 273 244/263 (93%)
264/273 (97%)
248/263 (94.3%)
271/273 (99.3%)
172/263 (65%)
116/273 (42%)
All woredas 877 865 729 770 509/729 (70%
631/770 (82%)
558/727* (76.8%)
676/770 (87.8%)
301/729 (41%)
302/770 (39%)
B. Infants in 2013 survey
Woreda Coverage survey enrollment
Serum sample collected
Hib seroprotection ≥ 1.0 mcg/mL
Measles seroprotection ≥ 120 mIU/mL
Assaieta 106 81 25/81 (31%)
8/81 (10%)
Arbegona 98 87 36/87 (41%)
9/87 (10%)
Hintalo Wajerate 100 78 53/78 (68%)
3/78 (4%)
All woredas 304 246 114/246 (46%)
20/246 (8%)
Note: Infants were only included in 2013 study. Infants were not included in 2016 survey. Hib = Haemophilus influenzae type b; Hib seroprotection = Hib anti-PRP antibody ≥ 1.0 mcg/mL; IU = international units; mcg = micrograms; Measles seroprotection = measles antibody ≥ 120 mIU/mL; mIU = million international units; mL = milliliter; PRP = polyribosylribitol phosphate; Tetanus seroprotection = tetanus antitoxin antibody ≥ 0.15 IU/mL;
Table 26: Number of toddlers who are protected vs. not protected in 2016 survey A. Tetanus antitoxin antibody protection threshold ≥ 0.15 IU/mL in 2013 and 2016 surveys
Woreda 2013 2016
Not protected Protected Total Not protected Protected Total
Note: 28 toddlers missing from the dataset. Not protected = tetanus antitoxin antibody < 0.05 IU/mL; Protected = tetanus antitoxin antibody ≥ 0.05 IU/mL; IU = international units; mL = milliliters. C. Measles antibody protection threshold ≥ 120 mIU/mL in 2016 survey
Woreda Not protected Protected Total
Assaieta 108 (45.2%) 131 (54.8%) 239
Arbegona 203 (78.7%) 55 (21.3%) 258
Hintalo Wajerate 157 (57.5%) 116 (42.5%) 273
All woredas 468 (60.8%) 302 (38.2%) 770
Not protected = measles antibody < 120 IU/mL; Protected = measles antibody ≥ 120 IU/mL; IU = international units; mL = milliliters.
Figure 21: Percentage of children with serologic protection for tetanus, Hib and measles separated by toddlers and infants, woreda and vaccine A. Toddlers separated by woreda for 2013 and 2016 surveys
B. Toddlers separated by vaccine for 2013 and 2016 surveys
Note: 2013 data includes infants and toddlers. 2016 includes only toddlers. Serologic protection = serum antibodies demonstrating protection from (tetanus antibody ≥ 0.15 IU/mL; measles antibody ≥ 120 mIU/mL); IU = international units; mIU = million international units; mL = milliliters; toddler = 12-23 months.
Note: 2013 data includes infants and toddlers. 2016 includes only toddlers. Serologic protection = serum antibodies demonstrating protection from (Hib anti-PRP antibody ≥ 1.0 mcg/mL; measles antibody ≥ 120 mIU/mL); Hib = Haemophilus influenzae type b; mcg = microgram; mIU = million international units; mL = milliliters; PRP = purified polyribosylribitol phosphate; infant = 6-8 months.
31
41
68
10 104
0
10
20
30
40
50
60
70
80
90
100
Assaieta Arbegona Hintalo Wajerate
Perc
en
tag
e o
f ch
ild
ren
wit
h
sero
log
ic p
rote
cti
on
Hib Measles
test
31
10
41
10
68
4
0
10
20
30
40
50
60
70
80
90
100
Hib Measles
Perc
en
tag
e o
f ch
ild
ren
wit
h
sero
log
ic p
rote
cti
on
Assaieta Arbegona Hintalo Wajeratefont test
12. SUPPLEMENTAL MATERIALS
Table S1: Comparison of reported tetanus coverage and protection (tetanus antitoxin antibody ≥ 0.15 IU/mL) in toddlers in whom serum antibodies were measured in 2016 survey A. Traditional survey coverage vs. serologic protection i. Assaieta
Not protected Protected Total
Not covered 59 78 137
Covered 6 96 102
Total 65 174 239
ii. Arbegona
Not protected Protected Total
Not covered 45 112 157
Covered 20 81 101
Total 65 193 258
iii. Hintalo Wajerate
Not protected Protected Total
Not covered 2 98 100
Covered 7 166 173
Total 9 264 273
B. JSI survey coverage vs. serologic protection i. Assaieta
Not protected Protected Total
Not covered 58 71 129
Covered 7 103 110
Total 65 174 239
ii. Arbegona
Not protected Protected Total
Not covered 32 79 111
Covered 33 114 147
Total 65 193 258
iii. Hintalo Wajerate
Not protected Protected Total
Not covered 2 32 34
Covered 7 232 239
Total 9 264 273
C. Documented coverage vs. serologic protection
i. Assaieta
Not protected Protected Total
Not covered 62 109 171
Covered 3 65 68
Total 65 174 239
ii. Arbegona
Not protected Protected Total
Not covered 50 134 184
Covered 15 59 74
Total 65 193 258
iii. Hintalo Wajerate
Not protected Protected Total
Not covered 6 86 92
Covered 3 178 181
Total 9 264 273
Note: Covered = adequate reported documentation of vaccination by the survey’s parameters. Protected = serologic tetanus antitoxin antibody ≥ 0.15 IU/mL. Traditional survey coverage = vaccination care or parental recall; JSI survey coverage = vaccination card or parental recall or EPI registry; Documented coverage = vaccination card or EPI registry. EPI = Expanded Programme on Immunization; IU = international units; mL = milliliters.
Figure S1: Agreement of reported tetanus coverage and protection (tetanus antitoxin antibody ≥ 0.15 IU/mL) in toddlers in whom serum antibodies were measured in 2016 survey A. Traditional survey coverage vs. serologic protection i. Assaieta
ii. Arbegona
iii. Hintalo Wajerate
B. JSI survey coverage vs. serologic protection i. Assaieta
ii. Arbegona
iii. Hintalo Wajerate
C. Documented coverage vs. serologic protection i. Assaieta
ii. Arbegona
iii. Hintalo Wajerate
Table S2: Comparison of reported tetanus coverage and protection (tetanus antitoxin antibody ≥ 0.05 IU/mL) in toddlers in whom serum antibodies were measured in 2016 survey A. Traditional survey coverage vs. serologic protection i. Assaieta
Not protected Protected Total
Not covered 47 90 137
Covered 3 99 102
Total 50 189 239
ii. Arbegona
Not protected Protected Total
Not covered 29 128 157
Covered 13 88 101
Total 42 216 258
iii. Hintalo Wajerate
Not protected Protected Total
Not covered 0 100 100
Covered 2 171 173
Total 2 271 273
B. JSI survey coverage vs. serologic protection i. Assaieta
Not protected Protected Total
Not covered 46 83 129
Covered 4 106 110
Total 50 189 239
ii. Arbegona
Not protected Protected Total
Not covered 21 90 111
Covered 21 126 147
Total 42 216 258
iii. Hintalo Wajerate
Not protected Protected Total
Not covered 0 34 34
Covered 2 237 239
Total 2 271 273
C. Documented coverage vs. serologic protection i. Assaieta
Not protected Protected Total
Not covered 49 122 171
Covered 1 67 68
Total 50 189 239
ii. Arbegona
Not protected Protected Total
Not covered 34 150 184
Covered 8 66 74
Total 42 216 258
iii. Hintalo Wajerate
Not protected Protected Total
Not covered 1 91 92
Covered 1 180 181
Total 2 271 273 Note: Covered = adequate reported documentation of vaccination by the survey’s parameters. Protected = serologic tetanus antitoxin antibody ≥ 0.05 IU/mL. Traditional survey coverage = vaccination care or parental recall; JSI survey coverage = vaccination card or parental recall or EPI registry; Documented coverage = vaccination card or EPI registry. EPI = Expanded Programme on Immunization; IU = international units; mL = milliliters.
Figure S2: Agreement of reported tetanus coverage and protection (tetanus antitoxin antibody ≥ 0.05 IU/mL) in toddlers in whom serum antibodies were measured in 2016 survey A. Traditional survey coverage vs. serologic protection i. Assaieta
ii. Arbegona
iii. Hintalo Wajerate
B. JSI survey coverage vs. serologic protection i. Assaieta
ii. Arbegona
iii. Hintalo Wajerate
C. Documented coverage vs. serologic protection i. Assaieta
ii. Arbegona
iii. Hintalo Wajerate
Table S3: Comparison of reported measles coverage and protection (measles antibody ≥ 120 mIU/mL) in toddlers in whom serum antibodies were measured in 2016 survey A. Traditional survey coverage vs. serologic protection i. Assaieta
Not protected Protected Total
Not covered 48 32 80
Covered 60 99 159
Total 108 131 239
ii. Arbegona
Not protected Protected Total
Not covered 100 21 121
Covered 103 34 137
Total 203 55 258
iii. Hintalo Wajerate
Not protected Protected Total
Not covered 59 51 110
Covered 98 65 163
Total 157 116 273
B. JSI survey coverage vs. serologic protection i. Assaieta
Not protected Protected Total
Not covered 47 28 75
Covered 61 103 164
Total 108 131 239
ii. Arbegona
Not protected Protected Total
Not covered 71 18 89
Covered 132 37 169
Total 203 55 258
iii. Hintalo Wajerate
Not protected Protected Total
Not covered 30 27 57
Covered 127 89 216
Total 157 116 273
C. Documented coverage vs. serologic protection i. Assaieta
Not protected Protected Total
Not covered 93 76 169
Covered 15 55 70
Total 108 131 239
ii. Arbegona
Not protected Protected Total
Not covered 155 46 201
Covered 48 9 57
Total 203 55 258
iii. Hintalo Wajerate
Not protected Protected Total
Not covered 65 58 123
Covered 92 58 150
Total 157 116 273 Note: Covered = adequate reported documentation of vaccination by the survey’s parameters. Protected = serologic measles antibody ≥ 120 mIU/mL. Traditional survey coverage = vaccination care or parental recall; JSI survey coverage = vaccination card or parental recall or EPI registry; Documented coverage = vaccination card or EPI registry. EPI = Expanded Programme on Immunization; IU = international units; mL = milliliters.
Figure S3: Agreement of reported measles coverage and protection (measles antibody ≥ 120 mIU/mL) in toddlers in whom serum antibodies were measured in 2016 survey A. Traditional survey coverage vs. serologic protection i. Assaieta
ii. Arbegona
iii. Hintalo Wajerate
B. JSI survey coverage vs. serologic protection i. Assaieta
ii. Arbegona
iii. Hintalo Wajerate
C. Documented coverage vs. serologic protection i. Assaieta
ii. Arbegona
iii. Hintalo Wajerate
Table S4: Data used for interpretations of measles antibody levels measured via ELISA and PRN by two different technicians in a subset of 39 toddlers from Hintalo Wajerate in the 2016 survey A. Raw data for subset of 39 toddlers from Hintalo Wajerate in 2016 survey
SSID ELISA (mIU/ml)
Technician 1 PRN (mIU/ml)
Technician 2 PRN (mIU/ml)
3001 128.96 267 235
3004 124.87 184 104
3006 68.69 166 74
3009 25.95 123 73
3010 155.67 179 294
3022 52.07 125 71
3030 79.60 225 83
3039 41.32 118 44
3042 466.83 1,265 978
3046 48.89 173 63
3048 71.40 205 145
3063 0.98 7 7
3065 326.84 889 389
3073 378.26 2,236 737
3081 125.09 509 110
3086 99.27 451 160
3099 12,076.12 8,444 13,071
3120 148.41 235 181
3122 1,804.89 10,627 5,925
3125 178.18 1,014 985
3130 95.73 985 395
3136 87.22 517 332
3139 55.09 211 136
3154 88.33 525 332
3157 9.07 166 69
3169 88.07 240 401
3179 91.28 207 161
3187 104.66 199 228
3197 143.94 235 178
3208 54.91 179 101
3210 31.97 118 138
3212 45.29 109 158
3215 81.28 149 213
3220 160.13 2,657 341
3231 447.65 3,024 569
3236 124.79 147 80
3246 61.26 176 112
3251 21.89 108 54
3274 65.56 155 235
mIU = million international units; mL = milliliters; ELISA = Enzyme-linked immunosorbent assay; PRN = Plaque reduction neutralizing; PPV = positive predictive value; NPV = negative predictive value.
B. Summary of proportion with seroprotection at various thresholds, sensitivity, specificity, PPV and NPV by technician