33 Ethiopia’s Industrialization Drive under the Growth and Transformation Plan ∗ The policy landscape of Ethiopia is entering a new phase. Based on its developmental experience and policy learning in the last several years, which are themselves remarkable and worth careful study and documentation, the Ethiopian government has launched a new five-year plan, the Growth and Transformation Plan (GTP) 2010/11-2014/15, a lucid and bold document approved by the parliament in November 2010. As the highest national policy framework, the GTP will govern Ethiopia’s developmental policies, budgets and government organizations, as well as actions of development partners and foreign investors, in the coming five years. Unlike similar plan documents in many other developing countries where much is said but little is implemented, the Ethiopian GTP is unlikely to remain merely on paper. The top leader’s resolve and the government’s readiness to carry out this plan and take the country to the next level of development are clearly visible. It is highly probable that the performance of every ministry, agency or institution in Ethiopia will be judged by its contribution to the realization of the GTP. This paper discusses and evaluates the design of the GTP as it prepares to be implemented in the first half of 2011. While the GTP covers a broad ground from agriculture and rural development to social issues and governance, our main focus is on its industrial sector targets and measures from the perspective of international comparison of policy formulation methods. The National Graduate Institute for Policy Studies (GRIPS) and the Japan International Cooperation Agency (JICA) have conducted quarterly industrial policy dialogue with the Ethiopian government since June 2009 with eight official sessions in total. In the process, a large number of policy practices, gathered mostly from East Asia’s high performing economies, ∗ This chapter is prepared for the Eighth High Level Forum of the Ethiopia-Japan Industrial Policy Dialogue held in Addis Ababa on May 17, 2011. More discussion of the materials covered in section 3-1 (Ethiopia’s past policy orientation and experience) is found in chapter 5 below. Chapter 3
Transcript
33
Ethiopia’s Industrialization Drive under the Growth and Transformation Plan∗
The policy landscape of Ethiopia is entering a new phase. Based on its developmental experience and policy learning in the last several years, which are themselves remarkable and worth careful study and documentation, the Ethiopian government has launched a new five-year plan, the Growth and Transformation Plan (GTP) 2010/11-2014/15, a lucid and bold document approved by the parliament in November 2010. As the highest national policy framework, the GTP will govern Ethiopia’s developmental policies, budgets and government organizations, as well as actions of development partners and foreign investors, in the coming five years. Unlike similar plan documents in many other developing countries where much is said but little is implemented, the Ethiopian GTP is unlikely to remain merely on paper. The top leader’s resolve and the government’s readiness to carry out this plan and take the country to the next level of development are clearly visible. It is highly probable that the performance of every ministry, agency or institution in Ethiopia will be judged by its contribution to the realization of the GTP. This paper discusses and evaluates the design of the GTP as it prepares to be implemented in the first half of 2011. While the GTP covers a broad ground from agriculture and rural development to social issues and governance, our main focus is on its industrial sector targets and measures from the perspective of international comparison of policy formulation methods. The National Graduate Institute for Policy Studies (GRIPS) and the Japan International Cooperation Agency (JICA) have conducted quarterly industrial policy dialogue with the Ethiopian government since June 2009 with eight official sessions in total. In the process, a large number of policy practices, gathered mostly from East Asia’s high performing economies,
∗ This chapter is prepared for the Eighth High Level Forum of the Ethiopia-Japan Industrial Policy
Dialogue held in Addis Ababa on May 17, 2011. More discussion of the materials covered in section 3-1 (Ethiopia’s past policy orientation and experience) is found in chapter 5 below.
Chapter 3
CHAPTER 3
34
were reported and compared. We will study the features of the GTP, including its strengths and remaining concerns, mainly against the East Asian standards in industrial policy making.1
3-1. Background 3-1-1. Brief history Recognizing that predatory states and rent seeking culture have been the major obstacles to African development, the Ethiopian government is determined to build a developmental state—a state that promotes skills, technology and productive investment for all citizens, farmers and firms rather than patronage and personal gains for a few—and has taken a number of steps for its realization ever since the present government assumed power in 1991. The first several years in the 1990s under the interim government were spent in solidifying the new regime based on a multi-party political system and ethnicity-based federalism, re-establishing a market-oriented economic mechanism and global linkage, and drafting a new constitution. During this early period, the concept of Agricultural Development Led Industrialization (ADLI) was introduced as the key policy thrust for national development in the first half of the 1990s. After overcoming a series of difficulties arising from internal politics, external conflicts, droughts and famines, Ethiopia by the early 2000s became ready to earnestly undertake economic development strategies guided by ADLI principles. The two national development plans of The Sustainable Development and Poverty Reduction Program (SDPRP) 2002/03-2004/05 and A Plan for Accelerated and Sustained Development to End Poverty (PASDEP) 2005/06-2009/10 were drafted and executed. From around 2003 to present, Ethiopia’s overall growth performance has been good.
1 The main comparator countries are Singapore, Taiwan, Korea, Malaysia and Thailand. The GDF
and the Vietnam Development Forum (VDF) (a Vietnam-Japan joint research project supported by the GDF) organized policy study missions to these countries, as well as to Botswana, Burkina Faso, Tanzania and Uganda, in 2009-2011 to gather materials and extract lessons for Ethiopia. Moreover, policy experiences of Japan, China, India, Philippines, Vietnam, Mozambique, Zambia and others are used as additional references.
Ethiopia’s Industrialization Drive under the Growth and Transformation Plan
35
Real GDP growth has been 11% per annum on average, and poverty incidents declined visibly.2 In policy making, the government has learned and adopted various industrial policy methods and tools—such as the monthly Export Steering Committee (copied from the previous Korean model), benchmarking, business process re-engineering (BPR), scaling up of pilot projects and, most recently, kaizen (factory improvement) from Japan—through self-study as well as cooperation with development partners. Also in the mid 2000s, the political concept of Democratic Developmentalism (DD) was formulated to pursue democratic and market-oriented development under strong state guidance and globalization pressure. The GTP is the successor to these evolving concepts, documents and plans. It incorporates the ideas of ADLI and DD, which themselves have evolved over time, and the positive and negative experiences of past development plans while adding new issues and sectors to work with. Setting ambitious targets and calling for nationwide mobilization, the GTP takes up the challenge of bringing national development to a higher and more difficult stage. The vision and basic policy orientation for the next five years are already set. The remaining task for the GTP is designing details and implementation. 3-1-2. Ethiopian policy orientation By going through cumulative policy learning in the last two decades, as described above, Ethiopia has established a distinct policy style which is unique among African countries (but perhaps not so unique among East Asian economies). The four salient features of Ethiopian development policy can be summarized as follows. First, there is a very strong policy ownership. Despite the fact that Ethiopia is a poor country heavily dependent on official development assistance (ODA) and having only a small traditional export base,3 the Ethiopian government has a clear development strategy which is home-made. Unlike many other “donors’ darling”
2 Poverty headcount below the national poverty line is on a long-term declining trend from 45.5% in
1995 to 44.2% in 1999, 38.9% in 2004, and 29.2% in 2010. 3 In 2009, Ethiopia’s receipt of ODA (net disbursement) was equivalent to 12.4% of GDP and 60.9%
of gross capital formation (World Bank Development Indicators). Merchandise export, dominated by food (75%) and agricultural raw materials (14%), was only USD1.5 billion or 5% of GDP in 2008 (national data).
CHAPTER 3
36
countries, Ethiopia does not allow bilateral donors or international organizations to impose “international best practices” from the West or speak in one voice to recommend political or economic reforms. The World Trade Organization (WTO) accession is being sought, but only on the condition that its membership would leave sufficient policy scope for Ethiopia to catch up rapidly as a latecomer country. ODA and FDI are welcomed only when they align closely with the national development plan. Donors and investors interested in industrial or infrastructure projects are requested to transfer technology, provide training, and procure as many local inputs as possible. Division of labor among donors is assigned by the Ethiopian government, not by donors themselves. From the East Asian perspective, these strong attitudes toward development and international cooperation are highly desirable for a latecomer country without which industrial catch-up can hardly be initiated. However, strong policy ownership is necessary but not sufficient for robust development. It will not produce results unless the national development plan, with which every developmental action is asked to align, is of good quality—and this is the issue that we are about to address. It may be added that Ethiopia’s strong policy ownership depends heavily on the governing style and intellectual ability of its top leader, Prime Minister Meles Zenawi. Maintaining strong policy ownership into the future will require institutionalization of good policy practices which make them less dependent on the quality of a top leader. Second, a strong state guides the private sector. While the Industrial Development Strategy (IDS) of 2002 clearly states that it is private firms, not state-owned enterprises, that must be the engine of production and investment, it also contends that state must use its authority to guide private firms away from rent seeking and toward investment, technology and global competition. The Ethiopian government does not believe that free market, left to its own, will spontaneously raise productivity or learn technology. It believes that state must guide and supervise the market and that, if the state’s capability is initially weak, it must be enhanced to fulfill this role. According to this view, the state should not form an unconditional alliance with “capitalists” who may or may not behave productively. The Ethiopian government wants to maintain arms’ length relations with both local and foreign enterprises by preparing both carrots and sticks for different behaviors. The bent for strong state also explains why Ethiopia shuns Washington Consensus
Ethiopia’s Industrialization Drive under the Growth and Transformation Plan
37
policy advice and shows great interest in East Asian development experience. Third, internalization of skills and technology is top priority. This is of course highly welcome and appropriate for a country determined to catch up economically from a very low level. Ethiopian leaders admit that natural resource-based growth is unsustainable and that human skills and technology to upgrade agriculture and industry must be the central concern. The requirement of training, technology transfer and maximum local procurement to foreign contractors of industrial and infrastructure projects is similarly motivated. Keen interest in building engineering universities in large number, expansion of the technical and vocational education and training (TVET) system, and institutionalization of kaizen is also a manifestation of the same orientation. This policy focus seems to come partly from the proactive attitude of the current administration and partly from the fact that Ethiopia is poorly endowed with natural resources relative to its large population. However, the strong desire to enhance industrial human resource is not evident in the industrial section of the GTP (section 3-2-2). Fourth, policy scope expands as policy learning proceeds. Several years ago when Ethiopia began to seriously implement the ADLI strategy under SDPRP 2002/03-2004/05 and subsequently under PASDEP 2005/06-2009/10, the government had little practical knowledge or experience of industrial policy and had to start with a simple strategy of giving generous incentives and disproportionate policy attention to a few selected export-oriented sectors including leather and leather products, textile and garment, and agro products (floriculture was later added as the private sector discovered its potential). Donor support in the industrial sector was also directed toward these sectors. At the same time, Ethiopia learned East Asian policy methods by studying literature, sending young officials to Korea and conducting policy dialogue with Japan, among other means. By the time the current five-year plan was drafted, in 2009 and 2010, the government felt that it had learned enough in the process of executing SDPRP and PASDEP and that it was ready to move on to the next phase of industrial policy making. New policy elements were recently added such as the promotion of import-substituting industries in addition to export-oriented ones, institutionalization of kaizen as a productivity tool in addition to benchmarking, proposed enhancement of micro and
CHAPTER 3
38
small enterprise (MSE) policy, expansion of the TVET system, creation of new industrial zones, and general speeding up of industrialization. 3-2. Features of the GTP 3-2-1. General features The Ministry of Finance and Economic Development (MOFED) has the overall responsibility for preparing, implementing and monitoring the GTP as with the previous two national development plans. The official drafting process took about 15 months and was managed by the Macro Economic Team of MOFED in the following sequence:
Sep.-Oct. 2009 Generic Guideline was circulated to federal implementing agencies Nov.-Dec. 2009 Briefings on Generic Guideline to senor officials and directors Feb.-May 2010 Preliminary draft plans of key sectors were MOFED submitted to Jun. 2010 The consolidated draft was reviewed by the Macro Economic Team Jul. 2010 The first draft was prepared; English version also prepared Aug.-Sep. 2010 Nationwide consultation forums were organized Oct. 2010 Consistency check and incorporation of comments and feedbacks Nov. 2010 Cabinet review and approval by the House of People’s Representatives
Although the fundamental policy orientation remained constant during the drafting process, the final version of the GTP is significantly different from the first draft as many additions, changes and editing were made throughout the document including in the industry section.4 It is not evident to the present author how much of these
4 In the industry section (section 5.2 of GTP), two “strategic directions” (industrial zones and public
enterprise policy), which were previously only mentioned in the text, were upgraded to supplement
Ethiopia’s Industrialization Drive under the Growth and Transformation Plan
39
revisions were initiated by MOFED and how much was due to top leaders, line ministries or nationwide consultations. The first paragraphs of the GTP states that its drafting “has benefited from the many consultative meetings held at the Federal, Regional and local levels with government bodies, private sector organizations, higher education institutions, professional, women’s and youth associations, religious and civil society organizations, opposition political parties and development partners” (English p.1). While such consultative processes are now common among developing countries, the one adopted in Ethiopia for drafting the GTP appears to have been highly systematic even by the standards of today’s national plan making (however, see section 3-4 below for the lack of stakeholder involvement). The system of overall visions, objectives and strategic pillars in the GTP is summarized in Table 3-1.
Table 3-1. GTP’s Visions, Objectives and Strategic Pillars Ethiopia’s vision to guide GTP
“To become a country where democratic rule, good-governance and social justice reign, upon the involvement and free will of its peoples, and once extricating itself from poverty to reach the level of a middle-income economy as of 2020-2023.”
Vision on economic sector
“Building an economy which has a modern and productive agricultural sector with enhanced technology and an industrial sector that plays a leading role in the economy, sustaining economic development and securing social justice and increasing per capita income of the citizens so as to reach the level of those in middle-income countries.”
Objectives 1. Maintain at least 11% growth and attain MDGs. 2. Education and health services for achieving social sector MDGs. 3. Nation building through a stable democratic and developmental state 4. Stable macroeconomic framework
Strategic pillars 1. Rapid and equitable economic growth 2. Maintaining agriculture as major source of economic growth 3. Creating conditions for the industry to play key role in the economy 4. Infrastructure development 5. Social development 6. Capacity building and good governance 7. Gender and youth
Source: Summarized from chapter 2 of the GTP.
the original two strategic directions (MSE development and medium and large industry development). “Major targets” for these strategic directions were given more numerical details, and “implementation strategies” were rewritten. Moreover, industry and trade were separated into two sections reflecting the splitting the Ministry of Trade and Industry into the Ministry of Industry and the Ministry of Trade in October 2010. Also see section 3-2-2 below.
CHAPTER 3
40
The GTP has the following document structure (numbers in parentheses indicate the number of pages in the English edition):5
Volume I – Main Text Foreword, introduction, plan preparation and approval process (4) Ch.1 Achievements and challenges under PASDEP (17) Ch.2 Basis, objectives and strategic pillars (7) Ch.3 Macroeconomic framework (10) Ch.4 Financing (7) Ch.5 Economic sectors development plan (41) Ch.6 Social sector development plan (10) Ch.7 Capacity building and good governance (14) Ch.8 Cross-cutting sectors (gender, youth, labor, culture, environment, etc. 12) Ch.9 Opportunities, risks and challenges in implementation (2) Ch.10 Monitoring and evaluation (4) Volume II – Policy Matrix Text (3) Policy matrix (35)
The GTP’s objectives and strategic pillars in chapter 2 are expanded with more concrete contents in chapters 5-8 of Main Text (volume I) and Policy Matrix (volume II). Chapters 5-8 are the core part of the GTP that lists strategic direction, objectives, major targets (with numerical tables), and implementation strategies for each chosen sector. Policy Matrix additionally gives each sector’s annual targets, implementing agency, and means of verification in a large table format. While economic sectors, social sectors, governance and cross-cutting issues are all
5 A MOFED high official confirmed that the Amharic original and the English translation of the GTP
had identical content with no added or hidden sentence or section from the one to the other. The GTP’s basic structure inherits that of PASDEP but some differences can also be detected: (i) the GTP is more compact (Main Text of 127 pages against PASDEP’s 225 pages, in English); (ii) sectoral chapters and sections have been reordered and rearranged; and (iii) numerical targets are set more systematically for all selected sectors.
Ethiopia’s Industrialization Drive under the Growth and Transformation Plan
41
targeted, it can be surmised from space distribution that economic sectors development is given a prominent role in eradicating poverty and reaching middle income. Economic sectors in chapter 5 further divide into agriculture and rural development (11.5 pages), industry (6.5 pages), trade (1.5 pages), mining (3.5 pages) and infrastructure (17.5 pages). While volume is only a partial indicator of importance, it is suggestive of what issues are given high policy attention. It can be concluded that the Ethiopian government aims to generate concrete sources of growth in the agriculture and industrial sectors under state guidance rather than confining itself to general provision of primary education, health care and good business environment, and letting the market do the rest. In comparison with other five-year plans in the developing world, Ethiopia’s GTP has the following characteristics. First, the whole document is relatively lean and concise,6 and various parts hang together reasonably well under a clear policy direction (however, this does not mean that individual numbers are convincing or mutually consistent). As noted above, the visions, objectives and strategic pillars are given contents in the core sectoral chapters. Second, despite compactness, the GTP manages to set annual numerical targets for each chosen sector. It can be said that the GTP is a consolidated document combining visions, sectoral and sub-sectoral strategies and concrete action plans in one. This is good from the viewpoint of unambiguous allocation of tasks and effective monitoring, but it can also be a problem since all policy actions are pre-set at the beginning of the five-year cycle without much room for additional stakeholder consultation, revision or rolling adjustments. Third, many of the GTP’s targets are highly ambitious. This can be said for both overall growth targets and specific sector and sub-sector targets. These issues will be discussed further in section 3-3-2 below. In chapter 9 of the GTP, risks associated with the implementation of the GTP are described as follows.
The main foreseeable challenges in the implementation of the GTP
6 Word limits were imposed in drafting the GTP whose English translation has 127 pages. In
comparison, Malaysia’s Third Industrial Master Plan 2006-2020 has 766 English pages.
CHAPTER 3
42
include low implementation capacity, low national saving rate that is unable to support the investment needs of the economy, and the unpredictability of external financing. In addition, it is anticipated that global market price fluctuations could provide some challenges to effective implementation of the plan. (English p.123)
Regarding the shortage of funding, it is further stated that the problem will be dealt with by improvement of the tax system and expansion of the tax base, encouragement of domestic savings, enhancement of external finance opportunities and contribution of local and international non governmental organizations (NGOs) and civil society organizations (CSOs). Foreign earnings will be increased by both expanding export capacity and substituting imports. To address implementation capacity challenges, the civil service reform program will be strengthened at all levels.7 These proposed risk management strategies are reasonable but may not be sufficient. Additionally, we would like to point to three more issues—target rigidity, limited policy capability and the lack of dynamic response from the private sector—as potential risks in implementing the GTP. These will be the main topics in the remainder of this chapter (sections 3-3 to 3-5). 3-2-2. The industry section Industrial performance was less than expected in the PASDEP period. From 2005/06 to 2009/10, real GDP grew an impressive 11.0% per annum on average against the base case target of 7.0% and the high case target of 10.0%. This was the result of a mixture of overachievement of agriculture (8.4% against base case target of 6.0% and high case target of 6.4%) and services (14.6% against base case target of 7.0% and high case target of 10.0%) and underachievement of industry (10.0% against base case target of 11.0% and high case target of 18.0%).
7 In the PASDEP, the shortage of domestic savings and the problem of implementation capacity were
not mentioned as risks (except for the low capacity of the domestic construction industry). Instead, external uncertainties such as foreign financing, commodity prices and geopolitical factors were highlighted.
Ethiopia’s Industrialization Drive under the Growth and Transformation Plan
43
Slower-than-expected industrial growth was disappointing to the Ethiopian government which hoped to attain faster industrialization with concentrated policy effort on a few selected export-oriented sub-sectors such as leather and leather products, textile and garment, and agro-processing. The share of industry in GDP remained a relatively stable 13% rather than rising to 16.5% as targeted. The exports of the above-mentioned three sub-sectors did grow, but were still small at USD115 million (only 3.8% of total export) as of 2009/10. In light of these results, the cost effectiveness of incentives and subsidies poured into these sub-sectors in the forms of cheap land, allocation of bank loans and foreign exchange, concentrated policy attention and ODA support, and so on, needs to be re-examined. The industry section of the GTP (section 5.2 of GTP) has a relatively simple structure with MSE development and promotion of eight medium and large industries as two pillars. The opening sentence of the section says that “favorable conditions will be created for industry to play a key role in the economy” (English p.56). After affirming ADLI and the (revised) policy principles of the 2002 Industrial Development Strategy, 8 the following four Strategic Directions are presented: a) Micro and small enterprises (MSEs) development This is expected to create jobs in urban areas and increase rural- urban and urban-to-urban functional and economic linkages. b) Medium and large industries development, which includes 1. Textile and garment 2. Leather and leather products 3. Sugar and sugar related industries 4. Cement 5. Metal and engineering 6. Chemical 7. Pharmaceutical 8. Agro-processing
8 Policy support will be focused on industries that are labor intensive, have broad linkages with the rest
of the economy, use agricultural products as inputs, are export-oriented and import substituting, and contribute to rapid technological transfer.
CHAPTER 3
44
c) Industrial zones development (for medium and large manufacturing industries) d) Public enterprises management and privatization The first two can be construed as “main sub-sectors” while the latter two were upgraded from text discussion in passing to Strategic Directions in the drafting process. Inclusion of import substituting industries (4, 5, 6 and 7) in addition to the export-oriented industries targeted by the PASDEP is particularly noteworthy.9 Then seven Objectives are stated which are: 1. Creation of a broad-based spring-board for competitive domestic industrial and private sector development 2. Employment opportunities and poverty reduction 3. Support sustainable development of agriculture 4. Full utilization of industrial capacity 5. Use of domestic raw materials and labor (for medium and large industries) 6. Create a strong foundation for the sector to start playing a leading position in the national economy, employment generation, and foreign exchange earnings and savings 7. Local production of equipments, machinery and spare parts In the Major Targets sub-section, numerical targets of designated sub-sectors are presented, which are further elaborated in Volume II (Policy Matrix) with annual targets, implementing agency and means of verification. The appendix to this paper replicates the entire industry sector targets in the Policy Matrix while Table 3-2 below gives selected highlights. It must be admitted that many of the sub-sectoral targets are quite ambitious. We will contemplate on this issue in the next section.
9 Among the import substituting industries, the cement industry was already featured in the PASDEP.
Ethiopia’s Industrialization Drive under the Growth and Transformation Plan
45
Table 3-2. Selected GTP Targets for the Industrial Sector
Sub-sector Unit Base year 2009/10
Target for 2014/15 Multiples
Textile Export earning in $ million 21.8 1,000 45.9 times Leather Export earning in $ million 75.73 496.9 6.6 times Sugar Production in million tons 0.314 2.25 7.2 times Cement Production in million tons 2.7 27 10 times Steel & engineering
Gross value-added in million birr 6 101.4 16.9 times
Fertilizer (urea) Production in million tons - 300 - Pharmaceutical Domestic market share 15% 50% - Agro-processing Export earning in $ million 35.2 300 8.5 times
Industry zones Number of factories in zones - 164 -
Public enterprises Gross value-added in million birr 2.26 5.32 2.4 times
MSEs - job creation Number of jobs - 2,970,000 -
MSEs - training of trainers Number of trainees - 10,000 -
MSEs - training of operators Number of trainees - 3,000 -
MSEs - manufacturing land Hectare - 15,000 -
MSEs - shades Number - 21,591 - MSEs - buildings Number - 819 -
Source: Excerpted from Policy Matrix of the GTP. Industrial zone and MSE targets are cumulative results for five years.
3-2-3. Industrial policy dialogue and the GTP How does the industry section of the GTP look in light of ideas and proposals discussed in the Ethiopia-Japan industrial policy dialogue in 2009-2011? We feel that not so many of our discussions are reflected in the text of the GTP, at least not directly and explicitly, and it is hoped that they will be more fully taken into account in other documents and in the implementation stage. Among the many issues raised in our policy dialogue sessions, perhaps the most important is emphasis on quality rather than quantity or speed in industrial policy making. We have argued that care and reservation must be exercised in setting numerical targets and that main focus should shift from tons and percents to
CHAPTER 3
46
indicators of skills, technology and other capabilities (chapter 8). It was also noted that, in the policy formulation process of Ethiopia, consensus building on key directions and deep participation of stakeholders were weak in comparison with the best policy practices in East Asia (chapter 4). The GRIPS and JICA team frequently expressed concern over the speed of drafting key documents such as kaizen institutionalization and MSE development which seemed too fast for ensuring feasibility and willing participation of major stakeholders inside and outside government. However, the approved text of the GTP is heavy with numerical targets while competitiveness and productivity are mentioned only in passing without specific targets. This is odd in light of the fact that high-level policy makers in Ethiopia always stress the critical importance of agricultural and industrial skills, engineering education, technology transfer, TVET system and other measures related to industrial human capital. In our policy dialogue sessions, the prime minister frequently expressed his keen interest in technology transfer and innovative attitude as well as learning concrete lessons in this regard from East Asia. The gap between this obsession with industrial human capital and the absence of clear statement or targeting of skills, technology and knowledge in the GTP is puzzling and must be explained. Another related puzzle is the fact that the term kaizen (factory improvement method developed in Japan) is entirely missing from the text of the GTP, together with other productivity and efficiency tools such as benchmarking, twinning and BPR. Meanwhile, upgrading of the TVET system and creation of new industrial zones are not only mentioned but even featured extensively. It is difficult to comprehend the logic of highlighting some of the industrial policy tools and ignoring others when all are essential for realizing the industrial goals of the GTP. The lack of mention of kaizen is especially hard to understand. Unlike benchmarking, twinning and BPR which are already known and widely practiced, kaizen is a newly introduced productivity tool that must be learned, scaled up and institutionalized with great effort in the GTP period as a national movement to transform the popular mindset (section 3-5). Without knowing whether and how kaizen fits into the GTP framework, it is difficult for Japan to prioritize kaizen support in its development
Ethiopia’s Industrialization Drive under the Growth and Transformation Plan
47
cooperation with Ethiopia.10 The Japanese team in the bilateral policy dialogue also conducted a needs survey on the basic metal and engineering sector at the request of the Ethiopian government.11 The survey was conducted under a strong time constraint to offer advice to the implementation of the Basic Metal and Engineering Development Plan in the GTP period. This survey produced several recommendations including the proper sequencing of development from downstream to upstream, re-examination of feasibility of Bikilal ore, identification of locally substitutable metal products in the power sector, and capacity building using kaizen. It also raised questions concerning the methodology of steel demand projection and setting targets for local procurement of metal inputs in individual sectors. However, these recommendations and questions are not reflected in the basic metal and engineering sector targets of the GTP. 3-3. Numerical targets 3-3-1. Macroeconomic targets Use of numerical targets is normal in national development plans. In the macroeconomic area, they are indispensable for charting the general direction of the national economy and ensuring consistency among sectoral and financing figures. However, the number and scope of numerical targets must be selected judiciously
10 GRIPS and JICA consider kaizen institutionalization as the key entry point for launching a national
productivity movement in Ethiopia. In our policy dialogue, policy makers and experts have variously suggested how kaizen should be compared with other productivity and efficiency tools. One idea is that BPR and benchmarking create one-time jump while kaizen is constant improvement in small steps. Another thinks that benchmarking sets targets and kaizen offers a way to achieve them. Yet another suggestion is that kaizen is much broader than other tools as it encompasses philosophy, culture and mindset change. However, many people in Ethiopia are still confused about the relationship and compatibility between kaizen and other tools. We strongly recommend that a definitive official view on the precise role of kaizen in the GTP be announced as soon as possible.
11 Mr. Toru Homma, a JICA industrial expert, led a survey on steel industry and metal engineering industry serving the power and construction sectors in the first half of 2010, while the Engineering Capacity Building Program (ECBP) in parallel undertook a similar survey on the metal engineering industry serving the sugar and cement sectors.
CHAPTER 3
48
and the levels at which they are set must be arrived at in a rational way that allows analysis and assessment. In the GTP, the target for real GDP growth for 2010/11-2014/15 is set at 11.2% per annum in the base case scenario and 14.9% per annum in the high case scenario. The main difference between the two scenarios is whether agriculture will rise strongly as technology and practices of model farmers are scaled up to all other farmers (high case) or the scaling up will remain partial (base case). Either way, these are ambitious targets. If these are attained, Ethiopia will be among top growth performers in the world for a decade surpassing most East Asian economies including China. We do not question ambitious growth targets as such numbers in national development plans are an expression of political will and national aspiration. Ethiopian policy makers feel that the high growth achieved in the PASDEP period of 2005/06-2009/10 should define the minimum growth rate in the future. The GTP states that
During the [PASDEP] period the economy grew on average at 11% per annum. Assuming that the current economic growth trend is maintained for the next five year period, it is feasible that, in addition to achieving its Millennium Development Goal (MDG) targets by 2015, Ethiopia will achieve its longer term vision of being a middle income country by 2020-2023. (English p.1)
However, it must be emphasized that an appropriate analytical framework is needed to explain growth scenarios for logical clarity and operational flexibility because simple extrapolation is not convincing; and falling short of the growth target should not lead to undesirable policy reactions that may increase economic distortion and imbalance. In the Third High Level Forum of our industrial policy dialogue in November 2009, the Japanese side argued that trends and fluctuations of growth performance depended on three factors: private dynamism, policy quality and uncontrollable shocks (chapter 8). While growth was higher in the first half of the PASDEP period than the second half, it was not clear whether this slowdown was caused mainly by exogenous shocks which turned from positive to negative (such as global
Ethiopia’s Industrialization Drive under the Growth and Transformation Plan
49
recession and worsening of weather conditions) or by deterioration of policy quality or private effort (or both). Ethiopia does not have an effective analytical framework to identify the main cause(s) of the growth slowdown or address the problem with appropriate policy response. For the same reason, the alternative growth scenarios (base case and high case) in the GTP period cannot be evaluated objectively unless underlying conditions such as assumed trends in labor force, capital stock and productivity and different assumptions about exogenous variables are explicitly stated. For this, Ethiopia needs a macroeconomic framework—whether based on growth accounting, a full-scale econometric model or others—that can explain the relationship between assumptions and outcomes.12 Unlike performance in social service delivery such as education or healthcare in which key determinants are policy action and public sector spending, performance in productive sectors such as agriculture and industry does not follow a linear relation between policy inputs and outcome. Production, investment and exports depend not only on policy and public expenditure but also on private effort on quality, design, distribution, marketing, and branding along the value chain against rival firms and countries as well as global business cycles, price fluctuations and weather (in the case of agriculture). Growth performance in agriculture and industry must therefore be interpreted differently from those in social sectors. Without clear understanding of the causes of growth performance, the government runs the risk of resorting to undesirable policy reaction when actual numbers fall short of targets. If the reason for the shortfall is inappropriate policy design or implementation, policy review is in order. If the policy is adequate by international standards but business response is weak, a long-term policy drive for changing the mindset and behavior of the private sector may have to be launched (section 3-5). But if the growth is lower than expected due to causes beyond the reach of the government or an unreasonably high growth target, the proper response is to lower the target and modify the macroeconomic policy stance accordingly. If
12 For example, in the high case scenario, the assumed gross domestic capital formation of 22.0% of
GDP (English p.32) seems too low against the growth target of 14.9%. This implies an incremental capital-output ratio (ICOR) of only 1.48 (=22.0/14.9). To support high growth with such a low investment rate, investment efficiency must be extremely high.
CHAPTER 3
50
additional incentives, subsidies and public spending are instead mobilized to try to attain an unreachable goal, the country is likely to suffer a serious macroeconomic imbalance. Flexibility and adjustments are needed to guard policy implementers against being trapped in pre-set targets. 3-3-2. Sub-sectoral targets The GTP is a comprehensive development plan with details. It incorporates visions, strategies and action plans (annual targets for sectors and sub-sectors) in one document. In many countries these policy components are prepared in separate documents and in sequence. For example, the Policy Matrix of the GTP specifies sub-sector annual targets for output, exports, capacity utilization and newly hired workers for textile, leather and sugar industries from 2010/11 to 2014/15 (see also Table 3-2 above and Appendix).13 As noted earlier, many of these targets look ambitious. According to MOI and MOFED officials, these numbers were proposed in a bottom-up fashion from MOI directorates in charge of these sub-sectors to MOI leaders. They are based on the analysis of existing industry capacity and future projects in the pipeline. The Macro Economic Team of MOFED did not revise these numbers except for those related to the power and infrastructure sectors. The merit of specifying sub-sector targets in detail for five years in advance is clarity in division of labor. The existence of the Plan Matrix makes it easy to identify responsible ministries and directorates for all targets, allocate concrete tasks to them for each year, and monitor the progress. On the other hand, the demerits of such detailed planning without sufficient market consultation are inflexibility and the lack of stakeholder cooperation. Sub-sector targets set by the government which are too many, too high or too rigid may bind policy implementation as circumstances change or if stakeholders (especially
13 The problem of pre-specifying too many details over products, markets and investments was also
visible in A Strategic Action Plan for the Development of Ethiopian Leather and Leather Products Industry, two volumes (UNIDO and MOTI, 2005).
Ethiopia’s Industrialization Drive under the Growth and Transformation Plan
51
domestic and foreign enterprises) feel uncomfortable with the targets. If targets are unmet, worry and blame will torment the ministry or directorate in charge. The government may be able to achieve numerical targets in a certain sub-sector by forcing or subsidizing production and investment but it may miss the more important objective of fostering productivity and competitiveness. The three points raised over numerical targets in the Third High Level Forum in November 2009 are still valid: (i) it must be asked whether the targeted number properly belongs to the domain of government or it should be better left to the market in the context of a specific sector in Ethiopia; (ii) qualitative goals such as skills and technology transfer must be translated into proxy variables that are both meaningful and quantifiable; and (iii) goals and timetables must be set both ambitiously and realistically in the sense that serious joint effort by government and the private sector should be able to attain them (chapter 8). In plan documents, macroeconomic targets are indispensable and key sectoral targets (such as growth rates and GDP shares of industry, agriculture, services, etc.) are also important but they must heed the precautions mentioned above. At the sub-sectoral level, it is better to let the ministries and directorates in charge decide targets and policy measures in close consultation with businesses and allowing the possibility of annual adjustments rather than stipulating them in advance in the five year plan. Sub-sector targets must be indicative, not state orders that must be attained by any means. As income and industrial capability rise, nations usually graduate from fixed-period planning which takes up enormous time and energy of government officials and adopt flexible policy making with movable targets and measures. In the East Asian region, Japan, Korea, Taiwan and Singapore no longer produce five-year plans. As policy capability is gradually built up and the private sector becomes more dynamic, Ethiopia should also move toward less pre-set sub-sector targets and more flexibility and adjustments in sub-sector policy formulation.
CHAPTER 3
52
3-4. Policy capability 3-4-1. Missing ingredients This and the next section reiterate the topics already taken up as main issues in the Seventh High Level Forum in January 2011 (chapter 4). Ethiopia’s industrial policy formulation is still on a learning curve and it has a long way to go before catching up with the best policy practices of the world. Besides concrete policy measures, the areas in which the Ethiopian government must continue to learn include policy procedure (how industrial policy is made), policy organization (what organizational arrangement can produce most effective policies) and national movement (how to ignite a change in popular mindset toward productivity and competitiveness). The first two are dealt with in this section while the last will be discussed in the following section. The lack of sufficient policy capability on the part of the Ethiopian government can be a serious impediment in the implementation of the GTP. To put it more positively, clear recognition of this problem and strong resolve to overcome it in proper steps will provide Ethiopia with an excellent opportunity for policy learning which is the key to national development based on knowledge, skills and technology. We have argued in chapter 4 that policy making procedure must contain five ingredients: vision, consensus building, stakeholder involvement, lead ministry or agency, and drafting. Policy formulation must begin with the vision advanced by the top leader with his or her deep conviction. To concretize this vision, an official mechanism with clear authority and mandate must be designated to manage policy and a secretariat function must also be set up. This mechanism must spend sufficient time in building consensus on key policy directions, issues and measures among concerned ministries and non-government stakeholders (especially businesses). Necessary surveys and studies should be commissioned to competent experts or research institutes. When this process is completed and basic agreement is reached, a policy document should be drafted and comments should be received for revision and finalization. This, in a nutshell, is the standard procedure for making industrial policies in high-performing economies (Figure 4-1 in chapter 4). To realize this procedure, Korea has presidential committees, Taiwan and Thailand
Ethiopia’s Industrialization Drive under the Growth and Transformation Plan
53
use research institutes as facilitators, and Singapore and Malaysia mobilize a three-layer official mechanism of committees and working groups. Although each country has different ways and styles, they all fulfill five ingredients mentioned above. They naturally create a sense of shared ownership and responsibility among all stakeholders inside and outside government which makes it easy to implement the policy once it is agreed. The problem with Ethiopia is that some of these necessary ingredients are missing. The vision is provided by the top leader and the drafting process—whether internally drafted or outsourced to domestic or foreign consultants—does exist, but the intermediate process of building consensus on main policy features by mobilizing all stakeholders remains weak. As a result, the policy content depends critically on the scope of knowledge and experience of a few persons who happen to be assigned to the task rather than reflecting the broad and diverse views of a large number of stakeholders. Moreover, policy capacity of a lead ministry or agency generally needs further strengthening. 3-4-2. Three issues To be more specific, three problems have been identified in the preparation process toward the GTP and its related documents. First, speed is emphasized over quality. In Ethiopia, many policies are formulated in great haste at the cost of quality and implementability. While we recognize the strong political urge to move fast that permeates every chapter of the GTP, the fact is that Ethiopia drafts policies much faster than East Asian high-performing economies with far more policy experience. The latter typically spend one year to update an existing policy and two to three years to draft a new one.14 As a new learner of industrial policy methodology, it would not be improper for Ethiopia to
14 Taiwan spent three years to draft a new industrial statute of 2010 that would govern the economy’s
industrial strategy for decades to come. Similarly, Malaysia took nearly three years to produce the Third Industrial Master Plan 2006-2020. When Singapore launched its national productivity movement with Japanese assistance in the 1980s, the first few years were spent on understanding the basic concept and narrowing the perception gap between the teacher (Japan) and the student (Singapore).
CHAPTER 3
54
spend at least a few solid years to study best practices, devise local adaptation and create an appropriate policy mechanism before it adopts an important industrial policy package such as kaizen, MSEs and industrial clusters. Hurried policies are less likely to be effective, supported or implementable. In the end they will take more time to produce results than policies that are formulated through proper steps as discussed above. Second, Ethiopia needs a simple and organized mechanism in the central government to coordinate, monitor and adjust high priority policies. In the last several years, the country has created central committees and teams more or less randomly to deal with the expanding policy scope. Starting with the monthly Export Steering Committee, which has so far worked well, the government has added two committees on infrastructure and a working team on import substitution policy. For the enhancement of the TVET system under the MSE strategy and the new task of kaizen institutionalization, inter-ministerial coordination is expected to take place in the Board of Directors established individually for these policies. Admittedly, these are ad hoc creation of coordination mechanisms whose complexity will accumulate as policy scope further expands. Instead of endlessly adding committees, boards and teams, the GRIPS Development Forum (GDF) proposes a central coordination mechanism comprising of (i) the National Competitiveness Council chaired by the prime minister and attended by ministers, business leaders and experts that meets every month and has several working groups under it to study specific issues or sectors; (ii) a permanent planning commission that specializes in making and executing development plans which also serves as the secretariat to the above council; and (iii) a policy think tank that supports these two bodies with action-oriented surveys, studies, seminars and other intellectual inputs (also see Figure 4-12 in chapter 4). Precise names of the council and the commission are immaterial. Through this mechanism, only the most important issues should be deliberated and decided before the prime minister while other issues should be handled at the lower levels.15
15 It is reported that the government is studying the possibility of installing a new central coordination
mechanism consisting of a full-fledged planning entity and an enhanced think tank ((ii) and (iii) above). As for the National Competitiveness Council ((i) above), the current Export Steering
Ethiopia’s Industrialization Drive under the Growth and Transformation Plan
55
Third, proper steps should be taken to institutionalize kaizen. Introduction of kaizen to Ethiopia is in a very early stage with the first kaizen pilot project of 28 local companies successfully completed, kaizen manuals and videos produced, and dissemination plan formulated. These initial results must be scaled up functionally, sectorally and geographically to the national level. The institutionalization of kaizen is important for Ethiopia because it will be the country’s core activity in a national movement for mindset change toward efficiency and productivity. Kaizen should not end with a few projects assisted by Japan but should become a locally-owned decade-long movement encompassing all farmers, workers, engineers and managers to change the way Ethiopians think, live and work. Our policy dialogue has shown that, for such a broad national movement to produce great results, certain prerequisites are ensured including leadership, core organization, supporting institutions, massive campaign, training programs and materials, and fostering private sector capacity (see section 3-5 below; also see Handbook (JICA and GRIPS, 2011)). Formulation and execution of this movement will be a major challenge for the Ethiopian government, for which good preparation and proper steps will become all the more important. In the last two years Ethiopia and Japan have worked together to solve initial perception gaps and administrative delays which are common in introducing kaizen to a new country. In the years ahead, more policy learning and local adjustments will be needed for the scaling up of kaizen.
3-5. Private dynamism and mindset change 3-5-1. The problem of weak private sector response Will the Ethiopian private sector respond strongly to the industrial policy measures of the GTP? Can local enterprises match the strong political will and ambitious growth targets advanced by the Ethiopian government? Industrialization requires a combination of good policy and strong private dynamism. Apart from improving
Committee could be expanded to take up its functions. If this idea is concretized with proper design, it will contribute greatly to the improvement of policy coordination in Ethiopia.
CHAPTER 3
56
the quality of industrial policy of the government, latecomer countries often face the problem of a weak private sector characterized by short-terminism, job hopping, foreign product worship, real estate speculation, dependency on subsidies and protection, and unwillingness to explore new products, technology and markets. There may be less-than-expected industrial performance due to the lack of Schumpeterian animal spirit. This concern comes not from theoretical reflection but from the observation of many countries, in East Asia and elsewhere, that show divergent growth records despite similar policy frameworks and external environments. The difference between Korea and Taiwan on the one hand, which are already in the high income group, and Malaysia and Thailand on the other, which remain in the middle income range though all the four economies started industrialization with public support in the 1960s, cannot be explained solely by policy measures adopted by them which have large overlaps. The fact that Hyundai Motor, a Korean auto maker, absorbed the technology of Mitsubishi Motors rapidly in the 1970s to become a global competitor by 1986 while Proton, a Malaysian auto maker established in 1983, and its suppliers, continue to be local players and receive Japanese technical assistance for improving competitiveness even today points to the innate difference in the national capacity to master foreign technology. Similarly, any Japanese factory manager who has worked in both Taiwan and Thailand can tell that there is a fundamental difference in the discipline and innovativeness of engineers and workers between these two economies. The hypothesis that all nations are equal in their work attitude and productivity aptitude given the same management is not borne out by facts. In our meetings with Prime Minister Meles, he frequently raised questions regarding the lack of private sector dynamism. One of his questions was why the Ethiopians with large sums of money invested in urban properties instead of building factories. On another occasion he asked how East Asian governments steered the private sector away from speculation and rent seeking and into manufacturing and technology. He also wished to receive literature explaining concretely how Meiji Japan and post-WW2 Korea absorbed technology so quickly from foreign-assisted industrial projects.
Ethiopia’s Industrialization Drive under the Growth and Transformation Plan
57
Our answer on how to wake up a sleepy private sector is the initiation of a national movement for mindset change. National movement is not just a collection of projects. It is a comprehensive program of aspiration, philosophy, mass campaign, factory projects, training, awards and institution-building that lasts for at least a decade until it becomes self-sustaining and an integral part of popular mindset. It usually aims at quality, productivity and life improvement by instilling the spirit of activism and cooperation. In many instances the movement is started as top-down imposition of actions that must be executed at the grassroots level which, if it is to succeed, yields visible benefits that ignite voluntary implementation and willing expansion. Successful examples from East Asia include Japan’s Rural Life Improvement Movement (1948-) and factory kaizen movement (1950s-), Singapore’s Productivity Movement (1960s-) and Korea’s Saemaul (new village) Movement (1970s-). Some movements initiated decades ago are still practiced and have evolved into advanced forms. However, organizing a national movement requires high policy capability due to its complexity and duration. The Quality Control (QC) Circle Movement of Burkina Faso since 1989 and the Productivity Movement of Botswana since 1991 have produced some results but did not transform the national business landscape as dramatically as in the East Asian economies cited above. Ethiopia has chosen kaizen and its institutionalization as the core instrument of its national movement for mindset change. The first JICA-assisted pilot project of 28 manufacturing companies was completed by June 2011 with satisfactory results, but the country has a long way to go before a kaizen-based national movement is firmly established. For continued success and expansion, systematic policy learning from international best practices as well as failures is crucial. 3-5-2. Lessons from international comparison As a preliminary effort to collect international experiences in national movements, the GDF organized policy study missions to several countries in East Asia and Africa from 2009 to 2011.16 From these studies, common success factors and
16 See footnote 1 of this chapter.
CHAPTER 3
58
country-specific factors that influence the effectiveness of national movement have been distilled. The six success factors are shown in Table 3-3 with the examples of Japan, Singapore, Burkina Faso and Botswana. They are: (i) Leadership—strong personal commitment of the top leader is a must for initiating and sustaining a national movement. (ii) Core organization—there must be a central organization with full authority and responsibility to draft strategies, set standards for consultation and training, design and implement projects, coordinate players, secure funding, receive international cooperation, etc. related to quality and productivity movement. (iii) Supporting institutions—there must also be a large number of supporting institutions for awareness creation, certification, consultation, training, publication, award giving, etc. at central and local levels. (iv) Massive campaign—nationwide campaigns for raising awareness must be staged through multiple channels. (v) Training programs and materials—authorized and standardized courses and textbooks must be available for training movement leaders and instructors as well as a large number of entrepreneurs, engineers, workers, farmers, etc. in different sectors and regions. (vi) Fostering private-sector capability—promotion of private-sector service providers (consultants and trainers), their associations and related non- government supporting institutions is important for long-term sustainability of the movement as main activities will eventually have to be carried out by the private sector when the government exits from service delivery.
Ethiopia’s Industrialization Drive under the Growth and Transformation Plan
59
Table 3-3. Success Factors of National Movements
Japan Singapore Burkina Faso Botswana
Leadership ○ ○ △ △ Core organization (s) ○
(private) ○
(public) △/×
(public→private)△
(public) Supporting institutions (central and local levels) ○ ○ △
(fragmented) △
Massive campaign ○ (national
movement)
○ (national
movement)
△ (partial) △
Training programs and materials ○ ○ △
(not update) △
Fostering private sector capability ○ ○ × ×
Note: Assessment by the GRIPS Development Forum: ○ good, △ moderate, × poor.
While the productivity movements of Japan and Singapore score high on all these criteria, the movements in Burkina Faso and Botswana show many problems which explains why they have remained partial and less effective. Ethiopia needs to study all these aspects of national movements if its kaizen institutionalization is to make a strong impact on national productivity. The design of a national quality and productivity movement must also reflect country contexts as identical movement may produce different outcomes depending on initial conditions (Table 3-4). Generally speaking, if the private-sector motive for launching national movement is more pressing the easier it is to carry it out. Furthermore, in countries where the private sector is relatively well-developed, business response to government-initiated movement is expected naturally to be stronger and more extensive than in countries where the private sector is small and weak. This suggests that national movements are more difficult to start and sustain precisely in those countries where such movements are acutely needed because initial capacity and incentives for productivity improvement are low. Put differently, latecomer countries with limited industrialization must make far greater policy effort than more advanced countries to launch a national movement because the hurdle they must clear is higher. This is the challenge that Ethiopia faces in designing the strategy for institutionalizing kaizen for the next five years and beyond. Intensive policy learning must fill the gap between what is required and
CHAPTER 3
60
what the country already possesses in terms of industrial policy capability.
Table 3-4. National Movements: Country-specific Factors Japan Singapore Burkina Faso Botswana
Drivers of productivity movement
Strong ■ Domestic ■ Need for export drive as resource- poor country
Strong ■ Domestic and external ■ Perceived poor work ethics ■ Need for FDI attraction as resource- poor country
Moderate ■ Domestic and external ■ Enhance supply-side response during structural adjustment program
Moderate ■ Domestic ■ Perceived poor work ethics ■ Need for economic diversification as resource-rich country
Degree of private sector dynamism
Strong ■ Private sector- led national movement
Moderate ■ Govt.-led national movement
Weak ■ Government- initiated movement
Weak ■ Govt.-initiated movement
External support
US & Europe Japan WB/Japan Singapore
Note: Assessment by the GRIPS Development Forum.
61
Ethiopia’s Industrialization Drive under the Growth and Transformation Plan
App
endi
x: P
olic
y M
atrix
for T
rade
and
Indu
stry
Dev
elop
men
t A
nnua
l Tar
gets
Li
nks
to
MD
Gs
Obj
ectiv
e O
utpu
t In
dica
tor
Bas
e ye
ar
(200
9/10
)20
10/1
120
11/1
220
12/1
320
13/1
420
14/1
5Im
plem
entin
g A
genc
y M
eans
of
Veri
ficat
ion
Te
xtile
indu
stry
G
ross
val
ue p
rodu
ct o
f the
text
ile
indu
stry
(in
mill
ion
US
$)
470
865
1,07
41,
435
1,94
22,
545
Fore
ign
curr
ency
ear
ning
(in
mill
ion
US
D)
21.8
10
0 20
0 45
0 70
0 1,
000
Indu
strie
s' c
apac
ity u
tiliz
atio
n (%
) 40
60
65
75
80
90
G
oal l
Incr
ease
the
pr
oduc
tion
and
m
arke
t ear
ning
s of
th
e te
xtile
sec
tor
Incr
ease
d in
pr
oduc
tion
and
pr
oduc
tivity
of t
he
text
ile s
ecto
r
Num
ber o
f new
wor
kers
em
ploy
ed in
th
e su
b se
ctor
6,21
17,
366
4,77
610
,071
11,5
76
Min
istry
of
Indu
stry
M
inis
try o
f
Indu
stry
an
nual
repo
rt
Le
athe
r Ind
ustry
pr
oces
sed
hide
s an
d sk
in (m
illio
n ca
re)
-
5.9
12
18
24.2
8
Cap
acity
util
izat
ion
of in
dust
ries
(%)
10
13
16
21
25
30
Goa
l l
Incr
ease
the
pr
oduc
tion
and
m
arke
t ear
ning
s of
th
e le
athe
r ind
ustry
se
ctor
Incr
ease
d in
pr
oduc
tion
and
pr
oduc
tivity
of t
he
leat
her s
ecto
r Fo
reig
n cu
rren
cy g
aine
d fro
m
sect
or's
exp
ort t
rade
75
.73
190.
529
6.2
352
416.
849
6.9
Min
istry
of
Indu
stry
M
inis
try o
f
Indu
stry
an
nual
repo
rt
S
ugar
indu
stry
su
gar p
rodu
ct (i
n m
illio
n to
ne)
0.31
4 0.
380.
737
0.97
81.
335
2.25
Eth
anol
pro
duct
(tho
usan
ds M
3 )
20.5
42.5
69.8
99.4
304
Ele
ctric
pow
er g
ener
ated
(T
hous
ands
MW
H)
187.
233
9.5
514.
260
7
The
cont
ribut
ion
of
the
suga
r ind
ustry
fo
r inc
reas
ed s
ugar
pr
oduc
tion
and
bi
-pro
duct
s, a
nd
empl
oym
ent
op
portu
nitie
s A
dditi
onal
sug
ar c
ane
deve
lopm
ent
(in th
ousa
nds
hect
are)
50
50
50
50
Sug
ar p
rodu
cts
supp
lied
for e
xpor
t m
arke
t (in
thou
sand
tone
)
76
.29
218
460.
712
46.3
fore
ign
curr
ency
gai
ned
from
sug
ar
expo
rt (in
mill
ion
US
D)
40.6
115.
824
4.5
661.
7
Goa
l l
Incr
ease
the
supp
ly
of s
ugar
, inc
reas
e th
e su
gar
bi
-pro
duct
s an
d
supp
ort t
he p
ower
ge
nera
tion
prov
ide
to k
ey e
cono
mic
ac
tiviti
es a
nd
incr
ease
the
shar
e of
th
e pr
oduc
t in
the
ex
port
mar
ket
Incr
ease
d in
pr
oduc
tion
and
hard
cu
rren
cy g
ener
ated
fro
m s
ugar
exp
ort
Num
ber o
f wor
kers
em
ploy
ed (i
n
thou
sand
s)
24
336
2268
021
475
1889
911
2610
Min
istry
of
Indu
stry
M
inis
try o
f In
dust
ry
annu
al
repo
rt
C
emen
t ind
ustry
C
emen
t pro
duct
(in
mill
ion
tone
) 2.
7 9.
3413
.613
.617
27
Impr
ove
the
capa
city
of
cem
ent p
rodu
ctio
n an
d in
crea
se th
e
cem
ent p
rodu
ct fo
r do
mes
tic a
nd fo
reig
n m
arke
t sim
ply
incr
ease
d in
cap
acity
of
cem
ent p
rodu
ctio
n an
d pe
r-ca
pita
ce
men
t pro
duct
Per
-cap
ita c
emen
t con
sum
ptio
n (in
kg
) 35
11
6 16
5 16
2 19
7 30
0
St
eel a
nd E
ngin
eerin
g in
dust
ry
G
ross
Val
ue A
dditi
on o
f the
sub
se
ctor
(in
billi
on b
irr)
6 20
26
33
.850
.710
1.4
Goa
l l
Incr
ease
per
cap
ita
stee
l pro
duct
s an
d su
bstit
ute
impo
rted
good
s
Incr
ease
d in
the
vo
lum
e, p
rodu
ctiv
ity
and
qual
ity o
f
prod
ucts
of t
he
sub-
sect
or
Per
cap
ital s
teel
con
sum
ptio
n (in
kg)
12
14.2
317
.78
22.2
327
.75
34.7
2
Min
istry
of
Indu
stry
M
inis
try o
f In
dust
ry
annu
al
repo
rt
(Pag
e 1
of 5
)
62
CHAPTER 3
Ann
ual T
arge
ts
Link
s to
M
DG
sO
bjec
tive
Out
put
Indi
cato
r B
ase
year
(2
009/
10)
2010
/11
2011
/12
2012
/13
2013
/14
2014
/15
Impl
emen
ting
Age
ncy
Mea
ns o
f Ve
rific
atio
n
Stee
l and
Eng
inee
ring
indu
stry
Incr
ease
per
cap
ita
stee
l pro
duct
s an
d su
bstit
ute
impo
rted
good
s
Incr
ease
d in
ca
paci
ty u
tiliz
atio
n of
st
eel a
nd
engi
neer
ing
in
dust
ries
Gro
wth
in c
apac
ity u
tiliz
atio
n (%
)
- 75
80
85
90
95
Dom
estic
ally
pro
duce
d sp
are
part
co
vera
ge (%
)
Spar
e pa
rt su
pply
to le
athe
r
indu
strie
s (%
)
30
45
65
90
90
Spar
e pa
rt su
pply
for t
extil
e
indu
strie
s (%
)
15
20
30
35
35
Sca
re p
art s
uppl
y fo
r sug
ar
indu
strie
s (%
)
40
50
60
85
85
Snar
e D
art s
uppl
y fo
r cem
ent
in
dust
ries
(%)
40
50
60
85
85
Sna
re D
art s
uppl
y fo
r
aero
-indu
strie
s (%
)
40
50
60
75
75
Spar
e pa
rt su
pply
for c
onst
ruct
ion
in
dust
ries
(%)
95
95
95
95
95
Goa
l l
Sup
port
othe
r
indu
strie
s by
su
pply
ing
spar
e
parts
thro
ugh
im
prov
ing
desi
gn
and
man
ufac
turin
g ca
paci
ties
of th
e
stee
l and
en
gine
erin
g in
dust
ry
Incr
ease
d in
the
ca
paci
ty o
f the
en
gine
erin
g
sub-
sect
or to
pr
oduc
e sp
are
parts
fo
r oth
er in
dust
ries.
Spar
e pa
rt su
pply
for v
ehic
les
(%)
35
45
60
85
85
Min
istry
of
Indu
stry
M
inis
try o
f In
dust
ry
annu
al
repo
rt
C
hem
ical
indu
stry
Ferti
lizer
indu
stry
dev
elop
men
t
Incr
ease
che
mic
al
ferti
lizer
sup
ply
by
prod
ucin
g fro
m
dom
estic
raw
m
ater
ials
inpu
ts
Incr
ease
d in
sup
ply
of u
rea
ferti
lizer
with
do
mes
tic p
rodu
ct
Dom
estic
ally
pro
duce
d ur
ea
ferti
lizer
(in
thou
sand
s to
ne)
30
0
Cau
stic
sod
a an
d so
da a
sh in
dust
ry d
evel
opm
ent
Gen
erat
e an
d sa
ve
fore
ign
curre
ncy
th
roug
h es
tabl
ishi
ng
chem
ical
indu
strie
s by
gi
ving
focu
s to
thos
e in
dust
ries
supp
ort t
he
agric
ultu
re s
ecto
r and
ot
her i
ndus
tries
and
w
ith p
lan
to e
xpor
t
thei
r ind
ustri
al
prod
ucts
by
usin
g
dom
estic
raw
m
ater
ials
inpu
t
Incr
ease
d in
sup
ply
of th
e co
untry
's
caus
tic s
oda
and
so
da a
sh
The
fact
ory
cons
truct
ion
prog
ress
w
hich
can
pro
duce
50,
000
tone
ca
ustic
sod
a in
a y
ear (
%)
10
25
50
85
10
0
Goa
l l
The
fact
ory
cons
truct
ion
prog
ress
w
hich
can
pro
duce
35,
000
tone
so
da a
sh in
a y
ear (
%)
10
25
50
85
10
0
Min
istry
of
Indu
stry
M
inis
try o
f
Indu
stry
an
nual
repo
rt
(Pag
e 2
of 5
)
63
Ethiopia’s Industrialization Drive under the Growth and Transformation Plan
Ann
ual T
arge
ts
Link
s to
M
DG
sO
bjec
tive
Out
put
Indi
cato
r B
ase
year
(2
009/
10)
2010
/11
2011
/12
2012
/13
2013
/14
2014
/15
Impl
emen
ting
Age
ncy
Mea
ns o
f Ve
rific
atio
n S
oap
and
dete
rgen
t ind
ustry
dev
elop
men
t E
nhan
ce th
e
capa
city
of s
oap
and
dete
rgen
t ind
ustri
es
to s
ubst
itute
im
porte
d go
ods
Incr
ease
d in
fa
ctor
ies
to p
rodu
ce
and
supp
ly
dete
rgen
ts fo
r
dom
estic
mar
ket
Num
ber o
f fac
torie
s es
tabl
ishe
d to
pr
oduc
e so
ap a
nd d
eter
gent
pr
oduc
ts u
p to
166
,000
tone
2
3
Enh
ance
the
ca
paci
ty o
f soa
p an
d de
terg
ent i
ndus
tries
to
sub
stitu
te
impo
rted
good
s
Impr
oved
in c
apac
ity
utili
zatio
n of
su
b-se
ctor
's in
dust
ry
Gro
wth
in c
apac
ity u
tiliz
atio
n (%
)
32
50
75
80
85
90
Pap
er a
nd p
aper
pro
duct
s in
dust
ry d
evel
opm
ent
Enh
ance
the
ca
paci
ty o
f pap
er
and
pulp
indu
strie
s to
sub
stitu
te
impo
rted
good
s
Incr
ease
d in
sup
ply
of d
omes
tical
ly
prod
uced
pap
er a
nd
pulp
pro
duct
s
Pap
er fa
ctor
ies
esta
blis
hed
whi
ch
have
the
capa
city
to p
rodu
ce 8
2,00
0 to
ne in
divi
dual
ly
2 1
Fact
orie
s es
tabl
ishe
d fo
r sho
rt pu
lp
fiber
and
hav
e th
e ca
paci
ty to
pr
oduc
e 78
,670
tone
indi
vidu
ally
1
1
Fibe
r pul
p fa
ctor
ies
esta
blis
hed
that
ha
ve th
e ca
paci
ty to
pro
duce
79,
000
tone
1
Im
prov
ed in
cap
acity
ut
iliza
tion
of th
e
exis
ting
pape
r
fact
orie
s
Gro
wth
in c
apac
ity u
tiliz
atio
n (%
) 61
67
73
82
90
98
Pla
stic
Indu
stry
E
nhan
ce th
e
capa
city
of i
ndus
tries
to
sub
stitu
te
impo
rted
good
s
Dem
ands
cov
ered
w
ith d
omes
tical
ly
prod
uced
pla
stic
pr
oduc
ts
Con
stru
ctio
n pe
rform
ance
of t
he
fact
ory
that
cov
er 3
0%de
man
d an
d pr
oduc
e 37
,000
tone
pla
stic
pr
oduc
ts
25
50
10
0
Rub
ber t
ree
indu
stry
E
nhan
ce th
e
capa
city
to s
ubst
itute
im
porte
d na
tura
l
rubb
er b
y
dom
estic
ally
pr
oduc
ed p
rodu
cts
Incr
ease
d in
sup
ply
of n
atur
al ru
bber
raw
m
ater
ial
Land
cul
tivat
ed w
ith c
omm
erci
al
rubb
er tr
ee (i
n he
ctar
e)
16
7219
0421
3713
7030
00
Ann
ual s
uppl
y of
nat
ural
rubb
er
inpu
t (in
tone
)
200
821
2052
4048
1000
0
Min
istry
of
Indu
stry
Goa
l l
cons
truct
ion
Per
form
ance
of a
pr
oces
sing
fact
ory
that
pro
duce
67
00 to
ne ru
bber
ann
ually
50
100
Min
istry
of
In
dust
ry
annu
al re
port
(Pag
e 3
of 5
)
64
CHAPTER 3
Ann
ual T
arge
ts
Link
s to
M
DG
sO
bjec
tive
Out
put
Indi
cato
r B
ase
year
(2
009/
10)
2010
/11
2011
/12
2012
/13
2013
/14
2014
/15
Impl
emen
ting
Age
ncy
Mea
ns o
f Ve
rific
atio
n
Pha
rmac
eutic
al in
dust
ry
Enh
ance
the
capa
city
of
exi
stin
g an
d ne
wly
es
tabl
ishe
d
phar
mac
eutic
al
indu
strie
s to
su
bstit
ute
impo
rted
drug
s ph
arm
aceu
tical
m
ater
ials
and
ge
nera
te fo
reig
n
curre
ncy
earn
ing
by
expo
rting
the
ph
arm
aceu
tical
pr
oduc
ts
Impr
oved
in c
apac
ity
utili
zatio
n of
ph
arm
aceu
tical
in
dust
ries
Gro
wth
in c
apac
ity u
tiliz
atio
n (%
)
30
50
75
100
Im
prov
ed in
the
m
arke
t sha
re o
f
dom
estic
ally
pr
oduc
ed
phar
mac
eutic
al
prod
ucts
Dom
estic
ally
pro
duce
d m
arke
t
shar
e of
pha
rmac
eutic
al a
nd
med
ical
pro
duct
(in
%)
15
20
25
30
40
50
Goa
l l
in
crea
sed
in fo
reig
n m
arke
t ear
ning
th
roug
h
phar
mac
eutic
al
prod
uct e
xpor
t
Inco
me
gain
ed fr
om p
harm
aceu
tical
ex
port
trade
(in
mill
ion
US
D)
1 2
4 7
12
20
Min
istry
of
Indu
stry
M
inis
try o
f
Indu
stry
an
nual
repo
rt
A
gro-
proc
essi
ng in
dust
ry
Impr
ove
prod
uctio
n an
d ca
paci
ty
utili
zatio
n of
the
su
b-se
ctor
and
su
pply
the
prod
ucts
fo
r dom
estic
and
fo
reig
n m
arke
ts
Impr
oved
in fo
od a
nd
beve
rage
indu
strie
s ca
paci
ty u
tiliz
atio
n
Gro
wth
in c
apac
ity u
tiliz
atio
n (%
)
60
65
70
75
80
90
Goa
l l
G
row
th in
fore
ign
cu
rren
cy e
arni
ng
from
exp
ort o
f
agro
-pro
cess
ing
pr
oduc
ts
Inco
me
gain
ed fr
om s
ub s
ecto
r's
expo
rt tra
de(in
mill
ion
US
$)
35.2
82
14
4 15
0 19
7 30
0
In
dust
ry z
one
deve
lopm
ent
Goa
l l
Est
ablis
h In
dust
rial
zone
s an
d in
crea
se
empl
oym
ent
op
portu
nitie
s an
d
expa
nd fo
reig
n tra
de
Est
ablis
hed
in
dust
rial z
ones
and
fa
ctor
ies
built
Fact
orie
s es
tabl
ishe
d in
indu
stry
zo
nes
24
22
35
53
30
(P
age
4 of
5)
65
Ethiopia’s Industrialization Drive under the Growth and Transformation Plan
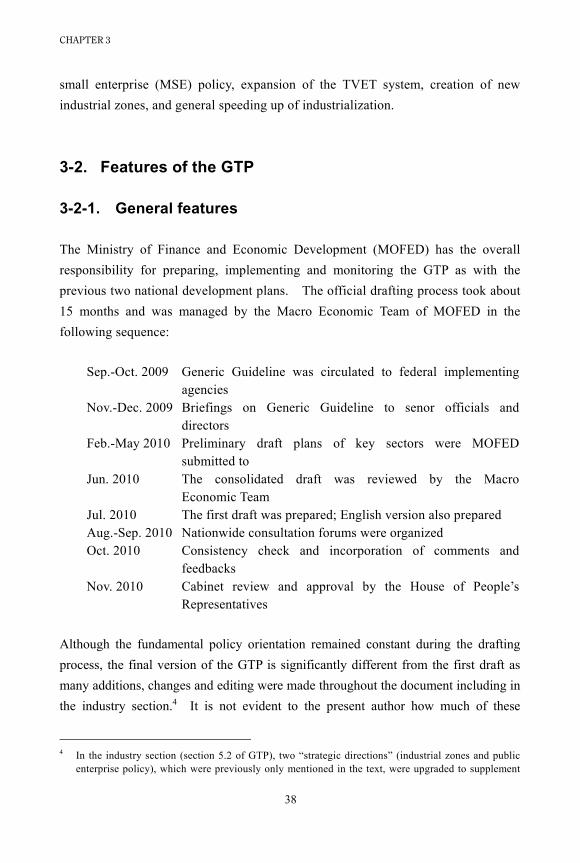
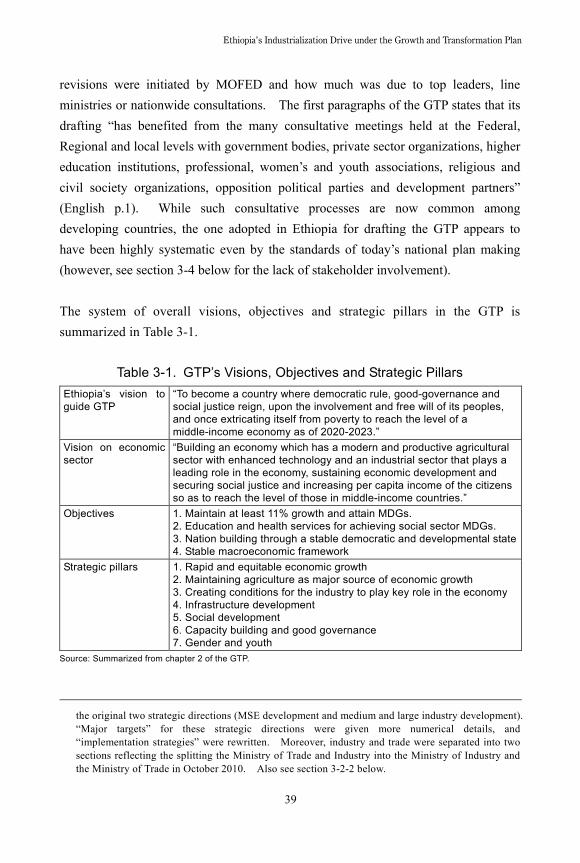
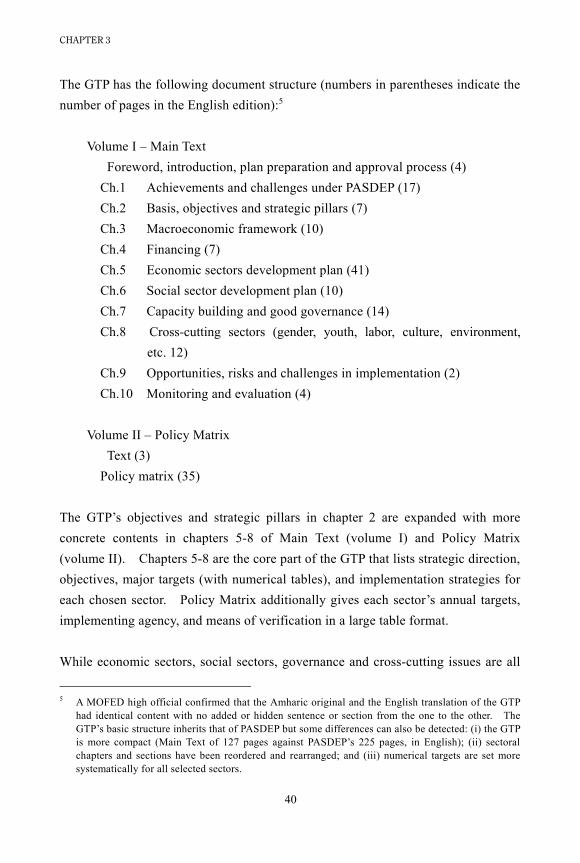
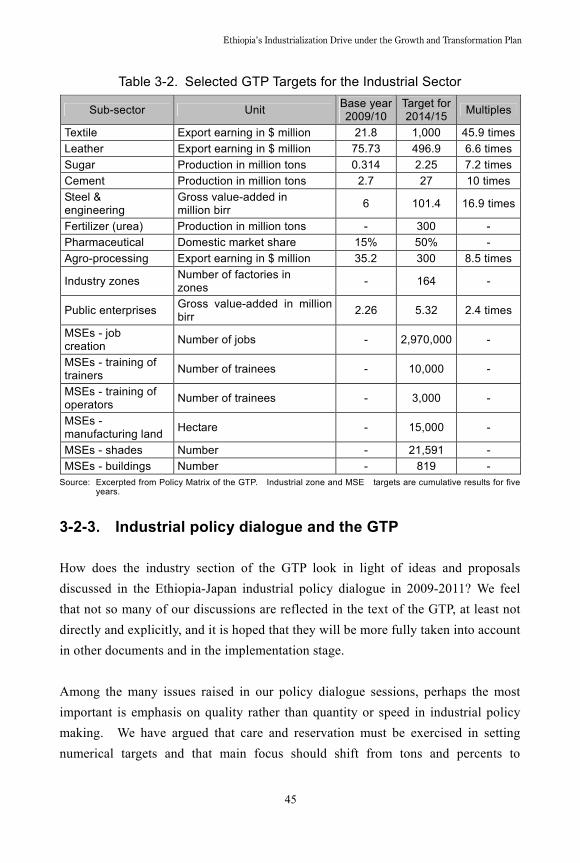
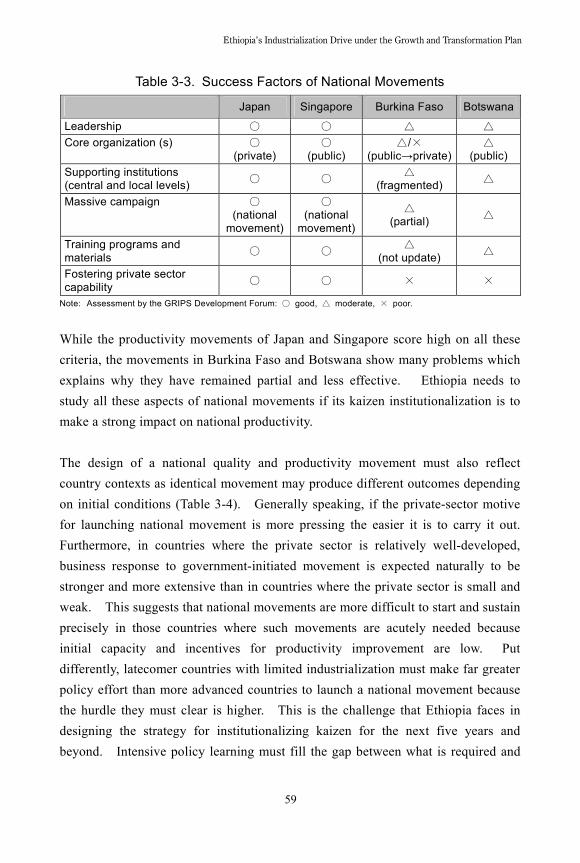
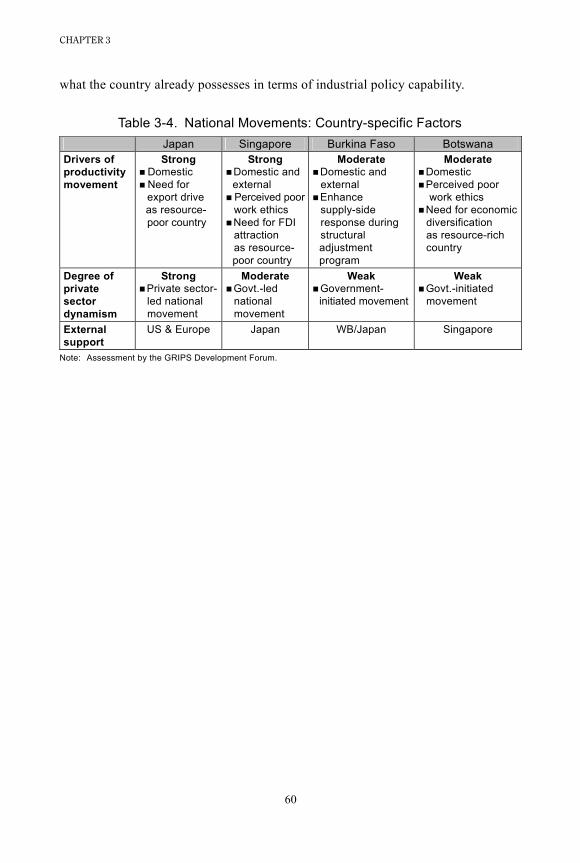
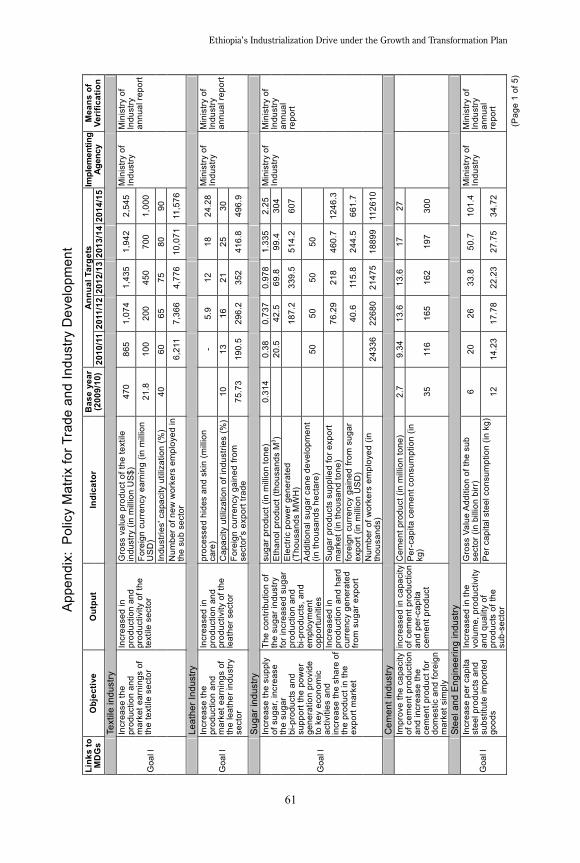
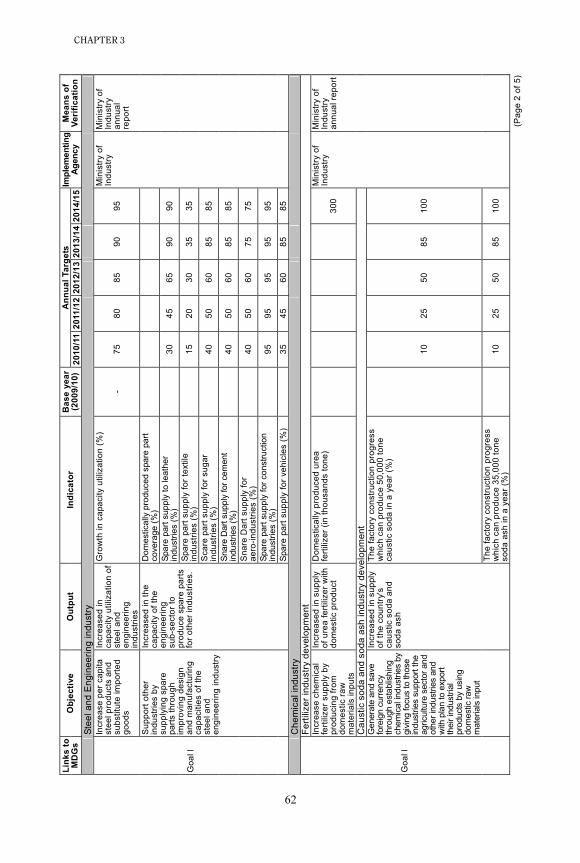
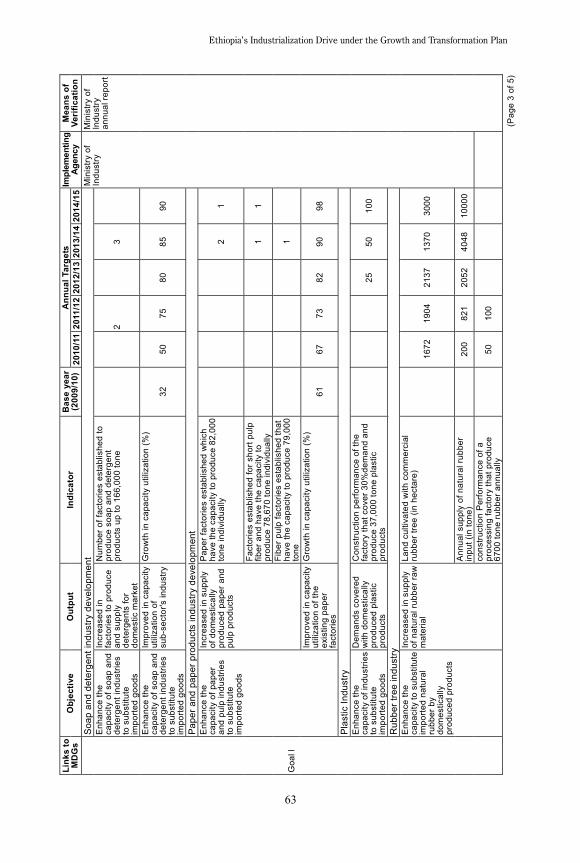
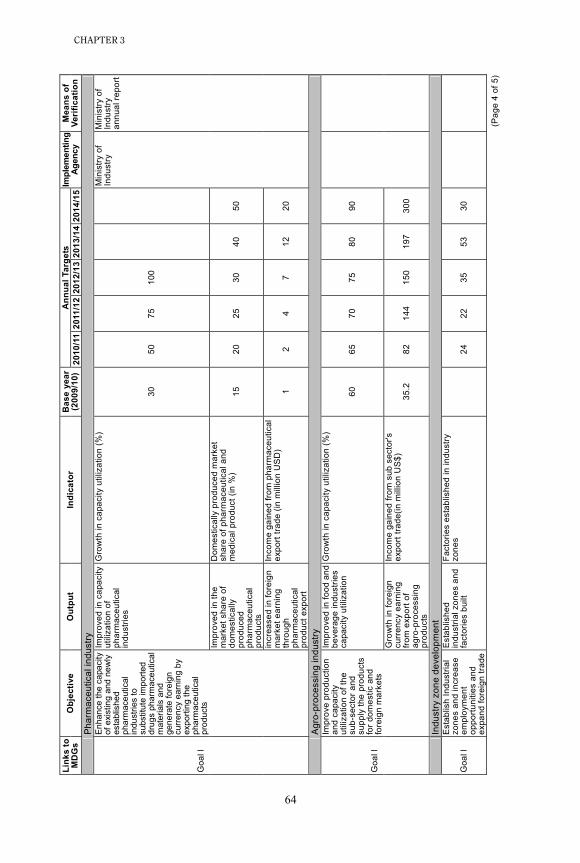
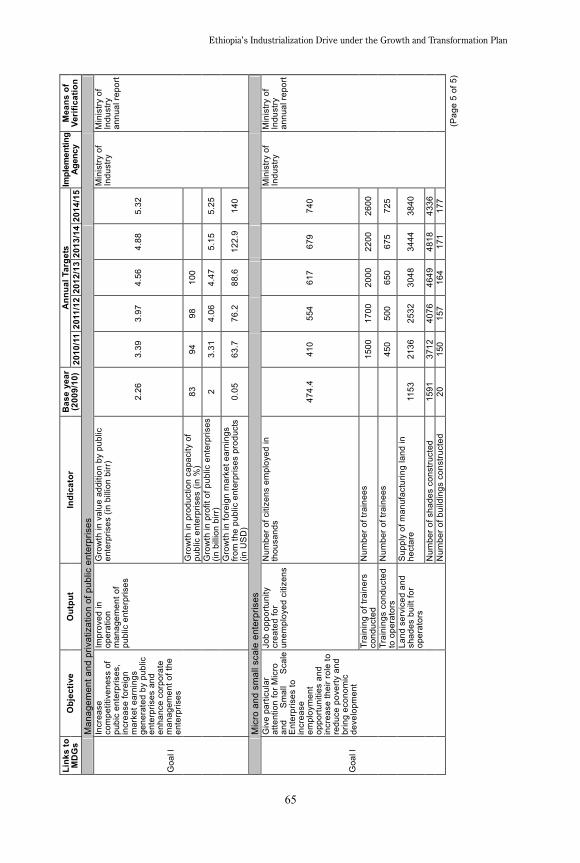


![ETHIOPIA’S MEDIUM TERM DEBT MANAGEMENT STRATEGY (2013 …siteresources.worldbank.org/INTDEBTDEPT/Resources/468980... · Ethiopia’s Medium Term Debt Strategy [2013-2017] Page 1](https://static.documents.pub/doc/80x56/5b1c3d1c7f8b9a1b688b5d65/ethiopias-medium-term-debt-management-strategy-2013-ethiopias-medium.jpg)


