Ethnic differences, obesity and cancer, stages of the obesity epidemic and cancer prevention Professor TH Lam, JP, BBS MD, FFPH, FFOM, Hon FHKCCM, FHKAM, FRCP Sir Robert Kotewall Professor in Public Health School of Public Health The University of Hong Kong UICC World Cancer Congress Melbourne, Australia 3-6 December 2014
Transcript
Ethnic differences, obesity and cancer,stages of the obesity epidemic and cancer prevention
Professor TH Lam, JP, BBSMD, FFPH, FFOM, Hon FHKCCM, FHKAM, FRCP
Sir Robert Kotewall Professor in Public HealthSchool of Public Health
The University of Hong Kong
UICC World Cancer CongressMelbourne, Australia
3-6 December 2014
Outline
Obesity and ethnic differences
Obesity and cancer: the evidence
Stages of the obesity epidemic
Conclusions
What is Obesity? Simple yet complex Epidemiologically: general (total, global) versus central -
simplistic definitions and classification Body weight, body fat and body fat percent Body Mass Index most commonly used for general
obesity: only data available in most studies Waist circumference (and Waist Hip Ratio): central
obesity: data available only in more recent studies Cannot distinguish between lean mass and fat mass Different methods to measure body fat: all with limitations
Racial/Ethnic Differences: Body Fat %/Body Mass Index
Indonesians (Malays, Chinese); Singaporean Chinese, Malays and Indians; Hong Kong Chinese
All Asians studied: higher Body Fat % at a lower Body Mass Index compared to Caucasians:
Same Body Mass Index, Asian Body Fat % 3-5% points higher Same Body Fat %, Asian Body Mass Index 3-4% points lower Different Body Fat%/Body Mass Index ratio: body build, i.e. trunk-to-leg
length ratio and slenderness, muscularity
(Deurenberg et al 2002)
Body Fat%/Body Mass Index Ethnic Specific
Relationships between Body Fat % and Body Mass Index differ between ethnic groups
Not all “Asians” are equal: Chinese, Indonesians of Malays ancestry and Thais
Not all “Chinese” are equal: New York, Beijing and Hong Kong
(Deurenberg et al 2002)
Problems and Challenges
Data limited and most reports had small sample size, uncertain representativeness, different methods/assumptions/equations for body fat assessment
Studies with different ethnic groups measured in the same laboratory using the same methodologies are needed
Universal Body Mass Index cut-off points are not appropriate
(Deurenberg et al 2002)
Linear, non-linear, dichotomous
Obesity, adiposity, Body Fat%, Body Mass Index, Waist Circumference, etc are all continuous variables
Linear or nonlinear relationship with disease outcomes
Using cut-off points for obesity (general or central) are needed but would it add to our understanding of the causes and effects of obesity and its mechanisms?
Or would it generate more confusion?
Meta-analysis/systematic reviews on ethnic differences are based on studies with different methods at different time periods in different places with different socio-economic developments
Many studies were not specifically designed to compare ethnic/racial differences
Meta-analysis - heterogeneity
Ethnic/racial differences could be explained by extraneous factors: regional, socioeconomic developments (high, middle and low income countries, or regions within the same countries): gradual developments in many decades versus recent rapid developments; immigration, inter-generational differences
Life course differences (e.g. early life events, weight gain from birth to middle age)
Extraneous and life course factors
Obesity increases risk of many diseases Cardiovascular, type 2 diabetes, some cancers and all-cause
mortality (prospective evidence)
Obesity is associated with many risk factors: dyslipidemia, high blood pressure (cross-sectional associations)
Obesity has many determinants: e.g. diet, sedentary living, physical inactivity, energy balance, socio-economic and obesity control
Longer latency and smaller Risk Ratio for cancer
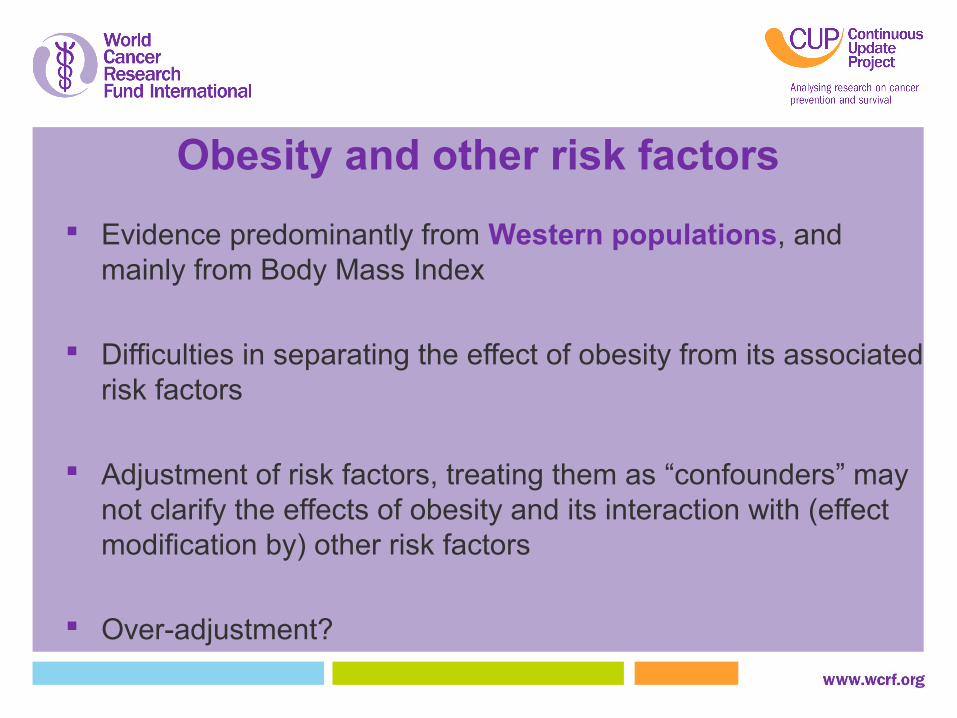
Obesity and other risk factors
Evidence predominantly from Western populations, and mainly from Body Mass Index
Difficulties in separating the effect of obesity from its associated risk factors
Adjustment of risk factors, treating them as “confounders” may not clarify the effects of obesity and its interaction with (effect modification by) other risk factors
Over-adjustment?
Obesity and cancerEvidence from World Cancer Research Fund International
Oesophagus C -Pancreas C CGallbladder ? P -Liver ? -Colorectum ? C CBreast pre-M P (↓) P (↓)Breast post-M P(breast) C CEndometrium C C CKidney P C -Ovary - - PProstate (advanced) - - PC = ConvincingP = Probable? Possible 1997; Limited 2007
Body Mass Index and cancerEvidence from World Cancer Research Fund International
Cancer Body Mass Index Risk Ratio of increased bodyIncrement fatness (95% CI) Report date
Convincing increased riskSubstantial effect on risk unlikely
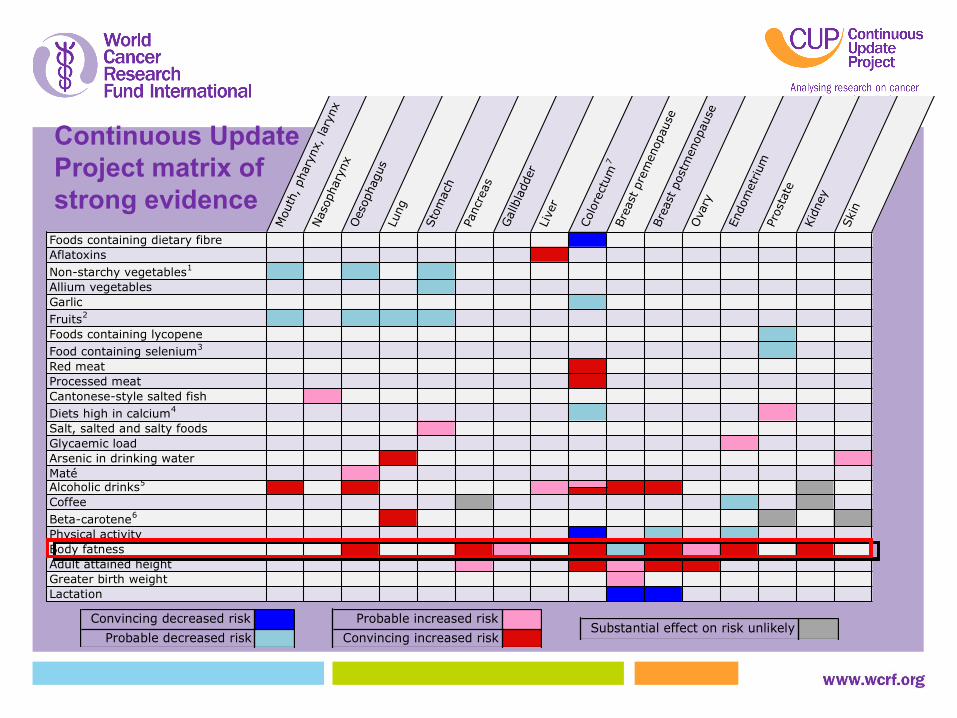
Continuous Update Project matrix of strong evidence
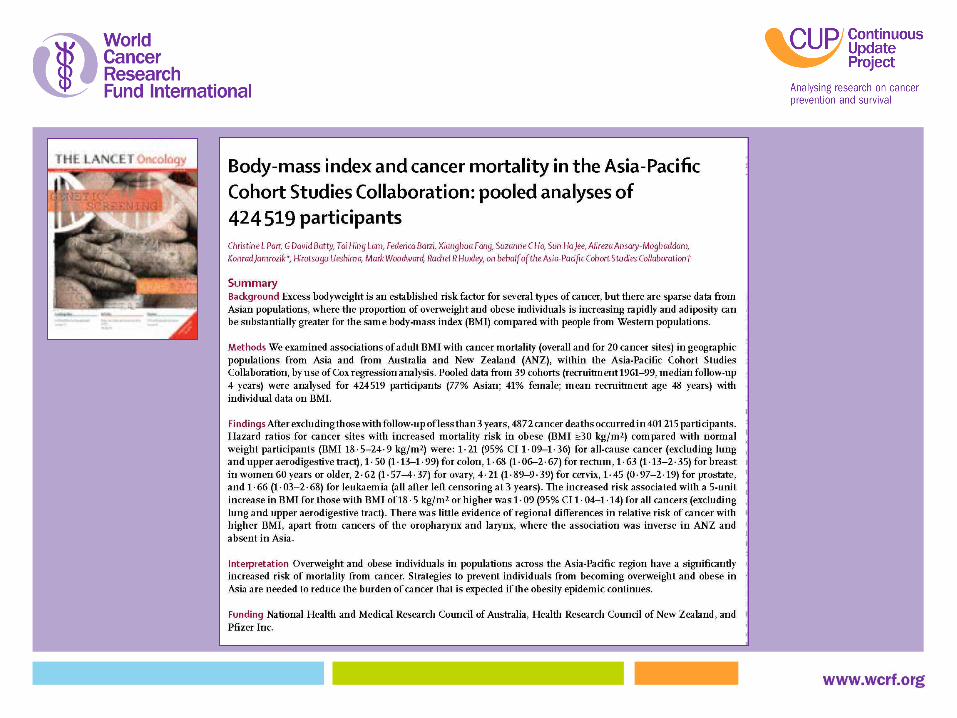
Obesity and cancer: ethnic differences?Asia-Pacific Cohort Studies Collaboration 2010
Body Mass Index and cancer mortality
39 cohorts, 424,519 people (77% Asian)
4,872 cancer deaths from 401,215 (excluding follow up<3y)
(Parr 2010)
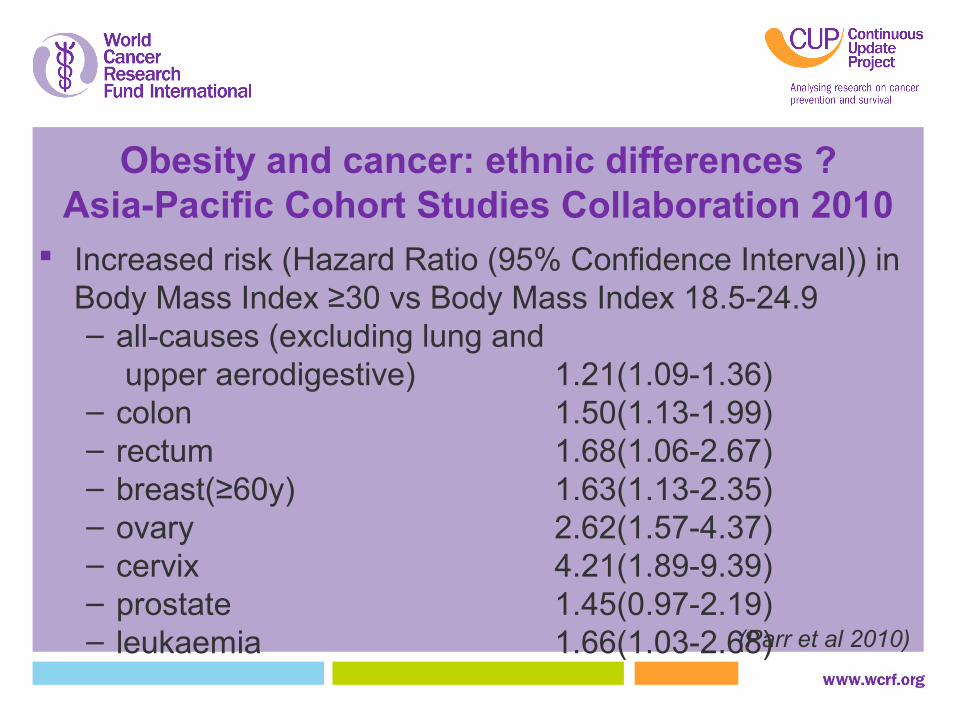
Obesity and cancer: ethnic differences ?Asia-Pacific Cohort Studies Collaboration 2010
Increased risk (Hazard Ratio (95% Confidence Interval)) in Body Mass Index ≥30 vs Body Mass Index 18.5-24.9– all-causes (excluding lung and
upper aerodigestive) 1.21(1.09-1.36)– colon 1.50(1.13-1.99)– rectum 1.68(1.06-2.67)– breast(≥60y) 1.63(1.13-2.35)– ovary 2.62(1.57-4.37)– cervix 4.21(1.89-9.39)– prostate 1.45(0.97-2.19)– leukaemia 1.66(1.03-2.68)(Parr et al 2010)
No regional differences in Hazard Ratio for cancer and Body Mass Index except oropharynx and larynx: inverse in Australia and New Zealand, absent in Asia
Asian data: mainly Japan
Insufficient data on Waist Circumference, Waist Hip Ratio
Test of regional interaction (heterogeneity): low stat. power
(Parr et al 2010)
Obesity and cancer: ethnic differences ?Asia-Pacific Cohort Studies Collaboration 2010
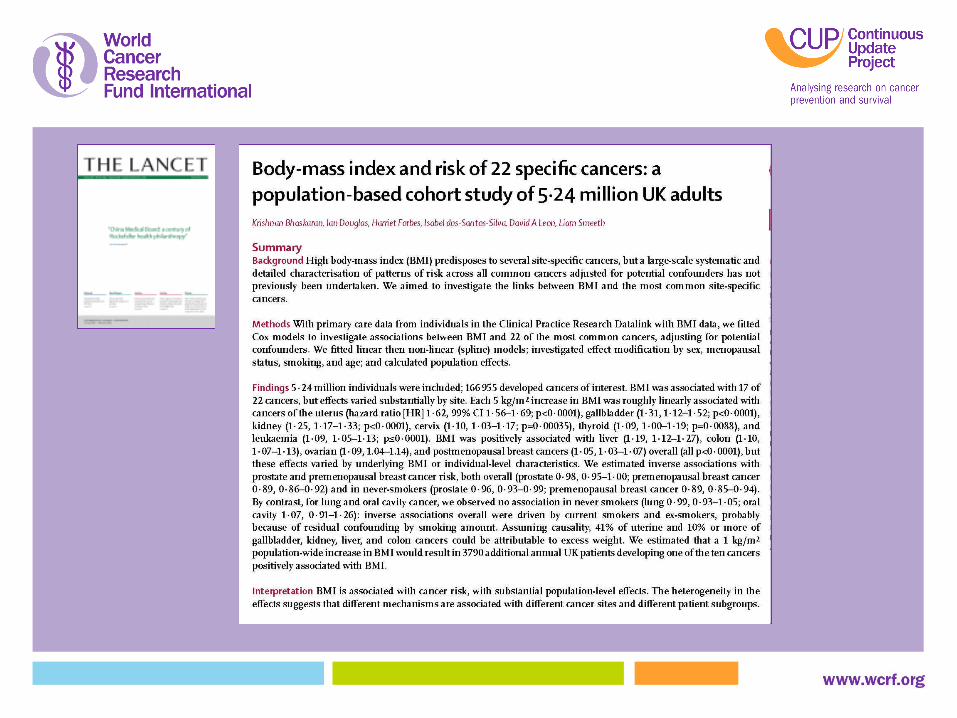
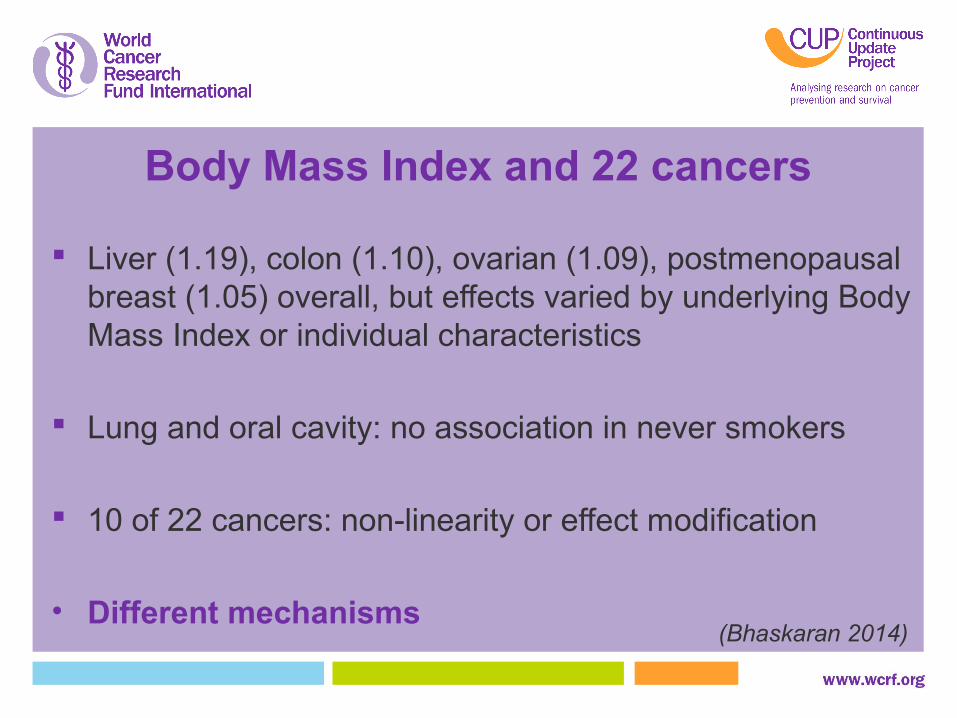
Body Mass Index and 22 cancers
Largest cohort study, 5.24 million UK adults, 166,955 incident cancers
Primary care data (Big data)
BMI associated with 17 of 22 cancers, effects varied substantially
Liver (1.19), colon (1.10), ovarian (1.09), postmenopausal breast (1.05) overall, but effects varied by underlying Body Mass Index or individual characteristics
Lung and oral cavity: no association in never smokers
10 of 22 cancers: non-linearity or effect modification
• Different mechanisms(Bhaskaran 2014)
Body Mass Index and 22 cancers
(Bhaskaran 2014)
(Bhaskaran 2014)
Association between body-mass index (BMI) and specific cancers, allowing for non-linear effects, with 99% CIs
The reference BMI for these plots (with HR fixed as 1·0) was 22 kg/m2. Separate models were fitted for each cancer type, each with a restricted cubic spline for BMI (knots placed at equal percentiles of BMI), adjusted for age, calendar year, diabetes status, alcohol use, smoking (all at time of BMI recording), socioeconomic status (index of multiple deprivation), and stratified by sex. HR=hazard ratio.
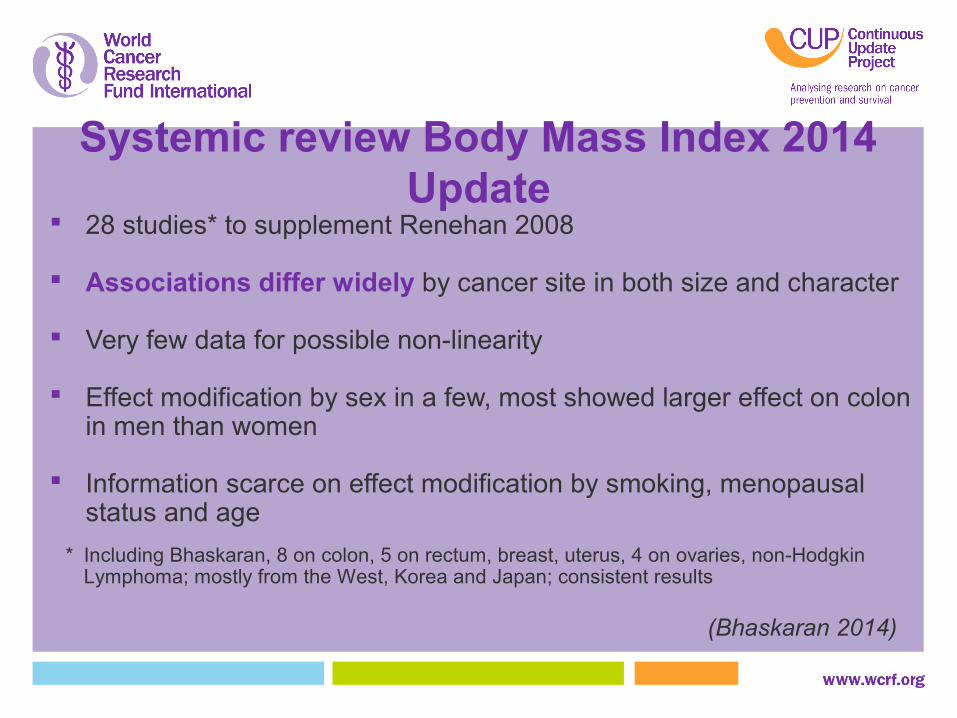
Systemic review Body Mass Index 2014 Update
28 studies* to supplement Renehan 2008
Associations differ widely by cancer site in both size and character
Very few data for possible non-linearity
Effect modification by sex in a few, most showed larger effect on colon in men than women
Information scarce on effect modification by smoking, menopausal status and age
(Bhaskaran 2014)
* Including Bhaskaran, 8 on colon, 5 on rectum, breast, uterus, 4 on ovaries, non-Hodgkin Lymphoma; mostly from the West, Korea and Japan; consistent results
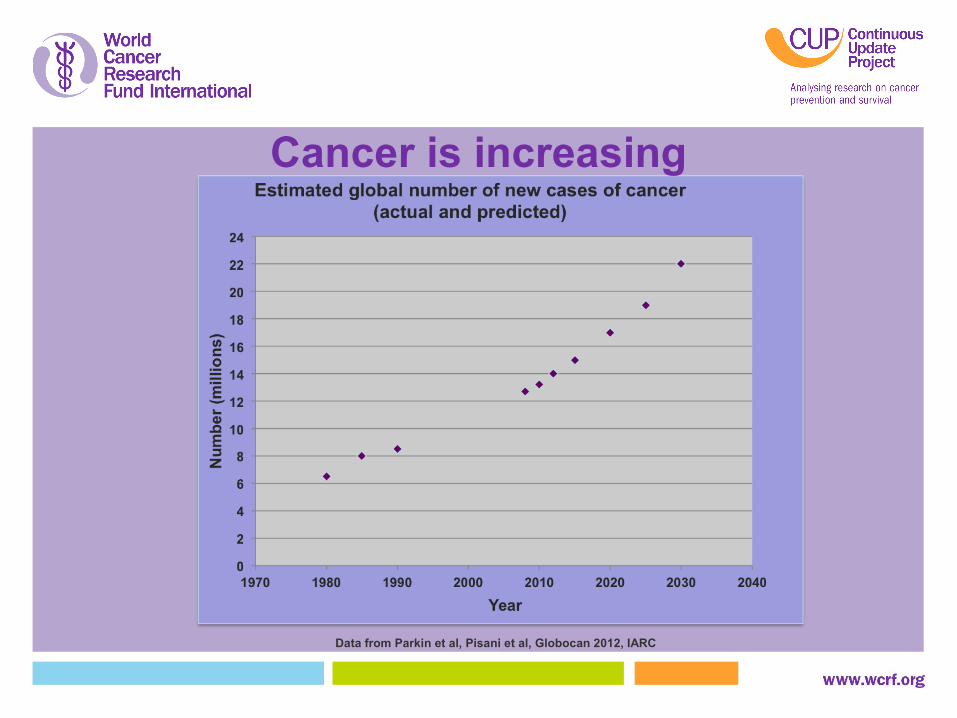
Data from Parkin et al, Pisani et al, Globocan 2012, IARC
Cancer is increasing
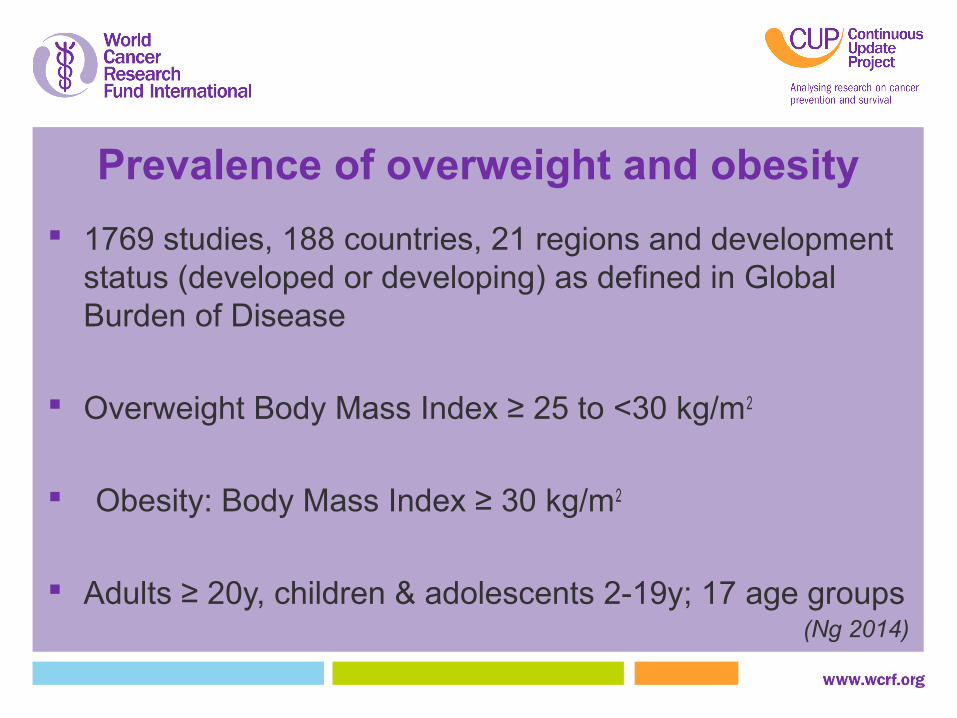
Prevalence of overweight and obesity
1769 studies, 188 countries, 21 regions and development status (developed or developing) as defined in Global Burden of Disease
Overweight Body Mass Index ≥ 25 to <30 kg/m2
Obesity: Body Mass Index ≥ 30 kg/m2
Adults ≥ 20y, children & adolescents 2-19y; 17 age groups(Ng 2014)
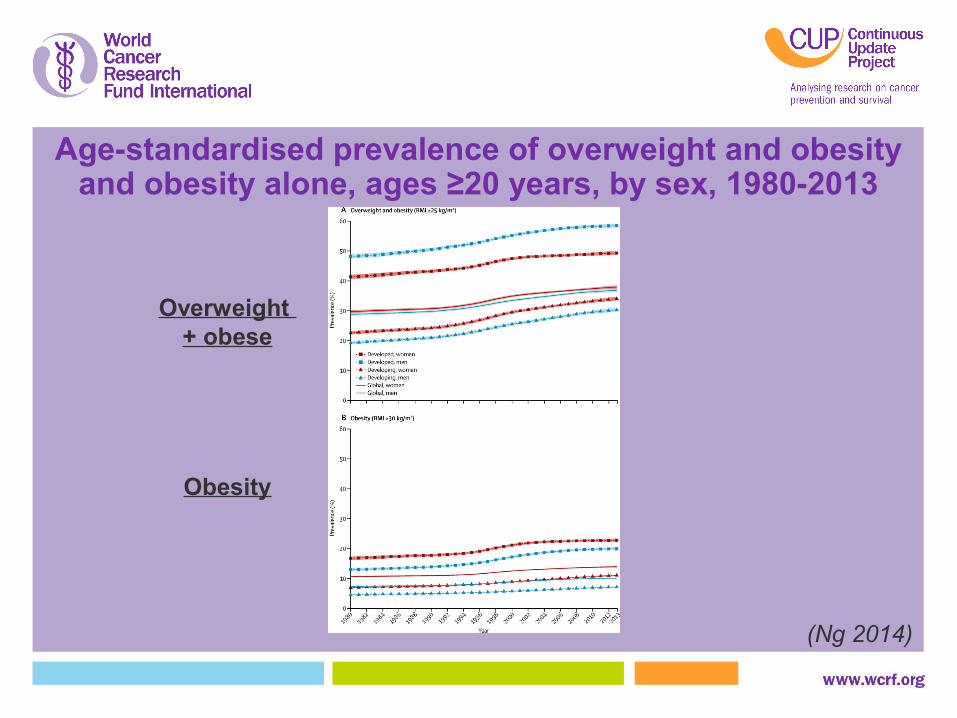
Age-standardised prevalence of overweight and obesityand obesity alone, ages ≥20 years, by sex, 1980-2013
Overweight + obese
Obesity
(Ng 2014)
Adults (≥20), 1980-2013 Body Mass Index ≥ 25 kg/m2 (overweight /obese) Prevalence:
Men: 28.8% to 36.9% (by 28.1%; 0.62 percentage point/y) Women: 29.8% to 38.0% (by 27.5%; 0.63 percentage point/y)
No. of overweight /obese people: 875 to 2100 million; increased by 240%
Prevalence of overweight and obese increasing in both developed and developing countries
2013: higher in women in developed and developing countries Rate of increase of overweight /obese greatest 1992-2002;
slowed down in the past decade, esp developed countries(Ng 2014)
Age-standardised prevalence of overweight and obesity, and obesity alone (based on International Obesity Task Force cutoffs), ages 2-19 years, by sex, 1980-2013
Overweight + Obese
Obesity
(Ng 2014)
Prevalence of overweight/Obese:DevelopedBoys 16.9% to 23.8% (by 40.8%; 0.53 percentage point/y)Girls 16.2% to 22.6% (by 39.5%; 0.49 percentage point/y)DevelopingBoys 8.1% to 12.9% (by 59.3%; by 0.37 percentage point/y)Girls 8.4% to 13.4% (by 59.5%; by 0.38 percentage point/y)
In both developed & developing, small sex differences in levels and trends
(Ng 2014)
Children & adolescents (2-19), 1980-2013
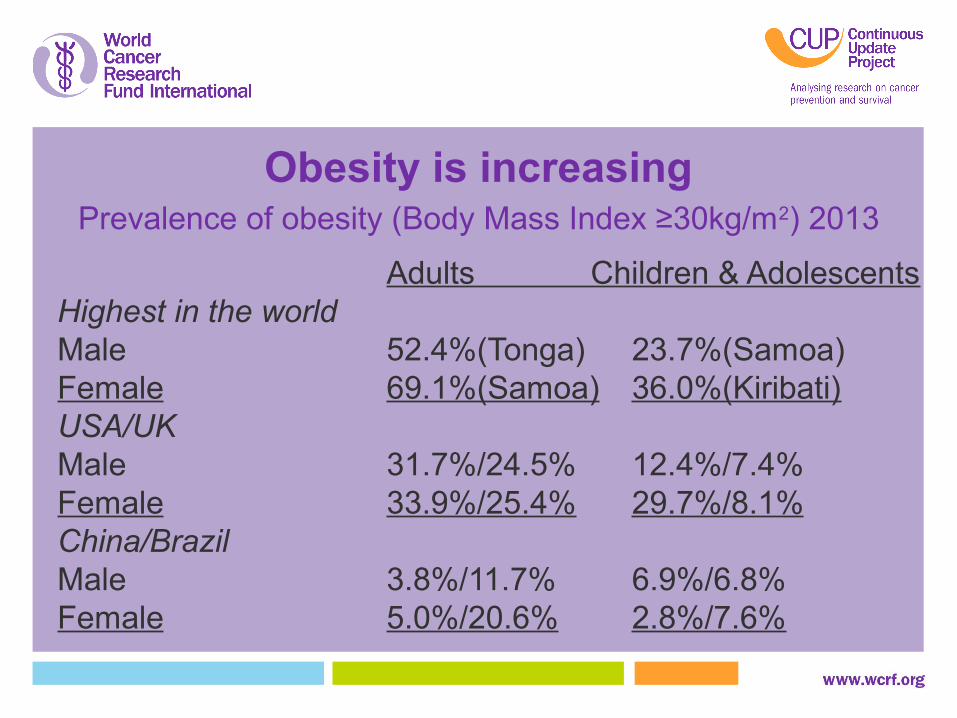
Obesity is increasing
Obesity is increasing
Adults Children & AdolescentsHighest in the worldMale 52.4%(Tonga) 23.7%(Samoa)Female 69.1%(Samoa) 36.0%(Kiribati)USA/UKMale 31.7%/24.5% 12.4%/7.4%Female 33.9%/25.4% 29.7%/8.1%China/BrazilMale 3.8%/11.7% 6.9%/6.8%Female 5.0%/20.6% 2.8%/7.6%
Prevalence of obesity (Body Mass Index ≥30kg/m2) 2013
Global health challenge
Obesity is increasing
No national success stories in 33 years (no significant decreases)
Wide variation in rates of increase from the same initial level
Epidemic might have peaked in developed countries
Others might not reach 40+% as in some developing countries
(Ng 2014)
Can we learn from the Stages of the
Epidemic of Tobacco?
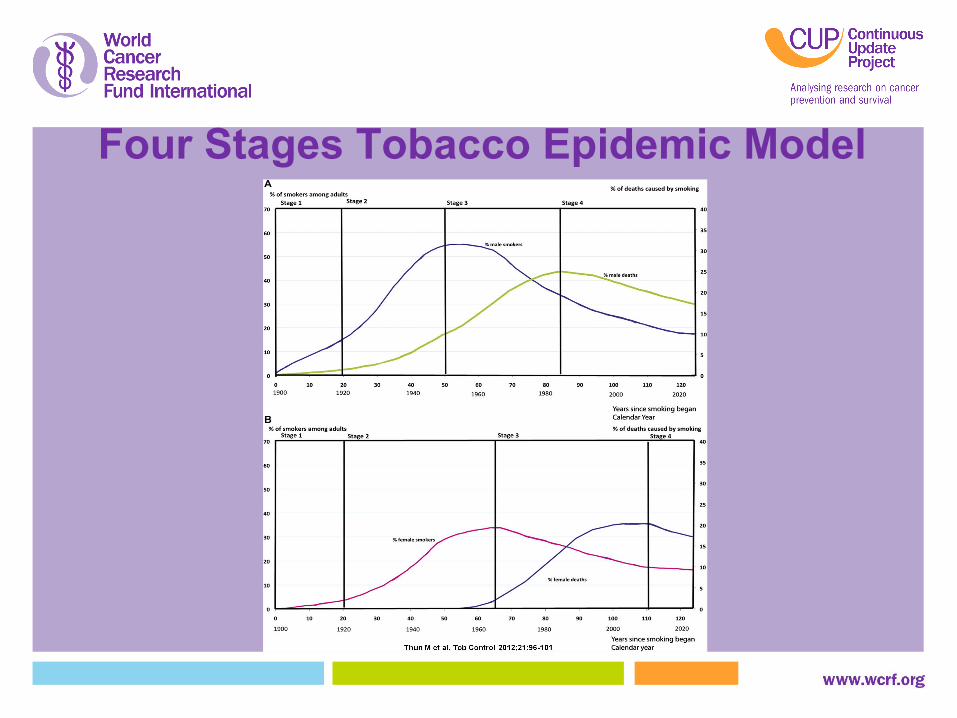
Four Stages Tobacco Epidemic Model
Stages of Tobacco Epidemic
Stage 1 to 4 for different regions/ countries, by sex
A large gap of several decades between peak of tobacco consumption and the peak of tobacco-induced deaths
Full impact of adverse outcomes only observed recently in the West (US/UK); not yet in low-middle income countries (Asia)
Effective tobacco control declining consumption, diseases (e.g. lung cancer) and mortality in the West
Four Stages Obesity Epidemic Model
Hypotheses for obesity epidemicStage 1: Prevalence of obesity up to 20%; 5% death; >30 years.
Stage 2: Rapid increase in obesity to a peak of 60%; 10% death.; 30 years.Stage 3: Downturn in obesity to 30%; deaths peak at 30% death; 40 years.
Stage 4: Prevalence and death slowly decreasing to ≤10%; >60 years.
We are here
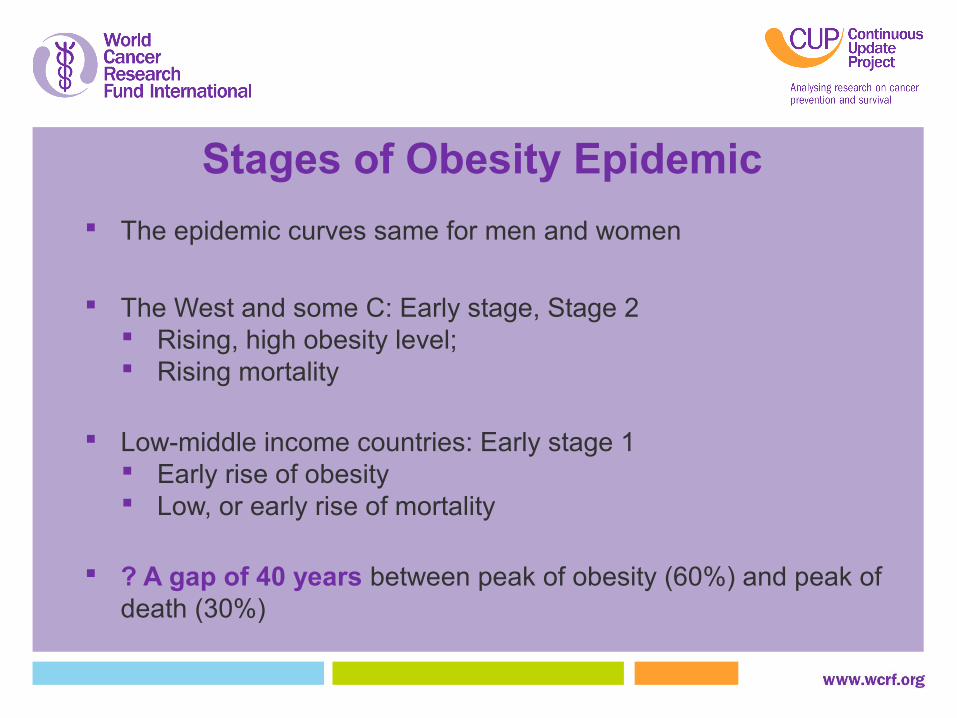
The epidemic curves same for men and women
The West and some C: Early stage, Stage 2 Rising, high obesity level; Rising mortality
Low-middle income countries: Early stage 1 Early rise of obesity Low, or early rise of mortality
? A gap of 40 years between peak of obesity (60%) and peak of death (30%)
Stages of Obesity Epidemic
Need to interpret geographic and ethnic differences taking into account the stages
Caution when pooling results from different stages in meta-analysis
Like tobacco, epidemiological studies at early stages would underestimate the risks and disease burden
What we are seeing is only the beginning and the worse is yet to come. Results observed in the past and now: under-estimate the full impacts in the west; grossly under-estimate in low-middle income countries
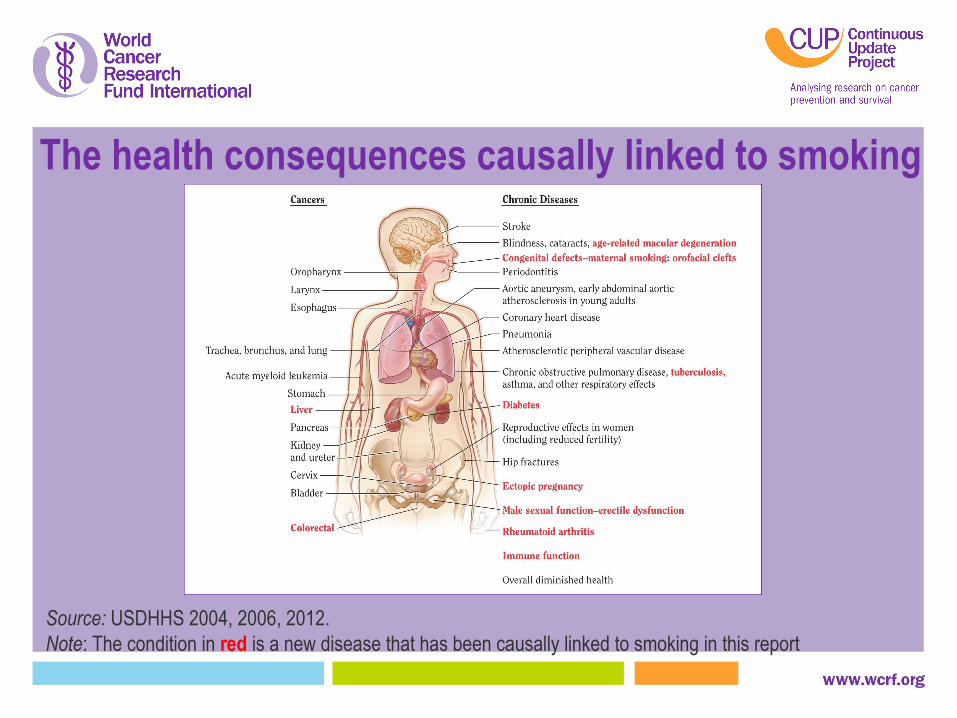
The health consequences causally linked to smoking
Source: USDHHS 2004, 2006, 2012.Note: The condition in red is a new disease that has been causally linked to smoking in this report
More than 50 years for smoking
50 years of USSG Report
List of cancer causally related increasing
Colorectal and liver newly added in 2014
How many years for obesity and cancer?
Measurements of obesity: Body Mass Index, waist circumference, waist-to-hip ratio, waist-to-height ratio, body fat percentage and others: more complex than tobacco
Different definitions of obesity using Body Mass Index and other indices. Health effects: Smoking is a very strong cause (almost exclusively) for lung
cancer. Obesity does not have a single disease predominantly caused by obesity
Benefits of quitting smoking: great and quick; benefits of obesity reduction not clear
Duration of obesity, especially since early childhood, is more important than “baseline” obesity
Early stage of obesity research Further research will reveal more harms from obesity, especially long term
obesity since early life
Obesity is more complex than tobacco
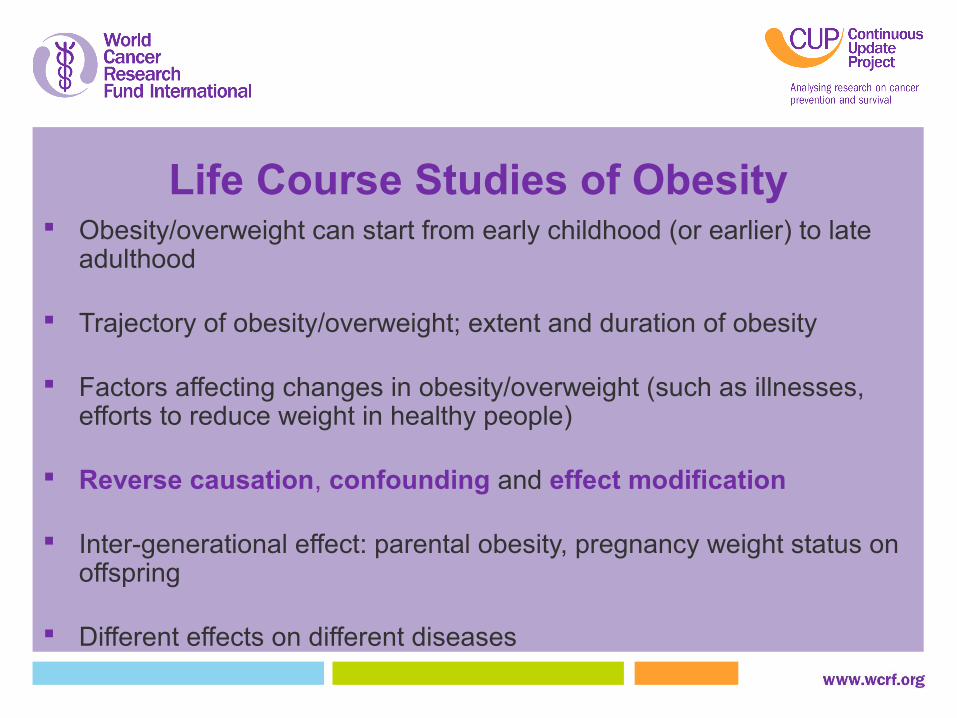
Life Course Studies of Obesity Obesity/overweight can start from early childhood (or earlier) to late
adulthood
Trajectory of obesity/overweight; extent and duration of obesity
Factors affecting changes in obesity/overweight (such as illnesses, efforts to reduce weight in healthy people)
Reverse causation, confounding and effect modification
Inter-generational effect: parental obesity, pregnancy weight status on offspring
Different effects on different diseases
Risk reversal of weight/obesity reduction
Lack of results; studies needed:
Trajectory of obesity reduction, relapse
Population trends of reducing obesity
Benefits from weight/obesity reduction (observational)
Effects of interventions to reduce weight/reduction
Interventions: individual and public health
Benefits: general and specific diseases; individual and disease burden
is needed for the
Stages of Epidemic Life Course Obesity Research (SELCOR)
Growing andComplex Global Epidemic of Obesity
and for
Different populations, regions,races and ethnicity
Prevention and Obesity controlA greater and more complex challenge than tobacco control
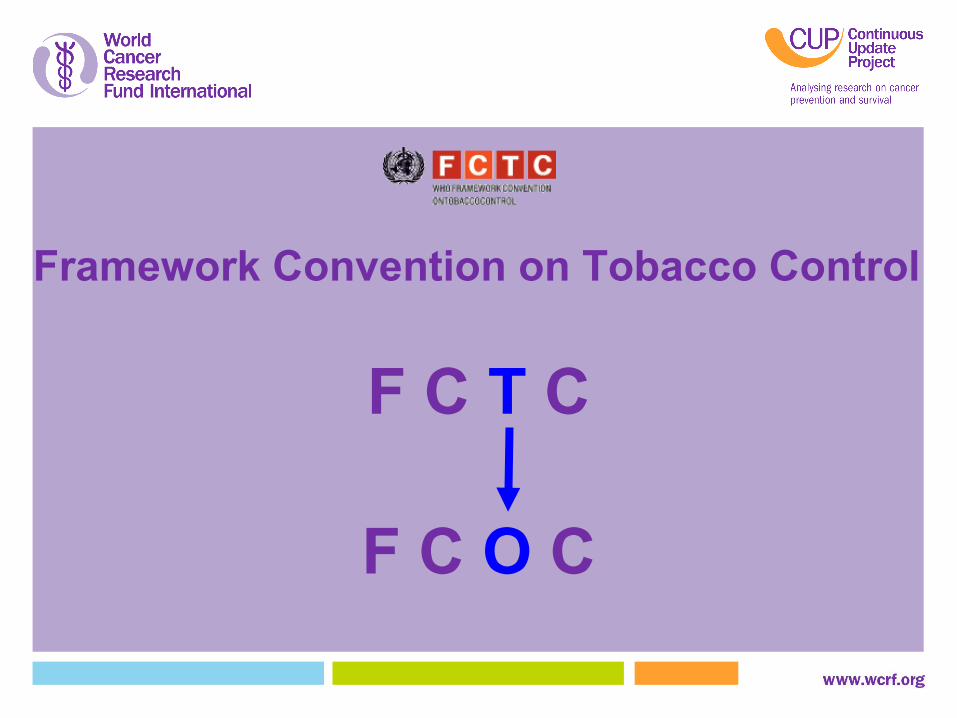
1. We advocate for a Framework Convention on Obesity Control (FCOC)
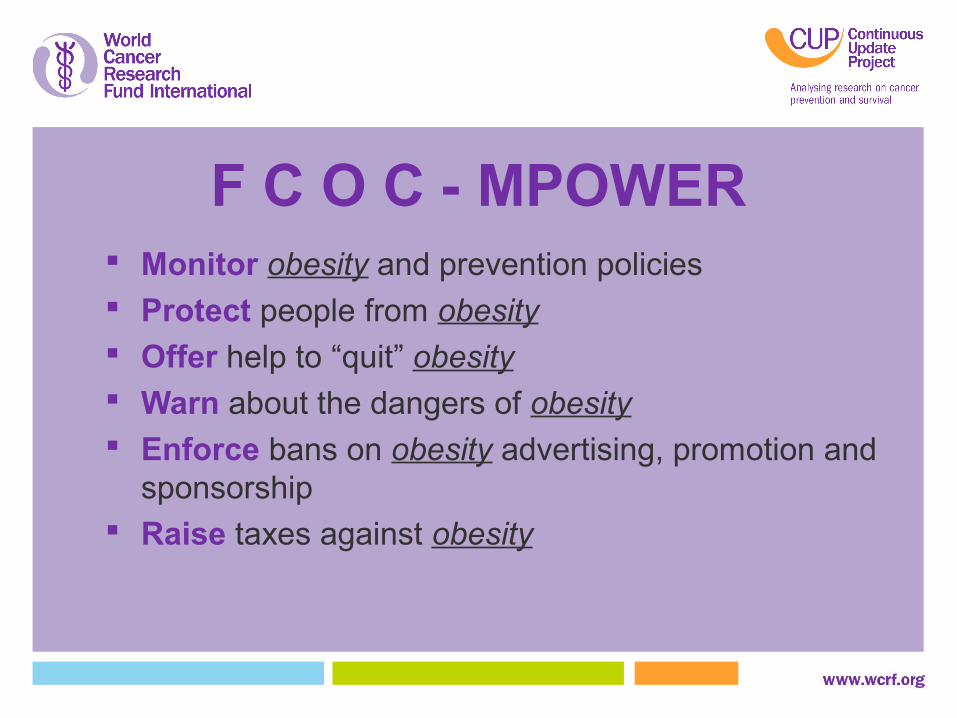
2. The MPOWER strategies against tobacco are immediately applicable by replacing the word “tobacco” with “obesity”
2. We need results on health benefits (risk reversal) from obesity reduction
World Cancer Research Fund International Estimates of preventable fraction of specific cancer sites from body fatness
Monitor smoking and prevention policies Protect people from smoking Offer help to “quit” smoking Warn about the dangers of smoking Enforce bans on smoking advertising, promotion
and sponsorship Raise taxes against smoking
F C T C - MPOWER
Monitor obesity and prevention policies Protect people from obesity Offer help to “quit” obesity Warn about the dangers of obesity Enforce bans on obesity advertising, promotion and
sponsorship Raise taxes against obesity
F C O C - MPOWER
Conclusions
Ethnic differences on Body Fat%/Body Mass Index; but not clear on the association between obesity and cancer
Obesity, cancer and evidence that obesity causes cancer increasing
Now at early stages of obesity epidemic: risks and disease burden under-estimated
Life-course research needed Much can be prevented: MPOWER and FCOC Health benefits from obesity reduction: decades later
For further information
@wcrfint
facebook.com/wcrfint
www.wcrf.org
Professor TH LamThe School of Public Health University of Hong Kong