Ethnic Identity and Labor-Market Outcomes of Immigrants in Europe 1 by Alberto Bisin 2 , Eleonora Patacchini 3 , Thierry Verdier 4 , and Yves Zenou 5 May 26, 2010 Abstract Using data from the European Social Survey, we analyze the relationship between ethnic identity and employment prospects of immigrants coming from non-European countries. We find that a strong ethnic identity is associated with a lower probability of being employed. When we differentiate between first and second generations of immigrants, our evidence reveals signs of a cultural and economic integration of immigrants in Europe. However, when a strong ethnic sentiment is preserved, the employment penalty is amplified. Our results also show that the relationship between ethnic identity and employment prospects may depend on the type of integration and labor-market policies implemented in the country where the immigrant lives. Key words: ethnic identity, first- and second-generation immigrants, integration policies, labor-market policies. JEL Classification: A14, J15, J18, Z19. 1 We thank Jan van Ours, Philippe Martin, Tullio Jappelli, Philip Lane and the participants of the Economic Policy Panel meeting in Madrid on April 23-24, 2010 for very helpful comments. We are also grateful to the participants of the lunch seminar of the Public Policy Institute of California (PPIC) in San Francisco, in particular, Jed Kolko and David Neumark for their interesting comments. 2 New York University, USA. E-mail: [email protected]3 Universita’ di Roma “La Sapienza”, Italy. E-mail: [email protected]4 Paris School of Economics (PSE), France, and CEPR. E-mail: [email protected]5 Corresponding author. Stockholm University and Research Institute of Industrial Economics (IFN), Sweden. E-mail: [email protected].
Transcript
Ethnic Identity and Labor-Market Outcomes of
Immigrants in Europe1
by
Alberto Bisin2, Eleonora Patacchini3, Thierry Verdier4, and Yves Zenou5
May 26, 2010
Abstract
Using data from the European Social Survey, we analyze the relationship between ethnic identity and employment prospects of immigrants coming from non-European countries. We find that a strong ethnic identity is associated with a lower probability of being employed. When we differentiate between first and second generations of immigrants, our evidence reveals signs of a cultural and economic integration of immigrants in Europe. However, when a strong ethnic sentiment is preserved, the employment penalty is amplified. Our results also show that the relationship between ethnic identity and employment prospects may depend on the type of integration and labor-market policies implemented in the country where the immigrant lives.
1 We thank Jan van Ours, Philippe Martin, Tullio Jappelli, Philip Lane and the participants of the Economic Policy Panel meeting in Madrid on April 23-24, 2010 for very helpful comments. We are also grateful to the participants of the lunch seminar of the Public Policy Institute of California (PPIC) in San Francisco, in particular, Jed Kolko and David Neumark for their interesting comments. 2 New York University, USA. E-mail: [email protected] 3 Universita’ di Roma “La Sapienza”, Italy. E-mail: [email protected] 4 Paris School of Economics (PSE), France, and CEPR. E-mail: [email protected] 5 Corresponding author. Stockholm University and Research Institute of Industrial Economics (IFN), Sweden. E-mail: [email protected].
2
1 Introduction An intense political and intellectual debate is taking place in Europe around
migration issues. Rather than being centered on the economic costs and benefits of such
inflows, the debate has instead focused on the perceived costs and benefits of cultural
diversity.6 This debate has been particularly intense after the series of violent disturbances
in various cities and towns in England (e.g. Oldham, Leeds, Burnley, Bradford) in the
spring and early summer of 2001, involving young British Asian men, and the riots in Paris’
suburbs in November 2005 where most of the rioters were the French-born children of
immigrants from African countries.
Though a range of potential explanations were proposed, two received considerable
attention in political circles and also in the media. The first explanation put forward the
lack of a shared civic identity that could bring together diverse communities. The second
one was the adverse labor market outcomes of the ethnic groups, which experienced very high
levels of unemployment.
The attention paid to these factors (ethnic identity7 and adverse labor-market
outcomes of ethnic minorities) is relatively novel in Europe and does represent a departure
from the long-standing debate which has tended to emphasize racial discrimination as the
key explanation of ethnic disadvantage. The debate in the United States on these issues, at
both a policy and academic level, is of longer standing. One theme that has emerged from
the academic literature is that some individuals in ethnic groups may “choose” to adopt
what are termed “oppositional” identities, that is, some actively reject the dominant ethnic
(e.g., white) behavioral norms while others totally assimilate to it (see, in particular,
Ainsworth-Darnell and Downey, 1998). Studies in the US have found, for example, that
African American students in poor areas may be ambivalent about learning standard
English and performing well at school because this may be regarded as “acting white” and
Akerlof, 1997; Ogbu, 1997; Austen-Smith and Fryer, 2005; Selod and Zenou, 2006; Battu,
McDonald and Zenou, 2007; Bisin et al., 2009a; Fryer and Torelli, 2010). In some
6 Huntington (1996)'s notion of clash of civilization has served as a focal point for those who believe multi-cultural societies are simply not feasible. In his book, Sen (2000) has opposed these views. 7 For definitions of “ethnic identity” and overviews on this issue, see Akerlof and Kranton (2010).
3
instances, oppositional identities produce significant economic and social conflicts and can
lead to adverse labor-market outcomes for ethnic minorities. This is a good example that
can explain why a strong ethnic identity can lead to adverse labor-market outcomes.
In the present study, we contribute to such a debate by providing some evidence on
the relationship between ethnic identity and labor-market outcomes of the immigrants in Europe.
Using data from the European Social Survey (ESS), we are able to differentiate between first
and second generation of immigrants and collect some suggestive results on the patterns of
cultural and economic integration of immigrants in Europe.
There are very few studies analyzing this relationship. Our contribution to this
literature is as follows. First, we analyze the relationship between ethnic identity and
employment outcomes for immigrants moving to Europe from non-European countries,
using information on 20 different European countries. Second, we are able to differentiate
between first and second generation immigrants, which enables us to study their cultural
and economic assimilation patterns. Finally, we look at policy issues analyzing how
integration policies as well as labor-market policies and conditions affect the relationship
between ethnic identity and labor-market outcomes.
The paper unfolds as follows. In Section 2, we give some figures of the
employment situation of immigrants in Europe. Section 3 discusses the relationship of our
paper with the literature and gives some theoretical foundations of this relationship.
Section 4 describes the ESS data and details, in particular, how we identify the different
generations of immigrants and how we measure ethnic identity. Section 5 empirically
investigates the relationship between ethnic identity and employment outcomes of
immigrants in Europe. In Section 6, we analyze the different integration and labor-market
policies implemented in Europe and relate such policies to our research questions. Finally,
Section 7 contains some concluding remarks.
4
2 The labor market situation of immigrants to Europe
In all European countries, immigrants find it hard to enter the labor market. The
labor market in itself is decisive for how individuals who have immigrated are integrated in
their new countries. Immigrants generally have a weaker position on the labor market than
natives. This is clearly shown in Table 1, which indicates the relative position of immigrants
on the labor market in 11 European countries.
[Insert Table 1 here]
In all countries, unemployment is larger among individuals who have immigrated
than for the native population. There are large differences between countries, however. In
Sweden, for example, immigrants are 2.5 times more unemployed as compared to the
natives. The corresponding figure for Britain is 1.67 in 2004. With some exceptions, labor
market participation and the share of employed are also lower for individuals who have
immigrated. Denmark stands out as the country where the labor market participation of
immigrants and their share of the employed are the lowest as compared to the native
population. Also Sweden belongs to the group of countries where the situation of
immigrants on the labor market is relatively weak overall. Other countries where
immigrants have a particularly weak position on the labor market as compared to natives
are the Netherlands, Belgium and, to a certain extent, Finland.
The motivating question of this article is why immigrants have such a hard time
entering the European labor market. There are many explanations but we will mainly focus
on how ethnic identity and integration as well as labor-market policies in Europe can affect
this outcome. In the next section, we expose the theoretical mechanisms that can explain
the negative relationship between identity and employment.
5
3 Theoretical mechanisms and related literature
3.1 Ethnic identity and labor-market outcomes: Theoretical
mechanisms
There are in fact few studies that have analyzed the connection between ethnic
identity and labor market outcomes for individuals with a foreign background.
Even though the mechanisms are slightly different, there are some theoretical models
that have analyzed the link between ethnic identity and education. Austen-Smith and Fryer
(2005) propose a model where ethnic individuals are defined by two types: her social type,
reflecting her compatibility to the group, and her economic type, reflecting her intrinsic ability
or market potential. At the same time, other things equal, all social types strictly prefer to
be accepted rather than rejected by their peer group. And, just as group acceptance is
valuable to the individual, individuals yield value to the group through consumption
externalities, community policing, so on and so forth. Peer groups, however, only want to
accept members who are socially compatible group members in that they can be depended
upon to support the group in difficult times. Austen-Smith and Fryer (2005) show that
there is tension faced by ethnic minorities between signalling their type to the outside labor
market and signalling their type to their peers: signals that induce high wages can be signals
that induce peer rejection. Patacchini and Zenou (2006) develops a different model where
ethnic students prefer to have friends of the same race (preference bias) but value white
friends because their parents have higher human capital levels, inducing better grades. They
show that having a higher percentage of same-race friends (measure of identity) has a
positive effect of white teenagers’ school performance while having a negative effect on
blacks’ school performance. As a result, some black students will end up having most of
their friends who are whites while others will only have black friends.
Finally, Battu, McDonald and Zenou (2007) propose a model where the link
between ethnic identity and employment outcomes is analyzed. In this model, non-white
individuals are defined with respect to their social environment (family, friends, neighbors)
and their attachments to their culture of origin (religion, language), and jobs are mainly
found through social networks. Non-whites must decide to totally or partially adopt white
6
culture or to reject it by anticipating the implications of this choice on their labor market
outcomes, given that whites have a better social network. There are two countervailing
forces. On the one hand, non-whites would like to mainly interact with same-race friends
and thus to reject the white’s norm (preference bias). One the other, interacting with whites
is beneficial because non-white workers may then benefit from the high quality of whites’
social networks since the latter do not suffer from discrimination. They find that ex ante
identical ethnic workers can end up choosing “oppositional identities” (as defined above),
i.e. some nonwhites reject while others conform to the white’s norm. Their results depend
on the value of the intensity of peer pressure, the wage premium of being employed, and
the marginal impact of the identity choice on the non-white unemployment rate.
3.2 Ethnic identity and labor-market outcomes: Empirical studies
There are some empirical papers that have tested the relationship between ethnic
identity and employment outcomes. Constant et al. (2006), Zimmermann et al. (2007)
investigate the connection between the different degrees of identification to the majority
and minority cultures (i.e. integration, assimilation, separation and marginalization; see
Berry, 1997) and the probability of being employed in Germany. They find no systematic
differences in employment between assimilated and integrated men, but they do find
differences between assimilated and integrated women, at the advantage of the latter. At
the same time, the results show that the probability of being employed, independent of sex,
is significantly lower for those who are separated and marginalized as compared to those
who are assimilated. This can be interpreted as a strong minority identity not having any
negative effect on the chances of being employed, given that it is combined with a strong
majority identity. Just like the identification with the German majority culture can increase
the probability of being employed, being employed might increase the feeling of affinity
with German culture. Results showing that those who identify with the majority culture are
employed to a larger extent might simply be due to these individuals having had a good
labor market situation in a historical perspective. First, this might have increased the
probability of identifying with the majority culture and second, it might have increased the
probability of future employment.
In the same country-context, i.e. Germany, Casey and Dustmann (2010) study the
formation of identity with home and host countries and the association between both
7
identities and labor market outcomes. The uniqueness of their dataset, which is a long
panel that oversamples individuals with a foreign background and contains information for
both parents and their children on ethnic group identity, also allows them to study the
intergenerational transmission of identity from a generation to the next. Their findings
denote a strong transmission of ethnic traits between parents and children, as well as signs
of a relationship between ethnic identity and labor market outcomes, although the effect
does not appear to be particularly pronounced.
Nekby and Rödin (2010) study the relation between cultural identity and
employment in Sweden. The results show that there are only small differences in
employment between individuals with an integrated identity and those with an assimilated
identity. Those who are integrated have a three percentage point lower chance of being
employed as compared to those who are assimilated. But individuals with the separated
identity have considerably lower chances of becoming employed and an eight percentage
point lower probability of being employed than those who are assimilated. The differences
in employment between different cultural identities are a male phenomenon. The results
for men are similar to those that apply for the whole group while the results for women do
not show any systematic differences between the different cultural identities as concerns
employment. The differences among men are small between the integrated and the
assimilated identity while the separated identity has considerably lower chances of
employment (9.5 percentage points) as compared to the assimilated identity.
Finally, for the UK, Battu and Zenou (2009) undertake a simple empirical
investigation of the relationship between an oppositional identity and employment in the
labor market in Britain. Their results indicate that the social environment of individuals has
an influence on their identity choice and that those non-whites who have preferences that
accord with being oppositional are likely to experience an employment penalty. They
actually have a seven percentage point lower possibility of being employed as compared to
those who are not oppositional. There is also a cost of being against mixed marriages;
people who care about whether a close relative would like to marry a white person also
have a lower probability of being employed.
All studies imply that there is a strong identification with the majority culture that is
important in order to succeed on the labor market and that the degree of identification
with the cultural background seems to be less important.
8
So far, we have examined papers that only consider “subjective” measures of
identity, not “objective” measures like intermarriage rates,8 racial choice of friends, fertility
rates, gender gaps, etc... There is a literature that looks at these issues (Meng and Gregory,
2005; Chiswick and Houseworth, 2008; Bisin et al., 2009b; Furtado and Theodoropoulos,
2009) and relates, in particular, these “objective” measures to employment, earnings. These
papers also find that there is a penalty in terms of outcomes for ethnic minorities who have
a strong identity as determined by these “objective” measures.
In this paper, we investigate the relationships between the identity of non-EU
immigrants in Europe and their labor-market outcomes. The main difference with the
previous studies is that we will use data on most of the 25 European countries (and not on
only one country) and, as a result, be able to draw some general policy implications for
Europe. The drawback is that the information on some variables is not as good as in the
country-specific dataset used in the studies discussed above.
4 Data
We use data from the European Social Survey (ESS), which is a European Union
funded survey conducted in most European countries every two years, starting from 2002.
The questionnaire comprises ‘core’ items (which are repeated in all rounds) aiming at
monitoring change and continuity in a wide range of socio-economic, socio-political, socio-
psychological and socio-demographic variables and ‘rotating’ items (which vary from round
to round) aiming instead at deepening the understanding of some special topics. A
supplementary questionnaire is also administered to all respondents, asking questions on
human values.9 In particular, the ESS contains information on the country of birth of both
the respondent and the parents, which allows us to precisely identify the immigrants as well
as to distinguish between first and second generation of immigrants. It does not, however,
oversample the individuals with a foreign background. As a result, the limited sizes of the
immigrant sample in the different European countries do not allow us to differentiate
8 Inter-marriage is considered to be a measure of social assimilation and also a factor producing it (Pagnini and Morgan, 1990). 9 The European Social Survey is academically led and, as a result, has used a methodologically rigorous multinational design that guarantees representativeness. A slightly modified formulation of the main
9
immigrants by ethnic groups. We reduce the heterogeneity within the immigrant population
in Europe by focusing our analysis on immigrants coming from non-European (non-EU)
countries only. We classify the respondents as immigrants if one or both parents are born in
a non-EU country. We then define first generation immigrants if born in a non-EU country
and second generation immigrants if born in the “host” country. We bundle the countries
of origin by geographical area, following the classification provided in the first round of the
ESS, where the information on the country of birth is limited to the continent of birth:
“Asia”, “Africa”, “North America”, “South America and Caribbeans”, “Australasia”.10
We use the cumulative ESS data, which pools the common information from the first
to the third ESS round. It includes countries participating in at least two rounds, ending up
with a total of 24 countries and roughly 125,000 individuals. Because we are ultimately
interested in investigating the relationship between ethnic identity and employment
prospects, we consider individuals between 16 and 64 years only. We also exclude countries
for which the number of surveyed non-EU immigrants is particularly small (lower than 10
people). Our final sample consists of approximately 85,000 individuals covering the
countries: Austria, Belgium, Denmark, Finland, France, Germany, Greece, Hungary,
Switzerland, UK, and Ukraine. Immigrants represent about 4 percent of our sample, of
which roughly 64 percent belong to the first generation and 36 percent to the second
generation. Immigrants mainly come from Africa (38%)- predominantly from Maghreb-,
from Asia (37%) and South America and Caribbean states to a lesser extent (16%) (see
Table A1 in the Appendix).
The ESS provides information on different dimensions of ethnic identity. In
particular, it contains direct questions about the “importance of religion”, the “importance
of following traditions and customs”, and the “language most often spoken at home”. It
does not contain, however, information on the relationship between ethnic identity and the
identity of the “majority” group where this person lives. For example, Bisin et al. (2008) as
well as Battu and Zenou (2010) use the UK Fourth National Survey of Ethnic Minorities
(FNSEM) collected in 1993/94 by the Policy Studies Institute (PSI), which deliberately
over-samples ethnic groups and contains extensive information on various issues
questions is also administered to a sub-sample of respondents in order to determine measurement errors and the reliability of the items.
10
surrounding ethnic identity and preferences. For example, in this dataset, ethnic minorities
had to choose between “Strongly agree”, “Agree”, “Disagree”, “Strongly disagree”,
“Neither disagree or agree” to answer the following questions: “In many ways I think of
myself as British” and “In many ways I think of myself as ….[Respondent’s ethnic group]”.
We measure here the strength of ethnic identity for each individual using a
composite index, which is derived on the basis of the answers to the questions related to
the three dimensions of ethnic identity mentioned above. The first variable “importance of
religion” is taken from the direct ESS question: “How religious would you say you are?”,
with a scale of 1 to 10, with 0 being “not religious at all” and 10 “very religious”. For
immigrants coming to Europe from non-EU countries, it seems reasonable to assume that
the attachment to religion is a measure of identity, especially for groups like Muslims, Sikhs
and Buddhists where religion is a way of keeping traditions from the home country (Bisin
et al., 2008).11
The second variable “importance of following traditions and customs” is taken
from the ESS section on human values that asks the following question: “How much like
you is this person? Tradition is important to him. He tries to follow the customs handed
down by his religion or his family.” The possible answers are: “Very much like me”, “Like
me”, “Somewhat like me”, “A little like me”, “Not like me”, “Not like me at all”, re-coded
with a scale 6 to 1. Finally, our last indicator of ethnic identity “language most often spoken
at home” is instead a dichotomous variable taking value 1 if the language most often
spoken at home is different from the national language (and also different from English)
and 0 otherwise.12 ,13
10 “Australasia” includes Australia, New Zealand, and neighboring islands in the Pacific Ocean. 11 In the case of the United States, it is a well-established that religion activities have an important impact on Blacks’ sense of identity. Indeed, the Black church is the anchoring institution in the African American community (Lincoln and Mamiya, 1990; Myrdal, 1944). The church acts simultaneously as a school, a benevolent society, a political organization, a spiritual base, etc. Black churches are significantly more likely than White congregations to participate in civil rights activities. For example, using data from the 1979-1980 national Survey of Black Americans, Ellison (1993) shows that participation in church communities fosters positive self-perception of blackness through the interpersonal supportiveness and positive reflected appraisals of coreligionsists. 12 There is a literature that emphasizes the importance of English language fluency (Chiswick, 1978; McManus et al. 1983; Borjas, 1994; Dustmann and Fabbri, 2003) and religion and culture (Iannaccone, 1998; Lazear, 1999; Brown, 2000) for the degree of assimilation and labor market outcomes of immigrants. 13 In the ESS, there are other interesting questions related to ethnic identity, such as those asking opinions on, for example, if it is good for a country if almost everyone shares the same customs and traditions or if immigrants should be allowed to educate their children in their own separate schools if they wish. Unfortunately, these questions are only available in the first wave (special module on immigration), whereas we need to pool all 3 waves to get a large enough size of the immigrant sample.
11
The composite index of ethnic identity is obtained using a standard factor analysis
which suggests retaining only one combined variable as an appropriate summary of the
three basic indicators. It explains roughly 50% of the total variance. The factor loadings
show that it is almost equally driven by “importance of religion” and “importance of
following traditions and customs” whereas “language most often spoken at home”
contributes to a lesser extent.14
5 Ethnic identity and employment outcomes
Table 2 displays the immigrant to native gap in terms of identity, education and
employment prospects, distinguishing between first and second generation of immigrants
and regions of origin. We include as controls, where relevant, the level of education,
gender, a quadratic function of age, years since arrival in the (host) country and (host)
country dummies.15 Table 2 reveals that first-generation immigrants have a higher level of
identity than native Europeans, regardless of the region of origin. They also tend to be less
educated than Europeans and, controlling for education, they have a lower probability of
finding a job than native Europeans. There is, in particular, a statistically significant
(negative) gap for those coming from Africa and Asia. Not surprisingly, immigrants from
North America have a higher education level than that of native Europeans. This does not,
however, translate into a higher employment probability since there is a negative (and
statistically significant) gap with respect to Europeans, which is similar to that of Africans
and Asians. Turning to the second-generation immigrants, only for immigrants coming
from Africa and Asia, we still find a stronger (and statistical significant) sense of ethnic
identity as compared to Europeans. Interestingly, this is not anymore true for second-
generation immigrants whose parents came from North-America, South America and the
Caribbean, and Australasia. Moreover, the education level of the second-generation
immigrants tends to be higher than that of native European, with a statistically significant
(positive) difference for those coming from Africa and Australasia. This educational
14 The whole set of results of this preliminary analysis are not reported here for brevity. They remain available upon request. 15 Employment prospects are measured using a dummy equals to 1 if the individual is in paid work (including self-employment) and 0 otherwise. Unfortunately the ESS does not provide information on wages (only a
12
advantage does not seem to be translated into a higher employment probability since we
still find lower levels of employments for these immigrants. In particular, the second-
generation immigrants coming from Africa, which are one of the two groups with a
significantly higher education level with respect to natives, appear to be more penalized in
terms of employment prospects. This could be an indication of discrimination. As noted
above, these second-generation immigrants from Africa are one of the two groups that
maintain a stronger sense of ethnic identity than native Europeans. This could also be an
indication that there is a penalty in terms of employment of having a strong identity.
[Insert Table 2 here]
Let us now examine in detail this last idea: is there a penalty in terms of labor-
market outcomes for a non-EU immigrant with a strong ethnic identity in Europe? We will
investigate this relationship for both first and second-generation immigrants, controlling
for region of origin, country of destination and individual characteristics.16
Table 3 contains the estimation results of a regression analysis where the probability
of being employed is regressed on the strength of ethnic identity (as measured by our
composite index), immigrant status (being first or second generation), and their interaction
terms. The dependent variable is a dummy equal to 1 if the individual is in paid work and 0
otherwise. We control for age, gender, education, and years since arrival in the country. We
also include region of origin dummies and host country dummies. The use of host country
dummies is essential in this context because of the large differences between European
countries in terms of institutions, especially in the labor market.
We investigate whether and to what extent there is a negative relationship between
identity and labor market outcomes when the strength of identity is measured relative to the
native population, i.e. using the whole sample (specification (1)), and when considering the
absolute level of ethnic identity, i.e. restricting attention of the sample of immigrants only
(specification (2)), so that the strength of identity is measured in absolute terms and for the
second-generation immigrants relative to their parents.
proxy for total household income is available and it contains too many missing values). Moreover, we cannot perform our analysis by type of contract because of too small sample sizes for immigrants in paid work. 16 Unfortunately, this further analysis cannot be performed separately by country of origin, destination and immigrant generation because of too small immigrant sample sizes.
13
[Insert Table 3 here]
In line with expectations, we find that the probability of being employed first
increases and then decreases with age, is lower for females than for males, and is higher for
higher educated people. We also find that, within the immigrant sample, the longer the
time spent in the host country, the higher is the probability of finding a job. Focusing now
on the identity issues, the results in column (1) (identity measured with respect to the native
population) indicate that, in Europe, having a strong attachment to religion and customs is,
on average, associated with an employment penalty of about 0.7 percent, which is common
to both natives and immigrants. Being a first generation immigrant, instead, leads to a
penalty of about 17 percent while second-generation immigrants have a probability of
being employed that is not statistically different from that of natives. These results seem to
indicate an economic integration process of immigrants in Europe.
If we now look at our interaction terms, one can see that being an immigrant and
having a strong ethnic identity is associated with a further decrease in the probability of
being employed, which is statistically significant only for second-generation immigrants.
When the sense of ethnic identity is instead evaluated in absolute terms (column (2)), we
find that the employment penalty increases by more than five times. However, while
second-generation immigrants have a higher probability of finding a job as compared to
their parents, there is no longer an additional penalty for second-generation immigrants
with strong ethnic identities. Taking the results as whole, the picture seems to be that
second-generation immigrants have a higher probability of being employed as compared to
their parents. Compared to natives, there does not seem to be any difference in terms of
employment. However, when they have a strong identity, their chance of being employed
becomes lower than that of natives.
Our analysis so far has revealed whether and to what extent there is a penalty in
terms of labor-market outcomes for an immigrant with a strong ethnic identity in Europe,
for any given level of education. To understand better these results, let us now investigate
the relationship between education and ethnic identity and see if the negative relationship
between employment and identity can be mainly explained by lower level of education. We
report in Table 4 the results of a similar regression analysis where the dependent variable is
now “years of education”.
[Insert Table 4 here]
14
When the performance of the immigrants is compared to that of natives (column
1), we find that having a strong sense of identity is associated to a lower education level.
However, contrary to Table 3, it is now the first generation of immigrants with stronger
ethnic identity that seems to be more penalized in terms of education. Indeed, when
focusing on immigrants only (column 2), we find that the penalty is mitigated for second
generation immigrants with a strong ethnic attachment. Therefore, it seems that second-
generation immigrants with strong identity encounter difficulties only in the labor market
and not in terms of education.
In light of Section 2 above, it could be the case that non-EU immigrants with a
strong ethnic identity pay a penalty in the labor market because they are either
discriminated against and/or because they have few contacts with the majority group,
yielding a poor-quality social network, and/or because they are rejecting the majority’s
norms in the host country. These different theories are linked to each other because, for
example, someone who has been discriminated against can react very negatively by
rejecting the majority’s culture, which isolates him/her from individuals from the majority.
We cannot test which theory prevails but it seems reasonable to assume that all play some
role. In Section 6 below, when we will consider the different types of integration and labor-
market policies in Europe, we will be able to give some (imperfect) answers on this issue
since a good labor-market access policy is an indication that discrimination is less severe in
the country in question.
One obvious problem with what we have done so far is that the strength of an
individual’s identity may in fact be endogenous because of omitted variables and/or
simultaneously determined with employment outcomes. Indeed, a lack of success in the host
country labor market may induce or encourage some to adopt identities that are out of kilter
with majority values. Dealing with this issue, especially in this context, is difficult. One
standard approach is to undertake a two-stage instrumental variable estimation, where in
the first stage the intensity of ethnic identity is estimated with appropriate instruments.
Focusing on the non-EU immigrants in our sample, we instrument the immigrant
sense of ethnic identity with the strength of ethnic identity in the country of origin.17 This
variable should be directly correlated with own ethnic identity (if, for example, a Muslim
15
immigrant comes from a very religious country, then he/she is more likely to have a strong
attachment to his/her religion than someone coming from a more secular country) but not
with own employment probability in the host country. In particular, it should eliminate the
portion of variance in the individual strength of ethnic identity that is possibly due to a
reverse causality mechanism, i.e. the lower the probability of finding a job in the host
country, the stronger is one’s ethnic identity. The two-stage least squares estimation results
are contained in Table 5. The analysis shows a strong first stage F-test and a still significant
and negative impact of the intensity of ethnic identity on employment probability at the
second stage, suggesting that the causality points towards the assumed direction. Indeed,
our strategy rules out the possibility that the strength of ethnic identity is simply an optimal
response to the host country environment.
[Insert Table 5 here]
6 Integration and labor-market policies, ethnic identity and employment outcomes
Our results so far seem to point towards a negative relationship between ethnic
identity and labor-market outcomes for non-EU immigrants in Europe. As stated above,
by rejecting the majority culture in the country where they live, immigrants might find it
difficult to enter the labor market. We would like now to study whether this relationship
between ethnic identity and labor-market outcomes is affected by the integration policies
and labor market policies implemented in the host country where the immigrant resides. In
other words, is there a lower employment penalty of having a strong identity in countries
that have more favorable integration and/or general labor market policies and conditions?
6.1 Integration policies
The European Social Survey (ESS) is a survey on individuals and therefore contains
no information on integration policies of the 20 European countries studied. We use the
17 We take the average of our measure of ethnic identity by region of origin.
16
Migrant Integration Policy Index (MIPEX),18 which measures policies integrating migrants
in 25 EU Member States and 3 non-EU countries. It considers over 140 policy indicators
to create a rich, multi-dimensional picture of migrants’ opportunities to participate in
European societies. MIPEX covers six policy areas that shape a migrant’s journey to full
participation”, “access to nationality”, “anti-discrimination”. Since policies are measured
against the same standards across all member states, MIPEX is a “benchmark” tool to
compare performance. This index varies between 100 (when migrants and nationals have
exactly the rights in the corresponding policy area) to 0 (when migrants have no rights at
all).
“Labor market access” measures if a migrant worker or entrepreneur is eligible for
the same opportunities as EU nationals to work in most sectors. In particular, it takes into
account if this migrant worker can count on help from labor market integration measures to
adjust to the language and professional demands of the labor market (for example, if the
state helps him/her to get his/her full set of skills and talents recognized, to access training,
and to develop language skills that are critical for the job market). It also measures how
secure a migrant worker is in his/her employment, if he/she can renew most types of work
permits and remain living in the country and look for work, if he/she loses her job.
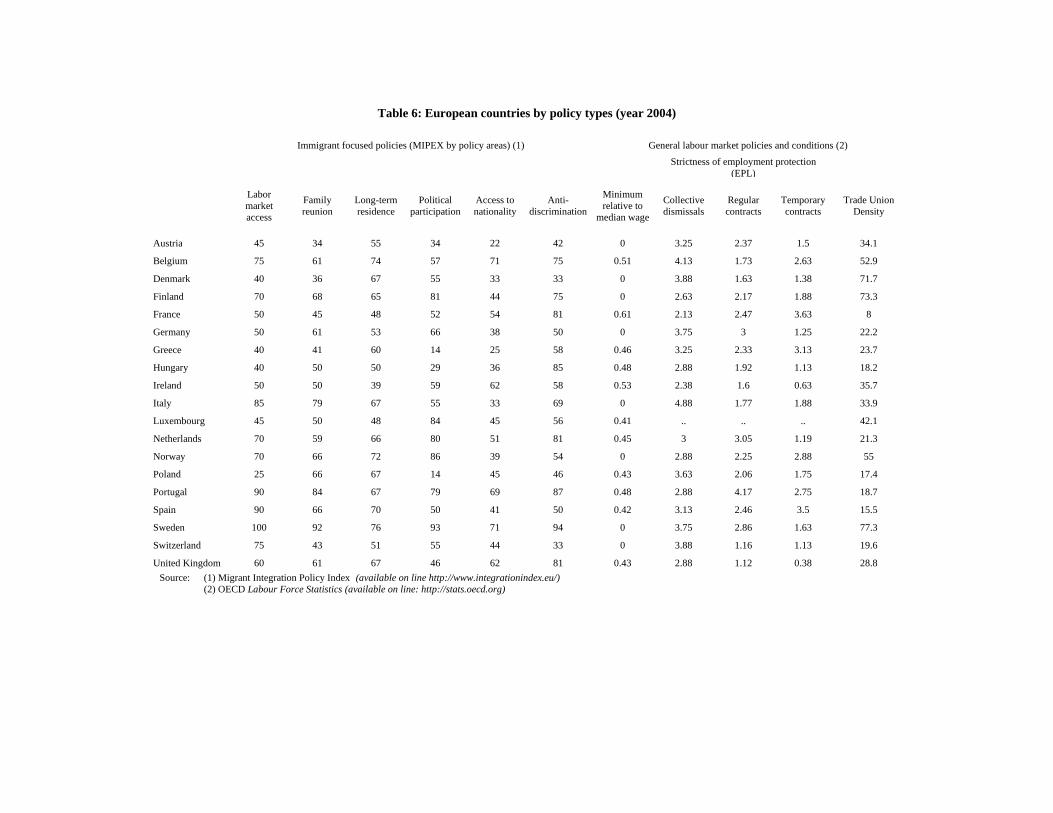
Looking at Table 6, one can see that Sweden performs best (with an index of 100) while,
for example, Poland (25) and Denmark (40) perform poorly. More generally, labor market
access in the EU is, on average, only halfway to best practice. Migrants are partially eligible
and can take up labor market integration measures that go only halfway to best practice.
[Insert Table 6 here]
“Family reunion” measures the country policy in terms of bringing families together. In
particular, it measures how long it takes for a migrant to be eligible to sponsor his/her
spouse, registered partner, minor or adult children and her dependent relatives, e.g. his/her
18 MIPEX is produced by a consortium of 25 organisations. Amongst them are universities, research institutes, think-tanks, foundations, NGOs and equality bodies. The MIPEX Group is committed to improving the quality of debate on migrant integration policy in Europe. The first edition of MIPEX was published in 2004, and this is the one we use. MIPEX is produced biannually to track the progress of integration policies in Europe over time. MIPEX is led by the British Council and Migration Policy Group (MPG). MIPEX is freely accessible and can be found at: http://www.integrationindex.eu/.
17
grandmother. It also measures the administrative procedures and how easy is to bring
families together. In particular, is it a fair, transparent, free and short process? Can a family
member renew his/her permit and stay as long as her sponsor does? One can see that
Sweden (92) and Portugal (84) have high index values while Austria (34) and Denmark (36)
perform poorly.
“Long-term residence” measures how many years as a legal resident it takes for a
migrant to be eligible to become a long-term resident and full ‘civic citizen’. Again, it also
measures if the process is transparent, free and short and if his/her application is refused
or his/her permit withdrawn only if his/she is found guilty of either fraud in trying to
acquire it or of a serious crime. It also measures if the migrant has the same access to
education and vocational training as nationals, and if he/she becomes ill, injured, pregnant
or homeless, he/she can rely on social security, social assistance, healthcare, and housing
support. The countries with the most favorable policies are the Nordics (including
Denmark), the Western Mediterranean, and the UK. Ireland (39), France and Luxembourg
(48) have the lowest scores.
“Political participation” measures if a migrant has opportunities to participate in public
life which conform to Europe’s highest democratic principles. In particular, it measures if
the state guarantees his/her political liberties to form an association, even a political one, to
join political parties, and thus participate in civil society. It also determines if as a legal
resident, the migrant can vote and stand for local elections, just like EU-nationals. Policies in
North and Western Europe are on average slightly favorable, while those in Greece and
Eastern Europe are unfavorable (Poland (14) obtains the lowest scores).
“Access to nationality” measures how many years it takes for a migrant with legal
residence to be eligible for nationality. It also measures if any of his/her descendents born in
the country are dual nationals at birth. It also determines if being tied to the country by
residence or by family are the sole criteria for becoming a national. It also measures if the
migrant is allowed to choose whether or not to keep his/her original citizenship. From
Table 6, one can see that eligibility for nationality has the lowest maximum and the lowest
minimum score with respect to all the other dimensions. Most countries do not facilitate
naturalization for first-generation migrants. European-born children most often face
unfavorable additional requirements for becoming citizens in their country of birth. Most
oaths and ceremonies do not involve requirements that can exclude migrants from
participating or receiving their citizenship. Partially insecure under the law, many
18
naturalizing migrants can have their application refused or nationality withdrawn on many
grounds, without any time limits. Only a few countries fully allow migrants to hold dual
nationality.
“Anti-discrimination” measures the anti-discrimination law in each country that helps
guarantee equal opportunities in economic, social and public life for all members of society,
including a migrant and her descendants. It also measures if the law punishes a wide range
of actors who discriminate against a migrant in many ways because of his/her ethnic origin,
race, religion or nationality, among other grounds. It also determines if the state helps the
migrant to seek justice through strong enforcement mechanisms. Sweden (94) and Portugal (87)
have high scores and this reflects the fact that the legal definitions of discrimination and
the mechanisms to enforce them are slightly favorable across the European countries. A
wide range of actors are punished for discriminating against migrants based on their race or
ethnic origin.
6.2 Labor-market policies
One of the problems with the integration policies described above is that there are
endogenous in the sense that the lower is the employment rate of immigrants in a given
country the more likely this country will target specific integration measures to increase this
employment rates. In other words, there is an obvious endogeneity problem here since the
policy formulation in different European countries is determined in large part by the
characteristics and number of their immigrants. In order to avoid this problem, we also
consider general labor-market policies that are not specific to immigrants but still affect
their employment outcomes. We consider three main policies in Europe: “minimum
wage”, “strictness of employment protection legislation” and “trade union density”.
Using data from OECD, we first collect for each European country the “minimum
wage relative to the median wage of full-time workers”, that is, the ratio of minimum wages
to median earnings of full-time employees - excluding overtime and bonus payments.19
Indeed, for cross-country comparisons, data on minimum wage levels are further
supplemented with data on average or median wages. Median rather than mean earnings
19 A national minimum wage is the minimum rate which by collective agreement must be paid in all circumstances for certain work or to employees of a certain category.
19
provide a better basis for international comparisons as they account for differences in
earnings dispersion across countries. Looking at Table 6, one can see that a country like
France has a very high minimum wage relative to median wages while other countries like
Luxembourg and Spain have a much lower ratio. Other countries, like for example the
Scandinavian countries, have no legislation on a national minimum wage. For these
countries the value of the indicator is set to 0.20 Countries with high minimum wages
should be less favorable to immigrants since the latter tend to be less educated and thus
paid at the minimum wage. Indeed, higher minimum wages implies higher labor costs for
employers and thus lower chance of being hired.
We then use the OECD employment protection indicators, which are compiled
from 21 items covering three different aspects of employment protection: (1) “Individual
dismissal of workers with regular contract”s: this index incorporates three aspects of
dismissal protection: (i) procedural inconveniences that employers face when starting the
dismissal process, such as notification and consultation requirements; (ii) notice periods
and severance pay, which typically vary by tenure of the employee; and (iii) difficulty of
dismissal, as determined by the circumstances in which it is possible to dismiss workers, as
well as the repercussions for the employer if a dismissal is found to be unfair (such as
compensation and reinstatement); (2) “Additional costs for collective dismissals”: most
countries impose additional delays, costs or notification procedures when an employer
dismisses a large number of workers at one time. This measure includes only additional
costs which go beyond those applicable for individual dismissal. It does not reflect the
overall strictness of regulation of collective dismissals, which is the sum of costs for
individual dismissals and any additional cost of collective dismissals; (3) “Regulation of
temporary contracts”: this index quantifies regulation of fixed-term and temporary work
agency contracts with respect to the types of work for which these contracts are allowed
and their duration. This measure also includes regulation governing the establishment and
operation of temporary work agencies and requirements for agency workers to receive the
same pay and/or conditions as equivalent workers in the user firm, which can increase the
cost of using temporary agency workers relative to hiring workers on permanent contracts.
20Observe that wage floors can exists even in absence of statutory minimum wages. For example, in Sweden, there exist personal contracts which are concluded between individual employees and employers specifying such minimum rate. An employer who pays rates below the minima incurs liability for breach of the collective
20
It is important to note that employment protection refers here to only one dimension of
the complex set of factors that influence labor market flexibility. These indices are synthetic
indicators of the strictness of regulation on dismissals and the use of temporary contracts.21
All these indices range between 0 (least restrictions) and 6 (most restrictions).
Looking again at Table 6, different countries have different employment protection
legislations. For example, when considering the policy “individual dismissal of workers
with regular contracts”, one can see that countries like Portugal and to a lesser extent the
Netherlands have stricter legislations while countries like the UK and Ireland have very
weak ones. If we now look at the legislation on the “regulation of temporary contracts”,
which is another important aspect of labor-market flexibility, again the UK and Ireland
have very weak legislations. This should not come as a surprise because these Anglo-Saxon
countries are well-known to have very flexible labor markets. On the other hand, countries
like Belgium and to a lesser extent Italy and France have much more regulated labor
markets. More flexible labor markets (like in the UK or Ireland) should be, in principle,
more favorable to immigrants because it gives them more chance to obtain a job.
Finally, we consider “trade union density”, which corresponds to the ratio of wage
and salary earners that are trade union members, divided by the total number of wage and
salary earners (see Visser et al., 2010). Not surprisingly, Scandinavian countries have very
high rates of trade union density (for example, 77.3 percent in Sweden) while countries like
France, Spain and Germany have much lower rates (8 percent for France, 15.5 for Spain
and 22.2 for Germany), even though trade unions are very powerful. It is well documented
that trade union mainly defend the interest of their workers and thus immigrants, who are
often “outsiders”, tend to be disadvantaged compared to the natives, the “insiders”
(Lindbeck and Snower, 1988).
Because of prejudices and discrimination, the main problem for immigrants is very
likely to find a first job (whether they are new immigrants or second-generation immigrants)
since once employed they can show their ability and thus, in principle, prejudices and
discrimination should be lower. As a result, more flexible labor markets with lower
minimum wages and lower trade-union density should be more favorable to immigrants
agreement concerned. However, these agreements largely vary between economic sectors and depend on employer characteristics. “Negotiated” wage floors are thus not considered here. 21 For full details on the methodology and weights used to compile the indicators, go to: http://www.oecd.org/dataoecd/24/40/42740190.pdf.
21
because they allow them to find a first job more easily. In countries where the labor market
is very rigid and trade union density very high, it is very difficult for immigrants to obtain a
first job. Sweden, which has a very high trade-union density and a relatively rigid labor
market, is a good example of such a case since immigrants have one of the lowest
employment rates in Europe (See, e.g. Åslund et al., 2010).
6.3 Analysis
We will now use the MIPEX scores, our indicators of minimum wage, strictness of
employment protection legislations and trade union density to understand how each of
these different policies affects the probability of being employed and how their interaction
with ethnic identity impacts on employment outcomes of immigrants. Specifically, focusing
on the sample of immigrants only, we will assign to each individual the score of the country
in which he/she resides in terms of the different policies. 22 Our regression analysis results
are contained in Tables 7a and 7b.
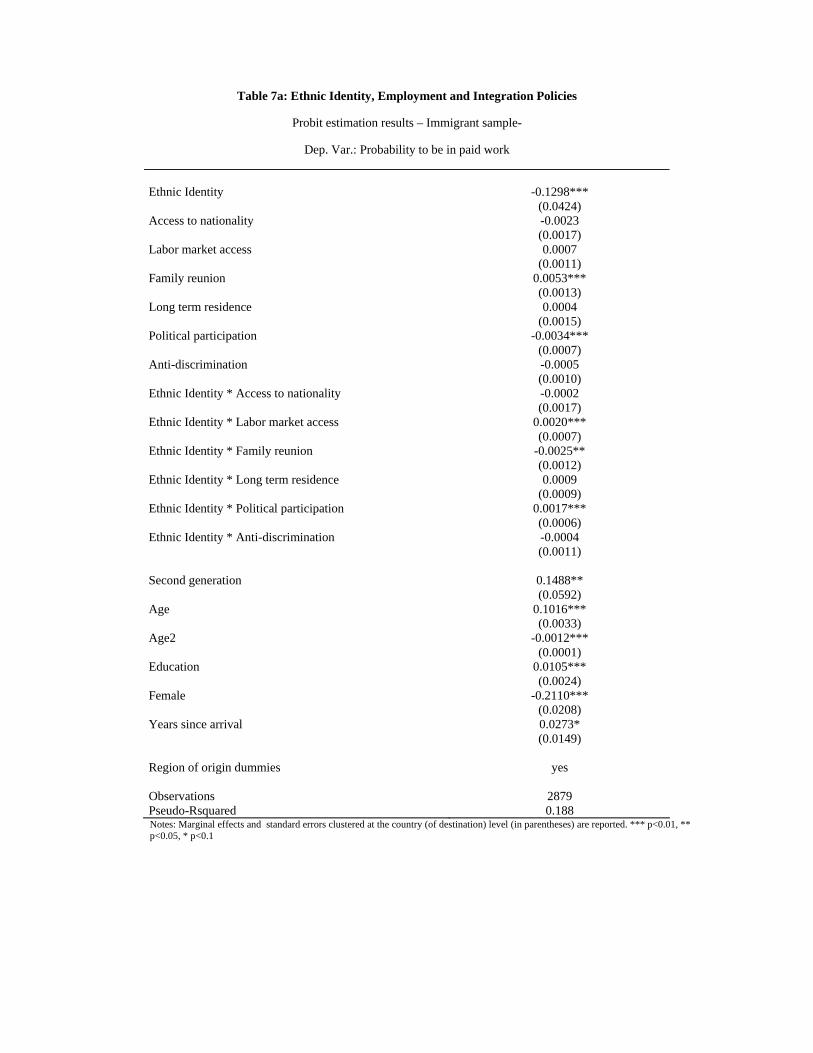
If we first look at the direct impact of integration policies on employment outcomes of
immigrants, Table 7a shows that only “family reunion” policies seem to have a positive and
significant impact on employment outcomes. However, when we interact these policies
with the strength of ethnic identity, then we see that “labor-market access” policies seem to
be beneficial in decreasing the penalty for those with a strong ethnic identity. This may
confirm some theoretical mechanisms presented in Section 2.1. Indeed, if immigrants with
a stronger ethnic identity are more likely to be discriminated against, then, in countries
where the labor-market legislation protects immigrants against some type of discrimination,
the employment prospects will be better for these immigrants. On the contrary, for the
“family reunion” policy, which had a positive and significant impact on employment
outcomes, the cross effect is negative. This could indicate that a richer network of social
contacts in the host country (relatives and friends) might be helpful in finding a job (for
example because it increases the information about job opportunities), but that such
externalities are hampered when strong ethnic feelings are preserved.
[Insert Table 7a here]
22 Both the MIPEX index and our selected indicators of labor-market policies and conditions are not available for Ukraine. This country has thus been eliminated in our analysis on policy issues.
22
A more surprising result is the negative impact of “political participation” policies
on immigrants’ employment prospects. This variable is certainly more “noisy” than other
policy variables but it could be the case that allowing immigrants to participate to local
elections triggers negative reactions from natives, which leads to more discrimination in the
labor market. Interestingly, if we look at the cross effects, “political participation” is the
only variable associated with a significant and positive one. This seems to suggest that this
type of integration policies might positively affect the relationship between ethnic identity
and employment probability, only for those immigrants who have an extreme identity.
Let us now focus on labor-market policies, which are, in principle, “exogenous” to
immigration patterns. The results are shown in Table 7b and confirm the intuition we had
before. Indeed, more flexible labor markets are, in general, favorable to immigrants. One
can see from Table 7b that most labor-market policy variables are associated with a
negative estimated effect, although statistically significant only for “trade-union density”. In
other words, more flexible labor markets that have a low trade-union density like the UK
or Ireland are more favorable to immigrants in terms of employment. This is confirmed by
Table 1 where UK and Ireland have relatively high ratios of employment for the
immigrants while Scandinavian countries have much lower ones. Interestingly, when we
interact these labor-market policies with ethnic identity, all signs become positive, meaning
that more regulated labor markets tend to alleviate the employment penalty of having a
strong identity. In particular, the effect is statistical significant for minimum wage and
employment protection regarding individual dismissal of workers with regular contracts.
This could be an indication that tough employment legislations reduce labor-market
discrimination so that immigrants, even with stronger identity, are protected in terms of
employment. So the general picture here is that more flexible labor markets (like the UK
and Ireland) could help immigrants to access the labor market but do not protect those
who have a very strong ethnic identity.
[Insert Table 7b here]
23
7 Concluding remarks
The Lisbon Strategy (named after the European meeting in Lisbon in the spring of
2000) states that before the year 2010, the EU shall become the most competitive and
dynamic knowledge-based economy in the world, with the possibility of sustainable
economic growth, with more and better work opportunities and a higher degree of social
solidarity. It is crucial for the chances of EU reaching this goal that more people become
employed. The problem is that many people are still outside the labor market, in particular
those who have a foreign background. The integration of these individuals is thus crucial
for reaching the Lisbon goals and European integration policy must play a more important
role in Europe. The integration of citizens of third countries who live and work in the EU
has therefore become an increasingly important issue in the last few years. During the
council meetings (legal and domestic questions) in 2002, it was decided that a network of
national contact points within the area of integration should be created and this was
confirmed during the council meeting in June 2003 and the commission was appointed the
task of creating yearly reports on migration and integration. In its message on immigration,
integration and employment, the commission is trying to get an overall grip of the issue of
integration. The first issue of the handbook on issues of integration for decision-makers
and those who work with integration issues in practice was published in November 2004
(Handbook on Integration for policy-makers and practitioners). Integration is a major issue within
several of the EU policy areas. If there is a successful integration of immigrants on the
labor market in an efficient and responsible way, this would be an important contribution
to the Lisbon goal.
There is thus a common agenda (or EU directive) for integration policy – a framework for
the integration of citizens of third countries in the European Union – but there is no common
integration policy in Europe (Zenou, 2009). While there is now a great willingness to carry out
a common migration policy in Europe (on October 16, 2008, all presidents and prime
ministers from the EU have signed the European pact for immigration and asylum which
contains commitments within the following areas: legal immigration, illegal immigration
and returning people, border control, asylum and partnership with third countries and the
promotion of synergies between migration and development) there is a smaller interest in a
common integration policy.
Our results suggest that there is a penalty to be paid in terms of employment for
24
the immigrants in Europe. When we differentiate between first and second generations of
immigrants, our evidence reveals signs of a cultural and economic integration of
immigrants in Europe. However, when a strong ethnic sentiment is preserved, the
employment penalty becomes higher. Our analysis also reveals that integration and labor-
market policies aiming at improving the employment prospects of non-European
immigrants can be successful but their results vary depending on the strength of identity of
the immigrants.
In this respect, our analysis provides valuable insights into the political debate on
immigration in Europe. Although we are fully aware that these issues are complex and
other aspects are at work, our results suggest that a largely under-investigated issue, i.e. the
relationship between ethnic identity and immigrants’ employment prospects, might be an
important factor to be considered for policy design in Europe.
References
Ainsworth-Darnell, J.W. and D.B. Downey (1998), “Assessing the oppositional culture explanation for racial/ethnic differences in school performance,” American Sociological Review 63, 536-553.
Akerlof, G.A. and R.E. Kranton (2010), Identity Economics: How Our Identities Shape Our Work, Wages, and Well-Being , Princeton University Press.
Austen-Smith, D. and R.D. Fryer, Jr (2005), “An economic analysis of ‘acting white’,” Quarterly Journal of Economics 120, 551-583.
Åslund, O., Östh, J. and Y. Zenou (2010), “How crucial is distance to jobs for ethnic minorities? Old question – Improved answer,” Journal of Economic Geography 10, 389-422.
Battu, H., M. McDonald and Y. Zenou (2007), “Oppositional identities and the labor market,” Journal Population Economics 20, 643-667.
Battu, H. and Y. Zenou (2010). “Oppositional identities and employment for ethnic minorities. Evidence for England,” Economic Journal 120, F52-F71.
Berry, J.W. (1997), “Immigration, acculturation and adaptation,” Applied Psychology: An International Review 46, 5-68.
Bisin, A., E. Patacchini, T. Verdier and Y. Zenou (2008), “Are Muslim immigrants different in terms of cultural integration?” Journal of the European Economic Association 6, 445-456.
Bisin, A., E. Patacchini, T. Verdier and Y. Zenou (2009a), “Formation and persistence of oppositional identities,” Unpublished manuscript, Stockholm University.
25
Bisin, A., E. Patacchini, T. Verdier and Y. Zenou (2009b), “Bend it like Beckham: Ethnic identity and integration,” Unpublished manuscript, Stockholm University.
Borjas, G.J. (1994), “The economics of immigration,” Journal of Economic Literature 32, 1667-1717.
Brown, M.S. (2000), “Religion and economic activity in the South Asian population,” Ethnic and Racial Studies 23, 1035-61.
Casey, T. and C. Dustmann (2010), “Immigrants’ identity, economic outcomes, and the transmission of identity across generations,” Economic Journal 120, F31-F51.
Chiswick, B.R. (1978), “The effect of Americanization on earnings of foreign born men,” Journal of Political Economy 86, 897-921.
Chiswick, B.R. and C. Houseworth (2008), “Ethnic intermarriage among immigrants: Human capital and assortative mating,” IZA Discussion Paper No. 3740.
Constant, A., L. Gataullina, and K.F. Zimmermann (2006), “Gender, ethnic identity and work,” IZA Discussion Paper no 2420.
Delpit, L. (1995), Other People’s Children: Cultural Conflict in the Classroom, New York: The Free Press.
Dustmann, C. and Fabbri, F. (2003), “Language proficiency and labour market performance of immigrants in the UK,” Economic Journal 113, 695-717.
Ellison, C.G. (1993), “Religious involvement and self-perception among black Americans,” Social Forces 71, 1027-1055.
Fordham, S. and J. Ogbu (1986), “Blacks students’ school successes: Coping with the burden of ‘acting white’,” The Urban Review 18, 176-206.
Fryer, R.G. Jr. and P. Torelli (2010), “An empirical analysis of ‘acting white’,” Journal of Public Economics 94, 380-396.
Furtado, D. and N. Theodoropoulos (2009), “Intermarriage and immigrant employment: The role of networks,” CReAM Discussion Paper No. 06/09.
Huntington, S.P. (1996), The Clash of Civilizations and the Remaking of World Order, New York: Simon & Schuster.
Iannaccone, L.R. (1998), “Introduction to the economics of religion,” Journal of Economic Literature 36, 1465-96.
Lazear, E.P. (1999), “Culture and language,” Journal of Political Economy 107, S95-S126. Lincoln, C.E. and L. Mamiya (1990), The Black Church in the African American Experience,
Durham, NC: Duke University Press. Lindbeck, A. and D.J. Snower (1988), The Insider-Outsider Theory of Employment and
Unemployment, Cambridge: Mass.: MIT Press. Manning, A. and S. Roy (2010), “Culture clash or culture club? The identity and attitudes of
immigrants in Britain,” Economic Journal 120, F72-F100. McManus, W.S., Gould, W. and Welch, F. (1983), “Earnings of Hispanic men: The role of
English language proficiency,” Journal of Labor Economics 1, 101-130.
26
Meng, X. and Gregory, R.G. (2005), “Intermarriage and the economic assimilation of immigrants,” Journal of Labor Economics 23, 135-75.
Myrdal, G. (1944), An American Dilemma: The Negro Problem and Modern Democracy, New York: Harper and Row.
Nekby, L. and M. Rödin (2010), “Acculturation identity and employment among second and middle generation immigrants,” Journal of Economic Psychology 31, 35-50.
Pagnini, D.L. and Morgan, S.P. (1990), “Intermarriage and social distance among U.S. immigrants at the turn of the century,” American Journal of Sociology 96, 405-32.
Patacchini, E. and Y. Zenou (2009), “Neighborhood effects and parental involvement in the intergenerational transmission of education,” Unpublished manuscript, Stockholm University.
Selod, H. and Zenou, Y. (2006). “City-structure, job search, and labour discrimination. Theory and policy implications,” Economic Journal 116, 1057-87.
Sen, A. (2000), Other People, British Academy Lecture. Visser, J. Martin, S. and P. Tergeist (2010), “Trade union member and union density in
OECD countries,” OECD Labour Force Statistics, available at: http://www.oecd.org/dataoecd/37/2/35695665.pdf.
Wilson, W. J. (1987), The truly Disadvantaged: The Inner City, the Underclass, and Public Policy, Chicago: University of Chicago Press.
Zenou, Y. (2009), “How common is integration policy in Europe?” In: S. Gustavsson, L. Oxelheim, and Lars Pehrson (Eds.), How Unified in the European Union, Berlin: Springer Verlag, pp. 139-155.
Zimmermann, L., K.F. Zimmermann and A. Constant (2007), “Ethnic self-identification of first-generation immigrants,” International Migration Review 41, 769-781.
Table 1: The labor market situation for immigrants as compared to natives in some European countries, 1995, 2000, 2003 and 2004, 16-64 years.
Labor market participation Unemployment Employed
Ratio immigrant/native Ratio immigrant/native Ratio immigrant/native
Source: Processed statistics from OECD (European Union Labour Force Survey, population 15-64 (data from Eurostat) except Denmark (population register)).
Table 2: Immigrant to native identity, employment and education gap by region of origin and generation
Whole sample
(1) (2) (3) Identity Education Employment 1st Gen. 2nd Gen 1st Gen. 2nd Gen 1st Gen. 2nd Gen Africa 1.7438*** 0.2829*** -1.1801** 0.3994* -0.2666*** -0.0713** (0.109) (0.070) (0.521) (0.220) (0.053) (0.032) Asia 1.6034*** 0.3145*** -0.8461* 0.3392 -0.2627*** -0.0002 (0.111) (0.081) (0.504) (0.242) (0.053) (0.038) North America 0.9158*** -0.0156 2.6080*** 0.7378 -0.2380*** -0.0297 (0.190) (0.133) (0.777) (0.489) (0.075) (0.065) South America & Caribbean 1.0625*** 0.0534 -0.8259* 0.2739 -0.0682 -0.0186 (0.107) (0.100) (0.476) (0.361) (0.056) (0.052) Australasia 0.7540*** -0.0446 -0.6349 1.3305* -0.0430 -0.0276 (0.212) (0.195) (0.939) (0.790) (0.138) (0.162) Age Age2 Education Female Years since arrival
Notes: (1) Dep. Var.: Strength of Ethnic Identity; OLS estimates and robust standard errors (in parentheses) are reported (2) Dep. Var.: Probability to be in paid work; Probit marginal effects and robust standard errors (in parentheses) are reported (3) Dep. Var.: Years of full-time of education completed; OLS estimates and robust standard errors (in parentheses) are reported. *** p<0.01, ** p<0.05, * p<0.1
Table 3: Ethnic Identity and Employment
(1) (2) Whole sample Only Immigrants
Ethnic identity -0.0068** -0.0372** (0.0030) (0.016) First generation -0.1722** - (0.073) Second generation -0.0630 0.1540** (0.052) (0.062)
First generation* Ethnic identity -0.0163 - (0.016) Second generation* Ethnic identity -0.0344* -0.0201 (0.019) (0.025) Age 0.0972*** 0.1008*** (0.001) (0.006) Age2 -0.0012*** -0.0012*** (0.0000) (0.000) Female -0.2038*** -0.2123*** (0.0051) (0.025) Years since arrival 0.0200 0.0283* (0.014) (0.015) Education 0.0195*** 0.0106*** (0.001) (0.003) Region of origin dummies yes yes Host country dummies yes yes Observations 77,291 2892 Pseudo-Rsquared 0.177 0.185
Notes: Probit estimation results. Marginal effects and robust standard errors (in parentheses) are reported. *** p<0.01, ** p<0.05, * p<0.1
Table 4: Ethnic Identity and Education
(1) (2) Whole sample Only Immigrants
Ethnic identity -0.1845*** -0.6972*** (0.021) (0.139) First generation 0.4275 (0.751) Second generation 0.7792 -0.4794 (0.613) (0.538) First generation* Ethnic identity -0.4751*** (0.139) Second generation* Ethnic identity -0.1352 0.3333* (0.123) (0.183) Age 0.2716*** 0.2655*** (0.007) (0.043) Age2 -0.0039*** -0.0033*** (0.000) (0.001) Female -0.1929*** -0.0754 (0.036) (0.210) Years since arrival 0.0520 -0.1834 (0.128) (0.133) Education - Region of origin dummies yes yes Host country dummies yes yes Observations 77,556 2,904 Pseudo-Rsquared 0.928 0.905
Notes: OLS estimation results. Coefficient estimates and robust standard errors (in parentheses) are reported. *** p<0.01, ** p<0.05, * p<0.1
Table 5: Robustness check: Ethnic Identity and Employment
2SLS – Immigrant sample-
First stage results Dep. Var.: Strength of Ethnic Identity
Second stage results Dep. Var.: Probability to be in paid work
Country of origin Ethnic Identity 0.8944*** Ethnic Identity -0.0879* (0.1690) (0.047) Age 0.0089 Age 0.0885*** (0.01327) (0.004) Age2 -0.0001 Age2 -0.0011*** (0.0002) (0.000) Education -0.0337*** Education 0.0068* (0.0062) (0.004) Female 0.1634*** Second generation 0.0626 (0.0528) (0.084) Second generation -1.1347*** Years since arrival 0.0147 (0.1242) (0.013) Years since arrival -0.1454 *** Female -0.1667*** (0.0311) (0.027) Host country dummies yes Host country dummies yes F test 22.20 Obs. 2892 R-squared 0.1651 R-squared 0.216
Notes: *** p<0.01, ** p<0.05, * p<0.1
Table 6: European countries by policy types (year 2004)
Immigrant focused policies (MIPEX by policy areas) (1) General labour market policies and conditions (2)
United Kingdom 60 61 67 46 62 81 0.43 2.88 1.12 0.38 28.8 Source: (1) Migrant Integration Policy Index (available on line http://www.integrationindex.eu/)
(2) OECD Labour Force Statistics (available on line: http://stats.oecd.org)
Table 7a: Ethnic Identity, Employment and Integration Policies
Probit estimation results – Immigrant sample-
Dep. Var.: Probability to be in paid work
Ethnic Identity -0.1298*** (0.0424) Access to nationality -0.0023 (0.0017) Labor market access 0.0007 (0.0011) Family reunion 0.0053*** (0.0013) Long term residence 0.0004 (0.0015) Political participation -0.0034*** (0.0007) Anti-discrimination -0.0005 (0.0010) Ethnic Identity * Access to nationality -0.0002 (0.0017) Ethnic Identity * Labor market access 0.0020*** (0.0007) Ethnic Identity * Family reunion -0.0025** (0.0012) Ethnic Identity * Long term residence 0.0009 (0.0009) Ethnic Identity * Political participation 0.0017*** (0.0006) Ethnic Identity * Anti-discrimination -0.0004 (0.0011) Second generation 0.1488** (0.0592) Age 0.1016*** (0.0033) Age2 -0.0012*** (0.0001) Education 0.0105*** (0.0024) Female -0.2110*** (0.0208) Years since arrival 0.0273* (0.0149) Region of origin dummies yes Observations 2879 Pseudo-Rsquared 0.188 Notes: Marginal effects and standard errors clustered at the country (of destination) level (in parentheses) are reported. *** p<0.01, ** p<0.05, * p<0.1
Table 7b: Ethnic Identity, Employment and Labor-Market Policies
Probit estimation results – Immigrant sample-
Dep. Var.: Probability to be in paid work
Ethnic Identity -0.2261*** (0.0736) Minimum wage relative to median wage -0.0149 (0.1322) EPL- Collective dismissals 0.0708 (0.0440) EPL- Regular contract -0.0301 (0.0275) EPL- Temporary contracts -0.0005 (0.0185) Trade Union density -0.0022** (0.0009) Ethnic Identity * Minimum wage relative to median wage 0.0730* (0.0407) Ethnic Identity * EPL- Collective dismissals 0.0203 (0.0274) Ethnic Identity * EPL- Regular contract 0.0319** (0.0127) Ethnic Identity * EPL- Temporary contracts 0.0049 (0.0098) Ethnic Identity * Trade Union density 0.0006 (0.0007) Second generation 0.0854 (0.0696) Age 0.1011*** (0.0038) Age2 -0.0012*** (0.0001) Education 0.0099*** (0.0024) Female -0.2102*** (0.0228) Years since arrival 0.0130 (0.0166) Region of origin dummies yes Observations 2836 Pseudo-Rsquared 0.181 Notes: Marginal effects and standard errors clustered at the country (of destination) level (in parentheses) are reported. *** p<0.01, ** p<0.05, * p<0.1
APPENDIX
Table A.1: Immigrants from non-EU countries by region of origin and generation
Sample proportion (%)
Natives 96.14 Immigrants 3.86 of which Africa 37.78 Asia 36.72 North America 7.48 South America & Caribbeans 16.38 Australasia 1.64 First generation 63.98 Second generation 36.02