Psychological Assessment 1999, Vol. 11, No. 2, 186-197 Copyright 1999 by the American Psychological Association, Inc. 1040-3590/99/S3.00 Ethnicity and Psychopathology: A Meta-Analytic Review of 31 Years of Comparative MMPI/MMPI-2 Research Gordon C. Nagayama Hall, Anita Bansal, and Irene R. Lopez Kent State University Meta-analyses were performed on 25 comparative Minnesota Multiphasic Personality Inventory (MMPI) and MMPI-2 studies of 1,428 male African Americans versus 2,837 male European Americans, 12 studies of 1,053 female African Americans versus 1,470 female European Americans, and 13 studies of 500 male Latino Americans and 1,345 male European Americans. Aggregate effect sizes suggest higher scores for ethnic minority groups than for European Americans on some MMPI/MMPI-2 scales and lower scores on others. However, none of the aggregate effect sizes suggest substantive differences from either a statistical or clinical perspective. The MMPI and MMPI-2 apparently do not unfairly portray African Americans and Latinos as pathological. Effect sizes across studies generally did not vary as a function of sociodemographic variables, research setting, or use of the MMPI versus MMPI-2. It is recommended that additional between- and within-ethnic groups psychopathology research continue. In an increasingly multicultural society, ethnic differences in psychopathology could have far reaching implications. Perhaps the most benevolent implication of ethnic differences would be the need for culture-specific models of psychopathology, assessment, and treatment (Florsheim, Tolan, & Gorman-Smith, 1996; Oka- zaki, 1997). However, cultural differences have traditionally been regarded in our society as deficiencies (Jones, 1988). Ethnic dif- ferences in psychopathology could result in ethnic minority per- sons receiving different, and possibly negative, treatment in edu- cational, employment, legal, mental health, and other settings in which measures of psychopathology are used to determine one's status. Thus, when ethnic differences in psychopathology are re- ported, the validity of such differences has been questioned (Oka- zaki & Sue, 1995b). Epidemiological data on psychopathology suggest few ethnic differences in rates of psychopathology. In the Epidemiological Catchment Area Project (ECAP), African Americans had signifi- cantly greater lifetime prevalence than European Americans only of simple phobia, agoraphobia, and cognitive impairment (Robins et al., 1984). In the same project, European Americans had a significantly greater prevalence of drug abuse and major depres- sive disorders than did Mexican Americans, but there were not 'significant differences for other disorders (Karno et al., 1987). More recent data also suggest comparable rates of psychopathol- ogy across ethnic groups (Huertin-Roberts, Snowden, & Miller, 1997; Kessler et al., 1994; Roberts & Sobhan, 1992). In contrast to the ECAP, the prevalence of Diagnostic and Statistical Manual of Mental Disorders (3rd ed., rev.; DSM-III-R; American Psychiatric Gordon C. Nagayama Hall, Anita Bansal, and Irene R. Lopez, Depart- ment of Psychology, Kent State University. We thank John McNulty for reviewing an earlier version of this article. Correspondence concerning this article should be addressed to Gordon C. Nagayama Hall, who is now at the Department of Psychology, 333 Moore Building, Pennsylvania State University, University Park, Pennsyl- vania 16802. Electronic mail may be sent to [email protected]. Association, 1987) disorders in the National Comorbidity Survey (NCS) among African Americans versus European Americans was not higher for any disorder, and it was significantly lower for affective, substance-use disorders, and comorbidity (Kessler et al., 1994). Latinos in the NCS had a higher prevalence than European Americans only of affective disorders over the past year and comorbidity (Kessler et al.). Thus, the epidemiological findings appear to suggest that ethnicity is not a significant source of variance in psychopathology. Sources of Potential Ethnic Differences Why should differences in psychopathology be expected among ethnic groups in the United States? Cultural differences may persist across ethnic groups even among persons who are not recent immigrants and who are highly acculturated. One general dimension along which ethnic groups in the United States differ is individualism-collectivism. Compared to European Americans, ethnic minority persons in the United States have a relatively collectivist orientation (Greenfield, 1994; Hill, Soriano, Chen, & LaFromboise, 1994; Phinney, 1996; D. W. Sue & D. Sue, 1990). Collectivist cultures emphasize attending to others, fitting in, and interpersonal harmony (Markus & Kitayama, 1991). Such cultural differences may be associated with differences in the expression of psychopathology. Minority status may also influence psychopathology among persons of color in the United States. African Americans are more likely to perceive events as racist than are European Americans (Inman & Baron, 1996). Perceived discrimination may be mini- mized in some situations to enhance self-esteem and perceptions of control (Ruggiero & Taylor, 1997). Nevertheless, discrimination based on minority status is a stressor that may be more prominent for persons of color than for European Americans. It is possible that the stress associated with discrimination may have negative health and mental health consequences for ethnic minority persons (cf. Myers et al., 1995). 186
Copyright 1999 by the American Psychological Association, Inc.1040-3590/99/S3.00
Ethnicity and Psychopathology: A Meta-Analytic Review of31 Years of Comparative MMPI/MMPI-2 Research
Gordon C. Nagayama Hall, Anita Bansal, and Irene R. LopezKent State University
Meta-analyses were performed on 25 comparative Minnesota Multiphasic Personality Inventory (MMPI)and MMPI-2 studies of 1,428 male African Americans versus 2,837 male European Americans, 12studies of 1,053 female African Americans versus 1,470 female European Americans, and 13 studies of500 male Latino Americans and 1,345 male European Americans. Aggregate effect sizes suggest higherscores for ethnic minority groups than for European Americans on some MMPI/MMPI-2 scales andlower scores on others. However, none of the aggregate effect sizes suggest substantive differences fromeither a statistical or clinical perspective. The MMPI and MMPI-2 apparently do not unfairly portrayAfrican Americans and Latinos as pathological. Effect sizes across studies generally did not vary as afunction of sociodemographic variables, research setting, or use of the MMPI versus MMPI-2. It isrecommended that additional between- and within-ethnic groups psychopathology research continue.
In an increasingly multicultural society, ethnic differences inpsychopathology could have far reaching implications. Perhaps themost benevolent implication of ethnic differences would be theneed for culture-specific models of psychopathology, assessment,and treatment (Florsheim, Tolan, & Gorman-Smith, 1996; Oka-zaki, 1997). However, cultural differences have traditionally beenregarded in our society as deficiencies (Jones, 1988). Ethnic dif-ferences in psychopathology could result in ethnic minority per-sons receiving different, and possibly negative, treatment in edu-cational, employment, legal, mental health, and other settings inwhich measures of psychopathology are used to determine one'sstatus. Thus, when ethnic differences in psychopathology are re-ported, the validity of such differences has been questioned (Oka-zaki & Sue, 1995b).
Epidemiological data on psychopathology suggest few ethnicdifferences in rates of psychopathology. In the EpidemiologicalCatchment Area Project (ECAP), African Americans had signifi-cantly greater lifetime prevalence than European Americans onlyof simple phobia, agoraphobia, and cognitive impairment (Robinset al., 1984). In the same project, European Americans had asignificantly greater prevalence of drug abuse and major depres-sive disorders than did Mexican Americans, but there were not
'significant differences for other disorders (Karno et al., 1987).More recent data also suggest comparable rates of psychopathol-ogy across ethnic groups (Huertin-Roberts, Snowden, & Miller,1997; Kessler et al., 1994; Roberts & Sobhan, 1992). In contrast tothe ECAP, the prevalence of Diagnostic and Statistical Manual ofMental Disorders (3rd ed., rev.; DSM-III-R; American Psychiatric
Gordon C. Nagayama Hall, Anita Bansal, and Irene R. Lopez, Depart-ment of Psychology, Kent State University.
We thank John McNulty for reviewing an earlier version of this article.Correspondence concerning this article should be addressed to Gordon
C. Nagayama Hall, who is now at the Department of Psychology, 333Moore Building, Pennsylvania State University, University Park, Pennsyl-vania 16802. Electronic mail may be sent to [email protected].
Association, 1987) disorders in the National Comorbidity Survey(NCS) among African Americans versus European Americans wasnot higher for any disorder, and it was significantly lower foraffective, substance-use disorders, and comorbidity (Kessler et al.,1994). Latinos in the NCS had a higher prevalence than EuropeanAmericans only of affective disorders over the past year andcomorbidity (Kessler et al.). Thus, the epidemiological findingsappear to suggest that ethnicity is not a significant source ofvariance in psychopathology.
Sources of Potential Ethnic Differences
Why should differences in psychopathology be expected amongethnic groups in the United States? Cultural differences maypersist across ethnic groups even among persons who are notrecent immigrants and who are highly acculturated. One generaldimension along which ethnic groups in the United States differ isindividualism-collectivism. Compared to European Americans,ethnic minority persons in the United States have a relativelycollectivist orientation (Greenfield, 1994; Hill, Soriano, Chen, &LaFromboise, 1994; Phinney, 1996; D. W. Sue & D. Sue, 1990).Collectivist cultures emphasize attending to others, fitting in, andinterpersonal harmony (Markus & Kitayama, 1991). Such culturaldifferences may be associated with differences in the expression ofpsychopathology.
Minority status may also influence psychopathology amongpersons of color in the United States. African Americans are morelikely to perceive events as racist than are European Americans(Inman & Baron, 1996). Perceived discrimination may be mini-mized in some situations to enhance self-esteem and perceptions ofcontrol (Ruggiero & Taylor, 1997). Nevertheless, discriminationbased on minority status is a stressor that may be more prominentfor persons of color than for European Americans. It is possiblethat the stress associated with discrimination may have negativehealth and mental health consequences for ethnic minority persons(cf. Myers et al., 1995).
186
ETHNICITY AND PSYCHOPATHOLOGY 187
Definition of Ethnicity
A primary issue when attempting to assess ethnic differences inpsychopathology is the definition of ethnicity or race. Ethnicity hasbeen recently defined as referring to broad groupings on the basisof both race and ethnicity (Phinney, 1996). In keeping with Phin-ney's (1996) definition, ethnicity in this article will encompassrace, a term on which there is disagreement as to its meaning, andit will focus on members of nondominant groups in the UnitedStates. In most research, it is assumed that persons of the sameethnicity or race share psychological characteristics associatedwith culture and that these characteristics are associated withpsychopathology (Okazaki & Sue, 1995b).
Not all persons share the same degree of identification with theirethnic group (Dana, 1988; Greene, 1987; Suzuki & Kugler, 1995).Moreover, not all individuals in an ethnic group are similar, andwithin-ethnic group heterogeneity may be as important asbetween-groups heterogeneity (Greene, 1987; Jones, 1991; Oka-zaki & Sue, 1995b; Suzuki & Valencia, 1997). One method ofaddressing within-group heterogeneity is to match or statisticallycontrol for demographic characteristics, such as age, gender, andsocioeconomic status. However, such matching cannot control forall potentially relevant variables, such as degree of societal dis-crimination experienced, and many demographic variables areconfounded with ethnicity (Phinney, 1996). Moreover, it is possi-ble that some of these demographic variables are causal variablesand that ethnicity obscures such causality because it is confoundedwith these variables (cf. Meehl, 1971).
The expected effects of ethnic identification on psychologicalfunctioning are not clear. There is some evidence that a strongerethnic identification is associated with better psychological func-tioning, such as increased self-esteem (Phinney, 1989). However,there is other evidence that being ethnic identified may be mal-adaptive when there are negative stereotypes associated with theethnic domain, such as in academic achievement (Fordham, 1988;Fordham & Ogbu, 1986; Steele, 1997). However, the benefits ofethnic disidentification (e.g., possible academic achievement) mayincur psychological costs, such as depression (Arroyo & Zigler,1995). Similarly, the adaptiveness of ethnic identification may beassociated with social context (Tanaka, Ebreo, Linn, & Morera,1998). For example, a strong ethnic identification may serve as abuffer against discrimination for situations in which a person is anumerical minority, yet it also could interfere with one's function-ing within the majority social context.
Although it is an important construct, there is no generallyaccepted method of measuring ethnic identity. Several differentethnic-identity scales have recently been developed. However,most of the scales do not have well-established psychometricproperties, and those that do are not necessarily useful in clinicalsamples (Kohatsu & Richardson, 1996; Sabnani & Ponterotto,1992). Moreover, few of the scales have been designed to measureethnic identity across multiple ethnic groups (see Phinney, 1992,for an exception).
Measurement Issues
A major issue is how to measure psychopathology across ethnicgroups. Ernie or culture-specific measures may capture uniquecultural characteristics, but may not allow between-ethnic groups
comparisons (Dana, 1988, 1993; Okazaki & Sue, 1995a). Eticapproaches are based on the assumption that the same constructsexist across cultures, which allows between-groups comparisons.Diagnostic judgments by clinicians have been used to identifyethnic differences in psychopathology, but clinical judgments forsome diagnoses tend to be biased against ethnic minority persons(Garb, 1997; Snowden & Cheung, 1990). Presumably, self-reportson standardized measures of psychopathology might be less neg-atively biased than the judgments of others. However, measures toassess psychopathology are not necessarily equivalent across cul-tural groups, even when attempts are made to establish equiva-lence, such as including ethnic minority groups in standardizationsamples and language translation. Tests tend to favor persons fromthe culture in which the test was developed (Dana, 1988; Mack-enzie, 1984). Despite these methodological problems, however,the assessment of ethnic differences is important in determiningthe applicability and limits of theories and tests of psychopathol-ogy (Ben-Porath, 1990; Okazaki & Sue, 1995b; Triandis & Brislin,1984).
Although there is no gold standard of psychopathology, theMinnesota Multiphasic Personality Inventory (MMPI) is one of themost widely used measures of psychopathology. It is also one ofthe most psychometrically reliable and valid tests, and it is able toeffectively discriminate between pathological and nonpathologicalgroups (Parker, Hanson, & Hunsley, 1988; Zalewski & Gottesman,1991). There also have been more studies of ethnic differencesusing the MMPI and the MMPI-2 than any other measure. Thus,the criterion measures of psychopathology in the current reviewwill be the MMPI and MMPI-2.
Some have contended that the MMPI-2 is culturally biased(Dana & Whatley, 1991; Park, Upshaw, & Koh, 1988), whereasothers have contended that it is not (Butcher & Williams, 1992;Weiner, 1995). An absence of ethnic-group differences is notsufficient evidence that a test is not biased. Test scores may or maynot be associated with the same extra-test behavior across ethnicgroups (Butcher, Graham, & Ben-Porath, 1995; Greene, 1987;McNulty et al, 1997; Pritchard & Rosenblatt, 1980; Timbrook &Graham, 1994). However, the same measures of extra-test behav-iors are not consistently used across MMPI/MMPI-2 ethnic differ-ences studies, and often these measures are less reliable and validthan the MMPI/MMPI-2 itself. Moreover, the measurement ofsuch extra-test behavioral criteria (e.g., diagnosis, clinical ratings,other test scores) typically is not culturally sensitive, and culturallyunbiased criteria for psychopathology are difficult to identify(Adebimpe, 1994; Garb, 1997; Gynther, 1989; Snowden &Cheung, 1990). Test bias will not be directly addressed in thisreview.
A related measurement issue involves the functional equiva-lence of behavior measured by a test, or whether the same behaviorexhibited by two different ethnic groups is interpreted similarly orhas the same impact in the individual's context. One method ofassessing functional equivalence is to determine if persons fromdifferent ethnic groups in particular settings have similar scores.For example, if the MMPI/MMPI-2 scores of two ethnic groupswere not significantly different across studies in psychiatric inpa-tient settings, it could be contended that the same levels of psy-chopathology are required for hospitalization, and that the sametypes of psychopathological behaviors are not interpreted differ-ently. Conversely, if the groups exhibited significantly different
188 HALL, BANSAL, AND LOPEZ
scores, then it could be contended that the same behaviors are
interpreted differently, insofar as the different scores reflect dif-fering hospitalization criteria. Thus, lower levels of psychopathol-ogy might be interpreted as warranting hospitalization for onegroup than for another. Granted, the criteria for psychiatric hospi-talization or admission to other clinical settings (e.g., substance-abuse programs) may also be culturally biased (Adebimpe, 1994;Garb, 1997; Gynther, 1989; Snowden & Cheung, 1990).
Ethnicity and the MMPI/MMPI-2
The original MMPI did not include ethnic minorities in itsstandardization sample. Consequently, some have contended that
the test is biased against ethnic minority groups. Some reviewshave reported differences, whereas others have not (e.g., Dana,1988; Greene, 1987; Gynther, 1989; Pritchard & Rosenblatt,1980). However, ethnic minority persons were included in thestandardization sample of the MMPI-2 (Butcher, Dahlstrom, Gra-ham, Tellegen, & Kaemmer, 1989), and some studies of ethnicdifferences have been conducted with this revised measure. How-ever, most MMPI/MMPI-2 studies of ethnic groups have notincluded adequately large, representative samples of ethnic minor-ity groups (Okazaki & Sue, 1995b). One solution to this issuewould be to aggregate samples across individual studies throughmeta-analytic methods. Another reason for a meta-analytic reviewis that existing reviews have been qualitative (e.g., Greene, 1987;Gynther, 1989) and there have not been recent comprehensivereviews of the MMPI ethnic-differences literature. Moreover,since the earlier reviews of MMPI ethnic differences, the MMPI-2,which included ethnic minority persons in its normative sample,has been developed.
The purpose of this article is to review the MMPI and MMPI-2research that has compared ethnic groups over the past 31 years.We considered all studies since 1967 that included direct compar-isons of the MMPI/MMPI-2 Validity and Clinical scale scores ofmale and female European Americans and of male and femaleethnic minorities. Because we included only comparisons forwhich there were at least 10 different published studies, meta-analyses of MMPI/MMPI-2 studies only for male and femaleEuropean Americans, male and female African Americans, and
male Latino Americans are included. Where it was possible, wecreated subgroups of studies conducted in particular settings (i.e.,clinical, substance-abuse treatment, forensic, inpatient) to deter-
mine if MMPI/MMPI-2 scores across ethnic groups in relativelyhomogeneous settings are more similar than those in more heter-ogeneous settings. This subgrouping was conducted in part toprovide an estimate of the functional equivalence of psychopathol-ogy in these particular settings.
Method
Literature Search and Criteria for Inclusion
Studies included in the Psyclnfo database from 1967-1998 that directlycompared ethnic minority groups with European Americans on the MMPIor MMPI-2 were considered. Studies that did not report between-groupscomparisons were excluded, as were studies that did not report on allValidity and Clinical subscales of the MMPI. Male and female partici-pants' data were analyzed separately because combined analyses mayobscure potential gender differences. Studies that did not report separate
analyses for male and female participants were excluded. Also excludedwere studies that did not report between-groups means and standarddeviations or statistical comparisons for each of the three MMPI/MMPI-2Validity and 10 MMPI/MMPI-2 Clinical scales. Studies in which adoles-cents were administered the MMPI were considered for inclusion. Atleast 10 between-groups studies comparing European Americans versusanother male or female ethnic group were required to qualify for inclusionin these analyses. This resulted in the identification of 25 usable studies ofmale African Americans versus European Americans, 12 usable studies offemale African Americans, and 13 usable studies of male Latinos versusmale European Americans. There were not at least 10 usable studies ofLatinas (N = 4), or of male or female Asian Americans (N = 4) orAmerican Indians (N = 7).
Procedure
The individual study was the unit of analysis. Any overlapping samplesacross studies from the same studies were identified. If more than one studyhad sample overlap, then the study that analyzed the most inclusive samplewas included in the current meta-analyses. For individual studies thatcompared more than one sample (e.g., African American vs. EuropeanAmerican psychiatric inpatients and African American vs. European Amer-ican forensic patients), each sample comparison was considered as anindividual effect size. In studies in which the MMPI and MMPI-2 wereboth included, MMPI-2 data were used in the meta-analyses. The threeValidity and 10 Clinical scales were analyzed because these were consis-tently analyzed scales across studies and are included on both the MMPIand MMPI-2. We used AT-corrected T scores for each MMPI/MMPI-2 scaleunless only raw scores were reported. There were too few studies foranalyses that reported non-X-corrected T scores.
Several studies were identified that statistically controlled for demo-graphic characteristics (e.g., education, intellectual functioning). If thesestudies also included analyses in which demographic characteristics werenot statistically controlled, then the statistically controlled analyses wereincluded in the current meta-analysis. Other studies matched participantson demographic characteristics. In studies in which matched and un-matched analyses were presented, the matched analyses were included inthe current meta-analyses. Studies in which participants were generallyidentified as similar on a demographic characteristic (e.g., socioeconomicstatus), but in which the participants were not matched or in which thedemographic characteristic was not directly analyzed were not consideredto be demographically matched studies (e.g., Moore & Handal, 1980).
Calculation of Effect Size
The Pearson product-moment correlation between ethnicity and MMPI/MMPI-2 scales scores was used as an estimate of effect size, using theformulas provided by Rosenthal (1991). Pearson's r is more accurate thanCohen's d (1988) in estimating effect sizes in samples with unequal sizes(Rosenthal, 1991), which were common among the studies reviewed. Forstudies that reported no between-groups differences for certain MMPI/MMPI-2 scales and did not provide additional information to compute anexact effect size (e.g., test statistic, mean, standard deviation), a p value of.50 was assigned, which is an effect size of 0 (Rosenthal, 1991). Aftercorrelational estimates were computed for each study, the correlationcoefficients were transformed to Fisher's zs to normalize the distribution.Fisher's zs were weighted for each study in the current meta-analyses as afunction of sample size (i.e., weighting = N - 3). Weighted Fisher's zswere combined across studies and divided by the sum of the sample sizeweightings (N - 3) for each study for a mean weighted Fisher's z. Themean weighted Fisher's z was transformed to a correlation coefficient. Thecorrelation coefficient was also transformed to Cohen's d (1988) fordescriptive purposes using Rosenthal's (1991) formula: d = 2r/Vl - r2.
The statistical significance of the heterogeneity of the combined effectsizes in each meta-analysis was then determined in a chi-square analysis
ETHNICITY AND PSYCHOPATHOLOGY 189
Table 1Description of Samples in Studies of Male African Americans and Male European Americans
Study Age Ethnicity Match Population
Ben-Porath et al. (1995)Boone & Green (1991)Butcher et al. (1983)Costello et al. (1973)
Costello et al. (1973)Davis (1975)Goldman et al. (1995)Holcomb et al. (1984)Holland (1979)King et al. (1977)McCreary & Padilla (1977)McNulty et al. (1997)Moore & Handal (1980)Nelson et al. (1996)Patalano (1978)Patterson et al. (1981)Penk et al. (1982)Robyak & Byers (1990)Sutker & Kilpatrick (1973)Timbrook & Graham (1994)Velasquez & Callahan (1990b)Walters (1986)
Note. AA = African American; EA = European American. Match = Matching between ethnic groups ondemographic variables, or statistical control of such variables. The Minnesota Multiphasic Personality Inventory(MMPI) was used in all studies except Ben-Porath et al. (1995), Goldman et al. (1995), McNulty et al. (1997),and Timbrook & Graham (1994) in which the MMPI-2 was used.
based on the sum of weighted squared deviation Fisher's zs. The formulaused was x2 with K - 1 dfi = 2(N - 3)/(Z, - Z), where Zy is the Z forany single study, Z is the mean of all the Zs obtained, K is the number ofstudies being compared, and N is the number of participants per study(Rosenthal, 1991). Because comparisons were conducted for the 3 MMPI/MMPI-2 Validity and 10 Clinical scales within each of the three sets ofstudies (male African Americans vs. European Americans, female AfricanAmericans vs. European Americans, male Latino Americans vs. EuropeanAmericans) a p value of .004 (.5/13) was used as the criterion for statisticalsignificance. This correction procedure was implemented for the post hoccomparisons because there were no a priori hypotheses about MMPI/MMPI-2 ethnic differences. To determine the source of effect size heter-ogeneity, we categorized each study in terms of (a) age of participants(inclusion of adolescents vs. exclusively adults); (b) whether there wasmatching or statistical control for demographic variables (as discussedabove); (c) use of the MMPI versus MMPI-2; (d) whether the participantswere in clinical (e.g., psychiatric, forensic, substance abuse) versus non-clinical settings (e.g., school); and (e) the specific setting of the study (i.e.,substance abuse vs. other setting; forensic vs. other setting; inpatient,including incarceration vs. other setting).
To determine the number of studies averaging null results required tochange the overall significance level of the meta-analyses from statisticalsignificance to nonsignificance (or the converse), we used the formulaX = 19 s - n, where X is the number of other studies required to bring theoverall p to .50, 19 is the ratio of the total number of nonsignificant (at p >.05) results to the number of significant (at p < .05) results expected whenthe null hypothesis is true, 5 is the number of studies summarized in themeta-analysis significant at p < .05, and n is the number of summarized
studies not significant at p < .05 (Rosenthal, 1991). This number consti-tutes the fail safe statistic.
Results
Effect Size and Date of Publication
Pearson correlations between effect size and date of publicationof each of the studies were examined. Only MMPI studies wereincluded in these analyses, as the comparison of MMPI/MMPI-2studies is examined below. None of these correlations was statis-tically significant (all ps > .06). For the MMPI studies involvingAfrican American versus European American men, the absolutevalue of the mean correlation across MMPI scales was .21 (abso-lute value range = .01 to .54). For the MMPI studies involvingAfrican American versus European American women, the absolutevalue of the mean correlation across MMPI scales was .28 (abso-lute value range = .05 to .49). For the MMPI studies involvingLatino versus European American men, the absolute value of themean correlation across MMPI scales was .17 (absolute valuerange = .01 to .41).
Male African Americans VersusMale European Americans
The samples of male African Americans versus EuropeanAmericans are described in Table 1. Across studies, there were
190 HALL, BANSAL, AND LOPEZ
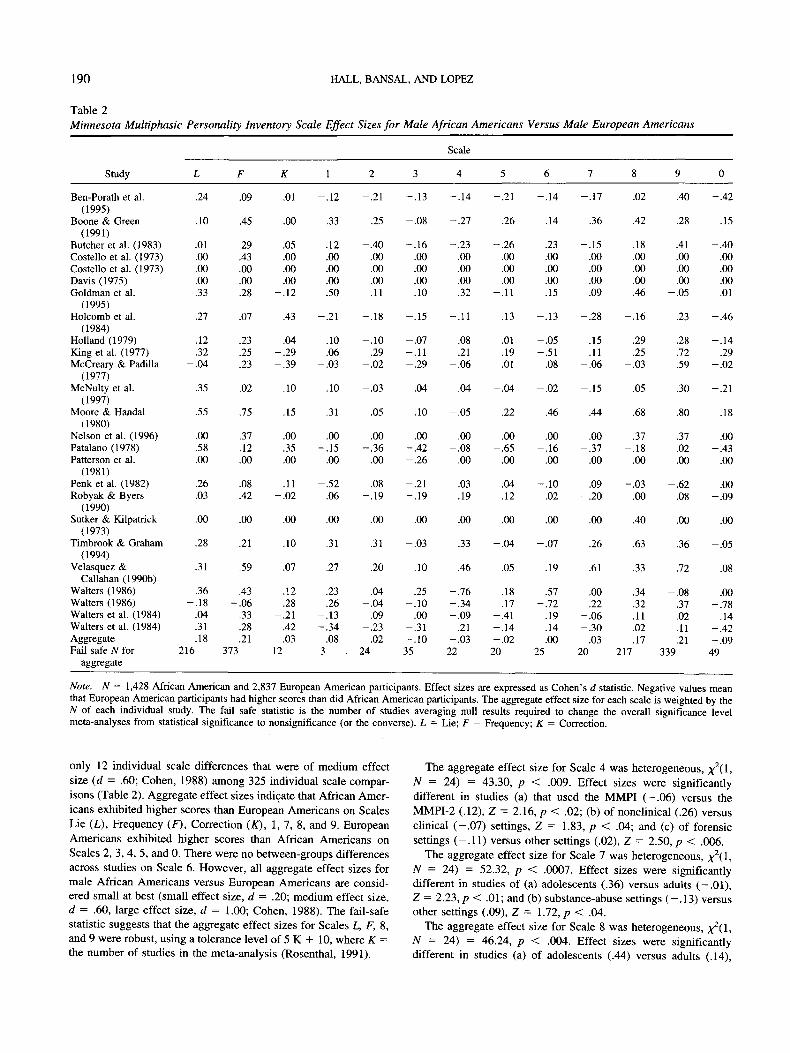
Table 2Minnesota Multiphasic Personality Inventory Scale Effect Sizes for Male African Americans Versus Male European Americans
Study
Ben-Porath et al.(1995)
Boone & Green(1991)
Butcher et al. (1983)Costello et al. (1973)Costello et al. (1973)Davis (1975)Goldman et al.
(1995)Holcomb et al.
(1984)Holland (1979)King et al. (1977)McCreary & Padilla
(1977)McNulty et al.
(1997)Moore & Handal
(1980)Nelson et al. (1996)Patalano (1978)Patterson et al.
(1981)Penk et al. (1982)Robyak & Byers
(1990)Sutker & Kilpatrick
(1973)Timbrook & Graham
(1994)Velasquez &
Callahan (1990b)Walters (1986)Walters (1986)Walters et al. (1984)Walters et al. (1984)AggregateFail safe N for
aggregate
L
.24
.10
.01
.00
.00
.00
.33
.27
.12
.32-.04
.35
.55
.00
.58
.00
.26
.03
.00
.28
.31
.36-.18
.04
.31
.18216
F
.09
.45
.29
.43
.00
.00
.28
.07
.23
.25
.23
.02
.75
.37
.12
.00
.08
.42
.00
.21
.59
.43-.06
.33
.28
.21373
K
.01
.00
.05
.00
.00
.00-.12
.43
.04-.29-.39
.10
.15
.00
.35
.00
.11-.02
.00
.10
.07
.12
.28-.21
.42
.0312
1
-.12
.33
.12
.00
.00
.00
.50
-.21
.10
.06-.03
.10
.31
.00-.15
.00
-.52.06
.00
.31
.27
.23
.26-.13-.34
.083
2
-.21
.25
-.40.00.00.00.11
-.18
-.10.29
-.02
-.03
.05
.00-.36
.00
.08-.19
.00
.31
.20
.04-.04
.09-.23-.0224
3
-.13
-.08
-.16.00.00.00.10
-.15
-.07-.11-.29
.04
.10
.00-.42-.26
-.21-.19
.00
-.03
.10
.25-.10
.00-.31-.1035
Scale
4
-.14
-.27
-.23.00.00.00.32
-.11
.08
.21-.06
.04
-.05
.00-.08
.00
.03-.19
.00
.33
.46
-.76-.34-.09
.21-.03
22
5
-.21
.26
-.26.00.00.00
-.11
.13
.01
.19
.01
-.04
.22
.00-.65
.00
.04-.12
.00
-.04
.05
.18
.17-.41-.14-.02
20
6
-.14
.14
.23
.00
.00
.00
.15
-.13
-.05-.51
.08
-.02
.46
.00-.16
.00
-.10-.02
.00
-.07
.19
.57-.72
.19
.14
.0025
7
-.17
.36
-.15.00.00.00.09
-.28
.15
.11-.06
-.15
.44
.00-.37
.00
.09-.20
.00
.26
.61
.00
.22-.06-.30
.0320
8
.02
.42
.18
.00
.00
.00
.46
-.16
.29
.25-.03
.05
.68
.37-.18
.00
-.03.00
.40
.63
.33
.34
.32
.11
.02
.17217
9
.40
.28
.41
.00
.00
.00-.05
.23
.28
.72
.59
.30
.80
.37
.02
.00
-.62.08
.00
.36
.72
-.08.37.02.11.21
339
0
-.42
.15
-.40.00.00.00.01
-.46
-.14.29
-.02
-.21
.18
.00-.43
.00
.00-.09
.00
-.05
.08
.00-.78
.14-.42-.09
49
Note. N = 1,428 African American and 2,837 European American participants. Effect sizes are expressed as Cohen's d statistic. Negative values meanthat European American participants had higher scores than did African American participants. The aggregate effect size for each scale is weighted by theN of each individual study. The fail safe statistic is the number of studies averaging null results required to change the overall significance levelmeta-analyses from statistical significance to nonsignificance (or the converse). L = Lie; F = Frequency; K = Correction.
only 12 individual scale differences that were of medium effectsize (d = .60; Cohen, 1988) among 325 individual scale compar-isons (Table 2). Aggregate effect sizes indicate that African Amer-icans exhibited higher scores than European Americans on ScalesLie (L), Frequency (F), Correction (K), 1, 7, 8, and 9. EuropeanAmericans exhibited higher scores than African Americans onScales 2, 3, 4, 5, and 0. There were no between-groups differencesacross studies on Scale 6. However, all aggregate effect sizes formale African Americans versus European Americans are consid-ered small at best (small effect size, d = .20; medium effect size,d = .60, large effect size, d = 1.00; Cohen, 1988). The fail-safestatistic suggests that the aggregate effect sizes for Scales L, F, 8,and 9 were robust, using a tolerance level of 5 K + 10, where K =the number of studies in the meta-analysis (Rosenthal, 1991).
The aggregate effect size for Scale 4 was heterogeneous,N = 24) = 43.30, p < .009. Effect sizes were significantlydifferent in studies (a) that used the MMPI (-.06) versus theMMPI-2 (.12), Z=2.l6,p< .02; (b) of nonclinical (.26) versusclinical (-.07) settings, Z = 1.83, p < .04; and (c) of forensicsettings (-.11) versus other settings (.02), Z = 2.50, p < .006.
The aggregate effect size for Scale 7 was heterogeneous, ^(1,N = 24) = 52.32, p < .0007. Effect sizes were significantlydifferent in studies of (a) adolescents (.36) versus adults (—.01),Z = 2.23,p < .01; and (b) substance-abuse settings (-.13) versusother settings (.09), Z = 1.72, p < .04.
The aggregate effect size for Scale 8 was heterogeneous, ^(1,N = 24) = 46.24, p < .004. Effect sizes were significantlydifferent in studies (a) of adolescents (.44) versus adults (.14),
ETHNICITY AND PSYCHOPATHOLOGY 191
Table 3Description of Studies of Female African Americans and Female European Americans
Study Age Ethnicity Match Population
Boone & Green (1991)Butcher et al. (1983)Costello et al. (1973)Goldman et al. (1995)Harrison & Kass (1967)McGill (1980)McNulty et al. (1997)Moore & Handal (1980)Nelson et al. (1996)Patalano (1978)Sutker & Kilpatrick
Incarcerated forensicInpatient psychiatricInpatient/outpatient psychiatricNonclinical collegeOutpatient prenatal clinicNonclinical welfare recipientsOutpatient mental healthNonclinical high schoolOutpatient pain centerInpatient substance abuseNonclinical college
Nonclinical national sample
Note. AA = African American; EA = European American. Match = Matching between ethnic groups ondemographic variables, or statistical control of such variables. The Minnesota Multiphasic Personality Inventory(MMPI) was used in all studies except Goldman et al. (1995), McNulty et al. (1997), and Timbrook & Graham(1994) in which the MMPI-2 was used.
Z = 2.19, p < .01; (b) in which African American and EuropeanAmerican participants were matched (.08) versus those in whichparticipants were not matched (.27), Z = 1.83, p < .03; (c) ofnonclinical (.38) versus clinical (.14) settings, Z = 1.69, p < .05;(d) of substance-abuse settings (—.03) versus other settings (.24),Z = 2.08, p < .02; and (e) of inpatient settings (.13) versus othersettings (.27), Z = 2.41, p < .008.
The aggregate effect size for Scale 9 was heterogeneous,N = 24) = 59.48, p < .00008. Effect sizes were significantlydifferent in studies of (a) adolescents (.32) versus adults (.20),Z = 1.91, p < .03; (b) substance-abuse settings (-.01) versusother settings (.30), Z = 4.05, p < .00003; and (c) of inpatientsettings (.15) versus other settings (.37), Z = 2.89, p < .002.
Female African Americans VersusFemale European Americans
The samples of female African Americans versus EuropeanAmericans are described in Table 3. Across studies, only 7 of 156individual scale differences constituted medium effect sizes andthere were no large effect sizes (Table 4). Aggregate effect sizesindicate that African Americans exhibited higher scores than Eu-ropean Americans on Scales L, F, 1, 2, 4, 5, 6, 7, and 8, and lowerscores on Scales K, 2, 3, and 9. There was no difference acrossstudies on Scale 0. As with the studies of male participants, allaggregate effect sizes in the female African American versusEuropean American studies are considered small. The fail-safestatistic suggests that aggregate effect sizes for Scales 5 and 9 wererobust.
The aggregate effect size for Scale 4 was heterogeneous, ^(l,ftf = ii) = 40.73, p < .000004. Because only one study was in asubstance-abuse setting and only one study was in a forensicsetting, these two variables were not examined as potential sourcesof variance in heterogeneous effect sizes. Effects sizes were sig-nificantly different in studies (a) of adolescents (-.40) versusadults (.09), Z = 1.87, p < .03; (b) of matched (.2,7) versusnonmarched (-.04) samples, Z = 2.34,p < .009; (c) in nonclinical
(.13) versus clinical (-.04) settings, Z = 2.89, p < .002; and (d)in studies of inpatient (-.02) versus other (.08) settings, Z = 2.51,p < .006.
Male Latino Americans Versus Male European Americans
Most of the studies of Latinos were of Mexican Americans(Table 5). Twenty-one of the 169 effect sizes across individualstudies constituted medium effects, and one constituted a largeeffect (Table 6). Aggregate effect sizes suggest that Latino Amer-icans had higher scores than European Americans on the threeValidity scales (L, F, and K) and lower scores on all Clinical scales(1, 2, 3, 4, 5, 6, 7, 8, 9, and 0), although all these effect sizes weresmall. The fail-safe statistic suggests that the aggregate effect sizeswere robust only for Scales L and 5.
The aggregate effect size for Scale 5 was heterogenous,N = 12) = 49.53, p < .0000001. However, none of the variablesconsidered significantly accounted for this variance.
Discussion
A general conclusion of this study is that MMPI/MMPI-2 dif-ferences among European Americans, African Americans, andLatino Americans are trivial. The MMPI and MMPI-2 apparentlydo not unfairly portray African Americans and Latino Americansas pathological. The aggregate effect sizes for each MMPI/MMPI-2 scale revealed that ethnic minority groups exhibitedgreater scores than European Americans on some scales and lowerscores on others in published studies conducted over the last 31years. Across studies, male African Americans exhibited higherscores than male European Americans on 7 MMPI/MMPI-2 scales,lower scores on 5 scales, and no difference on 1 scale. FemaleAfrican Americans exhibited higher scores than female EuropeanAmericans on 8 scales, lower scores on 4 scales, and no differenceon one scale across studies. Latino Americans exhibited higherscores across studies than male European Americans on 3 scalesand lower scores on 10 scales. However, most of the aggregate
192 HALL, BANSAL, AND LOPEZ
Table 4Minnesota Multiphasic Personality Inventory Scale Effect Sizes for Female African Americans Versus Female European Americans
Scale
Study
Boone & Green(1991)
Butcher et al. (1983)Costello et al. (1973)Goldman et al.
(1995)Harrison & Kass
(1967)McGill (1980)McNulty et al.
(1997)Moore & Handal
(1980)Nelson et al. (1996)Patalano (1978)Sutker & Kilpatrick
(1973)Timbrook & Graham
(1994)AggregateFail safe N for
aggregate
L
.60
.09
.00
.23
-.04
-.41.19
.51
.00
.31
.00
.20
.1023
F
.30
.09
.22
.00
.16
.00-.02
.25
.33
.06
.00
.20
.1328
K
-.05
-.23-.35-.31
-.04
-.50.05
-.03
.00-.02
.00
-.22
-.1230
1
.07
.18
.00
.00
.17
.00-.14
.14
.00-.30
.00
.22
.068
2
.06
-.18.00
-.04
.01
.00-.19
.34
.00-.29
.00
.12
-.0211
3
-.26
-.18.00
-.13
-.11
.00-.18
-.42
.00-.67
.00
.03
-.1125
4
-.54
.20
.38
.17
.02
.00-.08
-.01
.00-.69
.78
.33
.066
5
.17
.64
.00
.33
-.01
.43
.13
.30
.33
.71
.00
.43
.19120
6
.33
.23
.30
.30
.06
.00
.00
.38
.00
.05
.00
-.02
.0915
7
.11
-.06.00.00
.06
.00-.22
-.27
.00-.39
.00
-.21
-.061
8
.27
.27
.26
.22
.17
.00-.05
.14
.00-.24
.00
.20
.1217
9
.16
.67
.44
.18
.24
-.02.28
.03
.00
.08
.00
.31
.2498
0
.38
.10
.35
.09
-.13
.00-.18
.08
.33-.38
.00
.01
.009
Note. N = 1,053 African American and 1,470 European American participants. Effect sizes are expressed as Cohen's d statistic. Negative values meanthat European American participants had higher scores than did African American participants. The aggregate effect size for each scale is weighted by theN of each individual study. The fail-safe statistic is the number of studies averaging null results required to change the overall significance levelmeta-analyses from statistical significance to nonsignificance (or the converse). L = Lie; F = Frequency; K = Correction.
effect sizes were not statistically robust. Robust aggregate effectsizes were found only for Scales L, F, 8, and 9 in studies thatcompared male African Americans and European Americans,Scales 5 and 9 in studies that compared female African Americansand European Americans, and Scales L and 5 in studies thatcompared male Latino Americans and European Americans. Stud-ies that are published are typically biased toward statisticallysignificant differences (Rosenthal, 1991). Thus, many of the non-
robust aggregate differences are suspect. Although the actualbetween-ethnic groups differences may be attenuated somewhatbecause some studies did not report sufficient information tocompute exact effect sizes when between-groups differences werenot statistically significant, even when differences were found,they were not substantive. None of the aggregate effect sizes,including the robust ones, in the current meta-analyses qualify asa medium effect size. The small aggregate sizes that were found
Table 5Description of Samples in Studies of Male Latin Americans and Male European Americans
Study Age Ethnicity Match Population
Hibbs et al. (1979)
Holland (1979)McCreary & Padilla (1977)Nelson et al. (1996)Page & Bozlee (1982)Penk et al. (1989)Plemons (1977)Velasquez & Callahan (1990a)Velasquez et al. (1993)Velasquez et al. (1993)Velasquez et al. (1993)Venn (1988)Weisman et al. (1989)
Note. MA = Mexican American; EA = European American; L = Latino. Match = Matching between ethnicgroups on demographic variables, or statistical control of such variables. All studies used the MinnesotaMultiphasic Personality Inventory.
ETHNICITY AND PSYCHOPATHOLOGY 193
Table 6Minnesota Multiphasic Personality Inventory Scale Effect Sizes for Male Latinos Versus Male European Americans
Scale
Study
Hibbs et al. (1979)Holland (1979)McCreary & Padilla
(1977)Nelson et al. (1996)Page & Bozlee
(1982)Penk et al. (1989)Plemons (1977)Velasquez &
Callahan (1990a)Velasquez et al.
(1993)Velasquez et al.
(1993)Velasquez et al.
(1993)Venn (1988)Weisman et al.
(1989)AggregateFail safe N for
aggregate
L
.61
.19
.51
.51
.00
.00
.62
.15
.61
-.09
.05
.47
.16
.2198
F
.21
.05-.17
.03
.00
.00
.00-.27
.73
.66
.58
.01-.26
.029
K
.18-.15
.79
.30
.00
.00
.52
.30
-.13
-.18
-.26
-.16-.23
.019
1
-.32-.11
.32
.35
.00
.00
.00
.06
.91
.29
.64
-.17-.33
-.019
2
.35-.10
.00
.02
.93
.00
.00-.35
.36
.04
.39
-.38-.13
-.0212
3
.10-.29
.24
.01
.00
.00
.00-.21
.40
-.12
.44
-.60-.46
-.122
4
-.51-.27-.36
.01
.00
.00
.00-.70
.47
.55
-.07
-.60-.41
-.1629
5
-.12-.42-.28
-.40.00
.00-.62-.90
.06
-1.45
.00
-.51-.87
-.34221
6
.01-.27-.16
-.06.00
.00
.00-.45
.44
.90
.42
.03-.39
-.127
7
-.03-.11
.09
.13
.00
.00
.00-.43
.32
.07
.24
-.63-.35
-.085
8
.21-.08
.08
.09
.00
.00
.00-.37
.69
.51
.66
-.42-.35
-.0312
9
-.05-.04-.39
-.04.00
.00
.00-.05
.78
.23
.88
-.12-.33
-.0413
0
.16-.14-.44
-.02.00
.00
.00-.47
.26
.14
-.19
.07-.07
-.077
Note. N = 500 Latino American and 1345 European American participants. Effect sizes are expressed as Cohen's d statistic. Negative values mean thatEuropean American participants had higher scores than did Latino participants. The aggregate effect size for each scale is weighted by the N of eachindividual study. The fail-safe statistic is the number of studies averaging null results required to change the overall significance level meta-analyses fromstatistical significance to nonsignificance (or the converse). L = Lie; F = Frequency; K = Correction.
for all MMPI/MMPI-2 scales in this study constitute less than 5T-score points on any particular MMPI scale, which is not clini-cally meaningful (Greene, 1987).
The largest aggregate effect size in this study was the differencebetween male Latino Americans and European Americans onScale 5, with male Latinos scoring lower on the scale. AlthoughScale 5 is heterogeneous in content, lower scores may suggeststereotypically masculine preferences in work, hobbies, and otheractivities (Graham, 1993). This was a robust finding, in that 221studies would be required to change this significant difference to anonsignificant one. There may exist subgroups of Latino menhaving a traditionally masculine gender identity, but it is unknownif such subgroups of men are any larger in Latino cultures than inother cultures (Casas, Wagenheim, Banchero, & Mendoza-Romero, 1995). Moreover, there may be positive aspects of somepatriarchal cultural groups, including family nurturance and asense of community (Sorenson & Siegel, 1992). It is unknownfrom these analyses whether different extra-test behaviors areassociated with Scale 5 for Latino versus European American men.Although the aggregate effect size for Scale 5 in studies of maleLatino versus European Americans was heterogeneous, effect sizesdid not differ across settings. Moreover, effect sizes in studies forwhich there was matching based on sociodemographic character-istics did not differ from those in which there was not. Perhaps thefailure in these analyses to detect a specific source of the hetero-geneity of the aggregate Scale 5 effect size was that most of thesources of heterogeneity that were tested in this study involveddifferent cJinical settings. Scale 5 is not strictly a measure of
psychopathology (Graham, 1993) and may not differ across clin-ical settings. Although the effect size for Scale 5 for male Latinosversus European Americans was the largest aggregate effect size inthe current meta-analyses, it should be kept in mind that this isconsidered a small effect (i.e., less than 5 MMPI/MMPI-2 T-scorepoints).
Sociodemographic influences had remarkably little influence onthe findings. Twelve of the studies considered in the currentmeta-analyses included some form of matching of participants onsociodemographic variables. Effect sizes did not differ betweenstudies that matched and did not match participants, with theexceptions of MMPI/MMPI-2 Scale 4 in the comparisons betweenmale and female African Americans and European Americans, andMMPI/MMPI-2 Scale 8 for male African Americans and EuropeanAmericans. In the male comparisons, ethnic differences weresmaller in matched studies, whereas ethnic differences were largerin the matched studies for the female comparisons. Effect sizes instudies that included adolescents were not significantly greaterthan the effect sizes in studies that included only adults, with theexceptions of Scales 7, 8, and 9 for male African Americans andEuropean Americans, and Scale 4 for female African Americansand European Americans. There is some evidence that elevationson Scales 4, 7, 8, and 9 are generally greater among adolescentsthan among adults (Graham, 1990). Thus, the larger effect sizes onthese scales among adolescents in this study may be a function ofa less restricted range of scores (i.e., more variance) relative toadults.
194 HALL, BANSAL, AND LOPEZ
Effect sizes generally were not different in studies that used theMMPI versus the MMPI-2. However, MMPI-2 studies yieldedlarger effects sizes than the MMPI for Scales 1 and 4 for maleAfrican Americans versus European Americans and for Scale 4 forfemale African Americans versus European Americans. Unlike theMMPI, ethnic minority samples were included in the MMPI-2standardization sample. The current results suggest that inclusionof ethnic minorities in a standardization sample does not neces-sarily eliminate all ethnic differences. Nevertheless, none of theaggregate individual scale effect size differences in the MMPI-2studies constituted a medium effect size or greater. The primaryconclusion is that differences between European Americans andAfrican Americans, and between male European Americans andmale Latinos on both the MMPI and the MMPI-2 are minimal.
These findings provide some evidence that the behavior mea-sured by the MMPI/MMPI-2 is functionally equivalent. Most ofthe MMPI/MMPI-2 scale effect sizes in the current meta-analyseswere not heterogeneous, meaning that effect sizes did not signif-icantly vary across studies or settings. In no instance did any effectsize for a subset of studies (MMPI vs. MMPI-2, adolescent vs.adult samples, clinical vs. nonclinical samples, substance-abuse vs.other settings, forensic vs. other settings, inpatient vs. other set-tings) reach or exceed a medium effect size. These findings maymean that self-reported psychopathology is generally equivalentacross ethnic groups in the settings that were examined in thisstudy, which included educational, employment, medical, and psy-chiatric settings. In most cases in which aggregate effect sizes weresignificantly heterogeneous, studies from homogeneous settings(i.e., clinical, inpatient) yielded smaller between-ethnic groupsdifferences than did studies from other settings. Thus, it does notappear that there are major ethnic differences in self-reportedpsychopathology in most clinical and psychiatric settings. Excep-tions were for male African Americans and European Americansfor which there were somewhat larger effect sizes on Scale 4 inforensic samples versus other samples (African Americans hadlower scores in forensic samples) and for Scale 7 in substance-abuse treatment versus other samples (African Americans hadlower scores in substance-abuse samples). These exceptions maybe a function of a generally greater range of psychopathology inforensic and substance-abuse populations. Alternatively, it couldbe contended that a lower criterion level of psychopathology wassufficient for African American than for European American mento qualify for involvement in forensic and substance-abuse pro-grams. Nevertheless, these ethnic differences in psychopathologyassociated with clinical setting occurred for only 2 of the 39aggregate MMPI/MMPI-2 scale comparisons in this study.
Although the behaviors measured by the MMPI/MMPI-2 appearfunctionally equivalent in most of the clinical settings assessed inthe current meta-analyses, this does not necessarily mean that thebehaviors are functionally equivalent in ethnic community con-texts. A limitation of the current study is that no extra-test mea-sures were consistently available across studies. It is possible thatthe behaviors measured by the MMPI/MMPI-2 could have a verydifferent impact in European American versus non-EuropeanAmerican communities. Such community impact may not be ad-equately assessed by the mental health professionals who usuallydiagnose clients, and who are highly unlikely to be ethnic minoritypersons (Bernal & Castro, 1994). In fact, there is evidence ofclinical judgment bias against ethnic minority persons for certain
diagnoses (Garb, 1997; Snowden & Cheung, 1990). One methodof reducing bias might be to include ratings of ethnic minoritypersons by ethnic minority mental health professionals as extra-test measures (cf. S. Sue, Fujino, Hu, Takeuchi, & Zane, 1991). Amore portable approach might be to have ethnic minority mentalhealth professionals develop culturally sensitive measures thatcould be used across settings.
Another culturally sensitive extra-test measure might involvepeer ratings by members of the same ethnic group as the personbeing rated. There is evidence that the correlations between partnerratings and MMPI-2 scores generally do not significantly differbetween African Americans and European Americans (Timbrook& Graham, 1994). However, the ethnicity of the partners was notspecified in that study and the peer ratings were in response to anexisting adjustment scale that was not necessarily designed for usewith ethnic minority populations. Peer ratings may also be biased.For example, a friend or spouse could have a positive bias. Lessbias might occur in same ethnicity peer ratings from colleaguesfrom employment or educational settings. In general, effortsshould be made to gather culturally sensitive extra-test data todetermine the contextual impact of the behavior measured bypersonality tests.
The current results appear consistent with epidemiological datathat suggest few ethnic differences in psychopathology (Huertin-Roberts et al., 1997; Karno et al., 1987; Roberts & Sobhan, 1992;Robins et al., 1984). Recent evidence also suggests the consistencyof personality structure across cultures (McCrae & Costa, 1997).However, it is possible that there are ethnic differences in psycho-pathology and the commonly used tests and diagnostic classifica-tions are insensitive to such differences. One possible reason forsuch insensitivity may be the etic nature of many personality testsand diagnostic classifications, which may exclude important per-sonality characteristics and aspects of psychopathology specific tonon-European American cultures. The content of the MMPI andMMPI-2 was not developed with specific attention to the multiplecultural groups in the United States to which the tests would beadministered (Dana & Whatley, 1991; Park et al., 1988; Suzuki &Kugler, 1995).
Even if the current lack of ethnic differences in psychopathol-ogy was replicated with culturally sensitive test and extra-testmeasures, there may still exist important ethnic personality differ-ences. It has been contended that a lack of difference betweenadvantaged and disadvantaged groups may mean that the disad-vantaged group had made efforts to overcome the disadvantage(Hall & Barongan, 1997). Equal levels of psychopathology be-tween American majority and minority groups may imply that theminority groups are engaging in additional coping with stressors(e.g., societal discrimination) that the majority group experiencesless of the time. Thus, another important extra-test construct tomeasure would be any impediments to psychological health thatmay differentially affect certain groups.
A general limitation of meta-analysis is that a common databaseis necessary for inclusion. Thus, some MMPI/MMPI-2 studies ofethnic minority populations were excluded because data werereported that were not comparable with the data from studies thatwere included (e.g., male and female data combined, data from asingle ethnic group reported, selected MMPI/MMPI-2 scales in-cluded). A weakness of the current meta-analyses is the limitednumber of studies that qualified for inclusion. Nevertheless, rela-
ETHNICITY AND PSYCHOPATHOLOGY 195
lively large numbers of male African Americans (TV = 1,428),female Americans (N = 1,053), and male Latino Americans (N =500) were included in the current meta-analyses. However, onlyfour of the studies involving African Americans and none involv-ing Latinos in the current meta-analyses used the MMPI-2. Therewere fewer than 10 available comparative studies per group toconduct meta-analyses involving Latinas, Asian Americans, orAmerican Indians.
The MMPI-2 is the most widely used personality instrument andits applicability and limitations with ethnic minority populationsneed to be more fully investigated. Despite the general absence ofethnic differences in this study, most of the effect sizes were notrobust, and more research is necessary to determine whether thereare ethnic differences on the MMPI-2. Missing from most of thestudies in the current meta-analyses was a consideration of within-group variability that might be associated with psychopathology.For example, most of the studies did not report how participantethnicity was determined. Presumably, participants designatedtheir ethnicity. Only one study examined the degree of accultura-tion of the participants. In this study, most participants wereidentified with Mexican culture (Velasquez & Callahan, 1990a).Alternatively, it is possible that many of the ethnic minorityparticipants in the studies reviewed were relatively disidentifiedwith their ethnic group, insofar as they were involved in main-stream European American institutions (e.g., colleges, mentalhealth centers, psychiatric hospitals, Veterans Affairs hospitals).
Perhaps the emphasis in the currently reviewed studies onbetween-ethnic groups differences resulted in a lack of attention towithin-group differences. However, there is certainly a great de-gree of variability within all ethnic groups, including EuropeanAmericans. Such variables as generation in the United States,language fluency, acculturation, ethnic identity, perceived minor-ity status, and discrimination are within-group variables thatshould be considered. The assessment of ethnicity has becomemuch more sophisticated than simple self-report of one's ethnicgroup, as was used in most of the currently reviewed studies(Kohatsu & Richardson, 1996; Sabnani & Ponterotto, 1992). Be-cause of this degree of within-group variability and the difficultiesin controlling for relevant between-groups demographic differ-ences, Phinney (1996) had contended that between-groups studiesshould not be conducted and that the sole focus should be onwithin-group variability. Nevertheless, ethnic differences researchis important in determining the applicability and limits of psycho-logical theories and tests (Ben-Porath, 1990; Okazaki & Sue,1995b; Triandis & Brislin, 1984). Future personality and psycho-pathology research should examine both between- and within-groups variability.
References
References marked with an asterisk indicate studies included inthe meta-analysis.
Adebimpe, V. R. (1994). Race, racism, and epidemiological surveys.Hospital and Community Psychiatry, 45, 27-31.
American Psychiatric Association. (1987). Diagnostic and statistical man-ual of mental disorders (3rd ed., rev.). Washington, DC: Author.
Arroyo, C. G., & Zigler, E. (1995). Racial identity, academic achievement,and the psychological well-being of economically disadvantaged ado-lescents. Journal of Personality and Social Psychology, 69, 903-914.
Ben-Porath, Y. S. (1990). Cross-cultural assessment of personality: Thecase for replicatory factor analysis. In J. N. Butcher & C. D. Spielberger(Eds.), Advances in personality assessment (Vol. 8, pp. 27-48). Hills-dale, NJ: Erlbaum.
* Ben-Porath, Y. S., Shondrick, D. D., & Stafford, K. P. (1995). MMPI-2and race in a forensic diagnostic sample. Criminal Justice and Behav-ior, 22, 19-32.
Bernal, M. E., & Castro, F. G. (1994). Are clinical psychologists preparedfor service and research with ethnic minorities? Report of a decade ofprogress. American Psychologist, 49, 797-805.
*Boone, D., & Green, S. B. (1991). Predicting with the MMPI theadjustment of juvenile delinquents to institutionalization: Does gendermake a difference? Journal of Personality Assessment, 57, 61-76.
* Butcher, J. N., Braswell, L., & Raney, D. (1983). A cross-culturalcomparison of American Indian, Black, and White inpatients on theMMPI and presenting symptoms. Journal of Consulting and ClinicalPsychology, 51, 587-594.
Butcher, J. N., Dahlstrom, W. G., Graham, J. R., Tellegen, A., & Kaem-mer, B. (1989). MMPI-2: Manual for administration and scoring. Min-neapolis: University of Minnesota Press.
Butcher, J. N., Graham, J. R., & Ben-Porath, Y. S. (1995). Methodologicalproblems and issues in MMPI, MMPI-2, and MMPI-A research. Psy-chological Assessment, 7, 320-329.
Butcher, J. N., & Williams, C. L. (1992). Essentials of MMPI-2 andMMPI-A interpretation. Minneapolis: University of Minnesota Press.
Casas, J. M., Wagenheim, B. R., Banchero, R., & Mendoza-Romero, J.(1995). Hispanic masculinity: Myth or psychological schema meritingconsideration. In A. M. Padilla (Ed.), Hispanic psychology: Criticalissues in theory and research (pp. 231-244). Thousand Oaks, CA: Sage.
Cohen, J. (1988). Statistical power analysis for the behavioral sciences(2nd ed.). Hillsdale, NJ: Erlbaum.
* Costello, R. M., Fine, H. J., & Blau, B. I. (1973). Racial comparisons onthe Minnesota Multiphasic Personality Inventory. Journal of ClinicalPsychology, 29, 63-65.
Dana, R. H. (1988). Culturally diverse groups and MMPI interpretation.Professional Psychology: Research and Practice, 19, 490-495.
Dana, R. H. (1993). Multicultural assessment perspectives for professionalpsychology. Boston: Allyn & Bacon.
Dana, R. H., & Whatley, P. R. (1991). When does a difference make adifference? MMPI scores and African-Americans. Journal of ClinicalPsychology, 47, 400-406.
* Davis, W. E. (1975). Race and the differential "power" of the MMPI.Journal of Personality Assessment, 39, 138-140.
Florsheim, P., Tolan, P. H., & Gorman-Smith, D. (1996). Family processesand risk for externalizing behavior problems among African Americanand Hispanic boys. Journal of Consulting and Clinical Psychology, 64,1222-1230.
Fordham, S. (1988). Racelessness as a factor in Black students' schoolsuccess: Pragmatic strategy or pyrrhic victory? Harvard EducationalReview, 58, 54-84.
Fordham, S., & Ogbu, J. U. (1986). Black students' school success: Copingwith the "burden of acting White." Urban Review, 18, 176-206.
Garb, H. N. (1997). Race bias, social class bias, and gender bias in clinicaljudgment. Clinical Psychology: Science and Practice, 4, 99-120.
* Goldman, V. J., Cooke, A., & Dahlstrom, W. G. (1995). Black-Whitedifferences among college students: A comparison of MMPI andMMPI-2 norms. Assessment, 2, 293-299.
Graham, J. R. (1990). MMPI-2: Assessing personality and psychopathol-ogy. New York: Oxford University Press.
Graham, J. R. (1993). MMPI-2: Assessing personality and psychopathol-ogy (2nd ed.). New York: Oxford University Press.
Greene, R. L. (1987). Ethnicity and MMPI performance: A review. Journalof Consulting and Clinical Psychology, 55, 497-512.
Greenfield, P. M. (1994). Independence and interdependence as develop-
196 HALL, BANSAL, AND LOPEZ
mental scripts: Implications for theory, research, and practice. In P. M.Greenfield & R. R. Cocking (Eds.), Cross-cultural roots of minoritychild development (pp. 1-37). Hillsdale, NJ: Erlbaum.
Gynther, M. D. (1989). MMPI comparisons of Blacks and Whites: Areview and commentary. Journal of Clinical Psychology, 45, 878-883.
Hall, G. C. N., & Barongan, C. (1997). Prevention of sexual aggression:Sociocultural risk and protective factors. American Psychologist, 52, 5-14.
* Harrison, R. H., & Kass, E. H. (1967). Differences between Negro andWhite pregnant women on the MMPI. Journal of Consulting and Clin-ical Psychology, 31, 454-463.
* Hibbs, B. J., Kobos, J. C., & Gonzalez, J. (1979). Effects of ethnicity, sexand age on MMPI profiles. Psychological Reports, 45, 591-597.
Hill, H. M., Soriano, F. I., Chen, S. A., & LaFromboise, T. D. (1994).Sociocultural factors in the etiology and prevention of violence amongethnic minority youth. In L. D. Eron, J. H. Gentry, & P. Schegel (Eds.),Reason to hope: A psychosocial perspective on violence and youth (pp.59-97). Washington, DC: American Psychological Association.
* Holcomb, W. R., Adams, N. A., & Ponder, H. M. (1984). Are separateBlack and White MMPI norms needed? An IQ-controlled comparison ofaccused murderers. Journal of Clinical Psychology, 40, 189-193.
* Holland, T. R. (1979). Ethnic group differences in MMPI profile patternand factorial structure among adult offenders. Journal of PersonalityAssessment, 43, 72-77.
Huertin-Roberts, S., Snowden, L., & Miller, L. (1997). Expressions ofanxiety in African Americans: Ethnography and the epidemiologicalcatchment area studies. Culture, Medicine and Psychiatry, 21, 337-363.
Inman, M. L., & Baron, R. S. (1996). Influence of prototypes on percep-tions of prejudice. Journal of Personality and Social Psychology, 70,727-739.
Jones, J. M. (1988). Racism in black and white: A bicultural model ofreaction and evolution. In P. A. Katz & D. A. Taylor (Eds.), Eliminatingracism: Profiles in controversy (pp. 117-135). New York: Plenum.
Jones, J. M. (1991). Psychological models of race: What have they beenand what should they be? In J. Goodchilds (Ed.), Psychological per-spectives on human diversity in America (pp. 3-46). Washington, DC:American Psychological Association.
Karno, M., Hough, R. L., Burnam, A., Escobar, J. I., Timbers, D. M.,Santana, F., & Boyd, J. H. (1987). Lifetime prevalence of specificpsychiatric disorders among Mexican Americans and non-HispanicWhites in Los Angeles. Archives of General Psychiatry, 44, 695-701.
Kessler, R. C., McGonagle, K. A., Zhao, S., Nelson, C. B., Hughes, M.,Eshleman, S., Wittchen, H., & Kendler, K. S. (1994). Lifetime and12-month prevalence of DSM-III-R psychiatric disorders in the UnitedStates. Archives of General Psychiatry, 51, 8-19.
* King, H. F., Carroll, J. L., & Fuller, G. B. (1977). Comparison ofnonpsychiatric Blacks and Whites on the MMPI. Journal of ClinicalPsychology, 33, 725-728.
Kohatsu, E. L., & Richardson, T. Q. (1996). Racial and ethnic identityassessment. In L. A. Suzuki, P. J. Meller, & J. G. Ponterotto (Eds.),Handbook of multicultural assessment: Clinical, psychological, andeducational applications (pp. 611—650). San Francisco: Jossey-Bass.
Mackenzie, B. (1984). Explaining race differences in IQ: The logic, themethodology, and the evidence. American Psychologist, 39, 1214-1233.
Markus, H. R., & Kitayama, S. (1991). Culture and the self: Implications forcognition, emotion, and motivation. Psychological Review, 98, 224-253.
McCrae, R. R., & Costa, P. T. (1997). Personality trait structure as a humanuniversal. American Psychologist, 52, 509-516.
* McCreary, C., & Padilla, E. (1977). MMPI differences among Black,Mexican-American, and White male offenders. Journal of Clinical Psy-chology, 33, 171-177.
* McGill, J. C. (1980). MMPI score differences among Anglo, Black, andMexican American welfare recipients. Journal of Clinical Psychol-ogy, 36, 147-151.
* McNulty, J. L., Graham, J. R., Ben-Porath, Y. S., & Stein, L. A. R.
(1997). Comparative validity of MMPI-2 scores of African Americanand Caucasian mental health center clients. Psychological Assessment, 9,464-470.
Meehl, P. E. (1971). High school yearbooks: A reply to Schwartz. Journalof Abnormal Psychology, 77, 143-148.
* Moore, C. D., & Handal, P. J. (1980). Adolescents' MMPI performance,cynicism, estrangement, and personal adjustment as a function of raceand sex. Journal of Clinical Psychology, 36, 932—936.
Myers, H. F., Kagawa-Singer, M., Kumanyika, S. K., Lex, B. W., Markides,K. S., et al. (1995). Panel HI: Behavioral risk factors related to chronicdiseases in ethnic minorities. Health Psychology, 14, 613-621.
* Nelson, D. V., Novy, D. M., Averill, P. M., & Berry, L. A. (1996). Ethniccomparability of the MMPI in pain patients. Journal of Clinical Psy-chology, 52, 485-497.
Okazaki, S. (1997). Sources of ethnic differences between Asian Ameri-cans and White American college students on measures of depressionand social anxiety. Journal of Abnormal Psychology, 106, 52-60.
Okazaki, S., & Sue, S. (1995a). Cultural considerations in psychologicalassessment of Asian-Americans. In J. N. Butcher (Ed.), Clinical person-ality assessment: Practical approaches (pp. 107-119). New York: Ox-ford University Press.
Okazaki, S., & Sue, S. (1995b). Methodological issues in assessmentresearch with ethnic minorities. Psychological Assessment, 7, 367—375.
* Page, R. D., & Bozlee, S. (1982). A cross-cultural MMPI comparison ofalcoholics. Psychological Reports, 50, 639-646.
Park, K. B., Upshaw, H. S., & Koh, S. D. (1988). East Asians' responses toWestern health items. Journal of Cross-Cultural Psychology, 19, 51-64.
Parker, K. C. H., Hanson, R. K., & Hunsley, J. (1988). MMPI, Rorschach,and WAIS: A meta-analytic comparison of reliability, stability, andvalidity. Psychological Bulletin, 103, 367-373.
* Patalano, F. (1978). Personality dimensions of drug abusers who enter adrug-free therapeutic community. Psychological Reports, 42, 1063—1069.
* Patterson, E. T., Charles, H. L., Woodward, W. A., Roberts, W. R., &Penk, W. E. (1981). Differences in measures of personality and familyenvironment among Black and White alcoholics. Journal of Consultingand Clinical Psychology, 49, 1-9.
* Penk, W. E., Roberts, W. R., Robinowitz, R., Dolan, M. P., Atkins, H. G.,& Woodward, W. A. (1982). MMPI differences of Black and Whitemale polydrug abusers seeking treatment. Journal of Consulting andClinical Psychology, 50, 463-465.
* Penk, W. E., Robinowitz, R., Black, J., Dolan, M., Bell, W., Dorsett, D.,Ames, M., & Noriega, L. (1989). Ethnicity: Post-traumatic stress disor-der (PTSD) differences among Black, White, and Hispanic veterans whodiffer in degrees of exposure to combat in Vietnam. Journal of ClinicalPsychology, 45, 729-735.
Phinney, J. (1989). Stages of ethnic identity development in minority groupadolescents. Journal of Early Adolescence, 9, 34-49.
Phinney, J. (1992). The Multigroup Ethnic Identity Measure: A new scale foruse with diverse groups. Journal of Adolescent Research, 7, 156-176.
Phinney, J. S. (1996). When we talk about American ethnic groups, whatdo we mean? American Psychologist, 51, 918-927.
* Plemons, G. (1977). A comparison of MMPI scores of Anglo- andMexican-American psychiatric patients. Journal of Consulting and Clin-ical Psychology, 45, 149-150.
Pritchard, D. A., & Rosenblatt, A. (1980). Racial bias in the MMPI: Amethodological review. Journal of Consulting and Clinical Psychol-ogy, 48, 263-267.
Roberts, R. E., & Sobhan, M. (1992). Symptoms of depression in adoles-cence: A comparison of Anglo, African, and Hispanic Americans. Jour-nal of Youth and Adolescence, 21, 639-651.
Robins, L. N., Helzer, J. E., Weissman, M. M., Oraschel, H., Gruenberg,E., Burke, J. D., & Regier, D. A. (1984). Lifetime prevalence of specificpsychiatric disorders in three sites. Archives of General Psychiatry, 41,949-958.
ETHNICITY AND PSYCHOPATHOLOGY 197
* Robyak, J. E., & Byers, P. H. (1990). Effects of race and severity ofalcoholism on MMPIs of male alcoholics. Journal of Social Behaviorand Personality, 5, 409-416.
Rosenthal, R. (1991). Mela-analytic procedures for social research (Rev.ed.). Newbury Park, CA: Sage.
Ruggiero, K. M, & Taylor, D. M. (1997). Why minority group membersperceive or do not perceive the discrimination that confronts them: Therole of self-esteem and perceived control. Journal of Personality andSocial Psychology, 72, 373-389.
Sabnani, H. B., & Ponterotto, J. G. (1992). Racial/ethnic minority-specificinstrumentation in counseling research: A review, critique, and recom-mendations. Measurement and Evaluation in Counseling and Develop-ment, 24, 161-187.
Snowden, L. R., & Cheung, F. K. (1990). Use of inpatient mental healthservices by members of ethnic minority groups. American Psycholo-gist, 45, 347-355.
Sorenson, S. B., & Siegel, J. M. (1992). Gender, ethnicity, and sexualassault: Findings from a Los Angeles study. Journal of Social Issues, 48,93-104.
Steele, C. M. (1997). A threat in the air: How stereotypes shape intellectualidentity and performance. American Psychologist, 52, 613-629.
Sue, D. W., & Sue, D. (1990). Counseling the culturally different: Theoryand practice (2nd ed.). New York: Wiley.
Sue, S., Fujino, D. C., Hu, L., Takeuchi, D., & Zane, N. W. S. (1991).Community mental health services for ethnic minority groups: A test ofthe cultural responsiveness hypothesis. Journal of Consulting and Clin-ical Psychology, 59, 533-540.
* Sutker, P. B., & Kilpatrick, D. G. (1973). Personality, biographical, andracial correlates of sexual attitudes and behavior. Proceedings of the 81stAnnual American Psychological Association Convention, 8, 262-262.
Suzuki, L. A., & Kugler, I. F. (1995). Intelligence and personality assess-ment: Multicultural perspectives. In J. G. Ponterotto, J. M. Casas, L. A.Suzuki, & C. M. Alexander (Eds.), Handbook of multicultural counsel-ing (pp. 493-515). Thousand Oaks, CA: Sage.
Suzuki, L. A., & Valencia, R. R. (1997). Race-ethnicity and measuredintelligence: Educational implications. American Psychologist, 52,1103-1114.
Tanaka, J. S., Ebreo, A., Linn, N., & Morera, O. F. (1998). Researchmethods: The construct validity of self-identity and its psychological
implications. In L. C. Lee & N. W. S. Zane (Eds.), Handbook of AsianAmerican psychology (pp. 21-79). Thousand Oaks, CA: Sage.
* Timbrook, R. E., & Graham, J. R. (1994). Ethnic differences on theMMPI-2? Psychological Assessment, 6, 212-217.
Triandis, H. C., & Brislin, R. W. (1984). Cross-cultural psychology.American Psychologist, 39, 1006-1016.
* Velasquez, R. J., & Callahan, W. J. (1990a). MMPI comparisons ofHispanic- and White-American veterans seeking treatment for alcohol-ism. Psychological Reports, 67, 95-98.
* Velasquez, R. J., & Callahan, W. J. (1990b). MMPIs of Hispanic, Black,and White DSM-111 schizophrenics. Psychological Reports, 66, 819-822.
* Velasquez, R. J., Callahan, W. J., & Young, R. (1993). Hispanic-WhiteMMPI comparisons: Does psychiatric diagnosis make a difference?Journal of Clinical Psychology, 49, 528-534.
* Venn, J. (1988). MMPI profiles of Native-, Mexican-, and Caucasian-American male alcoholics. Psychological Reports, 62, 427-432.
Walters, G. D. (1986). Screening for psychopathology in groups of Blackand White prison inmates by means of the MMPI. Journal of PersonalityAssessment, 5, 257-264.
Walters, G. D., Greene, R. L., & Jeffrey, T. B. (1984). Discriminatingbetween alcoholic and nonalcoholic Blacks and Whites on the MMPI.Journal of Personality Assessment, 48, 486-488.
Weiner, I. B. (1995). Psychometric issues in forensic applications of theMMPI-2. In Y. S. Ben-Porath, J. R. Graham, G. C. N. Hall, R. D.Hirschman, & M. S. Zaragoza (Eds.), Forensic applications of theMMPI-2 (pp. 48-81). Thousand Oaks, CA: Sage.
* Weisman, C. P., Anglin, M. D., & Fisher, D. G. (1989). The MMPIprofiles of narcotics addicts: II. Ethnic and criminal history effects.International Journal of the Addictions, 24, 881-896.
Zalewski, C. E., & Gottesman, 1.1. (1991). (Hu)Man versus mean revisited:MMPI group data and psychiatric diagnosis. Journal of Abnormal Psy-chology, 100, 562-568.
Received June 15, 1998Revision received November 16, 1998
Accepted November 24, 1998
ORDER FORMStart my 1999 subscription to Psychological Assessment!ISSN: 1040-3590
$46.00, APA Member/Affiliate$92.00, Individual Non-Member$188.00, InstitutionTOTAL AMOUNT ENCLOSED $.
Subscription orders must be prepaid. (Subscriptions are ona calendar basis only.) Allow 4-6 weeks for delivery of thefirst issue. Call for international subscription rates.
SEND THIS ORDER FORM TO:American Psychological AssociationSubscriptions750 First Street, NEWashington, DC 20002-4242