36
Ethnicity, Immigration and Demographic Change in Upstate New York Metropolitan Centers Polly J. Smith, Ph.D. Alexander R. Thomas, Ph. D. Jan DeAmicis, Ph.D.
Ethnicity, Immigration and Demographic Change in Upstate New York
Metropolitan Centers
Polly J. Smith, Ph.D. Alexander R. Thomas, Ph. D.
Jan DeAmicis, Ph.D.
Ethnicity, Immigration and Demographic Change in Upstate New York Metropolitan Centers
Abstract
In this report we examine the impact of immigration and “white flight” on central cities in
upstate New York metropolitan areas. By examining census data from 2000 and 2010, we found
that cities in eastern New York State—those east of route 12—gained in population while most
of those west of route 12 lost population. This trend was seen despite significant losses of the
white population primarily because of immigration. Cities that lost population did so primarily
because of an inability to attract recent immigrant groups to the city.
1 | P a g e
Ethnicity, Immigration and Demographic Change
It is seemingly common knowledge among New Yorkers that upstate suffers while downstate does well and that cities lose population. The reality facing cities in New York State is, however, more complicated. Although New York City’s 2010 population of 8,175,133 was the highest ever recorded—and more recent estimates show continued growth—a number of upstate cities also grew during the first decade of the new millennium. This report examines recent population trends in upstate New York’s 17 metropolitan centers. For further discussion of recent population trends affecting upstate cities and metropolitan areas, consult Thomas & Smith (2009, 2011).
Definitions: Ethnicity and Race
The 2010 U.S. Census describes identifying characteristics of the population using several terms that need to be clarified, such as race and ethnic identity. The recent decennial census provides a detailed breakdown of our racial identity. As each of these terms differ from one another it is important to discuss the varying definitions utilized by the Census Bureau.
An ethnic group refers to a culturally distinct population. Typically this means shared culture: language, traditions, beliefs, and territory. Examples are German, Puerto Rican, Japanese, Lebanese, and Oneida Indian. Many Americans relate to more than one Ethnic heritage. For instance, an individual may consider herself Italian, German, and Irish. The US Census invites people to identify the ethnic group with which they most strongly identify. More European Americans identify with German ethnicity (16 percent) than any other, although very few actually speak German or live in German communities.
Race is more difficult to define than ethnicity. For many years people believed that humans could be classified biologically as being so distinct that they shared a unique racial identity. It was thought that people living in isolation might conceivably evolve distinct characteristics. In the popular imagination, race is a biological fact whereby distinct populations share significant biological features. Americans have historically considered skin color to be the chief identifier of race. Such views have been challenged in recent decades, however, both in popular culture and in the scientific community. For example, skin color, a regional adaptation to sunlight, is difficult to use to identify racial distinctiveness: some people identified as “white” can have a wide range of skin coloration, from very light (such as Swedes) to very dark (such as Sicilians). Similarly, Asians include very light-skinned Afghanis to very dark-skinned Punjabis. Other characteristics traditionally understood as marking racial distinctiveness have similar difficulties: some Asians have “slanted” eyes (Han Chinese), and others do not (Sumatrans). Constant mobility and inter-breeding made human isolation very uncommon. Therefore, the scientific consensus is that race has no biological significance. The human species shares identical genetic capacities for intelligence, creativity, and character. Homo sapiens have been constantly on the move, continuously interbreeding and thus homogenizing their gene pool. The human genome shows
2 | P a g e
that so-called racial groups differ from one another only once in a thousand sub-units of the genome, too insignificant to describe an entire population as a racial group. Anthropology does not use race as a meaningful concept, and Biology similarly considers the concept of race as anatomically meaningless because we are a homogeneous species. Humans constitute essentially one race with many insignificant physical variations: “race is an idea, not a fact” (Painter 2010).
Legal definitions of race have often been hard to understand in practice. How were Jews to be classified? Mexicans? Turks? Greeks? Italians? All “became” white over time as their members came to be accepted by the larger population as “white.” Also, over hundreds of years of living together, white and black “blood” became thoroughly intermixed, a persistent legal problem in a society that perceived racial difference to be so important. How should the offspring of a white man and black woman be classified? This led to the “One Drop Rule:” anybody with any black lineage at all, even less than 1 percent, was legally black, no matter how white they looked (Omi and Winant 1994). Today virtually all race-specific laws have been eliminated, but historical policies based on race have resulted in racially-associated patterns such as wealth, income, education, occupation, incarceration, family structure, health, residential segregation, unemployment, and much more.
We now chose our own racial identities. At one time this was not the case. Well into the twentieth century, the door-to-door Census recorder determined a person’s race on the spot. Someone could be black one year and mulatto 20 years later. But now the U.S. Census asks us to select our racial group:
White Black or African American Native American or Alaskan Native Asian Hawaiian or Other Pacific Islander Two or More Races (new in 2000) Some Other Race (new in 2010)
Ethnic labels are sometimes confused with racial identity. For instance, there are about 50 million Hispanics, but there is no Hispanic or Latino Race. The terms Hispanic or Latino approximately refers to people from Central and South America who can be of any racial combination. In the 2010 census there was a special category for Hispanics to claim black or white racial identity. In addition, since 2000 the Census has also invited people to identify more than one race, a so-called mixed-race category. Many Americans today are more comfortable with mixed-race identities than with having to choose one over the other.
New York State has a much lower white population than the U.S. in general, and a larger percentage of blacks, Hispanics, and Asians than the American average. The long-term population trend seems to be a steady growth of black, Latino, and Asian people, and a corresponding decline in the proportion who are white. This trend is evident in New York State, where whites account for fewer than 60 percent of the population.
3 | P a g e
Method
This study examines patterns of population change and immigration in the 17 metropolitan centers north of New York City. (A metropolitan center is a central city in a metropolitan area). Although New York City accounts for almost half the state’s population, the remainder of the state—even when the New York suburbs are excluded—is nevertheless one of the most urbanized regions in the United States. Its cities are among the oldest in North America, particularly those in the eastern portion of the state, such as Albany, Kingston, and Poughkeepsie. The state metropolitan environment varies from east to west. Metropolitan centers in the eastern part of the state tend to have comparatively low populations but are quite numerous; in contrast, the western metropolitan areas of Buffalo, Rochester, and Syracuse are more centrally dominated by their central cities. In the last ten years, another difference between the eastern and western metropolitan areas has developed: every central city in the east gained population between 2000 and 2010. In contrast, of the western cities, only Ithaca gained population, although Binghamton lost only 4 people.
The study utilizes data collected by the U. S. Census Bureau. Total population and racial composition is derived from the 2000 and 2010 decennial censuses and is, to the best of our knowledge, accurate counts. The data for the foreign-born population in 2000 is based on “sample” data collected through the use of the long form of the decennial census and is similarly considered to be valid. The 2010 census did not, however, collect such information. As such, data for the foreign-born population in 2010 is more problematic because it is based on estimates from the American Community Survey and reflects five years’ worth of data collection. Nevertheless, we take the data to be a reasonably good indicator of the foreign-born population in 2010 but urge some caution in utilizing those numbers.
Additional caution is required when examining the data because of vagaries in how the data was collected. For example, data for both race and “Hispanic” origin were collected by asking respondents to self-identify, and this is problematic. Although race is a seemingly straightforward concept for many Americans, as a social construction it is not readily measurable. For example, in many southern states the law defined someone as “black” even if they appeared white but had a grandparent who was black. In more recent times, however, the American racial dichotomy of black/white has become more problematic, and this is noticeable in the data. For example, in 2010 nearly 19 percent of the residents of Newburgh did not identify themselves as a member of any race; in Middletown the figure was almost 23 percent! Both cities have high levels of immigration from Central America, particularly from Mexico, and social customs of defining race are more nuanced than the American norm; it is not surprising that cities with high Hispanic populations also have a higher percentage of residents who claim either no racial identification or a mixed racial identification. Indeed, mixed racial backgrounds are becoming increasingly common in the United States, and there are several New York cities where those claiming a mixed racial background exceed five percent of the population.

4 | P a g e
A similar caution is advisable in terms of how “Hispanic” is defined. The census bureau classifies someone as Hispanic if they claim a country of origin in which Spanish is spoken, although those from Brazil (where the dominant language is Portuguese) are also considered Hispanic, as well as those claiming Spanish (i.e., European) ancestry. Complicating the matter is the fact that many Hispanics are not, in fact, immigrants but formerly lived (or whose ancestors did) in American territories in which Spanish is the dominant language; this is the case for those from Puerto Rico. Similarly, a substantial population of ethnic Mexicans are considered Hispanic even though their ancestors came to be American citizens by virtue of the American conquest of the northern territories of Mexico we now call the American Southwest. And, as with race, the data are based on self-identification.
Nevertheless, the Census data remain the best source of information on population change in American communities. The reliability of the data is extremely high, so although it is quite possible that Binghamton did not lose 4 people but instead had the exact same population in 2010 than in did in 2000, we can be certain that the city did not gain or lose thousands, or even hundreds, of residents.
General Patterns
As noted previously, the general pattern across the 17 upstate New York metropolitan centers is that those in the east gained population while those in the west lost population. However, a closer look at the data, as shown in Table 1, indicates that the cities that gained the largest percentages are also those that are closest to the New York City CMSA. Middletown and Poughkeepsie were the biggest winners as each city grew by approximately 10 percent; both of Metro North commuter rail stations. When looking at strictly an increase in numbers, both Albany and Schenectady also experienced gains of more than 2,000 residents each. These too may not seem to be much of a surprise—Albany is the state’s capital and Schenectady is part of the same metropolitan area.
The cities that experienced the greatest percentage loss in the past decade are those in the most western part of the state: Buffalo and Niagara Falls. The losses experienced in these areas may at first glance seem to be the same as the gains made in Poughkeepsie and Middletown, around 10 percent each. Yet a closer look shows that the raw numbers are much higher: Buffalo lost more than 30,000 residents and Niagara Falls more than 5,000, whereas the gains in Middletown and Poughkeepsie were just over 2,500 each.
Other notable changes are an increase in Utica of just more than 1,500 (2.6 percent) which was answered by a similar loss in neighboring Rome (1,225) and nearby Syracuse (2,136). Rochester, like Buffalo and Niagara Falls, also experienced a large loss of more than 9,000 residents. Elmira too lost, but by less: 1,740 residents. The remaining metro centers experienced
5 | P a g e
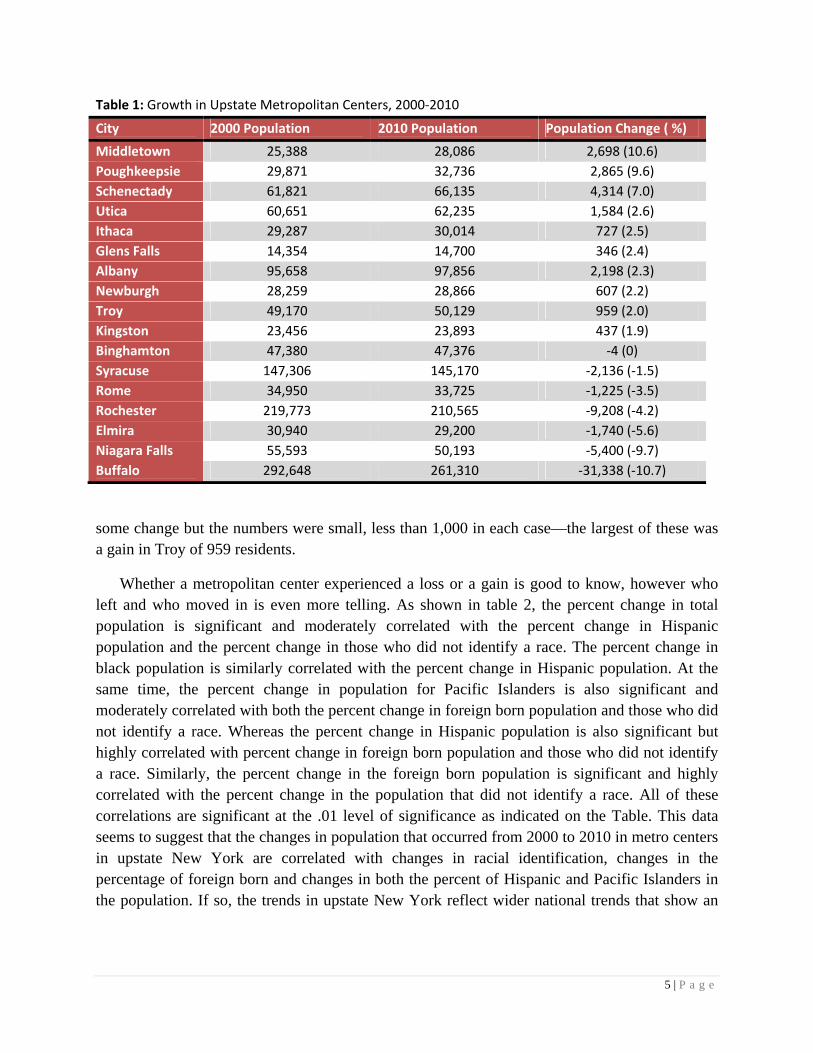
Table 1: Growth in Upstate Metropolitan Centers, 2000‐2010
City 2000 Population 2010 Population Population Change ( %)
Middletown 25,388 28,086 2,698 (10.6)
Poughkeepsie 29,871 32,736 2,865 (9.6)
Schenectady 61,821 66,135 4,314 (7.0)
Utica 60,651 62,235 1,584 (2.6)
Ithaca 29,287 30,014 727 (2.5)
Glens Falls 14,354 14,700 346 (2.4)
Albany 95,658 97,856 2,198 (2.3)
Newburgh 28,259 28,866 607 (2.2)
Troy 49,170 50,129 959 (2.0)
Kingston 23,456 23,893 437 (1.9)
Binghamton 47,380 47,376 ‐4 (0)
Syracuse 147,306 145,170 ‐2,136 (‐1.5)
Rome 34,950 33,725 ‐1,225 (‐3.5)
Rochester 219,773 210,565 ‐9,208 (‐4.2)
Elmira 30,940 29,200 ‐1,740 (‐5.6)
Niagara Falls 55,593 50,193 ‐5,400 (‐9.7)
Buffalo 292,648 261,310 ‐31,338 (‐10.7)
some change but the numbers were small, less than 1,000 in each case—the largest of these was a gain in Troy of 959 residents.
Whether a metropolitan center experienced a loss or a gain is good to know, however who left and who moved in is even more telling. As shown in table 2, the percent change in total population is significant and moderately correlated with the percent change in Hispanic population and the percent change in those who did not identify a race. The percent change in black population is similarly correlated with the percent change in Hispanic population. At the same time, the percent change in population for Pacific Islanders is also significant and moderately correlated with both the percent change in foreign born population and those who did not identify a race. Whereas the percent change in Hispanic population is also significant but highly correlated with percent change in foreign born population and those who did not identify a race. Similarly, the percent change in the foreign born population is significant and highly correlated with the percent change in the population that did not identify a race. All of these correlations are significant at the .01 level of significance as indicated on the Table. This data seems to suggest that the changes in population that occurred from 2000 to 2010 in metro centers in upstate New York are correlated with changes in racial identification, changes in the percentage of foreign born and changes in both the percent of Hispanic and Pacific Islanders in the population. If so, the trends in upstate New York reflect wider national trends that show an
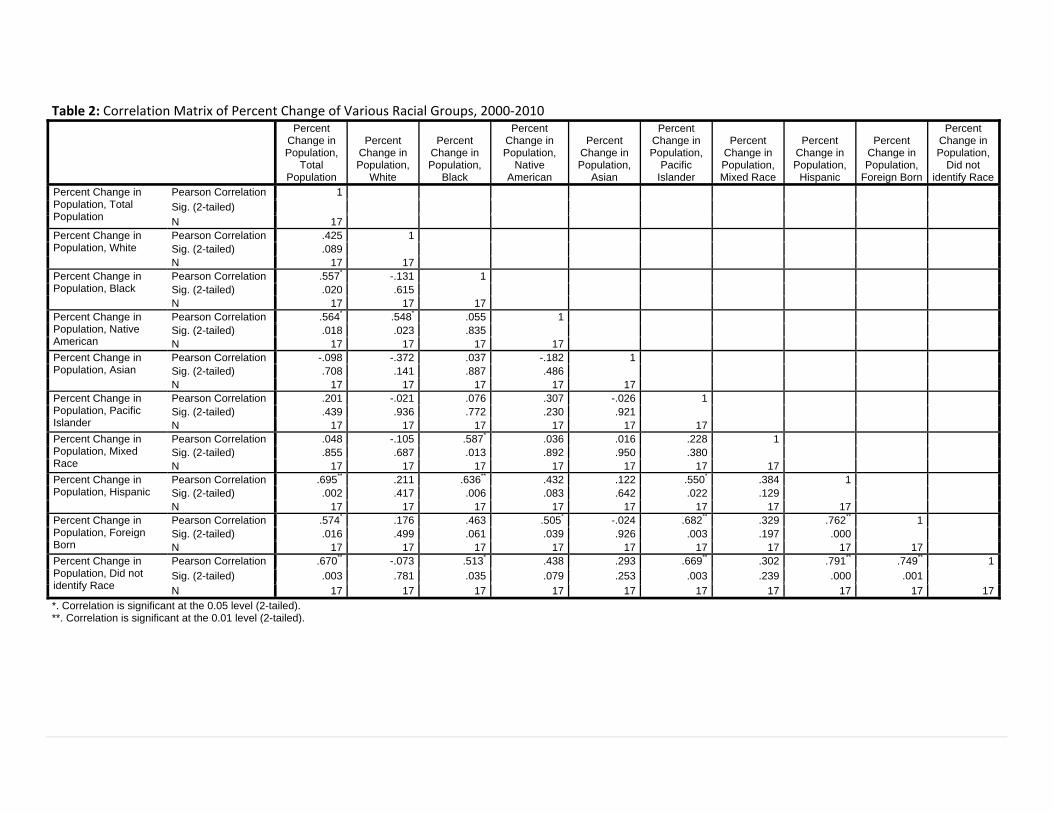
Table 2: Correlation Matrix of Percent Change of Various Racial Groups, 2000‐2010
Percent Change in Population,
Total Population
Percent Change in Population,
White
Percent Change in Population,
Black
Percent Change in Population,
Native American
Percent Change in Population,
Asian
Percent Change in Population,
Pacific Islander
Percent Change in Population, Mixed Race
Percent Change in Population,
Hispanic
Percent Change in Population,
Foreign Born
Percent Change in Population,
Did not identify Race
Percent Change in Population, Total Population
Pearson Correlation 1 Sig. (2-tailed) N 17
Percent Change in Population, White
Pearson Correlation .425 1 Sig. (2-tailed) .089 N 17 17
Percent Change in Population, Black
Pearson Correlation .557* -.131 1 Sig. (2-tailed) .020 .615 N 17 17 17
Percent Change in Population, Native American
Pearson Correlation .564* .548* .055 1 Sig. (2-tailed) .018 .023 .835 N 17 17 17 17
Percent Change in Population, Asian
Pearson Correlation -.098 -.372 .037 -.182 1 Sig. (2-tailed) .708 .141 .887 .486 N 17 17 17 17 17
Percent Change in Population, Pacific Islander
Pearson Correlation .201 -.021 .076 .307 -.026 1 Sig. (2-tailed) .439 .936 .772 .230 .921 N 17 17 17 17 17 17
Percent Change in Population, Mixed Race
Pearson Correlation .048 -.105 .587* .036 .016 .228 1 Sig. (2-tailed) .855 .687 .013 .892 .950 .380 N 17 17 17 17 17 17 17
Percent Change in Population, Hispanic
Pearson Correlation .695** .211 .636** .432 .122 .550* .384 1 Sig. (2-tailed) .002 .417 .006 .083 .642 .022 .129 N 17 17 17 17 17 17 17 17
Percent Change in Population, Foreign Born
Pearson Correlation .574* .176 .463 .505* -.024 .682** .329 .762** 1 Sig. (2-tailed) .016 .499 .061 .039 .926 .003 .197 .000 N 17 17 17 17 17 17 17 17 17
Percent Change in Population, Did not identify Race
Pearson Correlation .670** -.073 .513* .438 .293 .669** .302 .791** .749** 1 Sig. (2-tailed) .003 .781 .035 .079 .253 .003 .239 .000 .001
N 17 17 17 17 17 17 17 17 17 17 *. Correlation is significant at the 0.05 level (2-tailed). **. Correlation is significant at the 0.01 level (2-tailed).
7 | P a g e
increase in the number of immigrants from Latin American and Asia. However, in the past these groups were more likely to locate in larger urban centers with more significant immigrant/refugee populations.
Analysis of Individual Cities
The general pattern of growth—even anemic growth—in eastern New York and stagnation or population decline in western cities is tempered when we examine individual cities. Some western cities fared better than others during the first decade of the new millennium, whereas some eastern New York cities have experienced more growth than others.
Albany
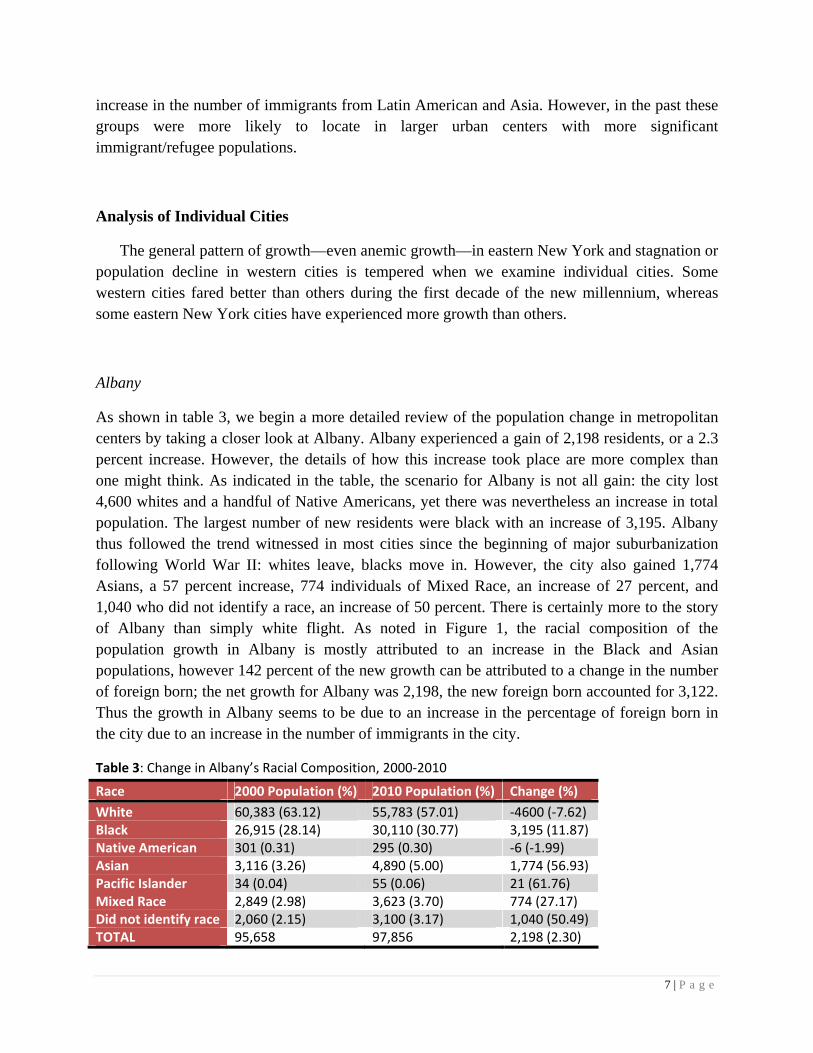
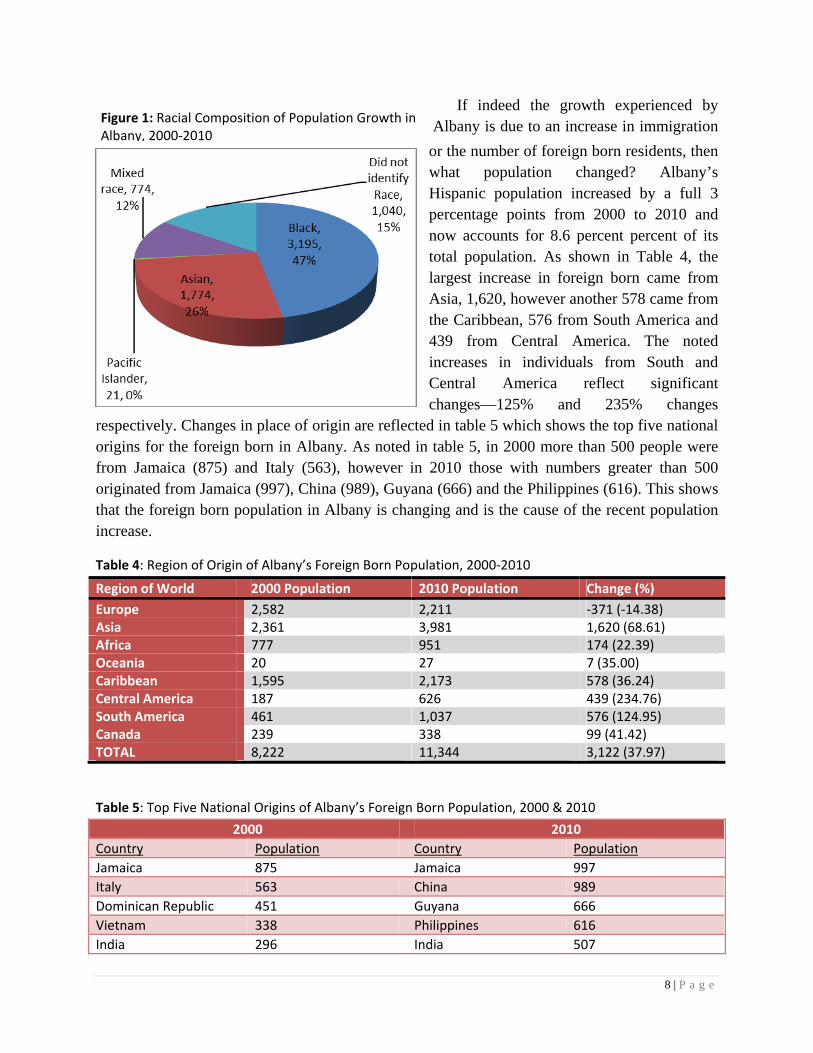
As shown in table 3, we begin a more detailed review of the population change in metropolitan centers by taking a closer look at Albany. Albany experienced a gain of 2,198 residents, or a 2.3 percent increase. However, the details of how this increase took place are more complex than one might think. As indicated in the table, the scenario for Albany is not all gain: the city lost 4,600 whites and a handful of Native Americans, yet there was nevertheless an increase in total population. The largest number of new residents were black with an increase of 3,195. Albany thus followed the trend witnessed in most cities since the beginning of major suburbanization following World War II: whites leave, blacks move in. However, the city also gained 1,774 Asians, a 57 percent increase, 774 individuals of Mixed Race, an increase of 27 percent, and 1,040 who did not identify a race, an increase of 50 percent. There is certainly more to the story of Albany than simply white flight. As noted in Figure 1, the racial composition of the population growth in Albany is mostly attributed to an increase in the Black and Asian populations, however 142 percent of the new growth can be attributed to a change in the number of foreign born; the net growth for Albany was 2,198, the new foreign born accounted for 3,122. Thus the growth in Albany seems to be due to an increase in the percentage of foreign born in the city due to an increase in the number of immigrants in the city.
Table 3: Change in Albany’s Racial Composition, 2000‐2010
Race 2000 Population (%) 2010 Population (%) Change (%)
White 60,383 (63.12) 55,783 (57.01) ‐4600 (‐7.62) Black 26,915 (28.14) 30,110 (30.77) 3,195 (11.87) Native American 301 (0.31) 295 (0.30) ‐6 (‐1.99) Asian 3,116 (3.26) 4,890 (5.00) 1,774 (56.93) Pacific Islander 34 (0.04) 55 (0.06) 21 (61.76) Mixed Race 2,849 (2.98) 3,623 (3.70) 774 (27.17) Did not identify race 2,060 (2.15) 3,100 (3.17) 1,040 (50.49) TOTAL 95,658 97,856 2,198 (2.30)
8 | P a g e
If indeed the growth experienced by Albany is due to an increase in immigration
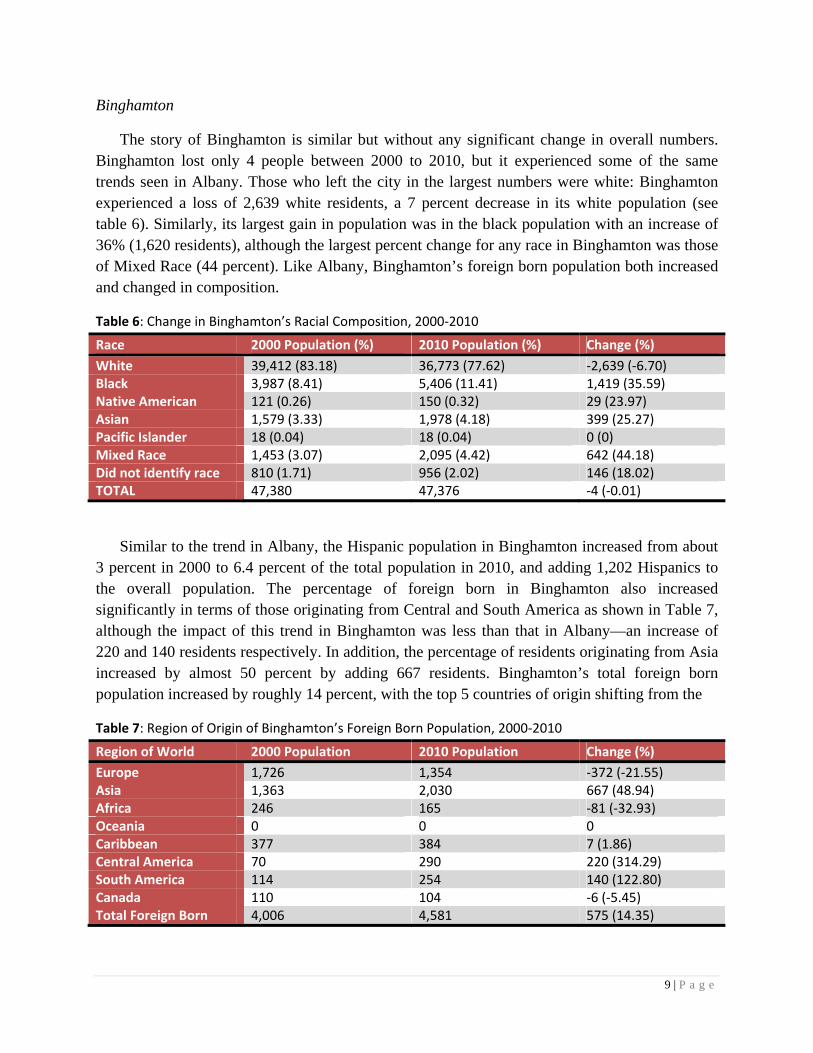
or the number of foreign born residents, then what population changed? Albany’s Hispanic population increased by a full 3 percentage points from 2000 to 2010 and now accounts for 8.6 percent percent of its total population. As shown in Table 4, the largest increase in foreign born came from Asia, 1,620, however another 578 came from the Caribbean, 576 from South America and 439 from Central America. The noted increases in individuals from South and Central America reflect significant changes—125% and 235% changes
respectively. Changes in place of origin are reflected in table 5 which shows the top five national origins for the foreign born in Albany. As noted in table 5, in 2000 more than 500 people were from Jamaica (875) and Italy (563), however in 2010 those with numbers greater than 500 originated from Jamaica (997), China (989), Guyana (666) and the Philippines (616). This shows that the foreign born population in Albany is changing and is the cause of the recent population increase.
Table 4: Region of Origin of Albany’s Foreign Born Population, 2000‐2010
Region of World 2000 Population 2010 Population Change (%)
Europe 2,582 2,211 ‐371 (‐14.38) Asia 2,361 3,981 1,620 (68.61) Africa 777 951 174 (22.39) Oceania 20 27 7 (35.00) Caribbean 1,595 2,173 578 (36.24) Central America 187 626 439 (234.76) South America 461 1,037 576 (124.95) Canada 239 338 99 (41.42) TOTAL 8,222 11,344 3,122 (37.97)
Table 5: Top Five National Origins of Albany’s Foreign Born Population, 2000 & 2010 2000 2010
Country Population Country Population
Jamaica 875 Jamaica 997
Italy 563 China 989
Dominican Republic 451 Guyana 666
Vietnam 338 Philippines 616
India 296 India 507
Figure 1: Racial Composition of Population Growth in Albany, 2000‐2010
9 | P a g e
Binghamton
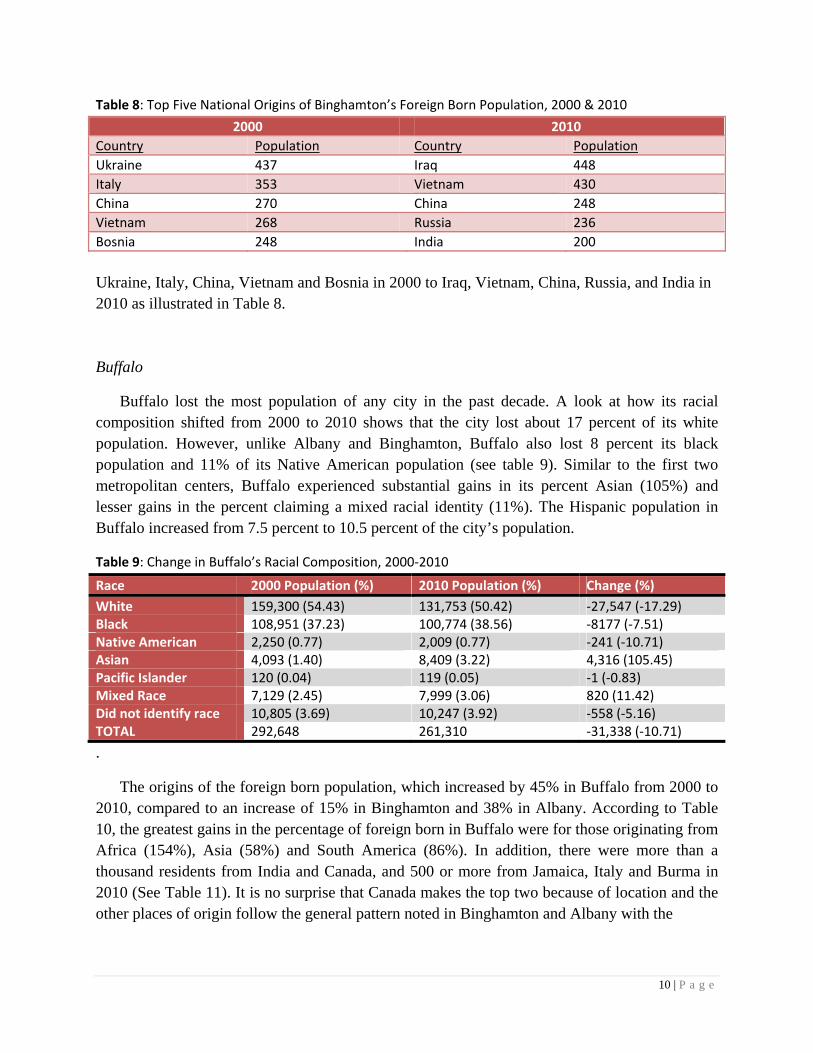
The story of Binghamton is similar but without any significant change in overall numbers. Binghamton lost only 4 people between 2000 to 2010, but it experienced some of the same trends seen in Albany. Those who left the city in the largest numbers were white: Binghamton experienced a loss of 2,639 white residents, a 7 percent decrease in its white population (see table 6). Similarly, its largest gain in population was in the black population with an increase of 36% (1,620 residents), although the largest percent change for any race in Binghamton was those of Mixed Race (44 percent). Like Albany, Binghamton’s foreign born population both increased and changed in composition.
Table 6: Change in Binghamton’s Racial Composition, 2000‐2010
Race 2000 Population (%) 2010 Population (%) Change (%)
White 39,412 (83.18) 36,773 (77.62) ‐2,639 (‐6.70) Black 3,987 (8.41) 5,406 (11.41) 1,419 (35.59) Native American 121 (0.26) 150 (0.32) 29 (23.97) Asian 1,579 (3.33) 1,978 (4.18) 399 (25.27) Pacific Islander 18 (0.04) 18 (0.04) 0 (0) Mixed Race 1,453 (3.07) 2,095 (4.42) 642 (44.18) Did not identify race 810 (1.71) 956 (2.02) 146 (18.02) TOTAL 47,380 47,376 ‐4 (‐0.01)
Similar to the trend in Albany, the Hispanic population in Binghamton increased from about 3 percent in 2000 to 6.4 percent of the total population in 2010, and adding 1,202 Hispanics to the overall population. The percentage of foreign born in Binghamton also increased significantly in terms of those originating from Central and South America as shown in Table 7, although the impact of this trend in Binghamton was less than that in Albany—an increase of 220 and 140 residents respectively. In addition, the percentage of residents originating from Asia increased by almost 50 percent by adding 667 residents. Binghamton’s total foreign born population increased by roughly 14 percent, with the top 5 countries of origin shifting from the
Table 7: Region of Origin of Binghamton’s Foreign Born Population, 2000‐2010
Region of World 2000 Population 2010 Population Change (%)
Europe 1,726 1,354 ‐372 (‐21.55) Asia 1,363 2,030 667 (48.94) Africa 246 165 ‐81 (‐32.93) Oceania 0 0 0 Caribbean 377 384 7 (1.86) Central America 70 290 220 (314.29) South America 114 254 140 (122.80) Canada 110 104 ‐6 (‐5.45) Total Foreign Born 4,006 4,581 575 (14.35)
10 | P a g e
Table 8: Top Five National Origins of Binghamton’s Foreign Born Population, 2000 & 2010
2000 2010
Country Population Country Population
Ukraine 437 Iraq 448
Italy 353 Vietnam 430
China 270 China 248
Vietnam 268 Russia 236
Bosnia 248 India 200
Ukraine, Italy, China, Vietnam and Bosnia in 2000 to Iraq, Vietnam, China, Russia, and India in 2010 as illustrated in Table 8. Buffalo
Buffalo lost the most population of any city in the past decade. A look at how its racial composition shifted from 2000 to 2010 shows that the city lost about 17 percent of its white population. However, unlike Albany and Binghamton, Buffalo also lost 8 percent its black population and 11% of its Native American population (see table 9). Similar to the first two metropolitan centers, Buffalo experienced substantial gains in its percent Asian (105%) and lesser gains in the percent claiming a mixed racial identity (11%). The Hispanic population in Buffalo increased from 7.5 percent to 10.5 percent of the city’s population.
Table 9: Change in Buffalo’s Racial Composition, 2000‐2010
Race 2000 Population (%) 2010 Population (%) Change (%)
White 159,300 (54.43) 131,753 (50.42) ‐27,547 (‐17.29) Black 108,951 (37.23) 100,774 (38.56) ‐8177 (‐7.51) Native American 2,250 (0.77) 2,009 (0.77) ‐241 (‐10.71) Asian 4,093 (1.40) 8,409 (3.22) 4,316 (105.45) Pacific Islander 120 (0.04) 119 (0.05) ‐1 (‐0.83) Mixed Race 7,129 (2.45) 7,999 (3.06) 820 (11.42) Did not identify race 10,805 (3.69) 10,247 (3.92) ‐558 (‐5.16) TOTAL 292,648 261,310 ‐31,338 (‐10.71)
.
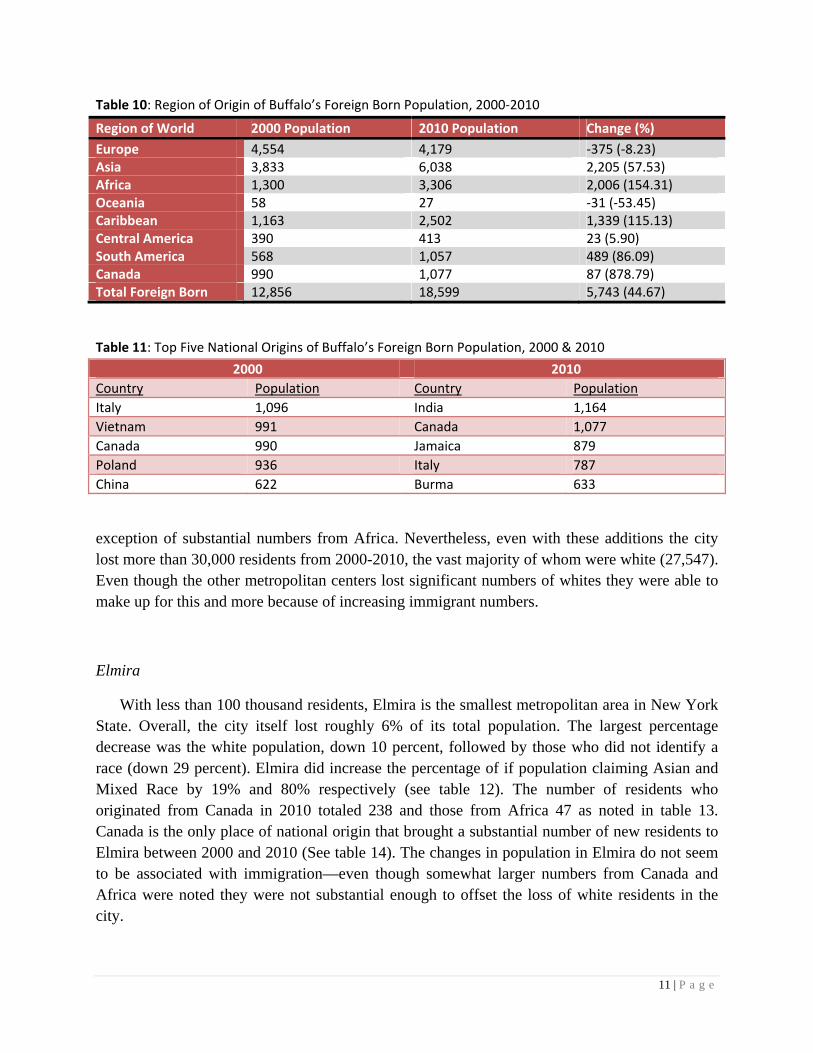
The origins of the foreign born population, which increased by 45% in Buffalo from 2000 to 2010, compared to an increase of 15% in Binghamton and 38% in Albany. According to Table 10, the greatest gains in the percentage of foreign born in Buffalo were for those originating from Africa (154%), Asia (58%) and South America (86%). In addition, there were more than a thousand residents from India and Canada, and 500 or more from Jamaica, Italy and Burma in 2010 (See Table 11). It is no surprise that Canada makes the top two because of location and the other places of origin follow the general pattern noted in Binghamton and Albany with the
11 | P a g e
Table 10: Region of Origin of Buffalo’s Foreign Born Population, 2000‐2010
Region of World 2000 Population 2010 Population Change (%)
Europe 4,554 4,179 ‐375 (‐8.23) Asia 3,833 6,038 2,205 (57.53) Africa 1,300 3,306 2,006 (154.31) Oceania 58 27 ‐31 (‐53.45) Caribbean 1,163 2,502 1,339 (115.13) Central America 390 413 23 (5.90) South America 568 1,057 489 (86.09) Canada 990 1,077 87 (878.79) Total Foreign Born 12,856 18,599 5,743 (44.67)
Table 11: Top Five National Origins of Buffalo’s Foreign Born Population, 2000 & 2010
2000 2010
Country Population Country Population
Italy 1,096 India 1,164
Vietnam 991 Canada 1,077
Canada 990 Jamaica 879
Poland 936 Italy 787
China 622 Burma 633
exception of substantial numbers from Africa. Nevertheless, even with these additions the city lost more than 30,000 residents from 2000-2010, the vast majority of whom were white (27,547). Even though the other metropolitan centers lost significant numbers of whites they were able to make up for this and more because of increasing immigrant numbers.
Elmira
With less than 100 thousand residents, Elmira is the smallest metropolitan area in New York State. Overall, the city itself lost roughly 6% of its total population. The largest percentage decrease was the white population, down 10 percent, followed by those who did not identify a race (down 29 percent). Elmira did increase the percentage of if population claiming Asian and Mixed Race by 19% and 80% respectively (see table 12). The number of residents who originated from Canada in 2010 totaled 238 and those from Africa 47 as noted in table 13. Canada is the only place of national origin that brought a substantial number of new residents to Elmira between 2000 and 2010 (See table 14). The changes in population in Elmira do not seem to be associated with immigration—even though somewhat larger numbers from Canada and Africa were noted they were not substantial enough to offset the loss of white residents in the city.

12 | P a g e
Table 12: Change in Elmira’s Racial Composition, 2000‐2010
Race 2000 Population (%) 2010 Population (%) Change (%)
White 25,379 (82.03) 22,850 (78.25) ‐2,529 (‐9.96) Black 4,039 (13.05) 4,268 (14.62) 229 (5.67) Native American 120 (0.39) 121 (0.41) 1 (0.83) Asian 151 (0.49) 179 (0.61) 28 (18.54) Pacific Islander 9 (0.03) 11 (0.04) 2 (22.22) Mixed Race 817 (2.64) 1,469 (5.03) 652 (79.80) Did not identify race 425 (1.37) 302 (1.03) ‐123 (‐28.94) TOTAL 30,940 29,200 ‐1,740 (‐5.62)
Table 13: Region of Origin of Elmira’s Foreign Born Population, 2000‐2010
Region of World 2000 Population 2010 Population Change (%)
Europe 249 158 ‐91 (‐36.55) Asia 195 202 7 (3.59) Africa 7 47 40 (571.43) Oceania 0 7 7 (700.0) Caribbean 120 129 9 (7.5) Central America 21 18 ‐3 (‐14.29) South America 35 41 6 (17.14) Canada 44 238 194 (440.91) Total Foreign Born 671 840 169 (25.19)
Table 14: Top Five National Origins of Elmira’s Foreign Born Population, 2000 & 2010
2000 2010
Country Population Country Population
Italy 80 Canada 238
Canada 44 Philippines 51
Germany 38 Bahamas 36
Philippines 33 Korea 36
Laos 32 Italy 30
Glens Falls
Shifting back to the eastern portion of the state we see a pattern similar to that experienced in Albany in Glens Falls: 50 percent of the population increase is due to an increase in the foreign born population. Beyond this, Glens Falls is the first metropolitan center discussed that has not experienced a loss in its percentage White. This is likely due to its increasingly suburban character—the result of being contiguously urbanized with the Capital District immediately to its

13 | P a g e
Table 15: Change in Glens Falls’ Racial Composition, 2000‐2010
Race 2000 Population (%) 2010 Population (%) Change (%)
White 13,857 (96.54) 13,916 (94.67) 59 (0.43) Black 186 (1.30) 260 (1.77) 74 (39.78) Native American 22 (0.15) 38 (0.26) 16 (72.73) Asian 61 (0.42) 95 (0.65) 34 (55.74) Pacific Islander 2 (0.01) 0 (0) ‐2 (‐100.00) Mixed Race 178 (1.24) 331 (2.25) 153 (85.96) Did not identify race 48 (0.33) 60 (0.41) 12 (25) TOTAL 14,354 14,700 346 (2.41)
south. The largest percent increases in the city were due to a 40 percent increase in the black and 86 percent increase in the mixed-race populations (table 15). In contrast to what has been noted in previous cities, although the Hispanic percentage did increase it increased by less than a percentage point rather than the approximate doubling witnessed in many other upstate cities. Indeed, the total number of foreign born in Glens Falls, as noted in table 16, is a mere 413 residents in 2010, representing an increase of 71 percent since 2000 and again accounting for 50 percent of the city’s growth from 2000 to 2010. More than half (210) of these are from Europe, with another 58 from Canada and 53 from Asia. The top national origin for the foreign born in Glens Falls in both 2000 and 2010 was Canada (see table 17).
Table 16: Region of Origin of Glens Falls’ Foreign Born Population, 2000‐2010
Region of World 2000 Population 2010 Population Change (%)
Europe 75 210 135 (180.00) Asia 74 53 ‐21 (‐28.38) Africa 0 0 0 Oceania 0 9 9 (900.0) Caribbean 0 10 10 (1000.0) Central America 29 34 5 (17.24) South America 8 39 31 (387.50) Canada 55 58 3 (5.45) Total Foreign Born 241 413 172 (71.37)
Figure 2: Racial Composition of Population Growth
In Glens Falls, 2000‐2010

14 | P a g e
Table 17: Top Five National Origins of Glens Falls’ Foreign Born Population, 2000 & 2010
2000 2010
Country Population Country Population
Canada 55 Canada 58
Germany 22 Russia 31
Pakistan 20 Panama 30
Panama 17 Germany 29
Korea 14 Poland 28
Ithaca
Ithaca was the only city west of route 12 to gain population in the last census.
Table 18: Change in Ithaca’s Racial Composition, 2000‐2010
Race 2000 Population (%) 2010 Population (%) Change (%)
White 21,663 (73.97) 21,172 (70.54) ‐491 (‐2.27) Black 1,965 (6.71) 1,971 (6.57) 6 (0.31) Native American 114 (0.39) 115 (0.38) 1 (0.88) Asian 3,998 (13.65) 4,854 (16.17) 856 (21.41) Pacific Islander 16 (0.05) 11 (0.04) ‐5 (‐31.25) Mixed Race 985 (3.36) 1,297 (4.32) 312 (31.68) Did not identify race 546 (1.86) 594 (1.98) 48 (8.79) TOTAL 29,287 30,014 727 (2.48)
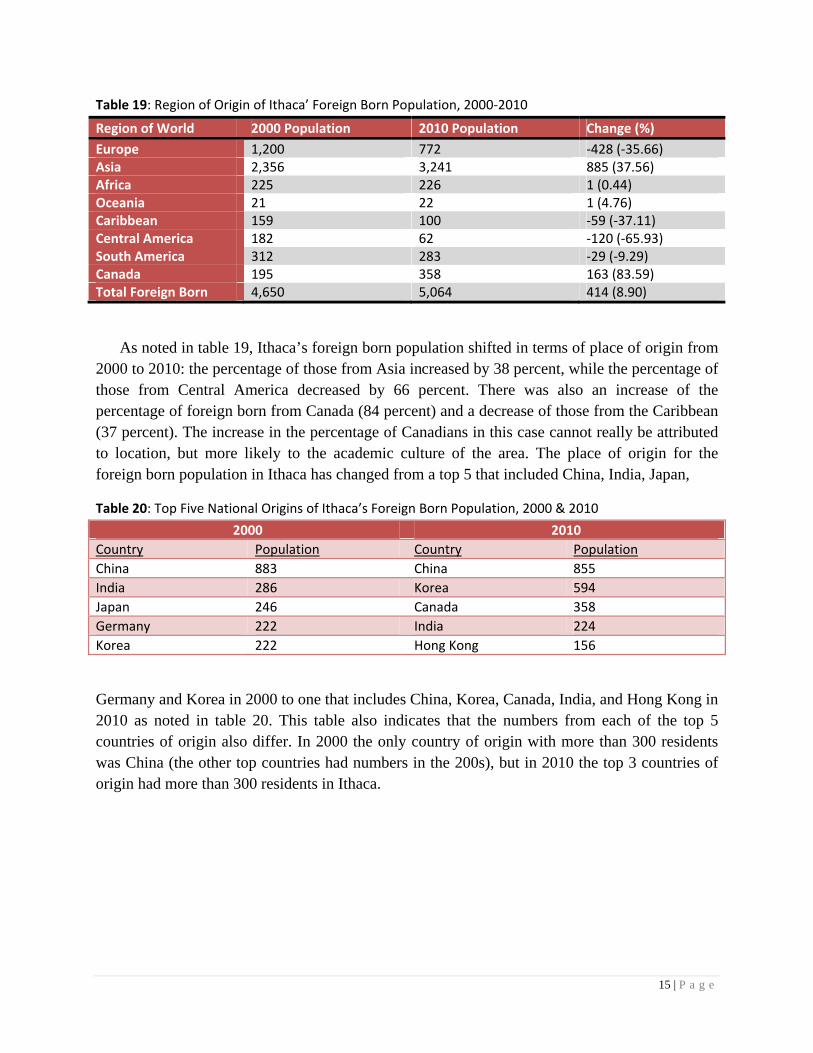
Although both Glens Falls and Ithaca experienced growth between 2000 and 2010, Ithaca did not experience a gain its white population. Indeed, the white population is the only one which witnessed a decline in Ithaca—491 residents, or 2 percent. Even with this loss, however, Ithaca experienced a net gain of 727 residents, 414 of whom were foreign born. Thus 57 percent of the growth in Ithaca can be attributed to an increase in its foreign born population. The newcomers were primarily Asian (an increase of 21 percent) and those of Mixed Race (an increase of 32 percent). As illustrated by figure 3, 70 percent of the growth in Ithaca can be attributed to an increase in the Asian population and another 30 percent to the increase of those of mixed race. Similar to Glens Falls, the Hispanic population in Ithaca experienced a slight increase.
Figure 3: Racial Composition of Population Growth
in Ithaca, 2000‐2010
15 | P a g e
Table 19: Region of Origin of Ithaca’ Foreign Born Population, 2000‐2010
Region of World 2000 Population 2010 Population Change (%)
Europe 1,200 772 ‐428 (‐35.66) Asia 2,356 3,241 885 (37.56) Africa 225 226 1 (0.44) Oceania 21 22 1 (4.76) Caribbean 159 100 ‐59 (‐37.11) Central America 182 62 ‐120 (‐65.93) South America 312 283 ‐29 (‐9.29) Canada 195 358 163 (83.59) Total Foreign Born 4,650 5,064 414 (8.90)
As noted in table 19, Ithaca’s foreign born population shifted in terms of place of origin from 2000 to 2010: the percentage of those from Asia increased by 38 percent, while the percentage of those from Central America decreased by 66 percent. There was also an increase of the percentage of foreign born from Canada (84 percent) and a decrease of those from the Caribbean (37 percent). The increase in the percentage of Canadians in this case cannot really be attributed to location, but more likely to the academic culture of the area. The place of origin for the foreign born population in Ithaca has changed from a top 5 that included China, India, Japan,
Table 20: Top Five National Origins of Ithaca’s Foreign Born Population, 2000 & 2010
2000 2010
Country Population Country Population
China 883 China 855
India 286 Korea 594
Japan 246 Canada 358
Germany 222 India 224
Korea 222 Hong Kong 156
Germany and Korea in 2000 to one that includes China, Korea, Canada, India, and Hong Kong in 2010 as noted in table 20. This table also indicates that the numbers from each of the top 5 countries of origin also differ. In 2000 the only country of origin with more than 300 residents was China (the other top countries had numbers in the 200s), but in 2010 the top 3 countries of origin had more than 300 residents in Ithaca.
16 | P a g e
Kingston
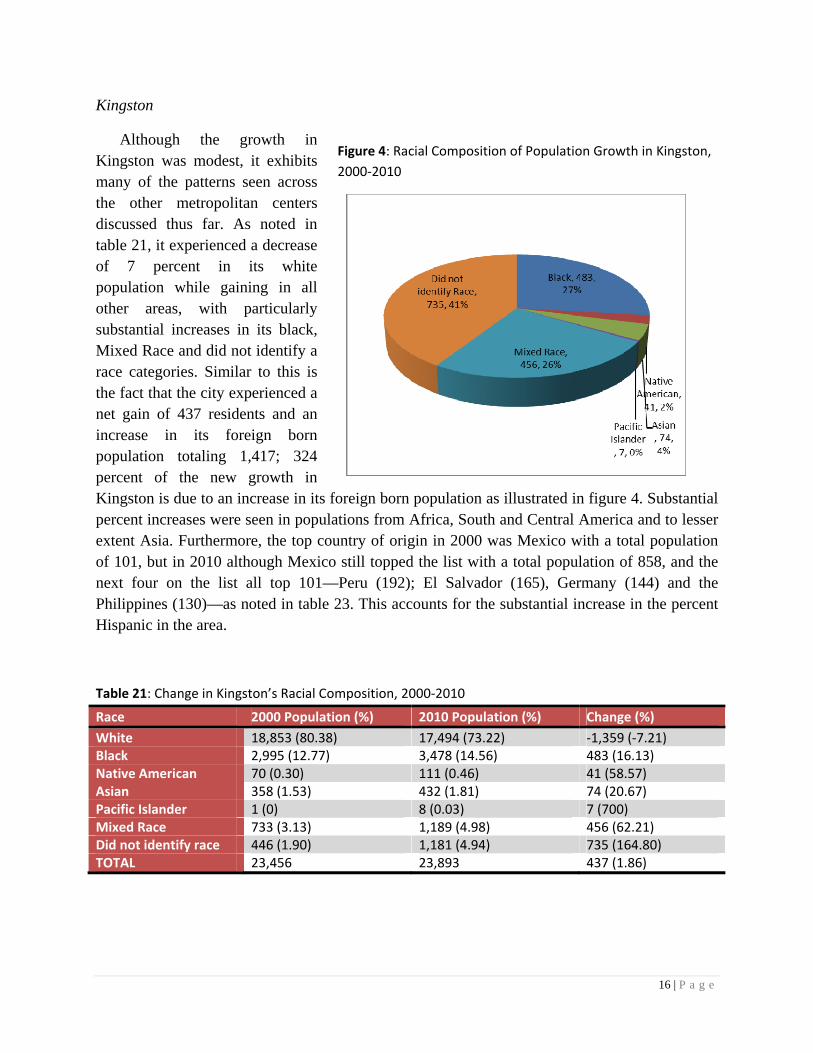
Although the growth in Kingston was modest, it exhibits many of the patterns seen across the other metropolitan centers discussed thus far. As noted in table 21, it experienced a decrease of 7 percent in its white population while gaining in all other areas, with particularly substantial increases in its black, Mixed Race and did not identify a race categories. Similar to this is the fact that the city experienced a net gain of 437 residents and an increase in its foreign born population totaling 1,417; 324 percent of the new growth in Kingston is due to an increase in its foreign born population as illustrated in figure 4. Substantial percent increases were seen in populations from Africa, South and Central America and to lesser extent Asia. Furthermore, the top country of origin in 2000 was Mexico with a total population of 101, but in 2010 although Mexico still topped the list with a total population of 858, and the next four on the list all top 101—Peru (192); El Salvador (165), Germany (144) and the Philippines (130)—as noted in table 23. This accounts for the substantial increase in the percent Hispanic in the area.
Table 21: Change in Kingston’s Racial Composition, 2000‐2010
Race 2000 Population (%) 2010 Population (%) Change (%)
White 18,853 (80.38) 17,494 (73.22) ‐1,359 (‐7.21) Black 2,995 (12.77) 3,478 (14.56) 483 (16.13) Native American 70 (0.30) 111 (0.46) 41 (58.57) Asian 358 (1.53) 432 (1.81) 74 (20.67) Pacific Islander 1 (0) 8 (0.03) 7 (700) Mixed Race 733 (3.13) 1,189 (4.98) 456 (62.21) Did not identify race 446 (1.90) 1,181 (4.94) 735 (164.80) TOTAL 23,456 23,893 437 (1.86)
Figure 4: Racial Composition of Population Growth in Kingston,
2000‐2010
17 | P a g e
Table 22: Region of Origin of Kingston’s Foreign Born Population, 2000‐2010
Region of World 2000 Population 2010 Population Change (%)
Europe 411 491 80 (19.46) Asia 265 383 118 (44.53) Africa 9 63 54 (600.0) Oceania 0 0 0 Caribbean 153 164 11 (7.19) Central America 258 1,073 815 (315.89) South America 73 437 364 (498.63) Canada 31 6 ‐25 (‐80.65) Total Foreign Born 1,200 2,617 1,417 (118.08)
Table 23: Top Five National Origins of Kingston’s Foreign Born Population, 2000 & 2010 2000 2010
Country Population Country Population
Mexico 101 Mexico 858
Germany 96 Peru 192
Honduras 79 El Salvador 165
El Salvador 78 Germany 144
Jamaica 72 Philippines 130
Middletown
Middletown experienced a 10 percent increase in its population from 2000 to 2010. Middletown is in the eastern portion of the state and within commuting distance to New York for
Table 24: Change in Middletown’s Racial Composition, 2000‐2010
Race 2000 Population (%) 2010 Population (%) Change (%)
White 17,437 (68.68) 14,710 (52.37) ‐2,727 (‐15.64) Black 3,840 (15.13) 5,902 (21.01) 2,062 (53.70) Native American 190 (0.75) 230 (0.82) 40 (21.05) Asian 429 (1.69) 524 (1.87) 95 (22.14) Pacific Islander 7 (0.03) 4 (0.01) ‐3 (.42.86) Mixed Race 1,116 (4.40) 1,484 (5.28) 368 (32.97) Did not identify race 2,369 (9.33) 5,232 (18.63) 2,863 (120.85) TOTAL 25,388 28,086 2,698 (10.63)
18 | P a g e
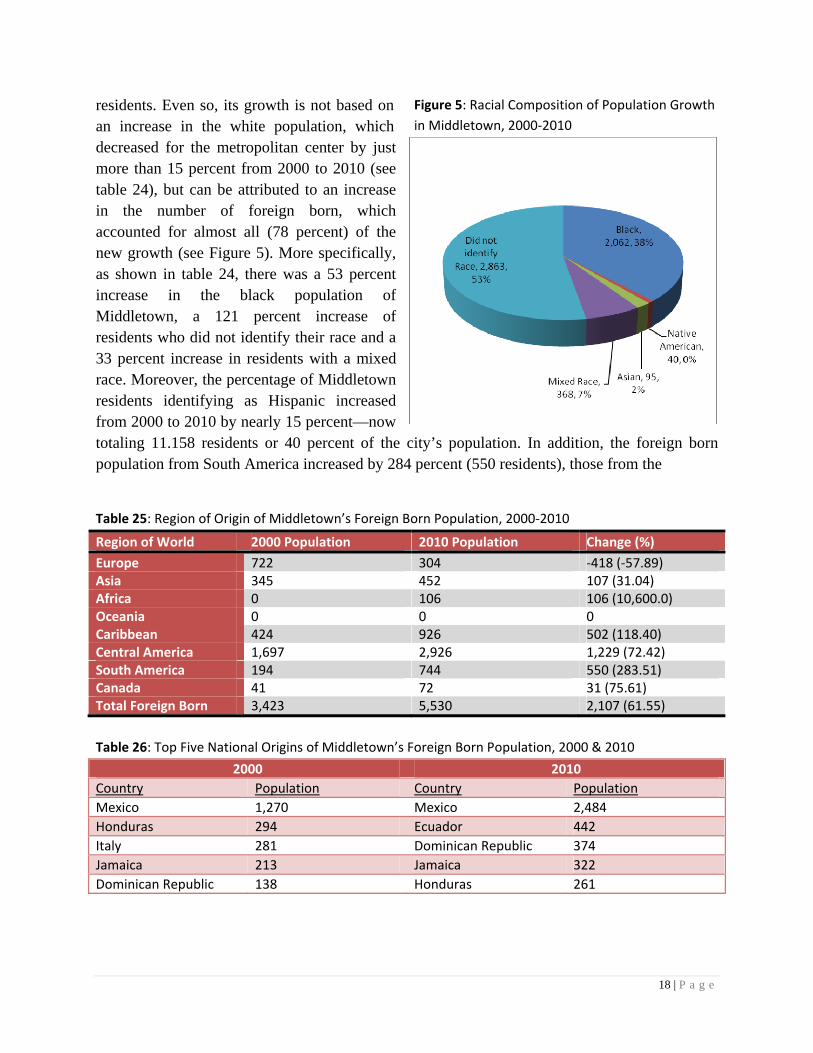
residents. Even so, its growth is not based on an increase in the white population, which decreased for the metropolitan center by just more than 15 percent from 2000 to 2010 (see table 24), but can be attributed to an increase in the number of foreign born, which accounted for almost all (78 percent) of the new growth (see Figure 5). More specifically, as shown in table 24, there was a 53 percent increase in the black population of Middletown, a 121 percent increase of residents who did not identify their race and a 33 percent increase in residents with a mixed race. Moreover, the percentage of Middletown residents identifying as Hispanic increased from 2000 to 2010 by nearly 15 percent—now totaling 11.158 residents or 40 percent of the city’s population. In addition, the foreign born population from South America increased by 284 percent (550 residents), those from the
Table 25: Region of Origin of Middletown’s Foreign Born Population, 2000‐2010
Region of World 2000 Population 2010 Population Change (%)
Europe 722 304 ‐418 (‐57.89) Asia 345 452 107 (31.04) Africa 0 106 106 (10,600.0) Oceania 0 0 0 Caribbean 424 926 502 (118.40) Central America 1,697 2,926 1,229 (72.42) South America 194 744 550 (283.51) Canada 41 72 31 (75.61) Total Foreign Born 3,423 5,530 2,107 (61.55)
Table 26: Top Five National Origins of Middletown’s Foreign Born Population, 2000 & 2010
2000 2010
Country Population Country Population
Mexico 1,270 Mexico 2,484
Honduras 294 Ecuador 442
Italy 281 Dominican Republic 374
Jamaica 213 Jamaica 322
Dominican Republic 138 Honduras 261
Figure 5: Racial Composition of Population Growth
in Middletown, 2000‐2010
19 | P a g e
Caribbean by 118 percent (502 residents), and those from Central America by 72 percent (1,229 residents). This occurs at the same time the number of foreign born from Europe decreased by 58 percent or 418 residents (see table 25). According to table 26, the largest numbers of foreign born living in Middletown in 2010 were from Mexico, Ecuador, the Dominican Republic, Jamaica and Honduras.
Newburgh
Like Middletown, Newburgh is an urban center in the northern reaches of the New York Combined Statistical Area (i.e., an outer suburb).
Table 27: Change in Newburgh’s Racial Composition, 2000‐2010
Race 2000 Population (%) 2010 Population (%) Change (%)
White 11,962 (42.33) 11,368 (39.38) ‐594 (‐4.97) Black 9,314 (32.96) 8,706 (30.16) ‐608 (‐6.53) Native American 201 (0.71) 478 (1.66) 277 (137.81) Asian 215 (0.76) 282 (0.98) 67 (31.16) Pacific Islander 16 (0.06) 30 (0.10) 14 (87.50) Mixed Race 1,432 (5.07) 1,492 (5.17) 60 (4.19) Did not identify race 5,069 (17.94) 6,510 (22.55) 1,441 (28.43) TOTAL 28,259 28,866 607 (2.15)
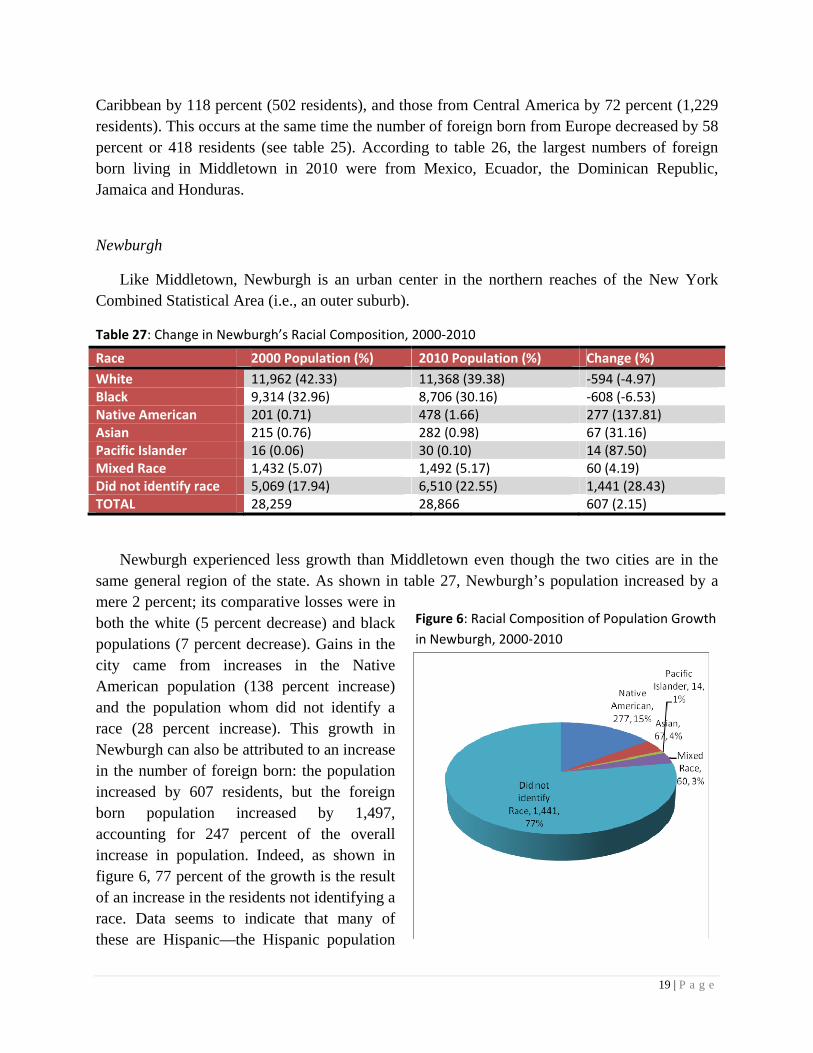
Newburgh experienced less growth than Middletown even though the two cities are in the same general region of the state. As shown in table 27, Newburgh’s population increased by a mere 2 percent; its comparative losses were in both the white (5 percent decrease) and black populations (7 percent decrease). Gains in the city came from increases in the Native American population (138 percent increase) and the population whom did not identify a race (28 percent increase). This growth in Newburgh can also be attributed to an increase in the number of foreign born: the population increased by 607 residents, but the foreign born population increased by 1,497, accounting for 247 percent of the overall increase in population. Indeed, as shown in figure 6, 77 percent of the growth is the result of an increase in the residents not identifying a race. Data seems to indicate that many of these are Hispanic—the Hispanic population
Figure 6: Racial Composition of Population Growth
in Newburgh, 2000‐2010
20 | P a g e
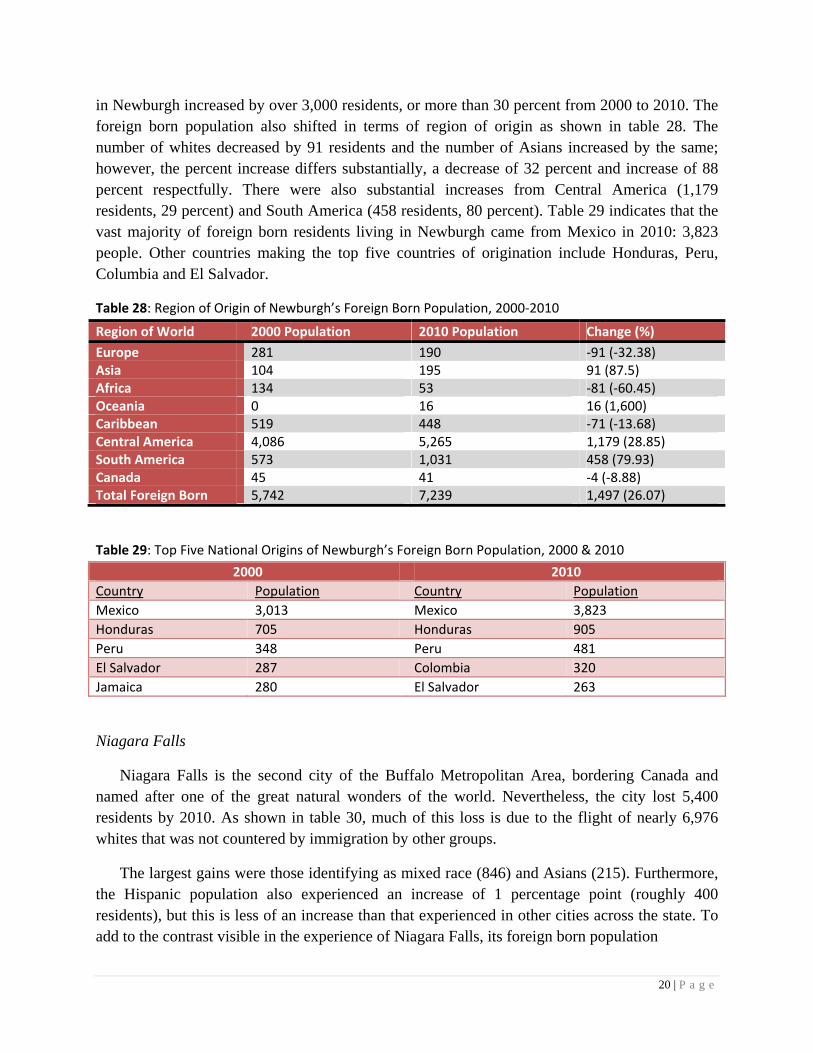
in Newburgh increased by over 3,000 residents, or more than 30 percent from 2000 to 2010. The foreign born population also shifted in terms of region of origin as shown in table 28. The number of whites decreased by 91 residents and the number of Asians increased by the same; however, the percent increase differs substantially, a decrease of 32 percent and increase of 88 percent respectfully. There were also substantial increases from Central America (1,179 residents, 29 percent) and South America (458 residents, 80 percent). Table 29 indicates that the vast majority of foreign born residents living in Newburgh came from Mexico in 2010: 3,823 people. Other countries making the top five countries of origination include Honduras, Peru, Columbia and El Salvador.
Table 28: Region of Origin of Newburgh’s Foreign Born Population, 2000‐2010
Region of World 2000 Population 2010 Population Change (%)
Europe 281 190 ‐91 (‐32.38) Asia 104 195 91 (87.5) Africa 134 53 ‐81 (‐60.45) Oceania 0 16 16 (1,600) Caribbean 519 448 ‐71 (‐13.68) Central America 4,086 5,265 1,179 (28.85) South America 573 1,031 458 (79.93) Canada 45 41 ‐4 (‐8.88) Total Foreign Born 5,742 7,239 1,497 (26.07)
Table 29: Top Five National Origins of Newburgh’s Foreign Born Population, 2000 & 2010
2000 2010
Country Population Country Population
Mexico 3,013 Mexico 3,823
Honduras 705 Honduras 905
Peru 348 Peru 481
El Salvador 287 Colombia 320
Jamaica 280 El Salvador 263
Niagara Falls
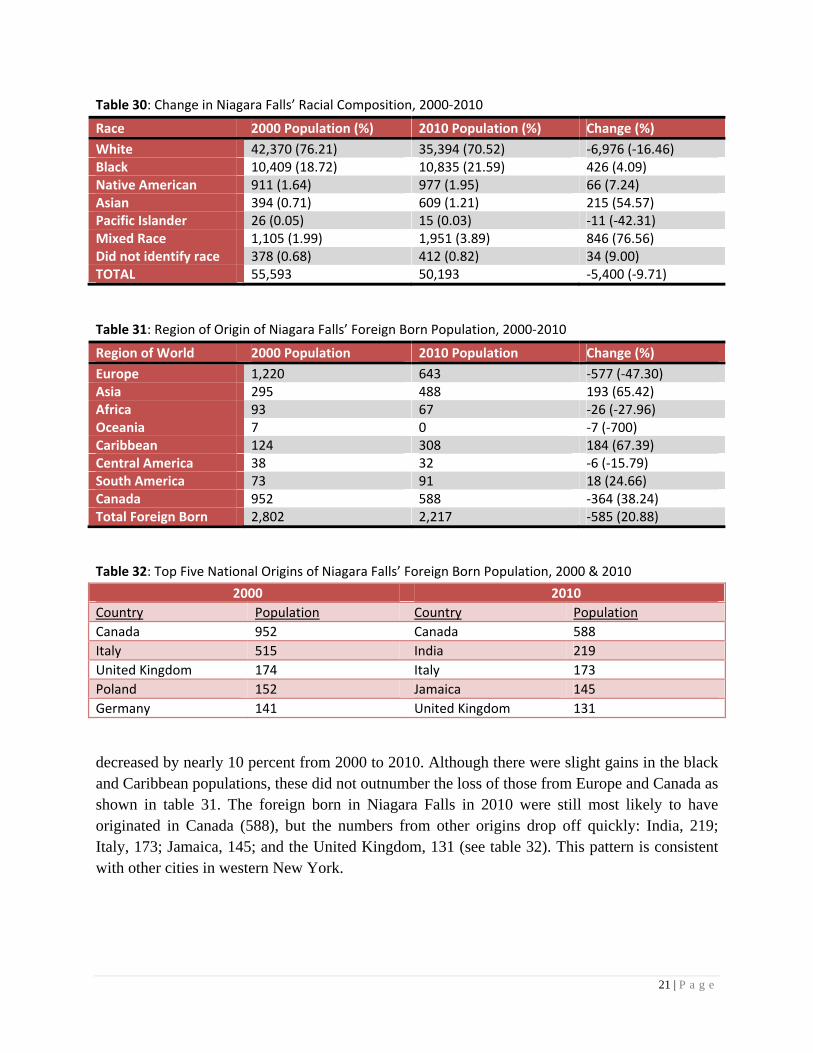
Niagara Falls is the second city of the Buffalo Metropolitan Area, bordering Canada and named after one of the great natural wonders of the world. Nevertheless, the city lost 5,400 residents by 2010. As shown in table 30, much of this loss is due to the flight of nearly 6,976 whites that was not countered by immigration by other groups.
The largest gains were those identifying as mixed race (846) and Asians (215). Furthermore, the Hispanic population also experienced an increase of 1 percentage point (roughly 400 residents), but this is less of an increase than that experienced in other cities across the state. To add to the contrast visible in the experience of Niagara Falls, its foreign born population
21 | P a g e
Table 30: Change in Niagara Falls’ Racial Composition, 2000‐2010
Race 2000 Population (%) 2010 Population (%) Change (%)
White 42,370 (76.21) 35,394 (70.52) ‐6,976 (‐16.46) Black 10,409 (18.72) 10,835 (21.59) 426 (4.09) Native American 911 (1.64) 977 (1.95) 66 (7.24) Asian 394 (0.71) 609 (1.21) 215 (54.57) Pacific Islander 26 (0.05) 15 (0.03) ‐11 (‐42.31) Mixed Race 1,105 (1.99) 1,951 (3.89) 846 (76.56) Did not identify race 378 (0.68) 412 (0.82) 34 (9.00) TOTAL 55,593 50,193 ‐5,400 (‐9.71)
Table 31: Region of Origin of Niagara Falls’ Foreign Born Population, 2000‐2010
Region of World 2000 Population 2010 Population Change (%)
Europe 1,220 643 ‐577 (‐47.30) Asia 295 488 193 (65.42) Africa 93 67 ‐26 (‐27.96) Oceania 7 0 ‐7 (‐700) Caribbean 124 308 184 (67.39) Central America 38 32 ‐6 (‐15.79) South America 73 91 18 (24.66) Canada 952 588 ‐364 (38.24) Total Foreign Born 2,802 2,217 ‐585 (20.88)
Table 32: Top Five National Origins of Niagara Falls’ Foreign Born Population, 2000 & 2010
2000 2010
Country Population Country Population
Canada 952 Canada 588
Italy 515 India 219
United Kingdom 174 Italy 173
Poland 152 Jamaica 145
Germany 141 United Kingdom 131
decreased by nearly 10 percent from 2000 to 2010. Although there were slight gains in the black and Caribbean populations, these did not outnumber the loss of those from Europe and Canada as shown in table 31. The foreign born in Niagara Falls in 2010 were still most likely to have originated in Canada (588), but the numbers from other origins drop off quickly: India, 219; Italy, 173; Jamaica, 145; and the United Kingdom, 131 (see table 32). This pattern is consistent with other cities in western New York.
22 | P a g e
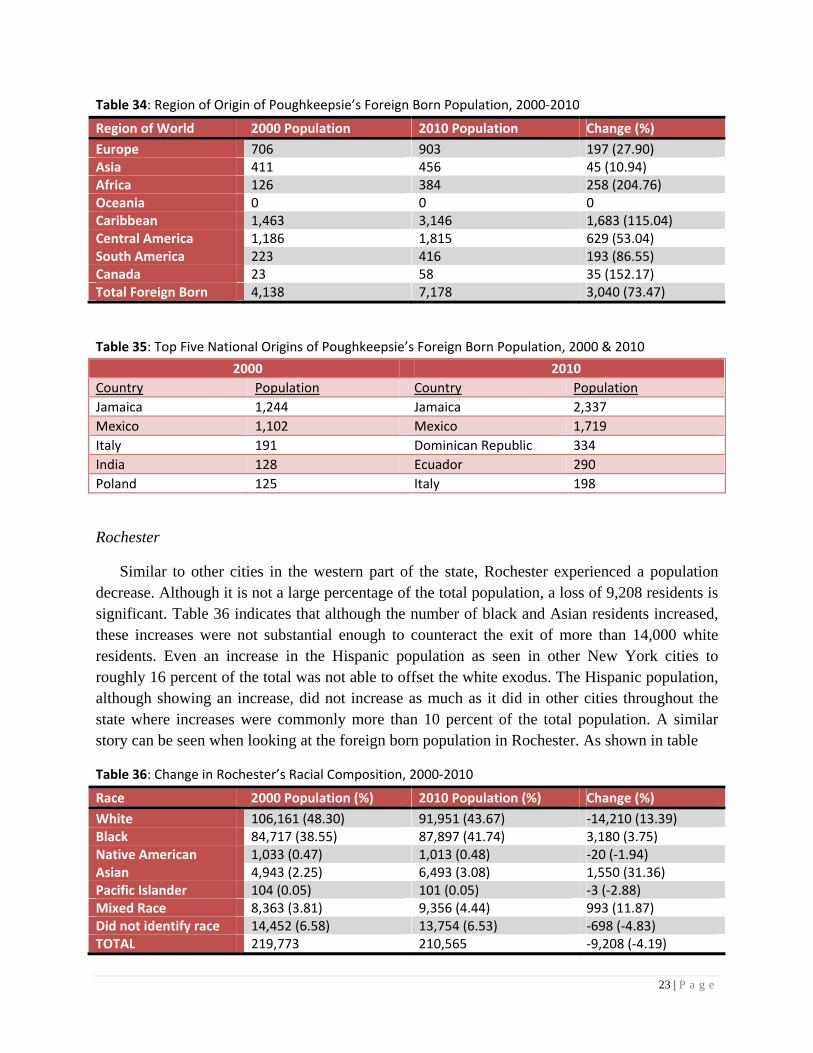
Poughkeepsie
Table 33: Change in Poughkeepsie’s Racial Composition, 2000‐2010
Race 2000 Population (%) 2010 Population (%) Change (%)
White 15,785 (52.84) 16,649 (50.86) 864 (5.47) Black 10,666 (35.71) 10,967 (33.50) 301 (2.82) Native American 117 (0.39) 299 (0.91) 182 (155.56) Asian 485 (1.62) 528 (1.61) 43 (8.87) Pacific Islander 14 (0.05) 20 (0.06) 6 (42.86) Mixed Race 1,225 (4.10) 1,475 (4.51) 250 (20.41) Did not identify race 1,579 (5.29) 2,798 (8.85) 1,319 (83.53) TOTAL 29,871 32,736 2,865 (9.59)
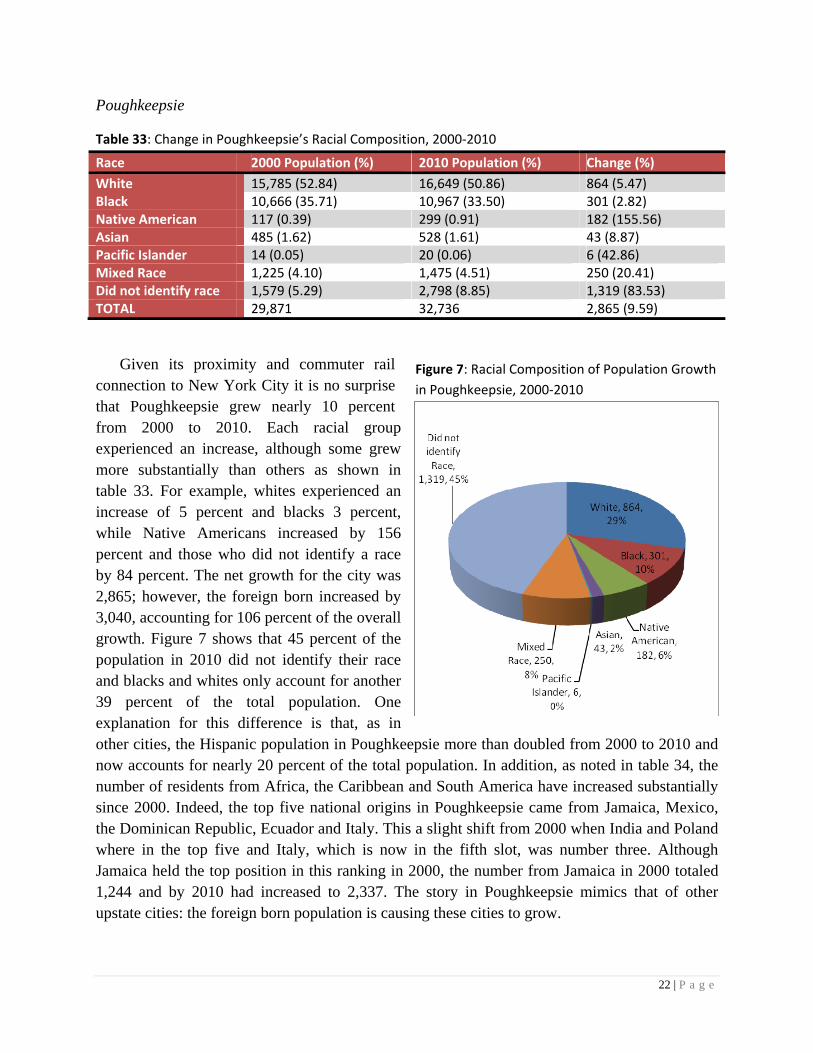
Given its proximity and commuter rail connection to New York City it is no surprise that Poughkeepsie grew nearly 10 percent from 2000 to 2010. Each racial group experienced an increase, although some grew more substantially than others as shown in table 33. For example, whites experienced an increase of 5 percent and blacks 3 percent, while Native Americans increased by 156 percent and those who did not identify a race by 84 percent. The net growth for the city was 2,865; however, the foreign born increased by 3,040, accounting for 106 percent of the overall growth. Figure 7 shows that 45 percent of the population in 2010 did not identify their race and blacks and whites only account for another 39 percent of the total population. One explanation for this difference is that, as in other cities, the Hispanic population in Poughkeepsie more than doubled from 2000 to 2010 and now accounts for nearly 20 percent of the total population. In addition, as noted in table 34, the number of residents from Africa, the Caribbean and South America have increased substantially since 2000. Indeed, the top five national origins in Poughkeepsie came from Jamaica, Mexico, the Dominican Republic, Ecuador and Italy. This a slight shift from 2000 when India and Poland where in the top five and Italy, which is now in the fifth slot, was number three. Although Jamaica held the top position in this ranking in 2000, the number from Jamaica in 2000 totaled 1,244 and by 2010 had increased to 2,337. The story in Poughkeepsie mimics that of other upstate cities: the foreign born population is causing these cities to grow.
Figure 7: Racial Composition of Population Growth
in Poughkeepsie, 2000‐2010
23 | P a g e
Table 34: Region of Origin of Poughkeepsie’s Foreign Born Population, 2000‐2010
Region of World 2000 Population 2010 Population Change (%)
Europe 706 903 197 (27.90) Asia 411 456 45 (10.94) Africa 126 384 258 (204.76) Oceania 0 0 0 Caribbean 1,463 3,146 1,683 (115.04) Central America 1,186 1,815 629 (53.04) South America 223 416 193 (86.55) Canada 23 58 35 (152.17) Total Foreign Born 4,138 7,178 3,040 (73.47)
Table 35: Top Five National Origins of Poughkeepsie’s Foreign Born Population, 2000 & 2010
2000 2010
Country Population Country Population
Jamaica 1,244 Jamaica 2,337
Mexico 1,102 Mexico 1,719
Italy 191 Dominican Republic 334
India 128 Ecuador 290
Poland 125 Italy 198
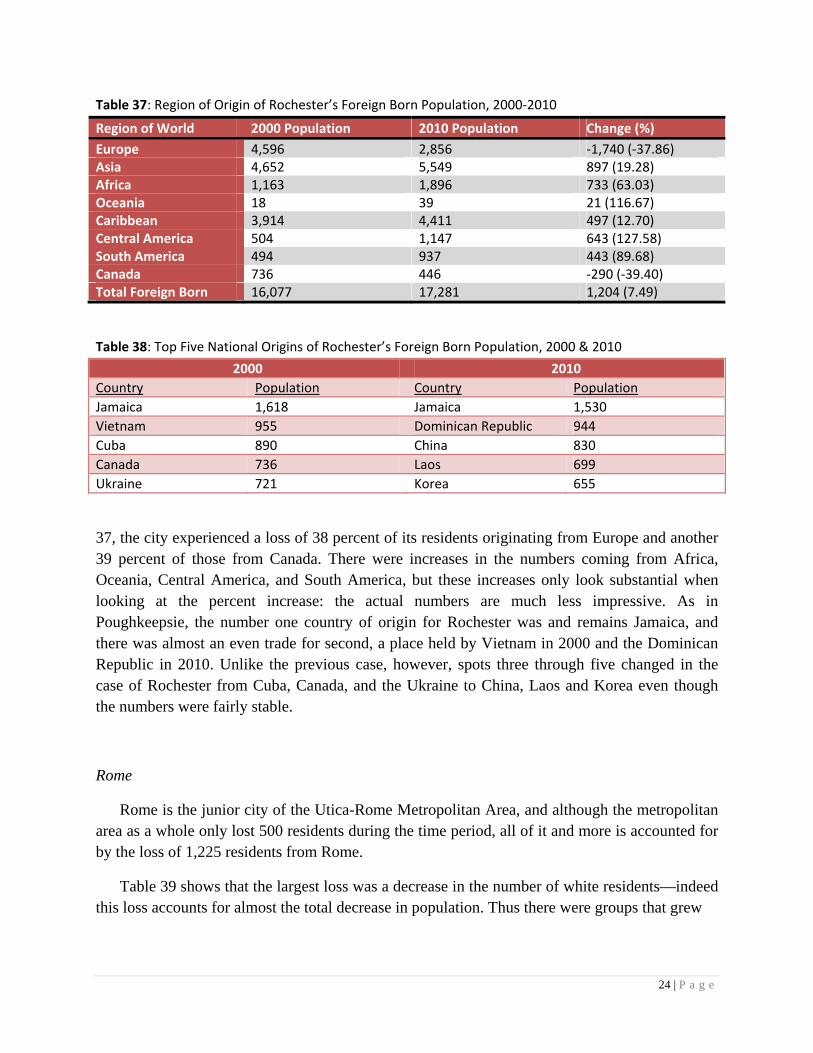
Rochester
Similar to other cities in the western part of the state, Rochester experienced a population decrease. Although it is not a large percentage of the total population, a loss of 9,208 residents is significant. Table 36 indicates that although the number of black and Asian residents increased, these increases were not substantial enough to counteract the exit of more than 14,000 white residents. Even an increase in the Hispanic population as seen in other New York cities to roughly 16 percent of the total was not able to offset the white exodus. The Hispanic population, although showing an increase, did not increase as much as it did in other cities throughout the state where increases were commonly more than 10 percent of the total population. A similar story can be seen when looking at the foreign born population in Rochester. As shown in table
Table 36: Change in Rochester’s Racial Composition, 2000‐2010
Race 2000 Population (%) 2010 Population (%) Change (%)
White 106,161 (48.30) 91,951 (43.67) ‐14,210 (13.39) Black 84,717 (38.55) 87,897 (41.74) 3,180 (3.75) Native American 1,033 (0.47) 1,013 (0.48) ‐20 (‐1.94) Asian 4,943 (2.25) 6,493 (3.08) 1,550 (31.36) Pacific Islander 104 (0.05) 101 (0.05) ‐3 (‐2.88) Mixed Race 8,363 (3.81) 9,356 (4.44) 993 (11.87) Did not identify race 14,452 (6.58) 13,754 (6.53) ‐698 (‐4.83) TOTAL 219,773 210,565 ‐9,208 (‐4.19)
24 | P a g e
Table 37: Region of Origin of Rochester’s Foreign Born Population, 2000‐2010
Region of World 2000 Population 2010 Population Change (%)
Europe 4,596 2,856 ‐1,740 (‐37.86) Asia 4,652 5,549 897 (19.28) Africa 1,163 1,896 733 (63.03) Oceania 18 39 21 (116.67) Caribbean 3,914 4,411 497 (12.70) Central America 504 1,147 643 (127.58) South America 494 937 443 (89.68) Canada 736 446 ‐290 (‐39.40) Total Foreign Born 16,077 17,281 1,204 (7.49)
Table 38: Top Five National Origins of Rochester’s Foreign Born Population, 2000 & 2010
2000 2010
Country Population Country Population
Jamaica 1,618 Jamaica 1,530
Vietnam 955 Dominican Republic 944
Cuba 890 China 830
Canada 736 Laos 699
Ukraine 721 Korea 655
37, the city experienced a loss of 38 percent of its residents originating from Europe and another 39 percent of those from Canada. There were increases in the numbers coming from Africa, Oceania, Central America, and South America, but these increases only look substantial when looking at the percent increase: the actual numbers are much less impressive. As in Poughkeepsie, the number one country of origin for Rochester was and remains Jamaica, and there was almost an even trade for second, a place held by Vietnam in 2000 and the Dominican Republic in 2010. Unlike the previous case, however, spots three through five changed in the case of Rochester from Cuba, Canada, and the Ukraine to China, Laos and Korea even though the numbers were fairly stable.
Rome
Rome is the junior city of the Utica-Rome Metropolitan Area, and although the metropolitan area as a whole only lost 500 residents during the time period, all of it and more is accounted for by the loss of 1,225 residents from Rome.
Table 39 shows that the largest loss was a decrease in the number of white residents—indeed this loss accounts for almost the total decrease in population. Thus there were groups that grew

25 | P a g e
Table 39: Change in Rome’s Racial Composition, 2000‐2010
Race 2000 Population (%) 2010 Population (%) Change (%)
White 30,704 (87.85) 29,483 (87.42) ‐1,221 (‐3.98) Black 2,650 (7.58) 2,394 (7.10) ‐256 (‐9.66) Native American 93 (0.27) 115 (0.34) 22 (23.66) Asian 309 (0.88) 367 (1.09) 58 (18.77) Pacific Islander 6 (0.02) 1 (0) ‐5 (‐83.33) Mixed Race 715 (2.05) 895 (2.65) 180 (25.17) Did not identify race 473 (1.35) 470 (1.39) ‐3 (‐0.63) TOTAL 34,950 33,725 ‐1,225 (‐3.51)
Table 40: Region of Origin of Rome’s Foreign Born Population, 2000‐2010
Region of World 2000 Population 2010 Population Change (%)
Europe 524 493 ‐31 (‐5.92) Asia 251 291 40 (15.94) Africa 26 61 35 (134.62) Oceania 6 0 ‐6 (‐600) Caribbean 262 391 129 (49.24) Central America 57 93 36 (63.16) South America 74 121 47 (63.51) Canada 144 36 ‐108 (‐75.0) Total Foreign Born 1344 1486 142 (10.57)
Table 41: Top Five National Origins of Rome’s Foreign Born Population, 2000 & 2010
2000 2010
Country Population Country Population
Italy 173 Dominican Republic 195
Canada 144 Italy 191
Dominican Republic 133 Trinidad & Tobago 108
United Kingdom 120 United Kingdom 108
Germany 100 Colombia 68
in number as well, including an increase in the number of those who claimed mixed racial heritage and Asians. The Hispanic population in Rome grew relatively little to just more than 5 percent of the total, from 1,648 residents to 1,793 residents. This combined with the size of its foreign born population overall likely accounts for the lack of growth. Places that experienced growth from 2000 to 2010 experienced substantial increases in their percent Hispanic and percent foreign born. Table 40 looks at the foreign born population in Rome and shows that it increased by a mere 142 residents over ten years. As with other upstate cities, those originating in Europe and Canada decreased while those coming from Africa and Central and South America increased. The top five national origins, shown in Table 41, have changed somewhat with the
26 | P a g e
Dominican Republic replacing Italy at the top of the list in 2010 (third in 2000) and Trinidad and Tobago and Columbia replacing Canada and Germany in 2010 (although not in the same ranks).
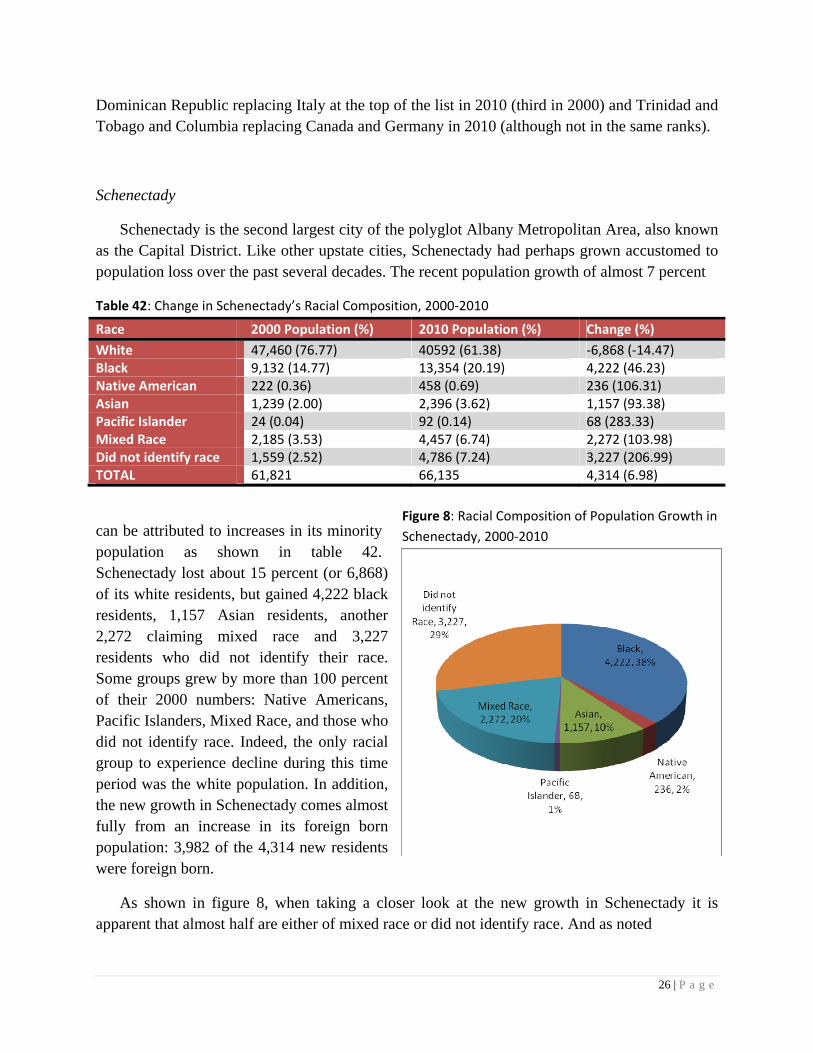
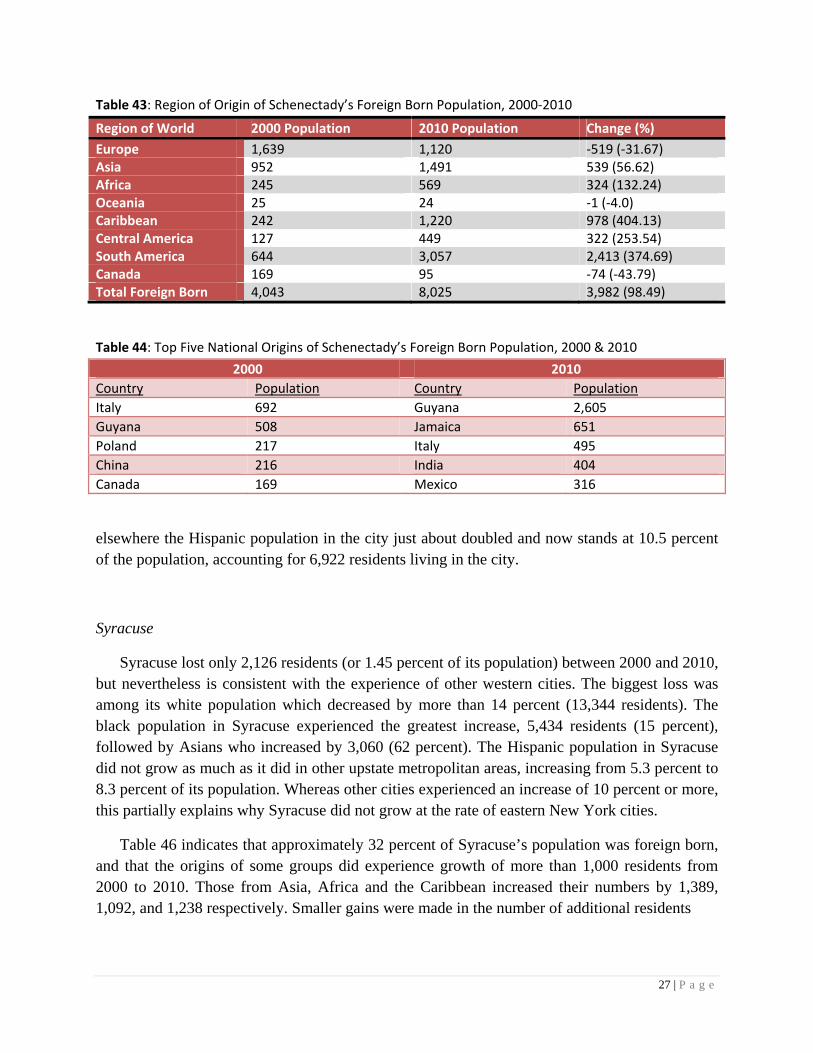
Schenectady
Schenectady is the second largest city of the polyglot Albany Metropolitan Area, also known as the Capital District. Like other upstate cities, Schenectady had perhaps grown accustomed to population loss over the past several decades. The recent population growth of almost 7 percent
Table 42: Change in Schenectady’s Racial Composition, 2000‐2010
Race 2000 Population (%) 2010 Population (%) Change (%)
White 47,460 (76.77) 40592 (61.38) ‐6,868 (‐14.47) Black 9,132 (14.77) 13,354 (20.19) 4,222 (46.23) Native American 222 (0.36) 458 (0.69) 236 (106.31) Asian 1,239 (2.00) 2,396 (3.62) 1,157 (93.38) Pacific Islander 24 (0.04) 92 (0.14) 68 (283.33) Mixed Race 2,185 (3.53) 4,457 (6.74) 2,272 (103.98) Did not identify race 1,559 (2.52) 4,786 (7.24) 3,227 (206.99) TOTAL 61,821 66,135 4,314 (6.98)
can be attributed to increases in its minority population as shown in table 42. Schenectady lost about 15 percent (or 6,868) of its white residents, but gained 4,222 black residents, 1,157 Asian residents, another 2,272 claiming mixed race and 3,227 residents who did not identify their race. Some groups grew by more than 100 percent of their 2000 numbers: Native Americans, Pacific Islanders, Mixed Race, and those who did not identify race. Indeed, the only racial group to experience decline during this time period was the white population. In addition, the new growth in Schenectady comes almost fully from an increase in its foreign born population: 3,982 of the 4,314 new residents were foreign born.
As shown in figure 8, when taking a closer look at the new growth in Schenectady it is apparent that almost half are either of mixed race or did not identify race. And as noted
Figure 8: Racial Composition of Population Growth in
Schenectady, 2000‐2010
27 | P a g e
Table 43: Region of Origin of Schenectady’s Foreign Born Population, 2000‐2010
Region of World 2000 Population 2010 Population Change (%)
Europe 1,639 1,120 ‐519 (‐31.67) Asia 952 1,491 539 (56.62) Africa 245 569 324 (132.24) Oceania 25 24 ‐1 (‐4.0) Caribbean 242 1,220 978 (404.13) Central America 127 449 322 (253.54) South America 644 3,057 2,413 (374.69) Canada 169 95 ‐74 (‐43.79) Total Foreign Born 4,043 8,025 3,982 (98.49)
Table 44: Top Five National Origins of Schenectady’s Foreign Born Population, 2000 & 2010
2000 2010
Country Population Country Population
Italy 692 Guyana 2,605
Guyana 508 Jamaica 651
Poland 217 Italy 495
China 216 India 404
Canada 169 Mexico 316
elsewhere the Hispanic population in the city just about doubled and now stands at 10.5 percent of the population, accounting for 6,922 residents living in the city.
Syracuse
Syracuse lost only 2,126 residents (or 1.45 percent of its population) between 2000 and 2010, but nevertheless is consistent with the experience of other western cities. The biggest loss was among its white population which decreased by more than 14 percent (13,344 residents). The black population in Syracuse experienced the greatest increase, 5,434 residents (15 percent), followed by Asians who increased by 3,060 (62 percent). The Hispanic population in Syracuse did not grow as much as it did in other upstate metropolitan areas, increasing from 5.3 percent to 8.3 percent of its population. Whereas other cities experienced an increase of 10 percent or more, this partially explains why Syracuse did not grow at the rate of eastern New York cities.
Table 46 indicates that approximately 32 percent of Syracuse’s population was foreign born, and that the origins of some groups did experience growth of more than 1,000 residents from 2000 to 2010. Those from Asia, Africa and the Caribbean increased their numbers by 1,389, 1,092, and 1,238 respectively. Smaller gains were made in the number of additional residents

28 | P a g e
Table 45: Change in Syracuse’s Racial Composition, 2000‐2010
Race 2000 Population (%) 2010 Population (%) Change (%)
White 94,663 (64.26) 81,319 (56.02) ‐13,344 (‐14.10) Black 37,336 (25.35) 42,770 (29.46) 5,434 (14.55) Native American 1,670 (1.13) 1,606 (1.11) ‐64 (‐3.83) Asian 4,961 (3.37) 8,021 (5.53) 3,060 (61.68) Pacific Islander 72 (0.05) 44 (0.03) ‐28 (‐38.89) Mixed Race 5,320 (3.61) 7,473 (5.15) 2,153 (40.47) Did not identify race 3,284 (2.23) 3,937 (2.71) 653 (19.88) TOTAL 147,306 145,170 ‐2,136 (‐1.45)
Table 46: Region of Origin of Syracuse’s Foreign Born Population, 2000‐2010
Region of World 2000 Population 2010 Population Change (%)
Europe 3,612 3,073 ‐539 (‐14.92) Asia 4,804 6,193 1,389 (28.91) Africa 549 1,641 1,092 (198.91) Oceania 18 107 89 (494.44) Caribbean 1,207 2,445 1,238 (102.57) Central America 197 357 160 (81.22) South America 314 625 311 (99.04) Canada 513 414 ‐99 (‐19.30) Total Foreign Born 11,214 14,855 3,641 (32.47)
Table 47: Top Five National Origins of Syracuse’s Foreign Born Population, 2000 & 2010
2000 2010
Country Population Country Population
Vietnam 1,222 China 1,288
China 880 India 1,261
Italy 807 Cuba 925
Bosnia Herzegovina 527 Bosnia Herzegovina 690
Canada 513 Jamaica 529
coming from Central America, South America and Oceania; and there were losses in the number of residents from Europe and Canada as also seen in other upstate cities. Furthermore, as noted in table 47, the top five national origins in Syracuse shifted some from 2000 to 2010: Canada was ranked number five in 2000 but is no longer on the list, replaced by India which now holds the number two spot with 1,261 residents in the city. The number one spot is held by China with 1,288 residents—an increase from 880 in 2000.
29 | P a g e
Troy
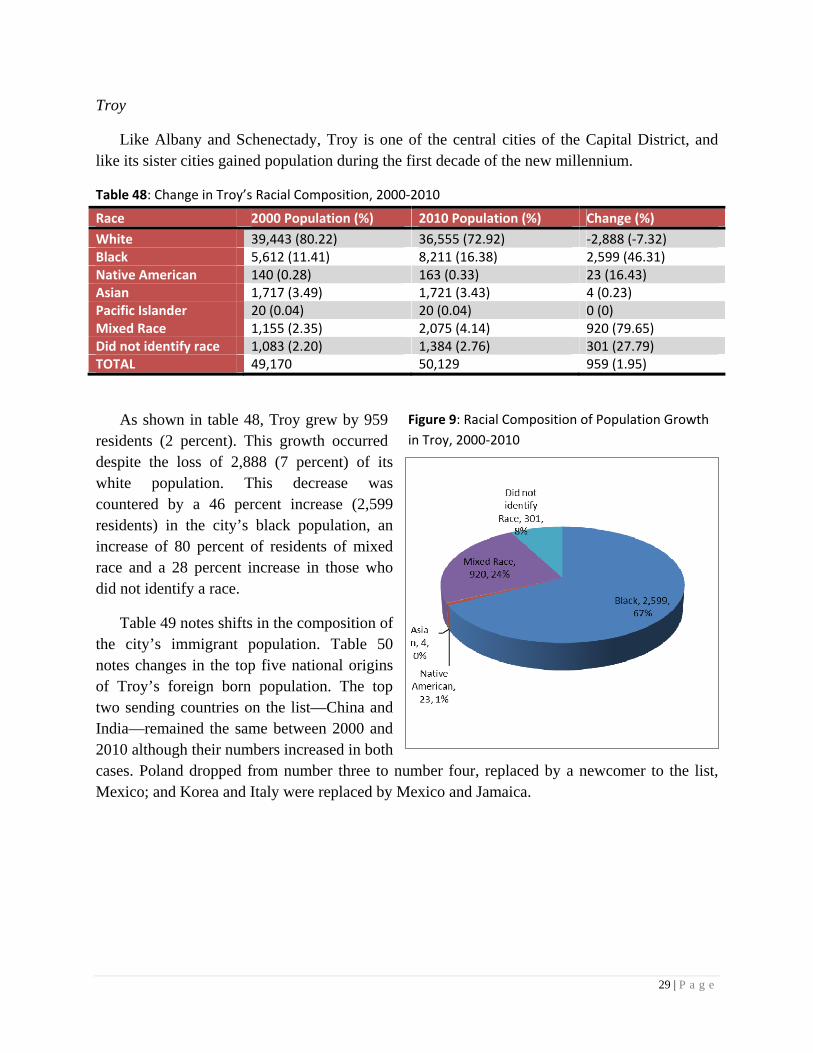
Like Albany and Schenectady, Troy is one of the central cities of the Capital District, and like its sister cities gained population during the first decade of the new millennium.
Table 48: Change in Troy’s Racial Composition, 2000‐2010
Race 2000 Population (%) 2010 Population (%) Change (%)
White 39,443 (80.22) 36,555 (72.92) ‐2,888 (‐7.32) Black 5,612 (11.41) 8,211 (16.38) 2,599 (46.31) Native American 140 (0.28) 163 (0.33) 23 (16.43) Asian 1,717 (3.49) 1,721 (3.43) 4 (0.23) Pacific Islander 20 (0.04) 20 (0.04) 0 (0) Mixed Race 1,155 (2.35) 2,075 (4.14) 920 (79.65) Did not identify race 1,083 (2.20) 1,384 (2.76) 301 (27.79) TOTAL 49,170 50,129 959 (1.95)
As shown in table 48, Troy grew by 959 residents (2 percent). This growth occurred despite the loss of 2,888 (7 percent) of its white population. This decrease was countered by a 46 percent increase (2,599 residents) in the city’s black population, an increase of 80 percent of residents of mixed race and a 28 percent increase in those who did not identify a race.
Table 49 notes shifts in the composition of the city’s immigrant population. Table 50 notes changes in the top five national origins of Troy’s foreign born population. The top two sending countries on the list—China and India—remained the same between 2000 and 2010 although their numbers increased in both cases. Poland dropped from number three to number four, replaced by a newcomer to the list, Mexico; and Korea and Italy were replaced by Mexico and Jamaica.
Figure 9: Racial Composition of Population Growth
in Troy, 2000‐2010
30 | P a g e
Table 49: Region of Origin of Troy’s Foreign Born Population, 2000‐2010
Region of World 2000 Population 2010 Population Change (%)
Europe 846 1,009 163 (19.27) Asia 1,431 1,730 299 (20.89) Africa 90 371 281 (312.22) Oceania 8 17 9 (112.50) Caribbean 182 598 416 (228.57) Central America 62 352 290 (467.74) South America 176 163 ‐13 (‐7.39) Canada 77 113 36 (46.75) Total Foreign Born 2,872 4,353 1,482 (51.57)
Table 50: Top Five National Origins of Troy’s Foreign Born Population, 2000 & 2010
2000 2010
Country Population Country Population
China 634 China 495
India 270 India 349
Poland 171 Mexico 215
Korea 158 Poland 168
Italy 120 Jamaica 162
Utica
Utica is the largest city of the Utica-Rome Metropolitan Area, the sixth largest in New York and arguably representative of trends found in both the eastern and western halves of the state.
Table 51: Change in Utica’s Racial Composition, 2000‐2010
Race 2000 Population (%) 2010 Population (%) Change (%)
White 48,166 (79.42) 42,945 (69.00) ‐5,221 (‐10.84) Black 7,838 (12.92) 9,501 (15.27) 1,663 (21.22) Native American 170 (0.28) 180 (0.29) 10 (5.88) Asian 1,341 (2.21) 4,226 (6.79) 2,885 (215.14) Pacific Islander 29 (0.05) 36 (0.06) 7 (24.14) Mixed Race 1,798 (2.96) 2,506 (4.03) 708 (39.38) Did not identify race 1,309 (2.20) 2,841 (2.76) 301 (27.79) TOTAL 60,651 62,235 1,584 (2.61)
The city of Utica experienced a 3 percent increase in population from 2000 to 2010 (see table 51). This increase occurred despite a loss of 5,221 (11 percent) of its white population. The growth can be attributed to an increase in the city’s black population by 1,663 residents (21 percent), in its Asian population (up by 215 percent, or 2,885 residents), as well as an increase in
31 | P a g e
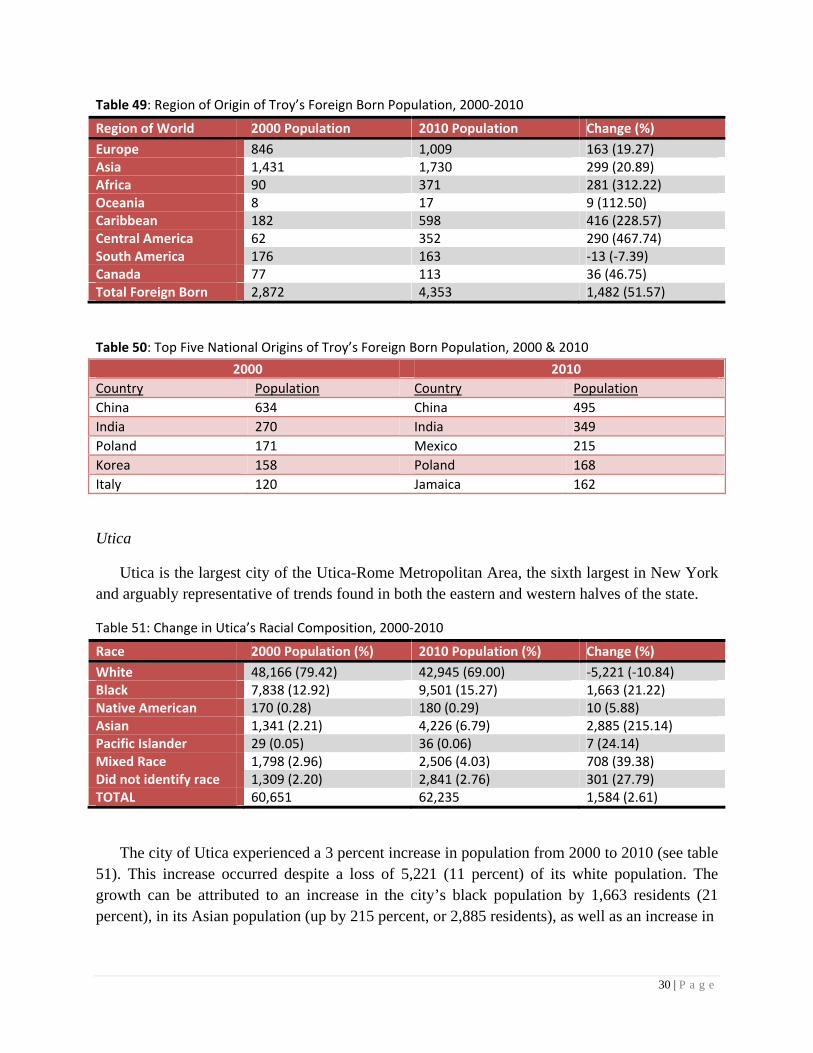
residents of mixed race and those by did not identify race. The number of foreign born residents was 1,910 more than the total population increase of 1,584; thus 121% of the new growth in the city can be accounted for by the increase of its foreign born population. Figure 9 shows that growth in the Asian population accounted for 52 percent and blacks for 30 percent of the total growth in the city. The Hispanic population of the city doubled, increasing from 5.8 percent to 10.5 percent of the population—6,555 residents in 2010.
Table 52 below shows that the foreign born population increased by 1,910 residents from 2000 to 2010. Similar to other upstate cities this growth occurred despite a loss of 13% (719 residents) of European descent. These residents were offset by an increase of residents from Asia (1,531 residents), the Caribbean (419 residents), Africa (222 residents), and South America (242 residents). Smaller increases came from Central America, Canada, and Oceania.
Table 52: Region of Origin of Utica’s Foreign Born Population, 2000‐2010
Region of World 2000 Population 2010 Population Change (%)
Europe 5,340 4,621 ‐719 (‐13.46) Asia 1,335 2,866 1,531 (114.68) Africa 43 265 222 (516.28) Oceania 0 13 13 (1300.0) Caribbean 301 720 419 (139.20) Central America 25 186 161 (644.0) South America 108 350 242 (224.07) Canada 79 120 41 (51.90) Total Foreign Born 7,231 9,141 1,910 (26.41)
Table 53 provides more detail about Utica’s foreign born population. The top five countries of origin experienced some change, however the number one country of origin stands out and experienced an increased—Bosnia Herzegovina. The number two country, Vietnam, remained the same although its numbers decreased some. The last three changed from Belarus, the Ukraine and Italy to Burma, Thailand, and the Dominican Republic.
Figure 10: Racial Composition of Population
Growth in Utica, 2000‐2010
32 | P a g e
Table 53: Top Five National Origins of Utica’s Foreign Born Population, 2000 & 2010
2000 2010
Country Population Country Population
Bosnia Herzegovina 2,596 Bosnia Herzegovina 2,740
Vietnam 819 Vietnam 591
Belarus 602 Burma 553
Ukraine 461 Thailand 465
Italy 440 Dominican Republic 363
Conclusions
Although the dominant discourse in the news media and popular culture has stressed upstate decline, it is notable that many central cities actually gained population during the first decade of the new millennium. For most of these cities, the increase in population was the first in decades and the significance of this should not be underestimated. There are three trends that are particularly notable in the data.
The first significant finding is that cities in the eastern half of the state—approximately a line represented by route 12—gained in population while most cities in western New York declined. The growth appears along an approximate gradient in relation to distance to the New York metropolitan area: the cities most connected to New York—Newburgh, Middletown, and Poughkeepsie—all experienced growth in the city and suburbs. In contrast, with the exception of Ithaca, the cities of western New York all declined in population.
The decline in population in nearly every city is marked by a continuation of the trend of white flight. This trend began shortly after World War II as whites moved to the suburbs, and the most recent data show that this is still the case (Massey & Denton 1993).
The cities that gained population all did so based on their appeal to immigrant populations. Nearly every city lost a portion of its white population, the main exceptions being Ithaca, a city without a major suburban ring, and Glens Falls, which is arguably now a suburb of Albany. Cities closer to New York grew their immigrant populations fastest, offsetting declines in the white population. In many cities, the qualitative observation of immigrants “fixing up” abandoned neighborhoods (as in Utica and Schenectady) is borne out by the statistics.
33 | P a g e
Works Cited
Barrett, James and David Roediger. 2012. “How White People Became White.” In Paula Rothenberg, White Privilege. New York: Worth.
Brodkin, Karen. 1994. “How Jews Became White Folks.” In Paula Rothenberg, White Privilege. New York: Worth.
Foley, Neil. 1997. “Becoming Hispanic: Mexican Americans and Whiteness.” In Paula Rothenberg, White Privilege. New York: Worth.
Henslin, James. 2012. Sociology: A Down-To-Earth Approach. 11th ed. Boston: Pearson.
Massey, Douglas & Nancy Denton. 1993. American Apartheid. Cambridge: Harvard U. Press.
McIntosh, Peggy. 1988. “White Privilege: Unpacking the Invisible Knapsack.” In Paula Rothenberg, White Privilege. New York: Worth.
Omi, Michael & Howard Winant. 1994. Racial Formations in the United States. New York: Routledge.
Painter, Nell. 2010. The History of White People. New York: W. W. Norton.
Rothenberg, Paula. 2012. White Privilege. 4th ed. New York: Worth.
Schaefer, Richard. 2012. Racial and Ethnic Groups. 13th ed. Boston: Pearson.
Alexander R. Thomas & Polly J. Smith. 2009. Upstate Down: Thinking about New York and its Discontents. New York: University Press of America.
Alexander R. Thomas & Polly J. Smith. 2011. A Picture of Stability: Good and Bad News for New York Counties in the 2010 Census. Albany, N. Y.: Lewis Mumford Center for Comparative Urban and Regional Research.
34 | P a g e
About the Authors
Polly J. Smith, Director & Associate Professor of Sociology, Utica College. Ph.D., University at Albany. Dr. Smith is an urban sociologist with interests in small cities and rural communities, complex organizations, and how the restructuring of the American economy has affected smaller cities and towns. She utilizes statistics and geographic information systems (GIS) in her research.
Alexander R. Thomas, Associate Professor of Sociology, SUNY Oneonta. Ph.D., Northeastern University. Dr. Thomas is a comparative sociologist who studies the development and functioning of urban systems. His current research aims at comparing New York City and its satellites to other urban systems in other places and time periods.
Jan DeAmicis, Professor of Sociology, Utica College. Ph.D., University of Massachusetts, Amherst. Dr. DeAmicis is an historical sociologist with interests in the experience of race and ethnicity. His recent research is reflected in the Underground Railroad project in which he utilizes historical and archaeological data to analyze this important institution in the history of upstate New York.


