Page 1
ETHYLENE GLYCOL ACCELERATED WEATHERING TEST – A NEW 1
IMPROVED NON-SUBJECTIVE AGGREGATE DURABILITY TEST 2
METHOD 3
4
5
Petrus G. L. van Blerk 6 New Zealand Transport Agency 7
Level 3, Harrington House, 8
32 Harington Street, Tauranga 3141 9
New Zealand 10
Tel: +64 (7) 927 6009; Fax: +64 (7) 578 2909, E-mail: [email protected] 11
12
Enrico Fletcher 13 AECOM New Zealand Ltd 14
121 Rostrevor Street, 15
Hamilton 3204, 16
New Zealand 17
Tel: +64 (7) 959 1762; Fax: +64 (7) 834 8981, E-mail: [email protected] 18
19
Seosamh B. Costello, PhD. 20 Department of Civil and Environmental Engineering 21
The University of Auckland 22
Private Bag 92019, Auckland 1142, 23
New Zealand 24
Tel: +64 (9) 373 7599 ext. 88164; Fax: +64 (9) 373 7462, E-mail: [email protected] 25
26
Theuns F. P. Henning, PhD. 27 Department of Civil and Environmental Engineering 28
The University of Auckland 29
Private Bag 92019, Auckland 1142, 30
New Zealand 31
Tel: +64 (9) 373 7599 ext. 88181; Fax: +64 (9) 373 7462, E-mail: [email protected] 32
33
34
35
36
Submission Date: November 15, 2016 37
Word Count: Manuscript 5,919 (abstract = 249) + 5 Tables/Figures @ 250 each = 7,169 38
39
40
Prepared for presentation at the Transportation Research Board 96th Annual Meeting, Washington D.C. 41
and possible publication in the Journal of the Transportation Research Board 42
Page 2
Van Blerk, Fletcher, Costello, Henning 2
1
ABSTRACT 2
Ethylene glycol has been used extensively in the past by the concrete and road construction industries to 3
identify rock durability issues associated with smectite clay minerals. The presence of these clay minerals 4
is synonymous with rock degradation under normal environmental wetting and drying cycles. However, 5
such historical test methods are predominately based on a subjective visual interpretation, describing the 6
observed degradation of individual rock pieces at fixed time intervals during the soaking process. In 7
addition, some test methods include complex equations with multiple weighting factors applied to 8
nominated degradation descriptors (e.g. spalling, fracture and disintegration) used to calculate a single 9
durability indicator. 10
The paper describes the development and implementation of an alternative non-subjective accelerated 11
weathering test also using ethylene glycol. The research included metamorphic and volcanic rock types 12
used extensively in New Zealand for road construction. The greatest benefit of the proposed new test 13
method is the ability to eliminate the subjective visual assessment described in historical test methods and 14
adequately quantify results to specify a contractual acceptance and rejection criteria. The test method also 15
shows that good repeatability is possible from duplicate test samples. However, rock quality and quarry 16
production consistency will influence the ability of the test method to report the same “percentage change 17
in fines” over a prolonged test period. This was particularly evident within problematic and lower quality 18
rock. The test findings are well supported by observed field performance, thus giving confidence in the 19
new method’s usefulness. 20
21
Keywords: Ethylene glycol, aggregate durability, smectite clays. 22
23
24
Page 3
Van Blerk, Fletcher, Costello, Henning 3
INTRODUCTION 1
The last decade has seen a significant increase in the delivery of large road construction projects in New 2
Zealand. As a result, the demand for, and subsequent supply of, road aggregate has increased 3
substantially. Due to New Zealand’s geological formation, metamorphic (Greywacke) and volcanic rock 4
(Andesite, Basalt and Dacite) is a common source of aggregate used for road construction. However, it is 5
not uncommon for these rock sources to undergo mineral alterations due to weathering. The presence of 6
smectite clay minerals has been linked to aggregate durability issues. As a consequence, the industry has 7
experienced a number of high profile pavement failures. Further investigations into the observed failures 8
exposed possible shortcomings within current aggregate specifications. In particular, these specifications 9
did not include any accelerated weathering test that can successfully quantify clay minerals within road 10
aggregates, notwithstanding the fact that ethylene glycol has been used extensively in various parts of the 11
world to identify durability issues with basic crystalline rock. 12
When the structure of smectite consists of greater octahedral than tetrahedral substitutions it is called 13
Montmorillonite. Montmorillonite minerals are a product of volcanism and hydrothermal activity, and 14
consist of hydrous aluminum silicates in the form of extremely small particles. These clay particle layers 15
absorb water, which causes swelling. In addition, the clay minerals react with, and absorb, organic 16
liquids, such as amines, glycols (ethylene glycol), glycerols and other polyhydric alcohols, which also 17
cause swelling. Because the clay minerals react with glycols, the use of ethylene glycol has historically 18
proven successful as an indicator test for smectite clays. The exchangeable cations within the layers of the 19
smectite clay will depend on the mineral composition, most commonly made up of sodium, magnesium 20
and calcium, with sodium smectite known to have higher swelling properties. It is this swelling property 21
of the clays, as a result of soaking in ethylene glycol, which forms the basis of historical test methods. 22
However, such historical test methods appear to be very subjective. Individual rock pieces are visually 23
assessed during the soaking process and degradation reported at specified time intervals. This process can 24
be problematic, as complex multiple degradation criteria (e.g. spalled, fractured and disintegrated) are 25
visually assessed at fixed time intervals and may also include additional weighting factors applied to each 26
degradation criteria. Finally, these weighted values are added to calculate a single performance indicator 27
or durability value. 28
The purpose of this research, while building on existing international test methods, was to develop and 29
validate a simplified test specification to eliminate any visual subjectivity associated with these historical 30
methods. The research also reports on the Atterberg Limits, plasticity index (PI), clay index (CI) and sand 31
equivalence (SE), as well as thin section petrography/mineralogy and x-ray diffraction (XRD) analysis to 32
identify any possible correlations that may exist, in support of the proposed new test method. 33
34
LITERATURE REVIEW 35
It is evident from literature that various ethylene glycol based test methods are widely used internationally 36
to assess durability of construction aggregate. The most widely used method appears to be a test 37
developed by the U.S. Army Corps of Engineers in 1949 for concrete and cement aggregates (1). A 38
sample of approximately 5kg of aggregate between the 76.1mm and 19mm stone particle sizes are soaked 39
in ethylene glycol for 15 days. The sample is inspected every 3 days for visual breakdown. After soaking, 40
the sample is drained and screened through the 19mm sieve size. The percentage particles by weight 41
passing the 19mm sieve are reported. 42
A modified version of the Corps of Engineers method is described by Davidson (2) for road aggregate. In 43
this method, the test sample comprises of smaller stone particle sizes between the 13.2mm and 9.5mm 44
fractions. Similar to the Corps of Engineers method, the percentage particles by weight passing the 45
smaller sieve size, in this case the 9.5mm, is reported. However, a subsequent report by Fielding and 46
Maccarone (3) deemed this test inadequate for specifying an acceptance and rejection criteria. 47
Page 4
Van Blerk, Fletcher, Costello, Henning 4
Gomes & Rodrigues (4) described an alternative ethylene glycol test protocol for basaltic rock in Brazil. 1
Stone samples are soaked for 21 days, the amount of affected stone particles are visually assessed at 3 day 2
intervals and reported as a percentage value of the total rock samples affected after 21 days. The method 3
appears to be crude and merely a general indicator of degradation associated with smectite clays. 4
Leyland, Paige-Green and Momayez (5) highlighted the work done by Sampson (6) in South Africa, 5
which used the British soaked Aggregate Impact Value (AIV) test (7). The AIV test is performed on stone 6
particles between the 14mm and 10mm sieve sizes, in a dry and water soaked (24 hours) condition. The 7
crushed fines fraction passing the 2.36mm sieve size, measured by weight, is reported as the AIV. If the 8
AIV for the water soaked sample is greater than 30%, compared to the dry sample, the specification states 9
the source aggregate should be treated with caution. Sampson adapted this test method by substituting the 10
water with ethylene glycol and found the difference between the dry and ethylene glycol soaked 11
aggregate impact values were useful in identifying potential poor performance (6). 12
Paige-Green (8) states that the use of ethylene glycol to accelerate the effects of smectite clays within 13
rock has become almost routine practice in South Africa, citing work done by Van Rooy & Nixon, Van 14
Rooy & Van Schalkwyk, and Bell & Jermy (9, 10, 11). 15
Leyland, Paige-Green and Momayez (5) proposed a modified Ethylene Glycol Durability Index (mEGDI) 16
test. The test uses forty stone pieces of approximately equal dimension, between 19mm and 13mm in size, 17
covered by ethylene glycol complying with ASTM D2693-07 (12). The stone particles are placed in a 18
grid of 5 x 8 covered with ethylene glycol in a tray and inspected at 1, 5, 10 and 20 days. The integrity of 19
each rock sample is inspected and assessed on a definition of: i) spalling - shedding of small fragments 20
from the aggregate edges and surface; ii) fracture - splitting into two or more pieces; and iii) 21
disintegration - splitting into more than three pieces. The mEGDI value is calculated for each observation 22
period and a weighting factor (0.5 x spalling, 1 x fracture and 5 x disintegration) is applied to the number 23
of pieces affected by the three descriptions of degradation. The sum of these weighted values is then used 24
to calculate a single mEGDI value. The proposed test method appears to be complex and subjective, 25
based solely on visual interpretations of the observed three degradation criteria reported at fixed time 26
intervals. In addition, the research shows the 20/5 day mEGDI ratio, which emphasizes the importance of 27
prolonged soaking for at least 20 days. Finally, they noted that other test methods, that do not test 28
durability after soaking and expansion of clays, did not correlate well with the mEGDI test. 29
The South African National Standards (SANS) 3001 - AG 14 & 15 describe two draft ethylene glycol 30
soaking test methods to assess the durability of basic crystalline rocks used within pavement subbase and 31
base layers (13, 14). These draft test methods are referred to in the South African Pavement Engineering 32
Manual and attempt to identify aggregate rock prone to weathering when exposed to the atmosphere, as 33
may occur in the presence of smectite clays (15). The ethylene glycol durability index test (AG14) 34
appears to originate from the work done by Leyland, Paige-Green and Momayez (5) as it follows the 35
same test protocol. In the second test (AG15), stone particles of a fixed size fraction are soaked for 24 36
hours in ethylene glycol before being subjected to a 10% fines aggregate crushing test (FACT). The load 37
applied to create 10% fines for the ethylene glycol soaked sample and the load applied to create 10% fines 38
for the dry control sample is reported as a wet to dry ratio. 39
Paige-Green (16) recommends the use of multiple test methods rather than a single test to predict 40
durability problems of basic crystalline materials. More importantly, he makes the statement that many 41
test methods use ethylene glycol, but ethylene glycol combined within a strength test appears to have the 42
greatest merit for inclusion in specifications. He also recommends a percentage aggregate crushing value 43
(ACV) ratio of dry to ethylene glycol soaked (4 days) of less than 20% as a compliance acceptance limit. 44
From the above, it appears that most of the durability tests consist of observed visual degradation of a 45
small representative rock sample. The subjective nature and complex calculations used to report a single 46
durability value is deemed by the New Zealand quarry industry as inadequate to include in contractual 47
Page 5
Van Blerk, Fletcher, Costello, Henning 5
specifications as an acceptance and rejection criteria. Thus, the purpose of the proposed new ethylene 1
glycol test method is to address these shortcomings and industry concerns. 2
3
THE PURPOSE AND SCOPE OF THE NEW ACCELERATED WEATHERING TEST (nAWT) 4
METHOD 5
The purpose of developing the proposed new Accelerated Weathering Test (nAWT) method is to simplify 6
and remove the subjectivity present with a number of the current test methods. Ultimately, the test method 7
should be robust enough to include in contractual specifications as an acceptance and rejection criteria. 8
This new test method builds on existing ethylene glycol durability tests, in particular the SANS 3001 - 9
AG 15 test method (13), while seeking to limit the aforementioned shortcomings. The concept is simple 10
and incorporates a standard crushing resistance test. A control sample of approximately 2.7 kilograms of 11
aggregate within a specified stone size fraction is placed in a steel mould; a constant loading rate over a 12
period of 10±1 min is applied to achieve a specified target load. The amount of crushed fines generated is 13
recorded as a percentage of the initial sample weight. This process is repeated for a duplicate sample 14
soaked in ethylene glycol. Again, as per the control sample, the percentage crushed fines is calculated for 15
the soaked sample crushed in a saturated surface dry condition. The proportional increase in percentage 16
fines for the soaked compared to the un-soaked control sample is calculated and proposed as a durability 17
compliance limit. 18
The development of the new test method, along with the main points of difference, is described in the 19
following sections. The new draft specification is referred to as NZTA T20 – Ethylene Glycol 20
Accelerated Weathering Test Method (17). 21
22
Specified Load 23
The nAWT method specifies a fixed target load, applied at a constant loading rate over a period of 10±1 24
min. This approach varies from the South African ethylene glycol test method AG15, which targets a 25
varying load to produce 10% FACT. Predicting the load to produce 10% crushed fines is a moving target 26
and requires multiple tests at various loads to produce a plot of the load versus percentage fines. A 27
straight line and/or extrapolation plot is used to estimate the load value to produce 10% fines. The new 28
test method attempts to simplify and limit the need for multiple crushing tests at various loads. Thus, the 29
approach taken with the new method is to limit testing at various loads and specify a fixed target load and 30
report the percentage crushed fines at this fixed load. 31
During the initial development, testing was performed at a load of 130kN, as this follows the standard 32
New Zealand aggregate crushing resistance test for base course aggregate (18). However, as expected for 33
good quality crushed rock mainly used within pavement base layers, the percentage fines by weight 34
generated from a 130kN load could be very small, sometimes as low as 3%. Thus, under the proposed 35
new test method, any small incremental change in percentage fines between the soaked and un-soaked 36
samples could report an unduly high percentage change. Therefore, the proposed new test method may 37
incorrectly report aggregate durability issues. To ensure sufficient fines are produced during testing of the 38
harder rock types, and to control incorrect reporting of possible durability issues, as a result of small 39
incremental changes in reported percentage fines, the test load was increased and standardized at 230kN. 40
As a result, the 230kN load will produce more crushed fines - in the order of 10% - for the harder rock 41
types. It is also the specified load to produce < 10% fines for surfacing sealing stone chip within New 42
Zealand. 43
44
Stone size fraction 45
Initial testing included multiple stone size fractions to determine any significant change in the reported 46
percentage of crushed fines from each fraction range, and possible correlation between the larger and 47
smaller stone fraction ranges. The crushing tests included the stone fraction ranges between 13.2mm and 48
Page 6
Van Blerk, Fletcher, Costello, Henning 6
9.5mm (reporting % fines passing 2.36mm sieve size) and between 19mm and 13.2mm (reporting % fines 1
passing 3.35mm sieve size). Soaked and un-soaked samples were tested for both these stone particle 2
ranges. Because the two test fraction ranges specify different sieve sizes to calculate the percentage 3
crushed fines, it was difficult to find any correlation or reason why one fraction should be favoured above 4
the other. Thus, it was decided to specify testing of the stone fraction between 13.2mm and 9.5mm, as this 5
is the preferred particle fraction used for the aggregate crushing test for base course material in New 6
Zealand and typically represents approximately 20% of the total gradation. 7
8
Ethylene glycol soaking time 9
Initial testing looked at reducing the soaking time, as this had inherent benefits by reducing the reporting 10
times. Test samples were soaked for three different lengths of time: 24 hours, 7 days and 21 days. After 11
24 hour soaking some samples showed no change. However, more substantial changes were reported after 12
7 and 21 days of soaking. This seems to indicate a soaking period greater than 24 hours is required to 13
identify possible durability issues, as tested at a specified load of 130kN. While the majority of the test 14
samples showed very little change between 7 and 21 day soaking, which may indicate 7 days as a 15
sufficient soaking period, it was noted that one sample did show a notable increase in fines after 21 days 16
soaking. This may indicate that rock types with greater solid densities require longer soaking times. So as 17
not to overlook these rock sources, it was decided to specify 21 days soaking in ethylene glycol for the 18
new test method. 19
This is a key point of difference with similar test methods such as the SANS 3001-AG15 method (13), 20
which specify a 24 hour soaking period specified, and the 4 days soaking period proposed by Page-Green 21
(16). 22
23
Ethylene glycol properties 24
Various grades of ethylene glycol are available on the market. It was, therefore, specified that the 25
ethylene glycol to be used comply with the ASTM D2693–07 standard. 26
27
Reported percentage crushed fines 28
The nAWT method specifies testing of the stone fraction range between 13.2mm and 9.5mm, and the 29
percentage crushed fines passing the 2.36mm sieve size is reported. The use of a smaller sieve size to 30
report the crushed fines is considered to be more indicative of significant degradation. This approach 31
differs from most other test methods, where the screening of the aggregate breakdown is based on the 32
smaller of the test sample stone fraction range. For example, the Corps of Engineers specify a stone 33
fraction range for the test sample between 76.1mm and 19mm, and report the fines passing the 19mm 34
sieve size. 35
36
Representative test sample size and weight 37
Approximately 2.7 kilograms of stone particles are needed to fill the steel mould to complete a single 38
crushing test. Thus, the resulting larger sample size gives a greater representation of the rock source 39
properties. Historical test methods most commonly follow an approach based on visual inspections and 40
reporting of individual rock particle degradation at fixed time intervals. These test methods generally 41
specify a limited number of stone particles, with the resulting test sample weighing less than 200 grams. 42
The ability to sufficiently describe the rock source properties based on a limited test sample size will 43
always be a challenge. The nAWT addresses this concern to some extent by incorporating much larger 44
quantities of rock within the test method. 45
46
Page 7
Van Blerk, Fletcher, Costello, Henning 7
Testing soaked samples in a dry and saturated surface dry condition 1
After soaking for 21 days in ethylene glycol the samples were drained and tested in a dried-back oven-dry 2
and saturated surface dry (SSD) condition. It was clear that samples with “abundant” smectite clay 3
minerals, as identified later in Table 2 using x-ray diffraction (XRD) analysis, had a dramatic increase in 4
crushed fines when tested in the saturated surface dry condition. The reason may be that the expansion 5
and swelling effect experienced by the clay minerals during the soaking process is diminished during the 6
dry-back in the oven, after soaking. It could be that the clay minerals shrink to some degree during the 7
oven drying to constant mass. This may reduce the extent of the microscopic crack initiation from the 8
swelling clays and ultimately affect the percentage of fines produced during the crushing test. A 9
secondary reason may be hydraulic pressure build up as a result of trapped ethylene glycol within the 10
more porous rock types. To ensure the “true” effect of the ethylene glycol is assessed, the nAWT 11
specifies a saturated surface dry test condition. 12
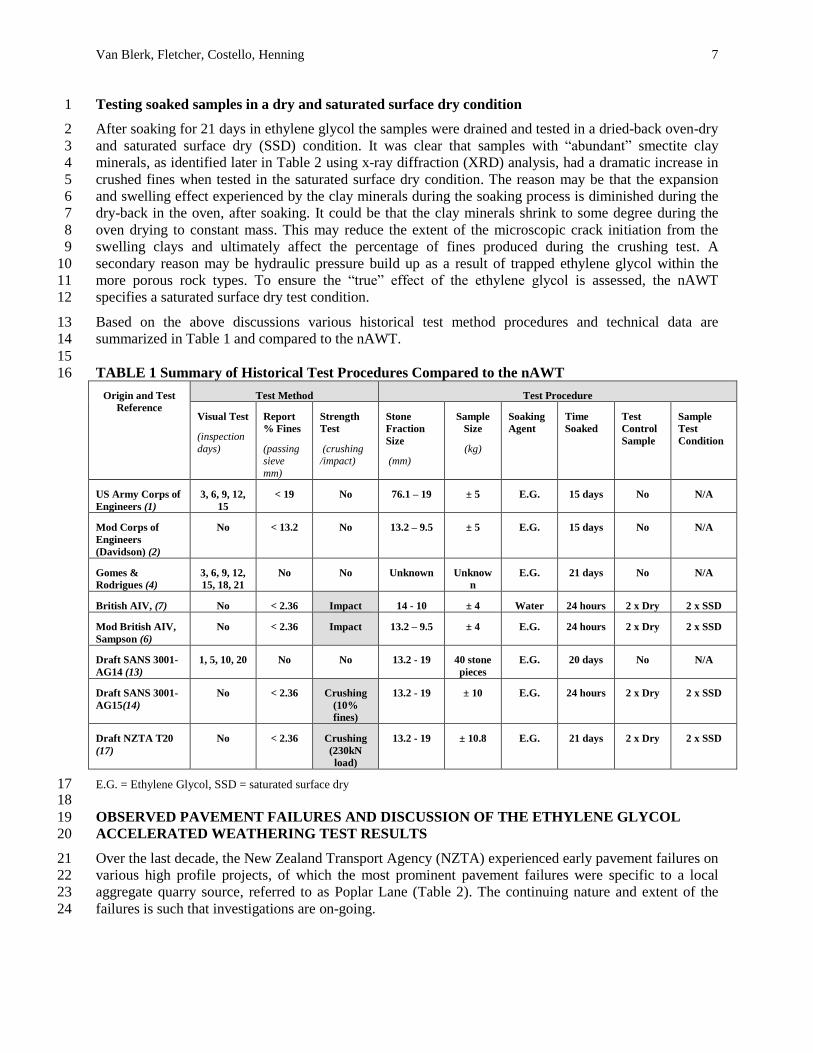
Based on the above discussions various historical test method procedures and technical data are 13
summarized in Table 1 and compared to the nAWT. 14
15
TABLE 1 Summary of Historical Test Procedures Compared to the nAWT 16
Origin and Test
Reference
Test Method Test Procedure
Visual Test
(inspection
days)
Report
% Fines
(passing sieve
mm)
Strength
Test
(crushing /impact)
Stone
Fraction
Size
(mm)
Sample
Size
(kg)
Soaking
Agent
Time
Soaked
Test
Control
Sample
Sample
Test
Condition
US Army Corps of
Engineers (1)
3, 6, 9, 12,
15
< 19 No 76.1 – 19 ± 5 E.G. 15 days No N/A
Mod Corps of
Engineers
(Davidson) (2)
No < 13.2 No 13.2 – 9.5 ± 5 E.G. 15 days No N/A
Gomes &
Rodrigues (4)
3, 6, 9, 12,
15, 18, 21
No No Unknown Unknow
n
E.G. 21 days No N/A
British AIV, (7) No < 2.36 Impact 14 - 10 ± 4 Water 24 hours 2 x Dry 2 x SSD
Mod British AIV,
Sampson (6)
No < 2.36 Impact 13.2 – 9.5 ± 4 E.G. 24 hours 2 x Dry 2 x SSD
Draft SANS 3001-
AG14 (13)
1, 5, 10, 20 No No 13.2 - 19 40 stone
pieces
E.G. 20 days No N/A
Draft SANS 3001-
AG15(14)
No < 2.36 Crushing
(10%
fines)
13.2 - 19 ± 10 E.G. 24 hours 2 x Dry 2 x SSD
Draft NZTA T20
(17)
No < 2.36 Crushing
(230kN
load)
13.2 - 19 ± 10.8 E.G. 21 days 2 x Dry 2 x SSD
E.G. = Ethylene Glycol, SSD = saturated surface dry 17 18
OBSERVED PAVEMENT FAILURES AND DISCUSSION OF THE ETHYLENE GLYCOL 19
ACCELERATED WEATHERING TEST RESULTS 20
Over the last decade, the New Zealand Transport Agency (NZTA) experienced early pavement failures on 21
various high profile projects, of which the most prominent pavement failures were specific to a local 22
aggregate quarry source, referred to as Poplar Lane (Table 2). The continuing nature and extent of the 23
failures is such that investigations are on-going. 24
Page 8
Van Blerk, Fletcher, Costello, Henning 8
In this case, the quarry supplied crushed Andesite rock compliant with the road agency’s specification for 1
high quality base course material. However, the NZTA specifications at the time did not include any 2
accelerated weathering (durability) tests specifically aimed at identifying clay minerals. These early 3
pavement failures brought a renewed focus, seeking an appropriate test method to prevent similar failures. 4
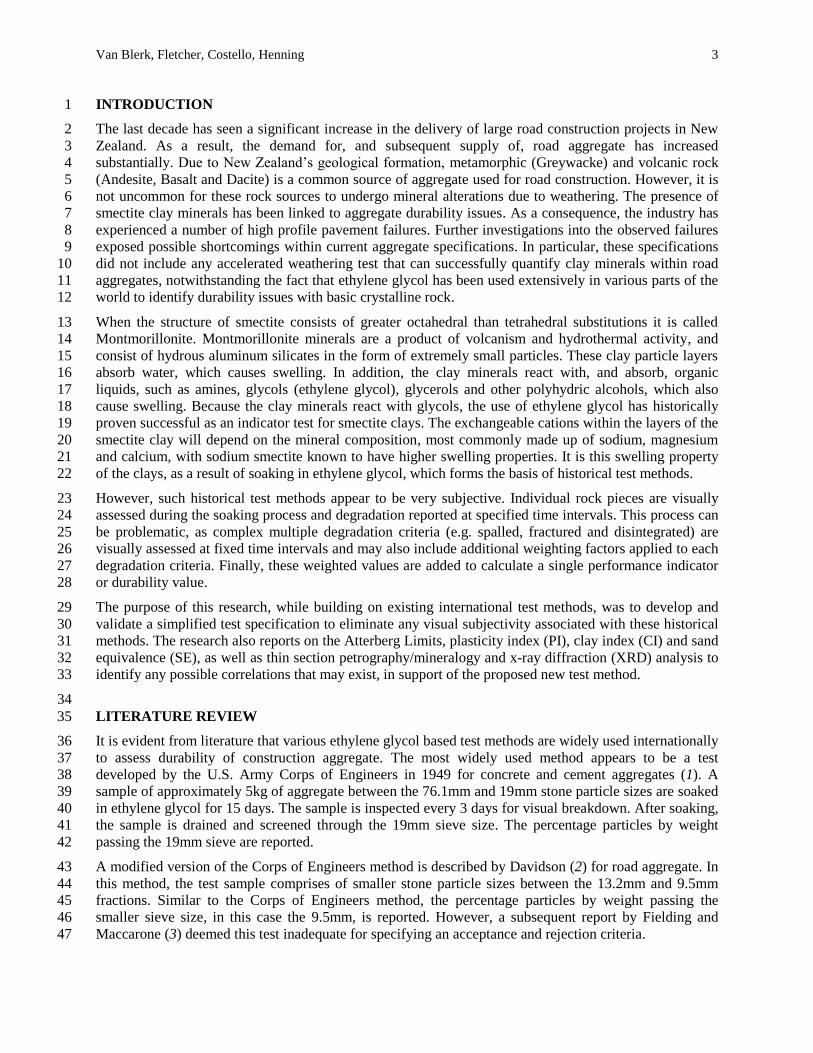
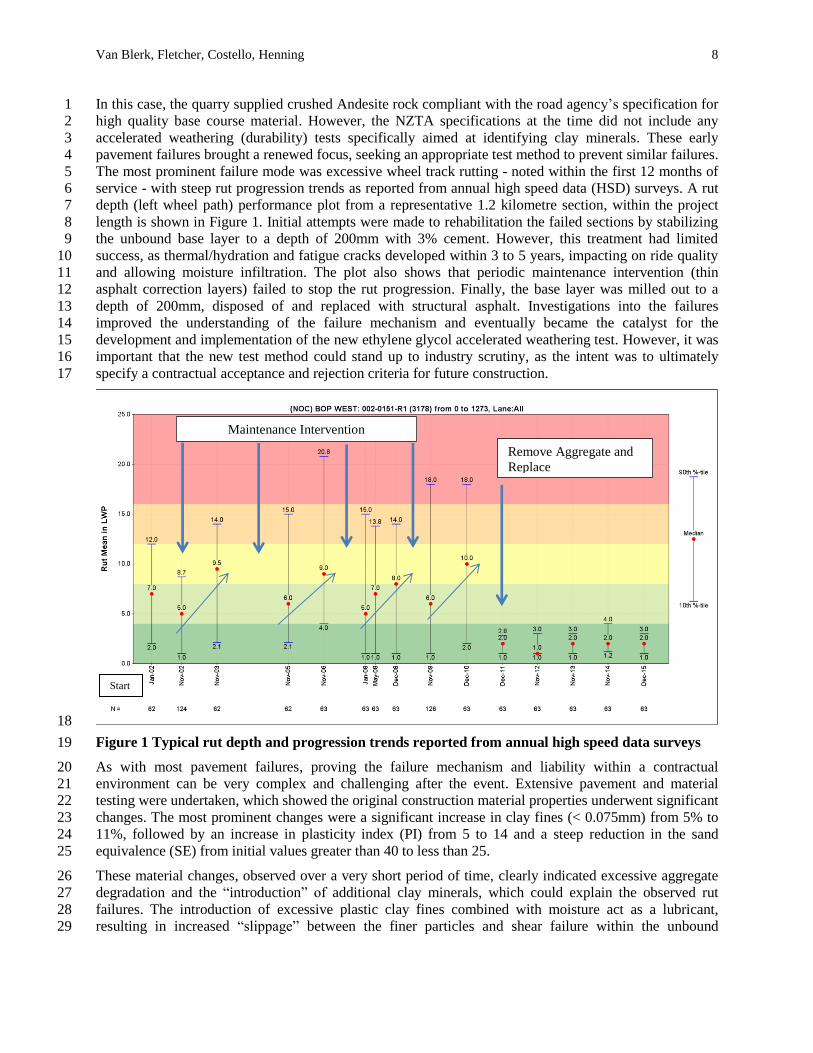
The most prominent failure mode was excessive wheel track rutting - noted within the first 12 months of 5
service - with steep rut progression trends as reported from annual high speed data (HSD) surveys. A rut 6
depth (left wheel path) performance plot from a representative 1.2 kilometre section, within the project 7
length is shown in Figure 1. Initial attempts were made to rehabilitation the failed sections by stabilizing 8
the unbound base layer to a depth of 200mm with 3% cement. However, this treatment had limited 9
success, as thermal/hydration and fatigue cracks developed within 3 to 5 years, impacting on ride quality 10
and allowing moisture infiltration. The plot also shows that periodic maintenance intervention (thin 11
asphalt correction layers) failed to stop the rut progression. Finally, the base layer was milled out to a 12
depth of 200mm, disposed of and replaced with structural asphalt. Investigations into the failures 13
improved the understanding of the failure mechanism and eventually became the catalyst for the 14
development and implementation of the new ethylene glycol accelerated weathering test. However, it was 15
important that the new test method could stand up to industry scrutiny, as the intent was to ultimately 16
specify a contractual acceptance and rejection criteria for future construction. 17
18
Figure 1 Typical rut depth and progression trends reported from annual high speed data surveys 19
As with most pavement failures, proving the failure mechanism and liability within a contractual 20
environment can be very complex and challenging after the event. Extensive pavement and material 21
testing were undertaken, which showed the original construction material properties underwent significant 22
changes. The most prominent changes were a significant increase in clay fines (< 0.075mm) from 5% to 23
11%, followed by an increase in plasticity index (PI) from 5 to 14 and a steep reduction in the sand 24
equivalence (SE) from initial values greater than 40 to less than 25. 25
These material changes, observed over a very short period of time, clearly indicated excessive aggregate 26
degradation and the “introduction” of additional clay minerals, which could explain the observed rut 27
failures. The introduction of excessive plastic clay fines combined with moisture act as a lubricant, 28
resulting in increased “slippage” between the finer particles and shear failure within the unbound 29
Remove Aggregate and
Replace
Maintenance Intervention
Start
Page 9
Van Blerk, Fletcher, Costello, Henning 9
aggregate layers. As a result, the matrix of finer particles will most likely be displaced and deform under 1
traffic induced loading; resulting in the observed wheel rut failures. 2
Unfortunately, the material changes were identified post failure following the investigations. This 3
exposed a major shortcoming at the time, as no advance durability tests were performed on the aggregate 4
prior to construction. The information obtained from the investigations gave a better understanding to the 5
failure mechanism. However, at the time of the investigations it was unclear why the aggregate degraded 6
within such a short period of time and, more importantly what the “trigger” was that initiating these early 7
failures. The significant increase in plastic clay fines led the investigation to test the rock for accelerated 8
weathering making use of ethylene glycol. The initial testing focused on various quarry sources within 9
close proximity of the failed project, in addition to the Poplar Lane aggregate under investigation (Table 10
2). 11
12
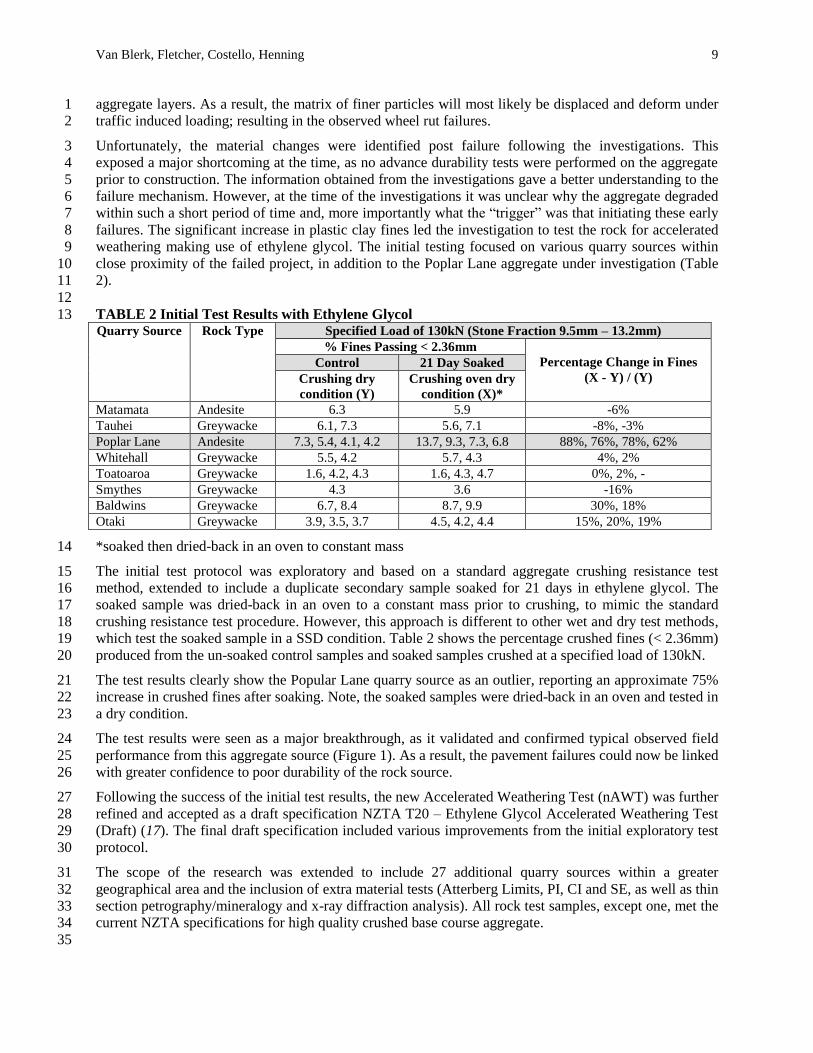
TABLE 2 Initial Test Results with Ethylene Glycol 13 Quarry Source Rock Type Specified Load of 130kN (Stone Fraction 9.5mm – 13.2mm)
% Fines Passing < 2.36mm
Percentage Change in Fines
(X - Y) / (Y) Control 21 Day Soaked
Crushing dry
condition (Y)
Crushing oven dry
condition (X)*
Matamata Andesite 6.3 5.9 -6%
Tauhei Greywacke 6.1, 7.3 5.6, 7.1 -8%, -3%
Poplar Lane Andesite 7.3, 5.4, 4.1, 4.2 13.7, 9.3, 7.3, 6.8 88%, 76%, 78%, 62%
Whitehall Greywacke 5.5, 4.2 5.7, 4.3 4%, 2%
Toatoaroa Greywacke 1.6, 4.2, 4.3 1.6, 4.3, 4.7 0%, 2%, -
Smythes Greywacke 4.3 3.6 -16%
Baldwins Greywacke 6.7, 8.4 8.7, 9.9 30%, 18%
Otaki Greywacke 3.9, 3.5, 3.7 4.5, 4.2, 4.4 15%, 20%, 19%
*soaked then dried-back in an oven to constant mass 14
The initial test protocol was exploratory and based on a standard aggregate crushing resistance test 15
method, extended to include a duplicate secondary sample soaked for 21 days in ethylene glycol. The 16
soaked sample was dried-back in an oven to a constant mass prior to crushing, to mimic the standard 17
crushing resistance test procedure. However, this approach is different to other wet and dry test methods, 18
which test the soaked sample in a SSD condition. Table 2 shows the percentage crushed fines (< 2.36mm) 19
produced from the un-soaked control samples and soaked samples crushed at a specified load of 130kN. 20
The test results clearly show the Popular Lane quarry source as an outlier, reporting an approximate 75% 21
increase in crushed fines after soaking. Note, the soaked samples were dried-back in an oven and tested in 22
a dry condition. 23
The test results were seen as a major breakthrough, as it validated and confirmed typical observed field 24
performance from this aggregate source (Figure 1). As a result, the pavement failures could now be linked 25
with greater confidence to poor durability of the rock source. 26
Following the success of the initial test results, the new Accelerated Weathering Test (nAWT) was further 27
refined and accepted as a draft specification NZTA T20 – Ethylene Glycol Accelerated Weathering Test 28
(Draft) (17). The final draft specification included various improvements from the initial exploratory test 29
protocol. 30
The scope of the research was extended to include 27 additional quarry sources within a greater 31
geographical area and the inclusion of extra material tests (Atterberg Limits, PI, CI and SE, as well as thin 32
section petrography/mineralogy and x-ray diffraction analysis). All rock test samples, except one, met the 33
current NZTA specifications for high quality crushed base course aggregate. 34
35
Page 10
Van Blerk, Fletcher, Costello, Henning 10
TABLE 3 Test Results from nAWT 1 Quarry
Source
Rock
Type
Specified Load of 230kN (Stone Fraction 9.5mm – 13.2mm) Presence
of smectite
clays
through
XRD
analysis
% Fines Passing < 2.36mm Percentage change
in averaged %
fines for duplicate
test samples
Control 21 Day Soaked
Crushing
dry
condition
(Y)
Crushing
oven dry
condition
(X)
Crushing
*SSD
condition
(Z)
# 1 # 2 # 1 # 2 # 1 # 2 (X-Y)/Y (Z-Y)/Y
Smythes Greywacke 8.6 - 9.6 - - - 12% - Minor
Tirohia Andesite 11.9 11.9 11.9 11.7 11.1 - -1% -7% None
Waitawheta Andesite 15.2 15 15.2 15.1 16.4 - 0% 9% Trace
Tauhara Dacite 16.8 16.5 19.1 19.2 16.1 - 15% -3% None
Matatoki Andesite 14.4 14.1 15.2 14.7 14.7 - 5% 3% Trace
Ngaruroro Greywacke 7.1 6.9 7.0 7.2 7.4 - 1% 6% Trace
309 Andesite 12.6 - 19.7 20.3 23.8 - 59% 89% Abundant
McBeths Andesite 9.7 9.6 9.8 10.1 9.7 - 3% 1% Trace
Hendersons Andesite 27 26.6 27.3 28.3 27.1 - 4% 1% None
Tuckers Greywacke 5.9 - 7.7 - 7.7 - 31% 31% Abundant
Osterns Greywacke 8.9 9.3 9.8 10.5 10.2 - 12% 12% Minor
Pukekawa Basalt 11.9 12.1 11.3 12.3 11.3 - -2% -6% None
Flat Top Basalt/
Andesite
13.8 13.8 18.2 - 21.4 - 32% 55% Abundant
Bombay Basalt 10.2 10.6 9.0 9.3 9.1 - -12% -13% None
Drury Greywacke 3.5 - 2.6 3.3 2.9 - -16% -17% None
Otaika Greywacke 7.8 6.7 7.8 7.6 8.7 - 6% 20% Minor
Matawai Greywacke
/Mudstone
11.3 11.2 25.7 26.3 34.5 - 131% 207% Abundant
Waerengakuri Limestone 20.0 20.4 23.7 22.1 24.7 - 13% 22% None
Jones Basalt 20.6 20.4 22.2 22.4 22.4 - 9% 9% None
Vickers Andesite 22.1 22.2 24.5 24.8 24.6 - 11% 11% None
Poplar Lane Andesite 9.5 9.8 - - 14.2 14.7 - 50% Abundant
Kakariki Greywacke 4.7 4.2 - - 5.4 5.8 - 25% Not Tested
Matamata Andesite 11.1 10.2 - - 11.1 10.9 - 3% None
Wiremu Andesite 22.4 21.3 - - 21.5 22.5 - 1% Not Tested
Ferndene Andesite 22.4 22.2 - - 23.9 23.8 - 7% Not Tested
Brynderwyn Greywacke 8.7 8.7 - - 9.7 10.1 - 14% Not Tested
Tauhara Dacite 19.1 19.2 - - 18.5 19.1 - -2% None
Millbrook Greywacke 8.0 8.2 - - 8.9 8.8 - 9% Not Tested
*SSD Saturated Surface Dry 2 3
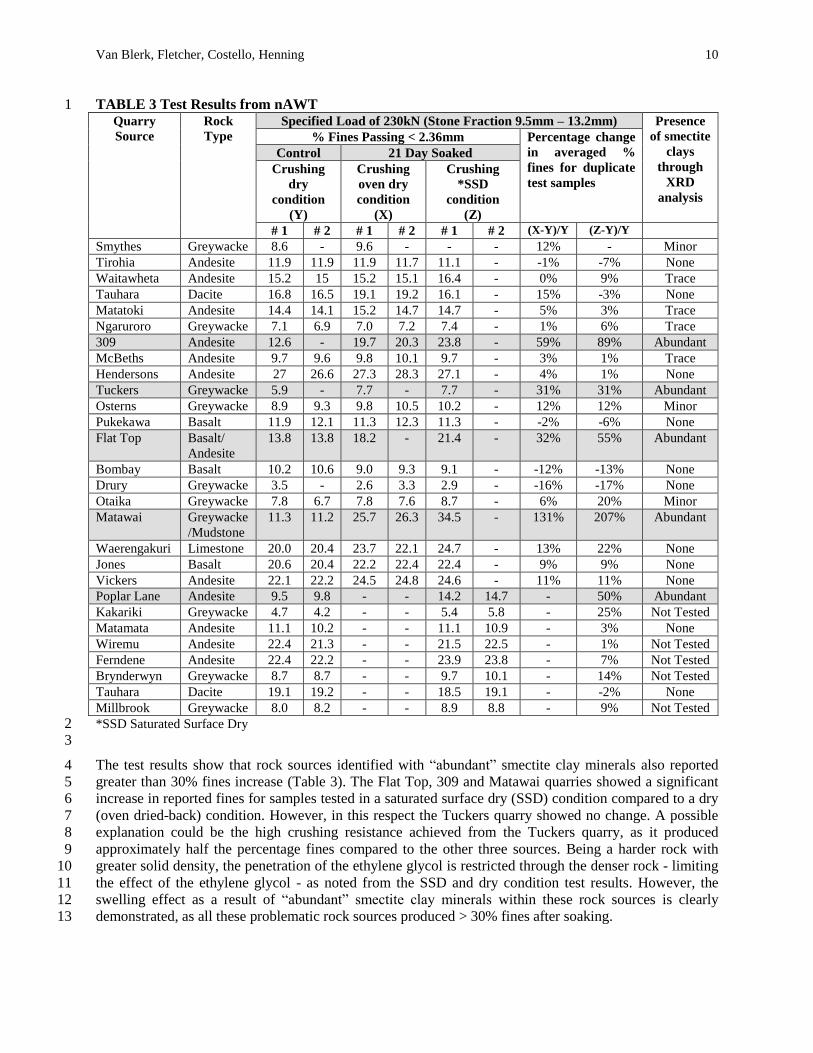
The test results show that rock sources identified with “abundant” smectite clay minerals also reported 4
greater than 30% fines increase (Table 3). The Flat Top, 309 and Matawai quarries showed a significant 5
increase in reported fines for samples tested in a saturated surface dry (SSD) condition compared to a dry 6
(oven dried-back) condition. However, in this respect the Tuckers quarry showed no change. A possible 7
explanation could be the high crushing resistance achieved from the Tuckers quarry, as it produced 8
approximately half the percentage fines compared to the other three sources. Being a harder rock with 9
greater solid density, the penetration of the ethylene glycol is restricted through the denser rock - limiting 10
the effect of the ethylene glycol - as noted from the SSD and dry condition test results. However, the 11
swelling effect as a result of “abundant” smectite clay minerals within these rock sources is clearly 12
demonstrated, as all these problematic rock sources produced > 30% fines after soaking. 13
Page 11
Van Blerk, Fletcher, Costello, Henning 11
The research acknowledges the limited number of quarry sources tested. However, the data seems to 1
indicate that an appropriate upper limit for contractual acceptance and rejection could be set at a value of 2
> 30% fines increase after soaking and tested in a SSD condition. In support of this, the proposed upper 3
limit of 30% increase in fines closely follows international experience with similar wet and dry aggregate 4
durability test methods. The British AIV (wet/dry test) states that if an AIV greater than 30% fines is 5
reported then the aggregate should be treated with caution. Paige-Green (16) recommends an upper limit 6
of 20% increase in fines after 4 days soaking in ethylene glycol for an aggregate crushing test at a 7
specified load of 400kN. However, the Australian wet/dry strength test (19) targets a load to produce 10% 8
fines, similar to the South African test method SANS 3001 - AG 15. South African research refer to a 9
wet/dry load (kN) ratio > 75% to produce 10% fines, as a compliance acceptance limit (16). Similarly, 10
Australian research specify wet/dry load (kN) ratio > 65% for coarse asphalt aggregate (20). Note, both 11
these methods specify a wet/dry load (kN) ratio. In contrast the nAWT method specifies a wet/dry 12
percentage change in fines at a fixed load of 230kN, which makes a direct comparison of compliance 13
acceptance limits difficult for the two differing approaches. 14
The credibility and usefulness of the test method will be determined by the ability to verify the test 15
findings through actual field performance. In support of the research, all five quarry sources - producing > 16
30% increase fines - have a known history of poor field performance. This gave confidence in the test 17
method’s ability to predict poor aggregate durability. In addition, the test method shows good 18
repeatability is possible for duplicate test samples as shown in Table 3. The test method is also sensitive 19
enough to indicate changes in the aggregate production quality over a prolonged period of time. 20
Therefore, the rock quality and quarry production consistency will influence the ability of the test method 21
to report the same “percentage change in fines” over an extended test period. This was particularly 22
evident within problematic and lower quality rock sources. As an example, referring to Table 2, aggregate 23
from the Poplar Lane quarry were tested over an extended quarry production period of 2 years and four 24
discrete test samples tested during this time reported a variation in percentage fines increase ranging from 25
62% to 88%. 26
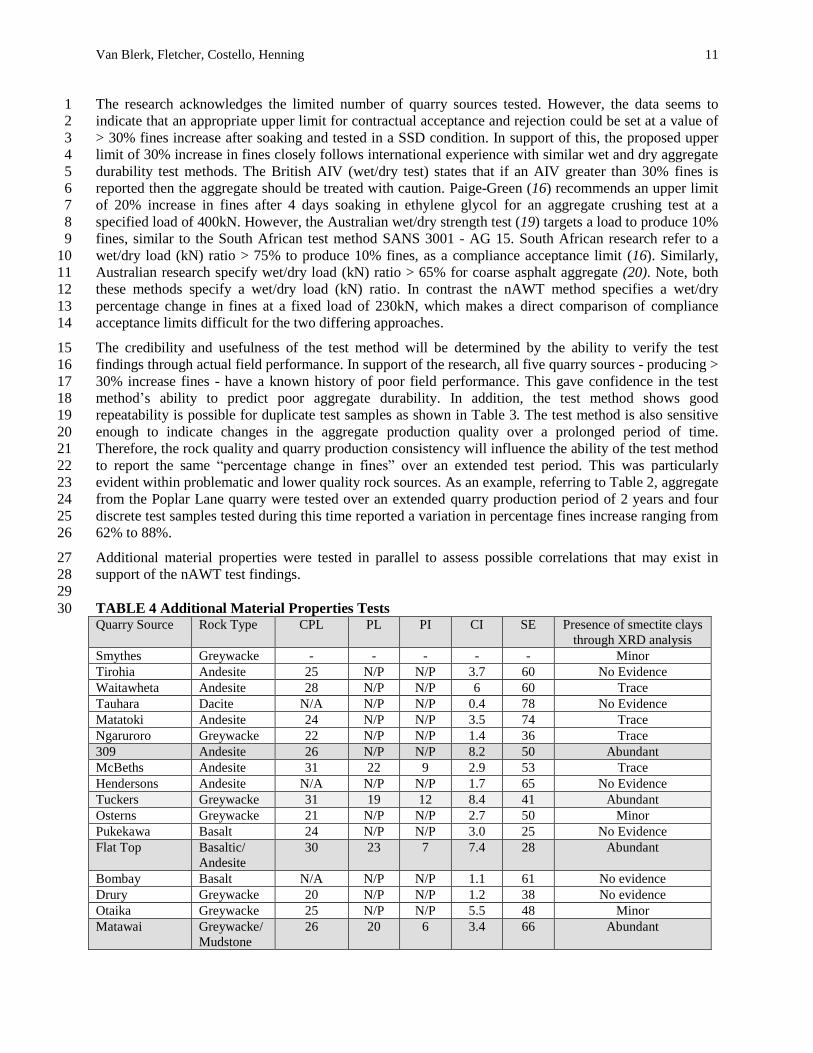
Additional material properties were tested in parallel to assess possible correlations that may exist in 27
support of the nAWT test findings. 28
29
TABLE 4 Additional Material Properties Tests 30 Quarry Source Rock Type CPL PL PI CI SE Presence of smectite clays
through XRD analysis
Smythes Greywacke - - - - - Minor
Tirohia Andesite 25 N/P N/P 3.7 60 No Evidence
Waitawheta Andesite 28 N/P N/P 6 60 Trace
Tauhara Dacite N/A N/P N/P 0.4 78 No Evidence
Matatoki Andesite 24 N/P N/P 3.5 74 Trace
Ngaruroro Greywacke 22 N/P N/P 1.4 36 Trace
309 Andesite 26 N/P N/P 8.2 50 Abundant
McBeths Andesite 31 22 9 2.9 53 Trace
Hendersons Andesite N/A N/P N/P 1.7 65 No Evidence
Tuckers Greywacke 31 19 12 8.4 41 Abundant
Osterns Greywacke 21 N/P N/P 2.7 50 Minor
Pukekawa Basalt 24 N/P N/P 3.0 25 No Evidence
Flat Top Basaltic/
Andesite
30 23 7 7.4 28 Abundant
Bombay Basalt N/A N/P N/P 1.1 61 No evidence
Drury Greywacke 20 N/P N/P 1.2 38 No evidence
Otaika Greywacke 25 N/P N/P 5.5 48 Minor
Matawai Greywacke/
Mudstone
26 20 6 3.4 66 Abundant
Page 12
Van Blerk, Fletcher, Costello, Henning 12
Waerengakuri Limestone 25 N/P N/P 5.7 31 No Evidence
Jones Basalt 23 N/P N/P 0.7 74 No Evidence
Vickers Andesite 25 N/P N/P 0.7 73 No Evidence
Poplar Lane Andesite 27 20 7 6 50 Abundant
Kakariki Greywacke 22 N/P N/P 3.4 49 Not Tested
Matamata Andesite 25 N/P N/P 3.4 57 No Evidence
Wiremu Andesite 24 N/P N/P 1.8 49 Not Tested
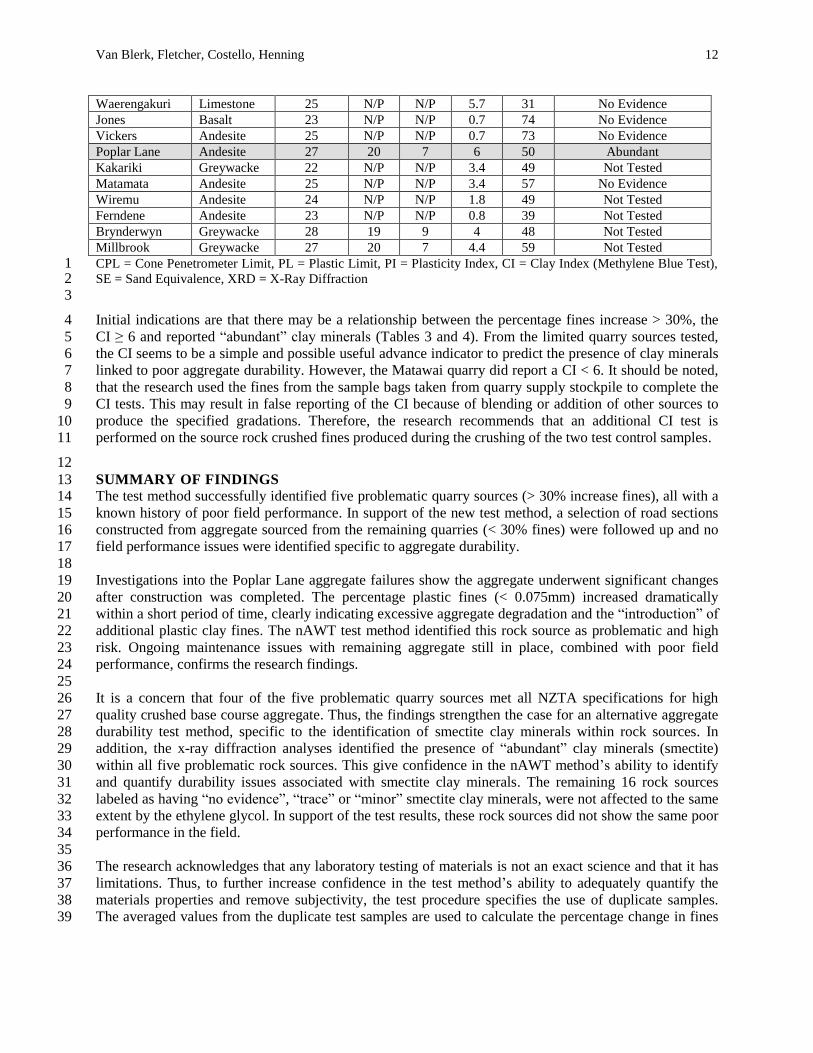
Ferndene Andesite 23 N/P N/P 0.8 39 Not Tested Brynderwyn Greywacke 28 19 9 4 48 Not Tested Millbrook Greywacke 27 20 7 4.4 59 Not Tested CPL = Cone Penetrometer Limit, PL = Plastic Limit, PI = Plasticity Index, CI = Clay Index (Methylene Blue Test), 1 SE = Sand Equivalence, XRD = X-Ray Diffraction 2 3
Initial indications are that there may be a relationship between the percentage fines increase > 30%, the 4
CI ≥ 6 and reported “abundant” clay minerals (Tables 3 and 4). From the limited quarry sources tested, 5
the CI seems to be a simple and possible useful advance indicator to predict the presence of clay minerals 6
linked to poor aggregate durability. However, the Matawai quarry did report a CI < 6. It should be noted, 7
that the research used the fines from the sample bags taken from quarry supply stockpile to complete the 8
CI tests. This may result in false reporting of the CI because of blending or addition of other sources to 9
produce the specified gradations. Therefore, the research recommends that an additional CI test is 10
performed on the source rock crushed fines produced during the crushing of the two test control samples. 11
12
SUMMARY OF FINDINGS 13 The test method successfully identified five problematic quarry sources (> 30% increase fines), all with a 14
known history of poor field performance. In support of the new test method, a selection of road sections 15
constructed from aggregate sourced from the remaining quarries (< 30% fines) were followed up and no 16
field performance issues were identified specific to aggregate durability. 17
18
Investigations into the Poplar Lane aggregate failures show the aggregate underwent significant changes 19
after construction was completed. The percentage plastic fines (< 0.075mm) increased dramatically 20
within a short period of time, clearly indicating excessive aggregate degradation and the “introduction” of 21
additional plastic clay fines. The nAWT test method identified this rock source as problematic and high 22
risk. Ongoing maintenance issues with remaining aggregate still in place, combined with poor field 23
performance, confirms the research findings. 24
25
It is a concern that four of the five problematic quarry sources met all NZTA specifications for high 26
quality crushed base course aggregate. Thus, the findings strengthen the case for an alternative aggregate 27
durability test method, specific to the identification of smectite clay minerals within rock sources. In 28
addition, the x-ray diffraction analyses identified the presence of “abundant” clay minerals (smectite) 29
within all five problematic rock sources. This give confidence in the nAWT method’s ability to identify 30
and quantify durability issues associated with smectite clay minerals. The remaining 16 rock sources 31
labeled as having “no evidence”, “trace” or “minor” smectite clay minerals, were not affected to the same 32
extent by the ethylene glycol. In support of the test results, these rock sources did not show the same poor 33
performance in the field. 34
35
The research acknowledges that any laboratory testing of materials is not an exact science and that it has 36
limitations. Thus, to further increase confidence in the test method’s ability to adequately quantify the 37
materials properties and remove subjectivity, the test procedure specifies the use of duplicate samples. 38
The averaged values from the duplicate test samples are used to calculate the percentage change in fines 39
Page 13
Van Blerk, Fletcher, Costello, Henning 13
used to calculate the durability indicator. In support of this approach, the duplicate samples show good 1
repeatability is possible. 2
3
The research was unable to show any strong correlation between the nAWT results and the CPL, PL, PI 4
and SE material properties. However, to improve the usefulness of the PI as a supporting indicator for 5
durability, the research recommends that the PI is tested on the 0.075mm and 0.432mm fractions of the 6
parent rock. The CI (methylene blue test) on the other hand shows more promise as an advance indicator 7
to predict aggregate durability issues. 8
9
10
CONCLUSION 11
The research conducted on typical metamorphic and volcanic crushed rock proved successful in 12
quantifying the degradation associated with smectite clays within road aggregates. As a result, a new 13
aggregate durability test specification also using ethylene glycol was developed and implemented. The 14
success of the nAWT is based on the ability to eliminate the subjective visual assessment described in 15
most historical ethylene glycol based test methods. It is the view of the NZTA that the test method can 16
adequately quantify results to enable its inclusion in contractual specifications as an acceptance and 17
rejection criteria. To ensure industry acceptance of the new test method, the NZTA completed 18
consultation with the Aggregate Quarry Association, the Civil Contracting Industry and the Civil 19
Engineering Testing Association. Following consultation, the draft test method has been accepted and 20
will be published on the NZTA website in due course. However, at the time the quarry and road 21
construction industries were unable to agree on a pass/fail limit for the specification. Thus, initial 22
thoughts are that this may be best addressed on a regional level based on local resource availability, rock 23
quality and historical field performance. 24
In conclusion, the results from the research are perceived by the NZTA as adequate to proceed with the 25
specification of the nAWT for multiple large road agency projects, with the hope of preventing similar 26
pavement failures. 27
28
Page 14
Van Blerk, Fletcher, Costello, Henning 14
REFERENCES 1
2 1. Corps of Engineers. Method for testing stone for expansive break down on soaking in 3
ethylene glycol. Method CRD-C 148-69. Hand book of concrete and cement. U.S. Army 4
Waterways Experimental Station, Vicksburg, MS, 1969. 5
2. Davidson, W.H. The influence of constitution on the engineering properties of crushed 6
volcanic breccia, Proc. Aust. Road Res. Board Conf. 6(5), 71-90, 1972. 7
3. Fielding, B.J. and S. Maccarrone. Accelerated soundness test for altered basalts, Proc. 8
Aust. Road Res. Board Conf. 11(3), 129-144, 1989. 9
4. Gomes, R.L. and J.E. Rodriques. Physical characterization and weathering of basaltic 10
rocks of Parana Basin, Brazil IAEG2006 Paper # 559, 2006. 11
5. Leyland C. R., P. Paige-Green, M. Momayez. Development of the Road Aggregate Test 12
Specifications for the Modified Ethylene Glycol Durability Index for Basic Crystalline 13
Materials, Method CRD-C 148-69. Hand book of concrete and cement. U.S. Army 14
Waterways Experimental Station, Vicksburg, MS, 1969. 15
6. Sampson, L.R. The aggregate impact value test: Proposal for use in Southern Africa, 16
Confidential Rep. DPVT-C80.1, CSIR Division of Roads and Transport Technology, 17
Pretoria, South Africa, 1989. 18
7. British Standards (1990c) “Testing aggregates. Methods for determination of aggregate 19
impact value (AIV)”. BS 812-112, London, 1990. 20
8. Paige-Green, P. A revised ethylene glycol test for assessing the durability of basic 21
crystalline materials for road aggregate, 33rd
Int. Geological Conf., The International 22
Union of Geological Sciences (IUGS), 2008. 23
9. Van Rooy, J.L. and N. Nixon. Mineralogical alteration and durability of Drakensberg 24
basalts, South African Journal of Geology, 93(5/6), 729-737, 1990. 25
10. Van Rooy, J.L. and A.Van Schalkwyk. The geology of the Lesotho Highlands Water 26
Project with special reference to the durability of construction materials, Journal of 27
African Earth Science, 16(1/2), 181-192, 1993. 28
11. Bell, FG and C.A. Jermy. The geotechnical character of some South African dolerites, 29
especially their strength and durability, Q.J. Eng. Geol. Hydrogeol., 33, 59-76, 2000. 30
12. ASTM (2007) “Standard specifications for ethylene glycol”. D 2693, West 31
Conshohocken, PA. 32
13. South African National Standard. Civil Engineering Test Method “Part AG14: 33
Determination of the ethylene glycol durability index for rock”. SANS 3001-AG14:2013, 34
Pretoria, South Africa, 2013. 35
14. South African National Standard. Civil Engineering Test Method “Part AG15: 36
Determination of rock durability using 10% FACT (fines aggregate crushing test) value 37
after soaking in ethylene glycol”. SANS 3001-AG15:2012, Pretoria, South Africa, 2012. 38
15. South African National Roads Agency. South African Pavement Engineering Manual, 39
“Chapter 3 Materials Testing”. South Africa, January 2013. 40
16. Paige-Green, P. Durability testing of basic crystalline rocks and specification for use as 41
road base aggregate. Bulletin of Engineering Geology and the Environment, Vol. 66(4), 42
pp. 431, 2007. 43
17. New Zealand Transport Agency. “NZTA T20 – Accelerated Weathering Test Method 44
(Draft)”, New Zealand, 2016. 45
18. New Zealand Standards (2015) “The crushing resistance of coarse aggregate under a 46
specified load – Test Method 3.10”. NZS 4407:2015, New Zealand, 2015. 47
19. Australian Standard, “Method for sampling and testing aggregates Method 22: Wet/dry 48
strength variation”. AS 1141.22 – 2008. 49
20. Australian Standard, “Aggregate and rock for engineering purposes Part 5: Coarse 50
asphalt aggregates”. AS 2758.5 – 2009. 51