Page 1
Ethylene Production by Oxidative
Coupling of Methane: New Process
Flow Diagram Based on Adsorptive
Separation
vorgelegt von
M.Sc.
Xuan Son Nghiem
aus Hanoi, S. R. Vietnam
von der Fakultät III – Prozesswissenschaften
der Technischen Universität Berlin
zur Erlangung des akademischen Grades
Doktor der Ingenieurwissenschaften
- Dr.-Ing -
genehmigte Dissertation
Promotionsausschuss:
Vorsitzender: Prof. Dr.-Ing. habil. George Tsatsaronis
Gutachter: Prof. Dr.-Ing. habil. Günter Wozny
Gutachter: Prof. Dr.-Ing. habil. Jens-Uwe Repke
Tag der wissenschaftlichen Aussprache: 14. 03. 2014
Berlin 2014
D 83
Page 3
Abstract
Ethylene is the most produced petrochemical with about 140 million tonnes
annual production and nearly 300 million tonnes annual carbon dioxide
emission. In recent years, record price of crude oil – the origin of more than 50%
ethylene worldwide – has put naphtha-based producers in a very tough position,
especially the ones in region with strict emission regulation such as Europe.
Meanwhile 150 billion cubic meters of methane are flared or vented every year
due to transport and store difficulty, emitting about 400 million tonnes of carbon
dioxide. In this situation, oxidative coupling of methane (OCM), the reaction
directly converts methane into ethylene, seems to be a sustainable solution for
both short-term oil price and long-term environment preservation.
Unfortunately, OCM process in present state of the art is still considered
inadequate for industrial application. Most researches in this topic have been
focusing on improving the performance of OCM reactor, which is only a part
(though important) of a plant. This work aims at a comprehensive development
of the whole process which, in combination with available OCM reactors, can
make this technology a decent choice for commercial ethylene production.
The diversity of ethylene plants (naphtha cracking, ethane cracking, coal-to-
olefin…) means there is no universally superior option. Finding an application for
OCM requires comparing it with other technologies, pointing out the condition
under which OCM can bring relative improvement. Since OCM is not a mature
technology yet, it is only mentioned briefly in reviews of ethylene production
alternatives while researches on OCM tend to focus on this process alone rather
than comparison with others. Hence, the first chapter of this thesis reviews
different means of ethylene production and methane conversion. The gap
Page 4
between their limitations is the place where OCM can be employed for a better
use of natural resource.
Despite the abundant supply of methane, OCM is still not selected because
ethylene produced by this technology is more expensive than by other
alternatives. In the second chapter, production cost of ethylene by OCM is
estimated as a function of ethylene yield and selectivity as well as prices of raw
material and utilities required for plant operation. The estimated production cost
can be compare with the production cost by other technologies to decide if OCM
should be considered for a new ethylene plant or not. The attained function can
be used to analyse the sensitivity of production cost against reactor
performance, raw material and energy prices. Cost estimation also revealed
cryogenic distillation as the bottle-neck in process flow diagram. Different
substitutes are reviewed and a new process flow diagram based on adsorptive
separation is synthesised conceptually. Also proposed in this chapter are
solutions for by products and unreacted methane. The amount of these
substances is significant due to low conversion and selectivity of OCM reactor.
In the next chapter, the proposal is analysed quantitatively by simulation. Two
representative sorbents are tested: zeolite and activated carbon. Simulation
result provides information for sorbent selection, process operation and final
decision on process flow diagram.
The proposal is finally validated by experiment. Calculation based on scaling up
experiment result proves that when combines with state of the art OCM reactors
the proposal can be competitive enough to replace naphtha cracking in region
with low-priced natural gas supply such as North America.
Page 5
Zusammenfassung
Äthylen ist die am meisten produzierte Petrochemie mit ungefähr 140 Millionen
Tonnen Jahresproduktion und fast 300 Millionen Tonnen jährlich Kohlendioxid-
Emissionen. In den letzten Jahren hat der Rekordpreis von Rohöl – die Herkunft
von mehr als 50 % Äthen weltweit ist Naphtha basierend – die Hersteller wie
zum Beispiel die in Europa in eine sehr schwierigen Lage gesetzt. Inzwischen
werden jedes Jahr 150 Milliarden Kubikmeter Methan wegen
Transportschwierigkeiten abgefackelt oder abgelassen und etwa 400 Millionen
Tonnen Kohlendioxid emittieren. In dieser Situation scheint Oxydative Kupplung
von Methan (OCM), die Reaktion die Methan in Äthylen direkt umwandelt, eine
nachhaltige Lösung des kurzfristigen hohen Ölpreises und der langfristige
Erhaltung der Umwelt zu sein.
Leider ist der OCM Prozess im derzeitigen Stand der Technik noch unzureichend
für die industrielle Anwendung. Die meisten Untersuchungen zu diesem Thema
haben sich auf die Verbesserung des OCM Reaktors, der zwar ein wichtiger aber
nicht alleinbestimmender Teil der Anlage ist, konzentriert. Diese Arbeit zielt auf
eine umfassende Entwicklung des ganzen Prozesses, die zusammen mit
verfügbaren OCM Reaktoren eine gute Wahl für die kommerzielle
Äthylenherstellung sein kann.
Die Vielfalt der Äthylen-Anlagen (Naphtha-Cracken, Ethan-Cracken, Kohle-zu-
Olefin...) bedeutet, dass es keine allgemeine überlegene Option gibt. Die Suche
nach einem Übergang auf OCM zur Äthylenherstellung erfordert einen Vergleich
mit anderen Technologien und den Hinweis auf die Bedingung, unter der OCM
eine bessere Lösung erzielen kann. OCM wird derzeitig nur kurz in Bewertungen
von modernen Äthylen Produktionsalternativen erwähnt, weil es noch keine
ausgereifte Technologie ist. Forschungen zu OCM neigen dazu, sich auf diesen
Prozess allein aber nicht im Vergleich zu Alternativen zu konzentrieren. Daher
bewerten die ersten Kapitel in der vorgelegten Arbeit verschiedene Varianten zur
Page 6
Äthylenherstellung und Methanumwandlung. OCM kann die bestehenden
Technologien ergänzen, um in Zukunft zur besseren Nutzung der natürlichen
Ressourcen beizutragen.
Trotz großer Vorkommen und Reserven von Methan ist OCM noch nicht
kommerzialisiert worden, weil die Äthylenherstellung durch diese Technologie
teurer als durch andere Alternativen ist. Im zweiten Kapitel werden die
Produktionskosten von Äthylen durch OCM als Funktion von Äthylen Ausbeute
und Selektivität sowie Rohstoffpreise und Betriebsmedienpreise geschätzt. Die
geschätzten Produktionskosten können mit den aktuellen Produktionskosten
verglichen werden, um zu entscheiden, ob OCM für eine neue Äthylen-Anlage
berücksichtigt werden sollte. Die entwickelt Kostenfunktionen können
verwendet werden, um die Empfindlichkeit der Produktionskosten gegen
Reaktorleistung, Rohstoff- und Energiepreise zu analysieren. Die
Kostenschätzung ergab auch, dass die kryogene Destillation der
Hauptkostentreiber ist. Verschiedene Alternativen für die Kryotechnik werden
berücksichtigt und ein neues Verfahrensfließbild mit adsorptiver Trennung
wurde konzeptioniert und anschließend analysiert. In diesem Kapitel werden
auch Lösungen für die Verwendung der Nebenprodukte und des nicht
umgewandelten Methans vorgeschlagen. Die Menge dieser Stoffe ist bedeutsam
aufgrund des niedrigen Umsatzes und Selektivität des OCM Reaktors.
In dem nächsten Kapitel wird der entwickelte Lösungsvorschlag durch Simulation
quantitativ detailliert analysiert. Zwei repräsentative Adsorptionsmittel wurden
getestet: Zeolith und Aktivkohle. Simulationsergebnisse liefern detaillierte
Informationen für die Adsorptionsmittelauswahl, den Prozessbetrieb und führen
zu einer Entwicklung eines neuen Verfahrensfließbildes.
Der Prozessvorschlag wurde schließlich durch Experimente bestätigt. Das
Versuchsergebnis beweist, dass der Vorschlag zusammen mit neuen OCM
Reaktoren das Naphtha-Cracken in der Region mit preisgünstiger
Erdgasversorgung wirtschaftlich ersetzen kann.
Page 7
Acknowledgement
I would like to express the deepest gratitude to my supervisor, Prof. Günter
Wozny for his continual support and guidance throughout this work.
I am especially indebted to Prof. Tran Trung Kien and Prof. Harvey Arellano-
Garcia for introducing me to the group of Prof. Wozny and my research topic.
I am deeply grateful to my dear friends Daniel, Duc, Hamid, Setareh, Shankui,
Stanislav and Xiaodan for their encouragement in hard times and the excellent
working atmosphere during my study in Berlin.
I also want to thank all other members of DBTA without whom I could not
complete this thesis, especially Dietmar, Max, Philipp and Steffen for the great
experimental setup.
The financial assistance from Deutscher Akademischer Austauschdienst is
sincerely appreciated.
Page 9
i
Contents
List of Figures .......................................................................................................... iii
List of Tables ........................................................................................................... v
Nomenclature ........................................................................................................ vii
Chapter 1. Introduction ....................................................................................... 1
Chapter 2. OCM: Challenges and solutions ......................................................... 7
2.1. Cost estimation ......................................................................................... 7
2.2. Alternatives Overview ............................................................................. 22
2.3. Conceptual development ........................................................................ 26
2.4. Process flow development ...................................................................... 30
2.4.1. Adsorption ....................................................................................... 30
2.4.2. Carbon dioxide removal ................................................................... 31
2.4.3. Unconverted methane utilisation .................................................... 32
2.4.4. Process flow diagram ....................................................................... 33
Chapter 3. Simulation of adsorption process .................................................... 35
3.1. Modelling ................................................................................................ 36
3.1.1. Dimension ........................................................................................ 36
3.1.2. Material balance .............................................................................. 37
3.1.3. Heat balance .................................................................................... 38
3.1.4. Fluid dynamic ................................................................................... 39
3.1.5. Mass transfer rate ............................................................................ 40
3.1.6. Sorption equilibrium ........................................................................ 41
3.1.7. Operation ......................................................................................... 43
3.2. Simulation ............................................................................................... 44
3.2.1. Numerical solution ........................................................................... 44
3.2.2. Components ..................................................................................... 46
Page 10
ii
3.2.3. Adsorption characteristics of zeolite 4A .......................................... 47
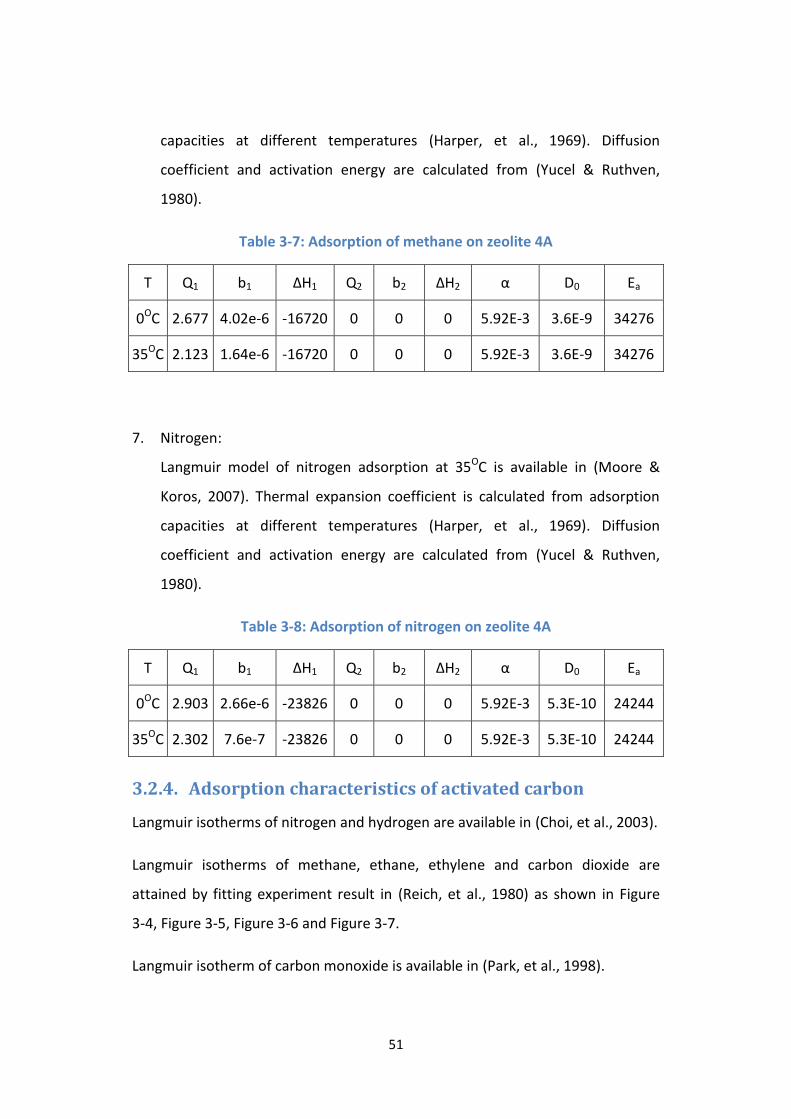
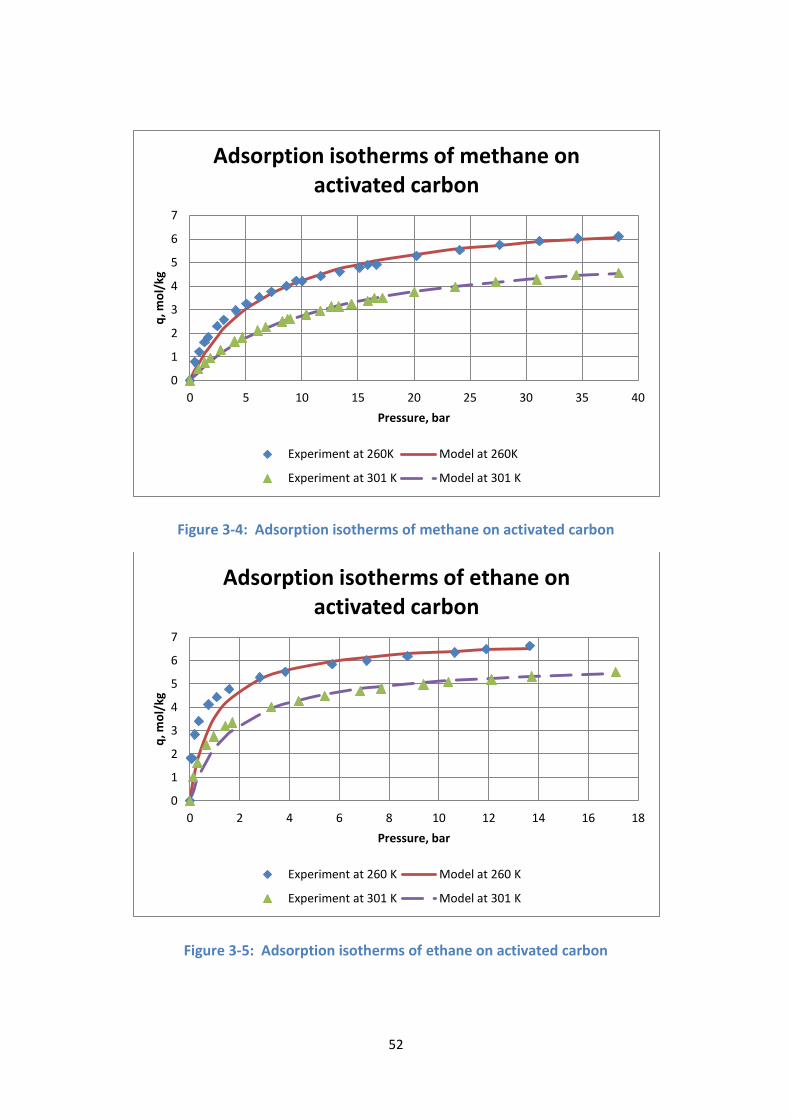
3.2.4. Adsorption characteristics of activated carbon ............................... 51
3.3. Numerical diffusion ................................................................................. 54
3.4. Simulation result with zeolite 4A ............................................................ 56
3.4.1. Breakthrough ................................................................................... 56
3.4.2. Separation ........................................................................................ 58
3.4.3. Discussion ........................................................................................ 70
3.5. Simulation result with activated carbon ................................................. 73
3.5.1. Separation ........................................................................................ 73
3.5.2. Discussion ........................................................................................ 76
Chapter 4. Experimental study .......................................................................... 78
4.1. Experiment setup .................................................................................... 78
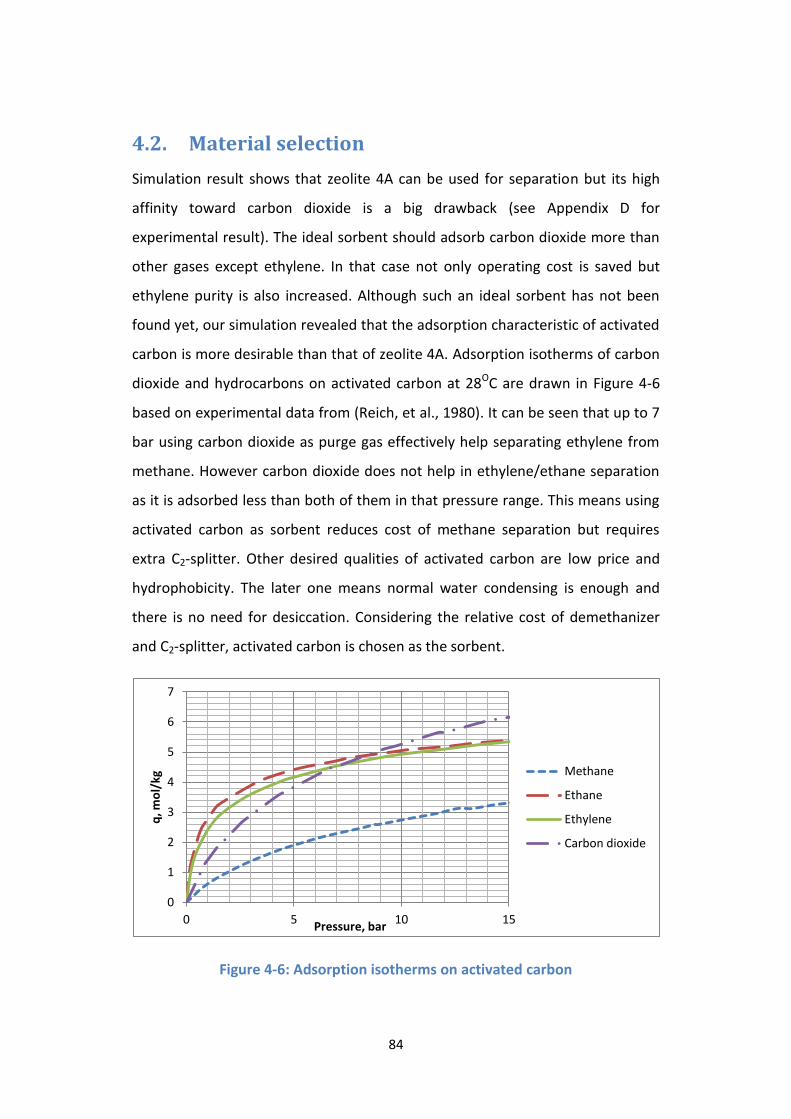
4.2. Material selection ................................................................................... 84
4.3. Calibration ............................................................................................... 85
4.4. Separation ............................................................................................... 87
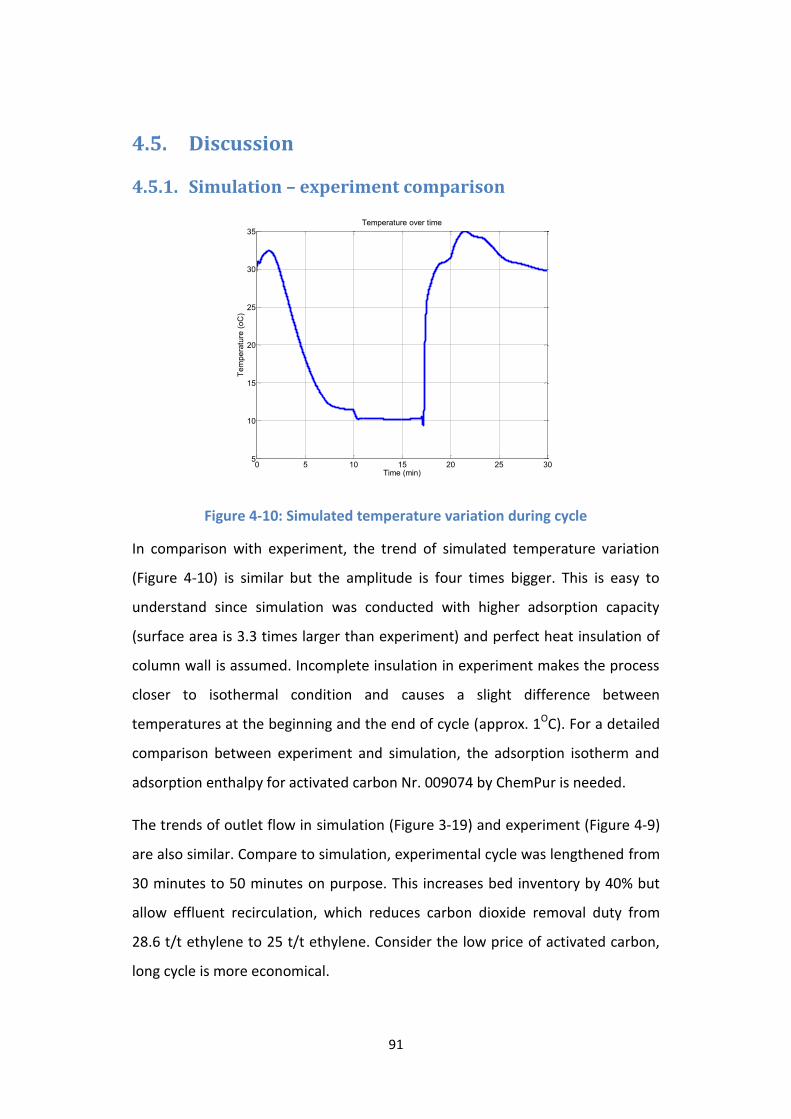
4.5. Discussion ................................................................................................ 91
4.5.1. Simulation – experiment comparison.............................................. 91
4.5.2. Economic evaluation ........................................................................ 92
Chapter 5. Conclusions and outlook .................................................................. 98
Appendix A. Material calculation ....................................................................... 103
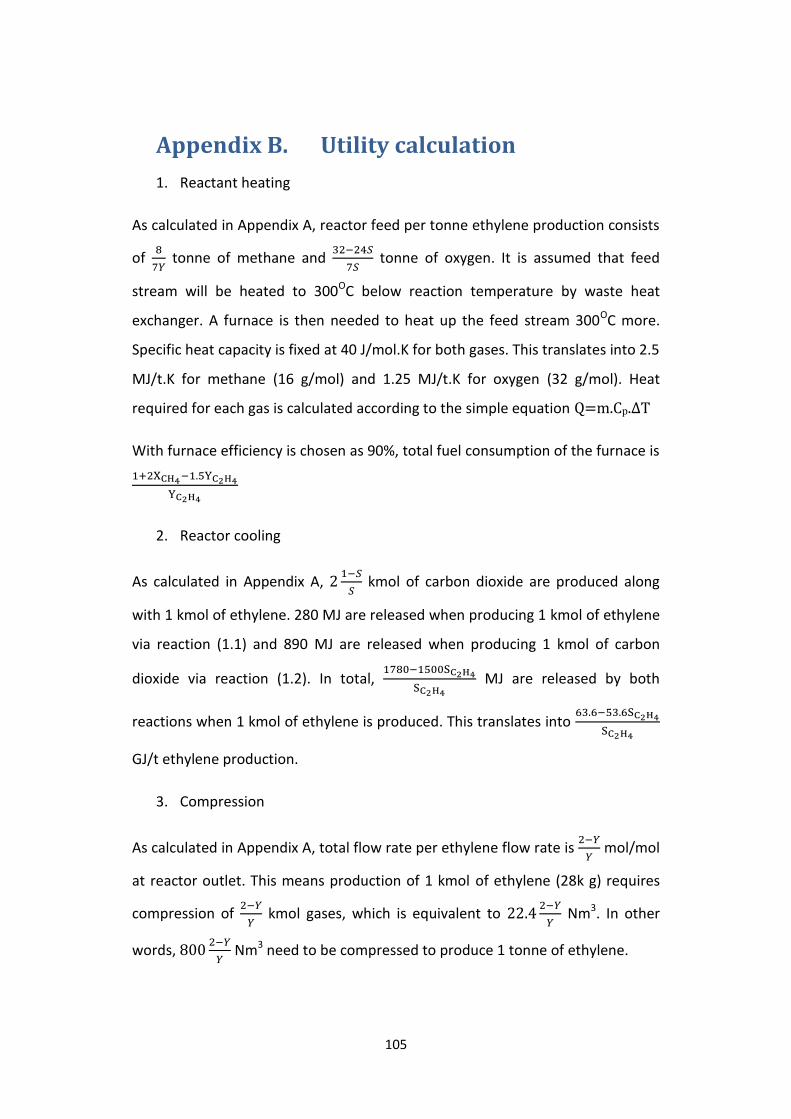
Appendix B. Utility calculation ........................................................................... 105
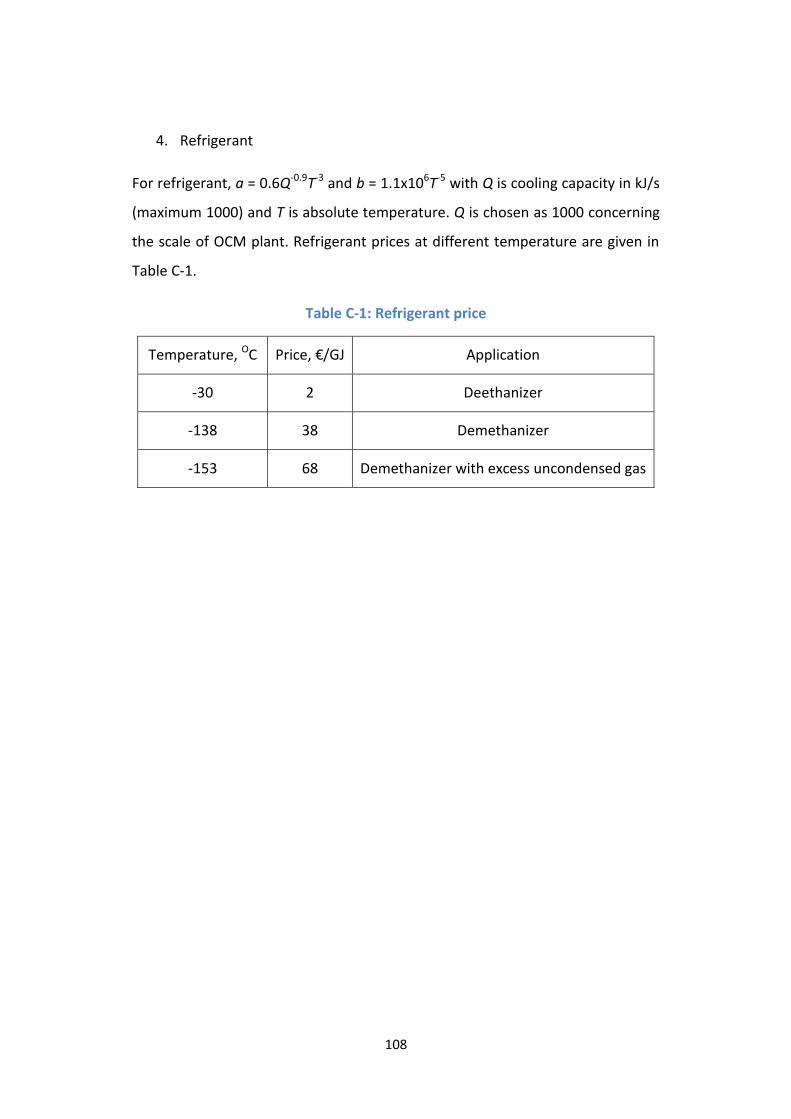
Appendix C. Utility price ..................................................................................... 107
Appendix D. Experiment with zeolite 4A ............................................................ 109
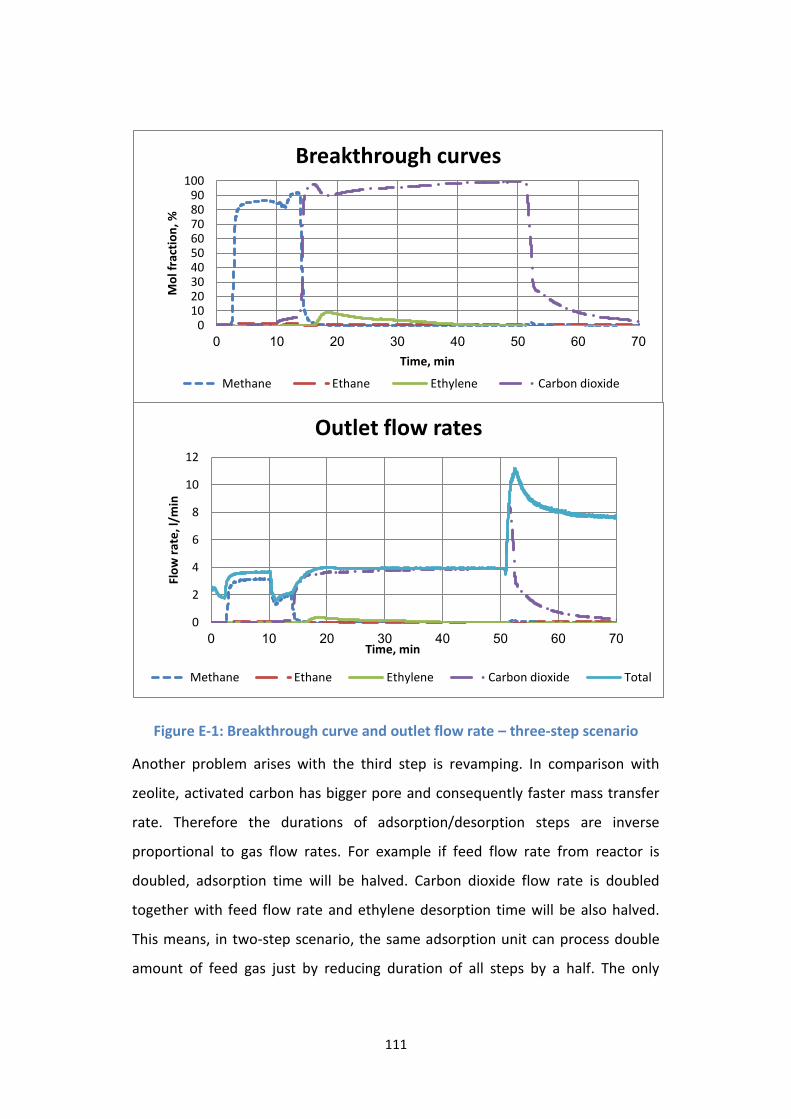
Appendix E. Three-step scenario ....................................................................... 110
References ....................................................................................................... 113
Page 11
iii
List of Figures
Figure 2-1: Major sections of OCM process .......................................................... 10
Figure 2-2: Operating cost per tonne of ethylene ................................................ 15
Figure 2-3: Required conversion and yield versus selectivity ............................... 20
Figure 2-4: New scheme of OCM process ............................................................. 29
Figure 2-5: Process flow diagram with two steps adsorption .............................. 34
Figure 3-1: Adsorption isotherms of carbon monoxide on zeolite 4A ................. 48
Figure 3-2: Adsorption isotherms of ethane on zeolite 4A .................................. 49
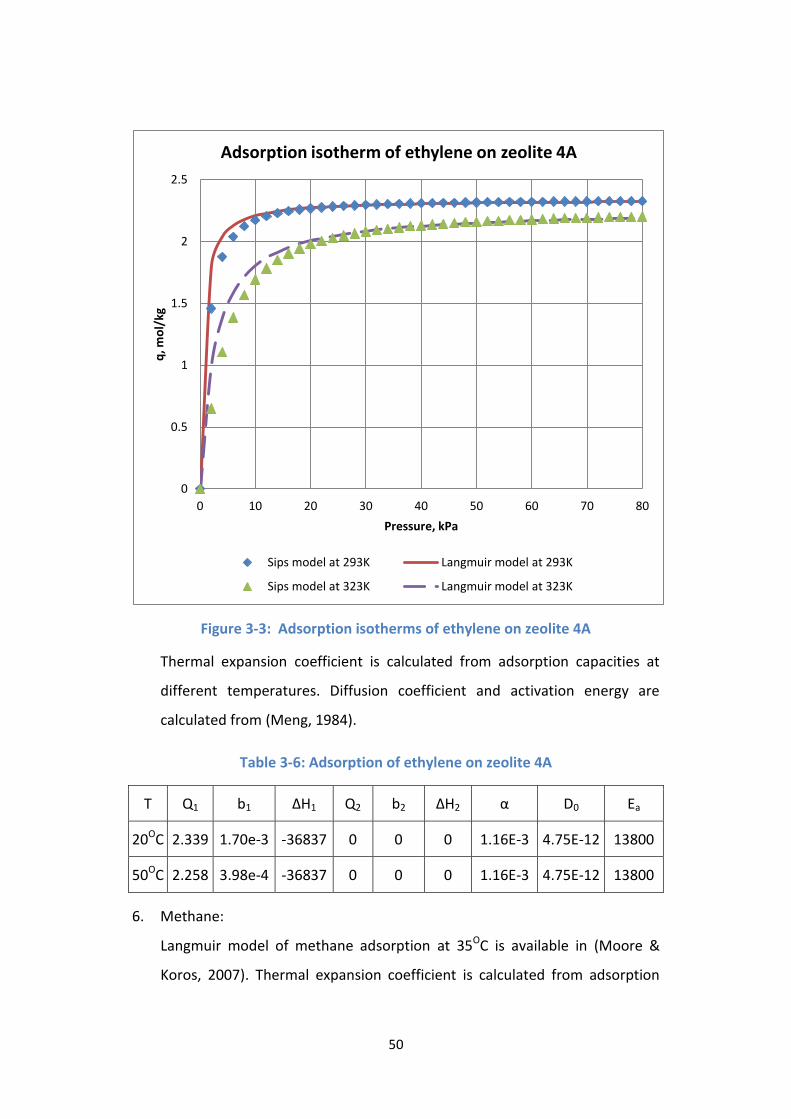
Figure 3-3: Adsorption isotherms of ethylene on zeolite 4A ................................ 50
Figure 3-4: Adsorption isotherms of methane on activated carbon .................... 52
Figure 3-5: Adsorption isotherms of ethane on activated carbon ....................... 52
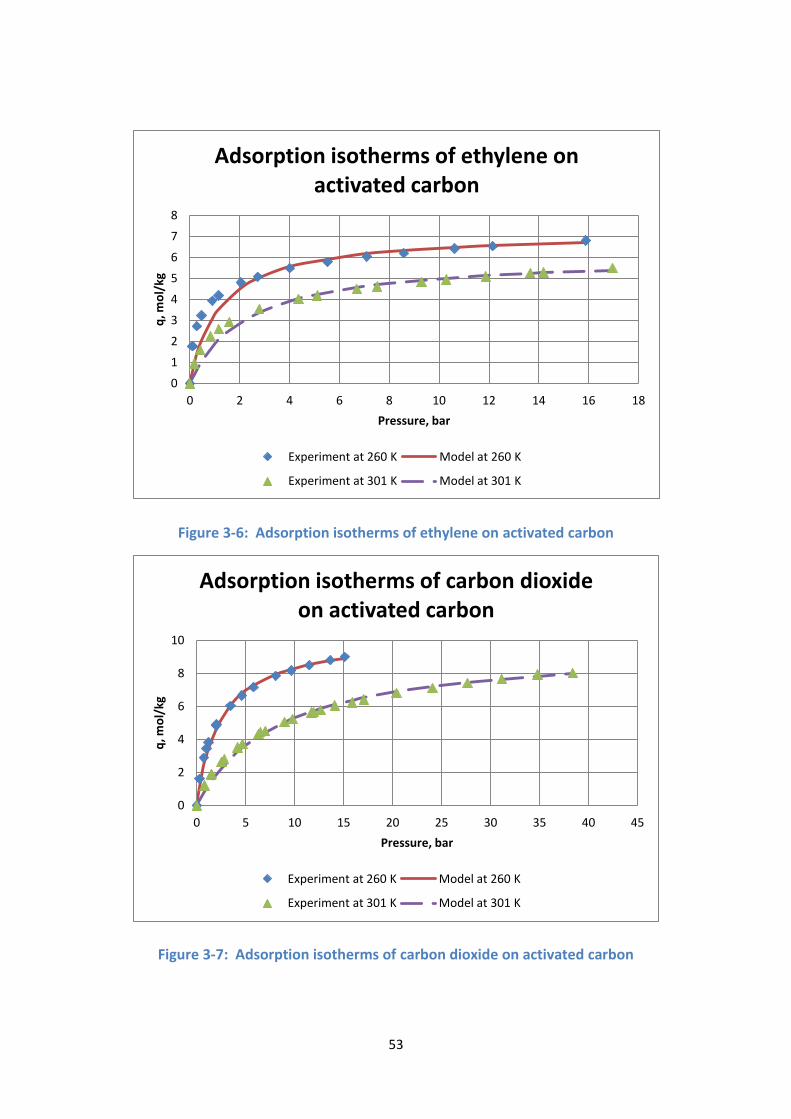
Figure 3-6: Adsorption isotherms of ethylene on activated carbon .................... 53
Figure 3-7: Adsorption isotherms of carbon dioxide on activated carbon ........... 53
Figure 3-8: Numerical diffusion test ..................................................................... 56
Figure 3-9: Breakthrough simulation .................................................................... 57
Figure 3-10: Outlet velocity and flow rates .......................................................... 58
Figure 3-11: Flow sheet for schemes 1, 2, 3 ......................................................... 60
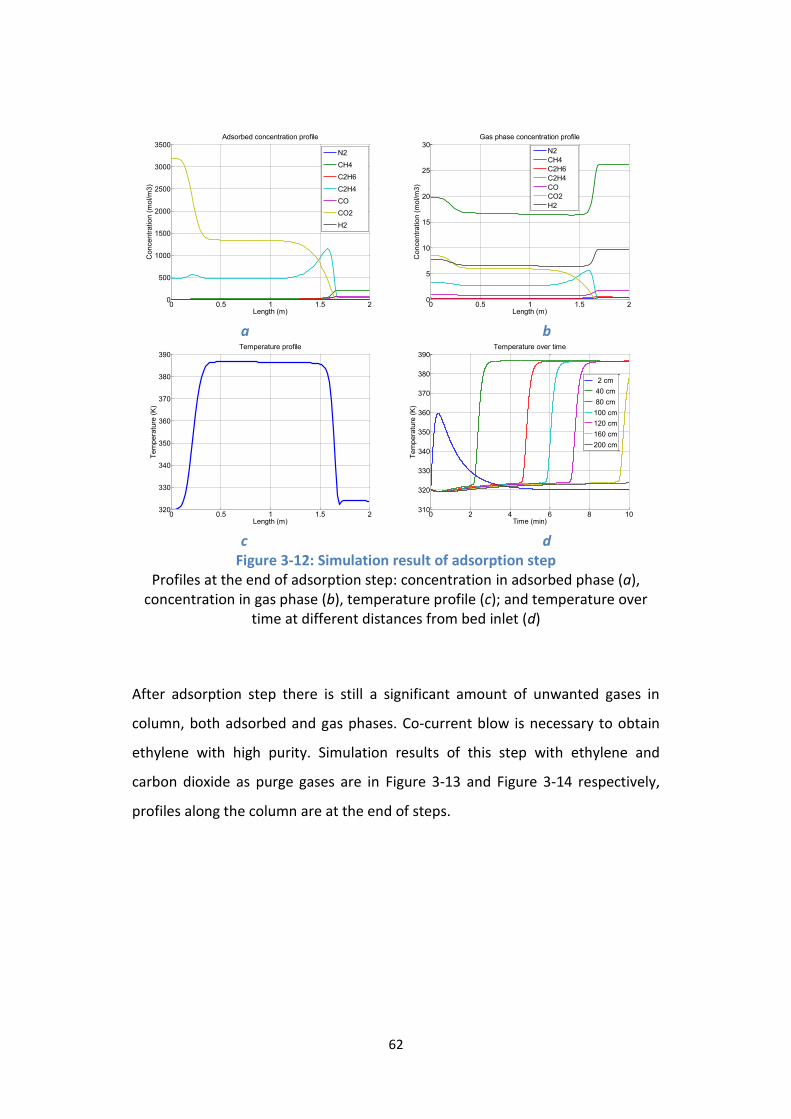
Figure 3-12: Simulation result of adsorption step ................................................. 62
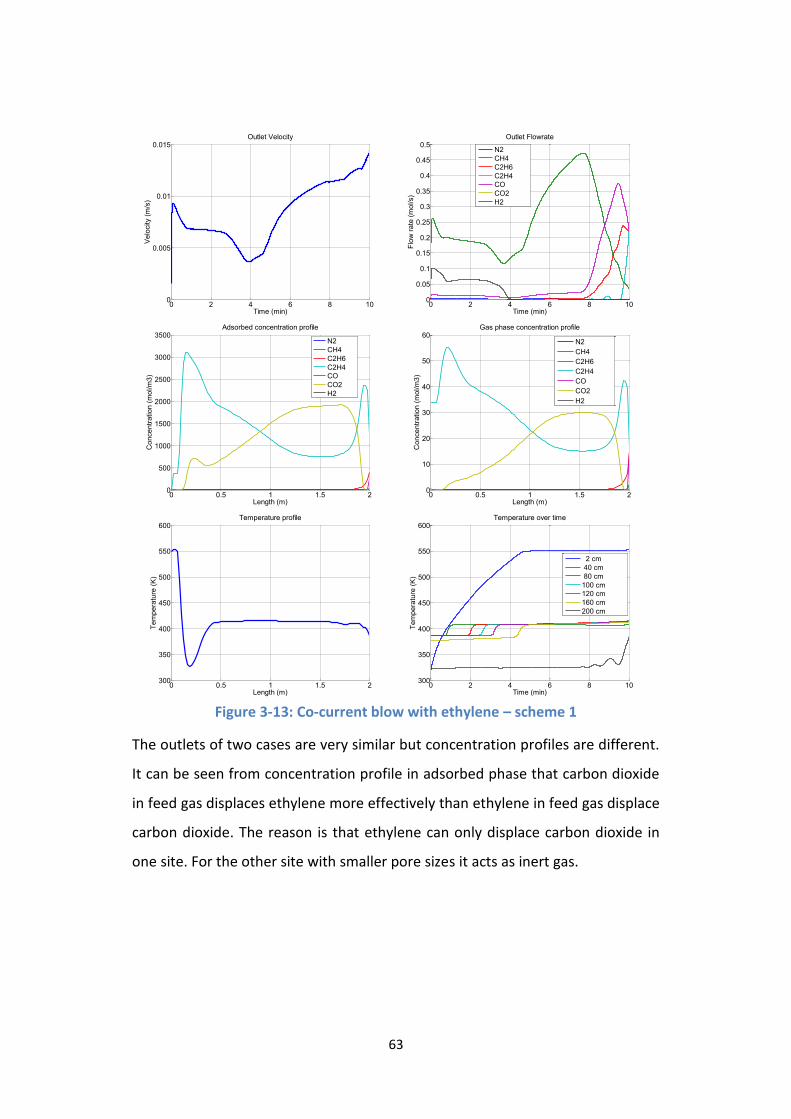
Figure 3-13: Co-current blow with ethylene – scheme 1 ...................................... 63
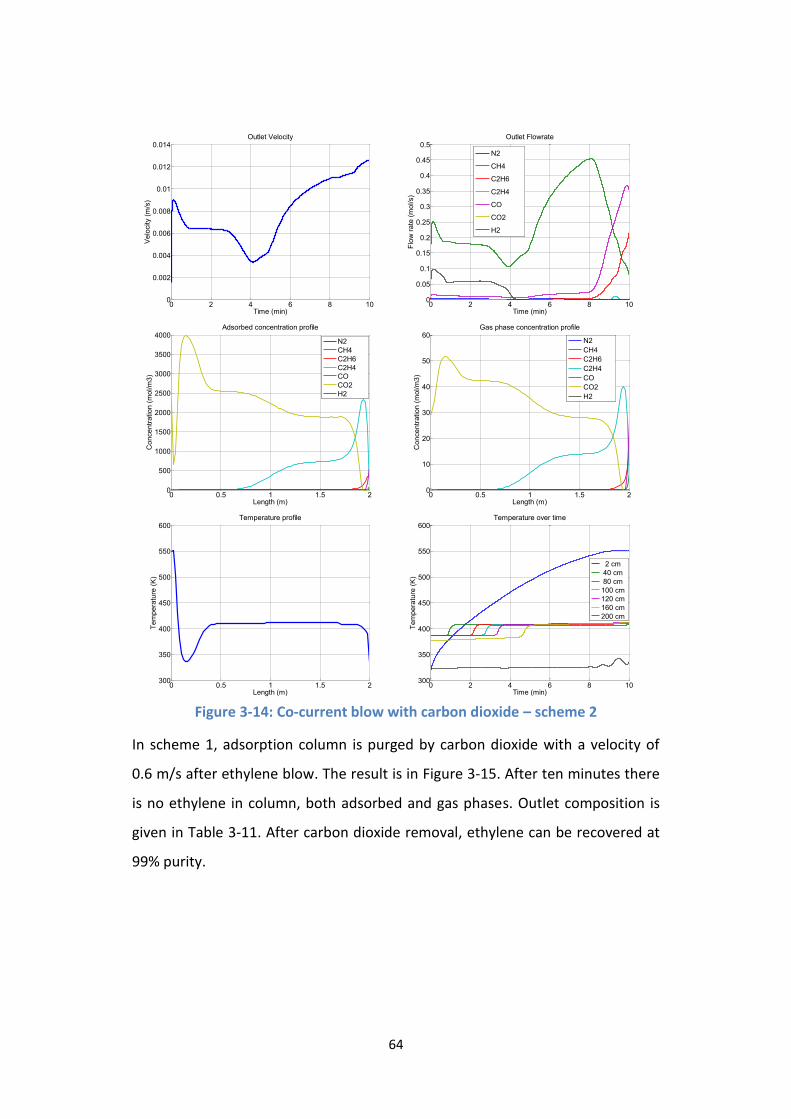
Figure 3-14: Co-current blow with carbon dioxide – scheme 2 ............................ 64
Page 12
iv
Figure 3-15: Purging by carbon dioxide in scheme 1 ............................................. 65
Figure 3-16: Purging by carbon dioxide in scheme 2 ............................................. 66
Figure 3-17: Effluent of entire cycle in scheme 3 .................................................. 69
Figure 3-18: Flow sheet for scheme 4.................................................................... 74
Figure 3-19: Effluent of entire cycle in scheme 4 .................................................. 75
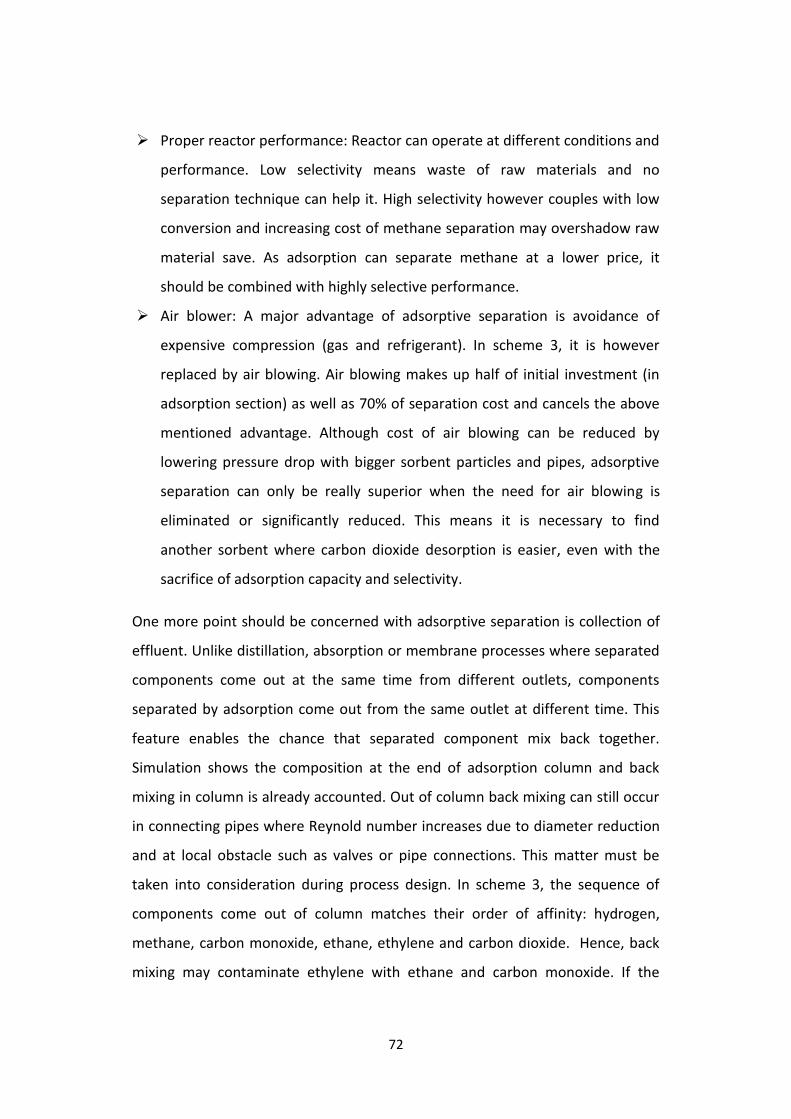
Figure 4-1: Adsorption isotherms on activated carbon at 0OC .............................. 79
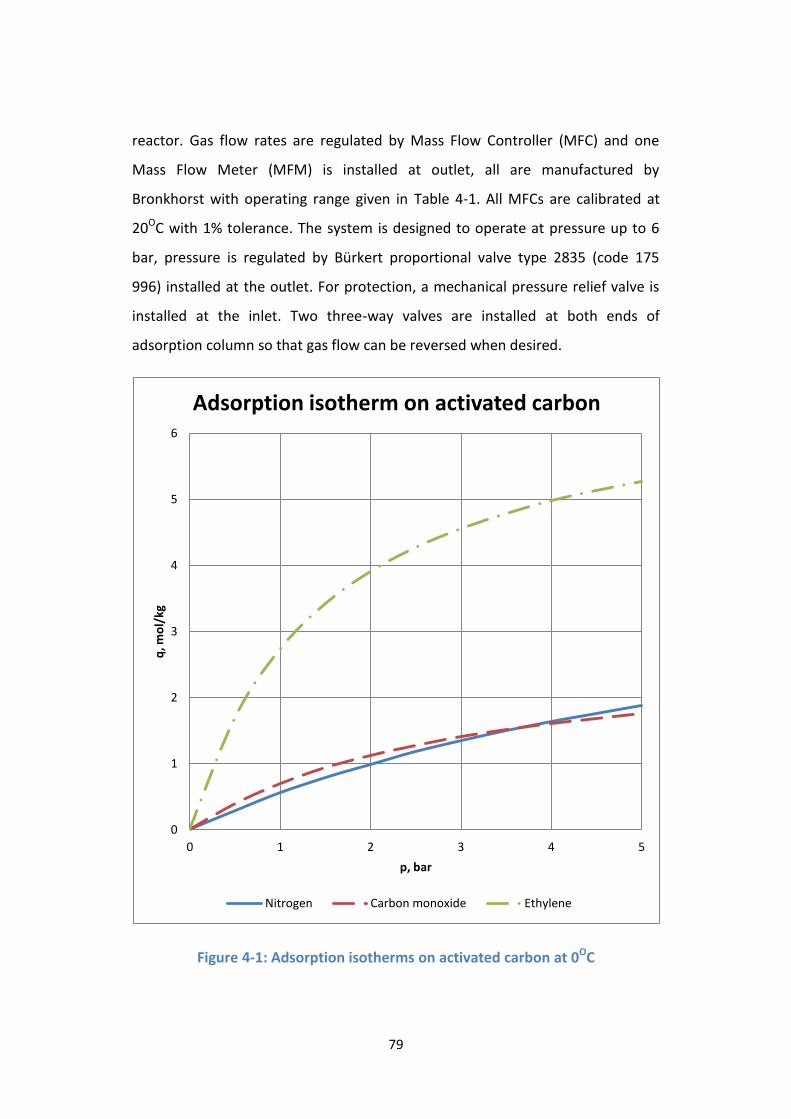
Figure 4-2: Flow sheet of adsorption experiment setup ....................................... 80
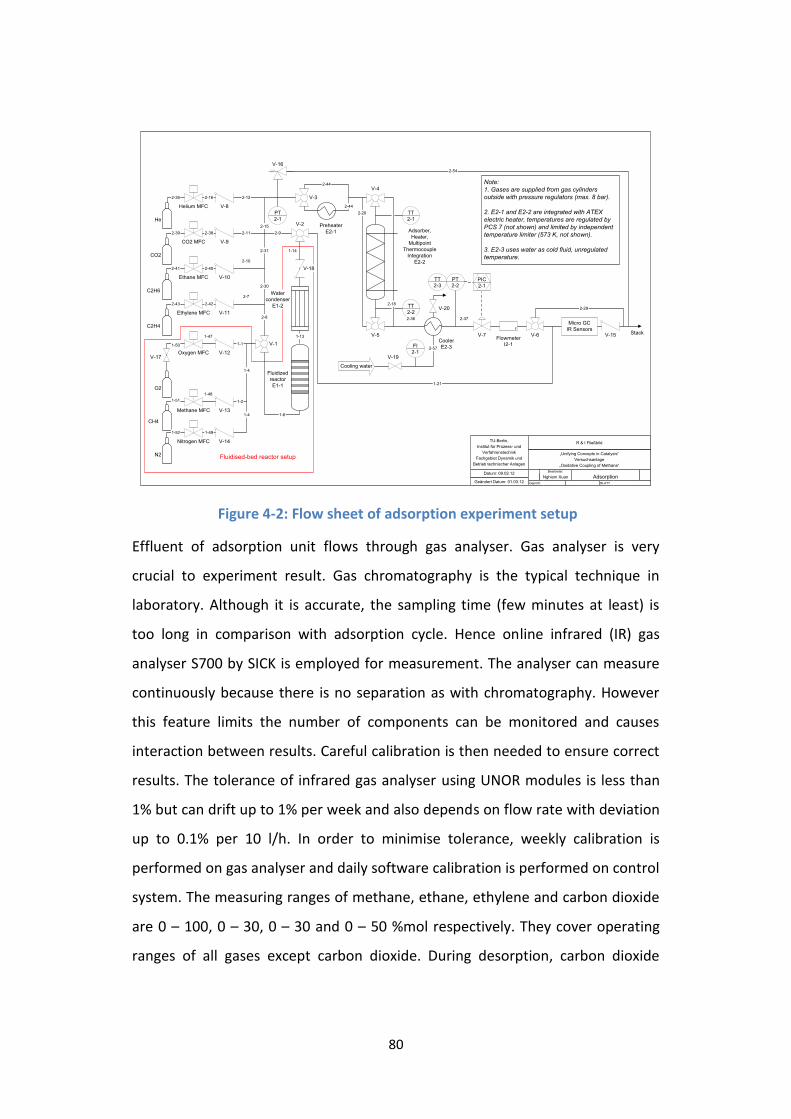
Figure 4-3: Adsorption column .............................................................................. 82
Figure 4-4: Human machine interface ................................................................... 83
Figure 4-5: Special states of system ....................................................................... 83
Figure 4-6: Adsorption isotherms on activated carbon ......................................... 84
Figure 4-7: Column temperature and pressure ..................................................... 88
Figure 4-8: Breakthrough curve ............................................................................. 89
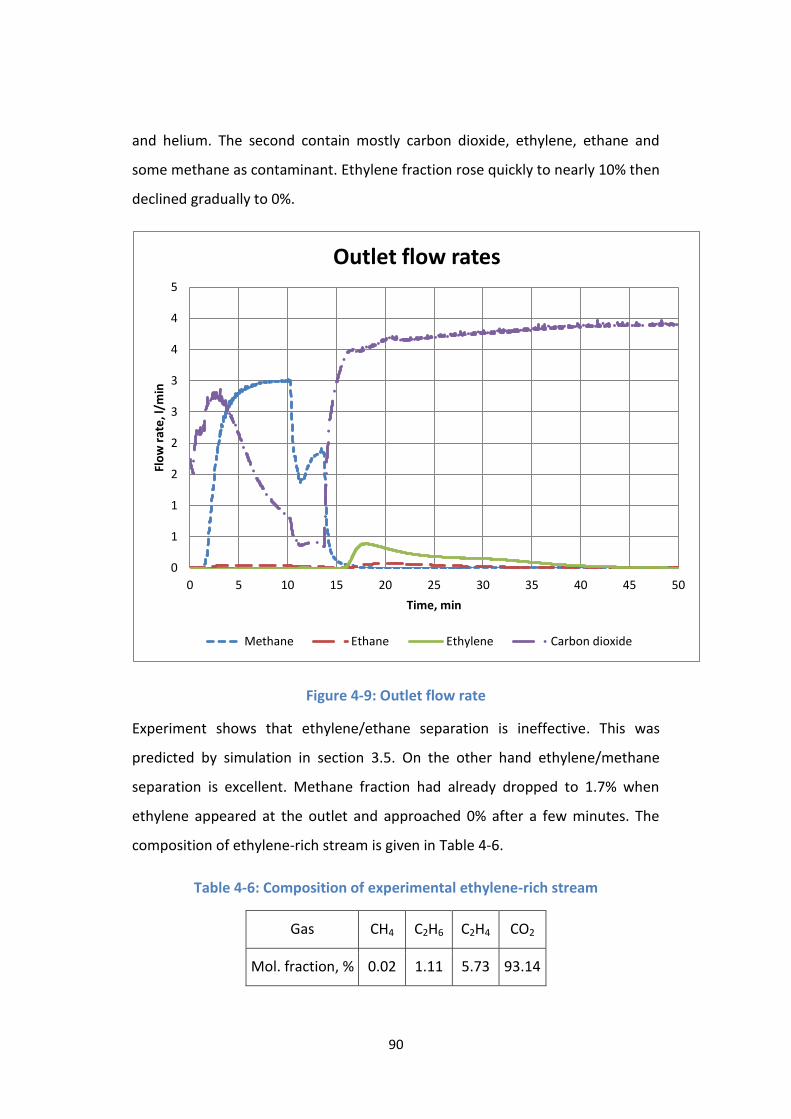
Figure 4-9: Outlet flow rate ................................................................................... 90
Figure 4-9: Simulated temperature variation during cycle ................................... 91
Figure D-1: Carbon dioxide desorption with zeolite 4A ...................................... 109
Figure E-1: Breakthrough curve and outlet flow rate – three-step scenario ...... 111
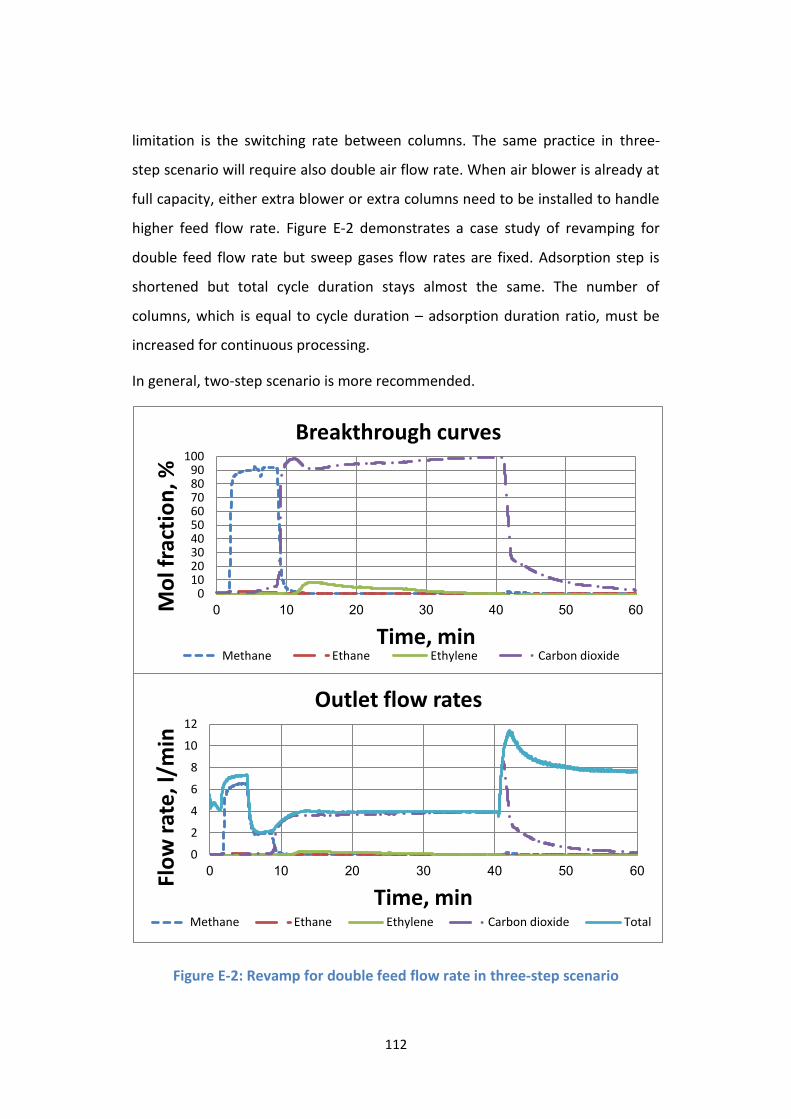
Figure E-2: Revamp for double feed flow rate in three-step scenario ................ 112
Page 13
v
List of Tables
Table 2-1: Cryogenic distillation utilities*.............................................................. 14
Table 2-2: Operating cost summary ...................................................................... 16
Table 2-3: Energy requirement .............................................................................. 21
Table 2-4: Feed composition of Midrex reformer, % mol ..................................... 33
Table 3-1: Zeolite 4A characteristics ...................................................................... 46
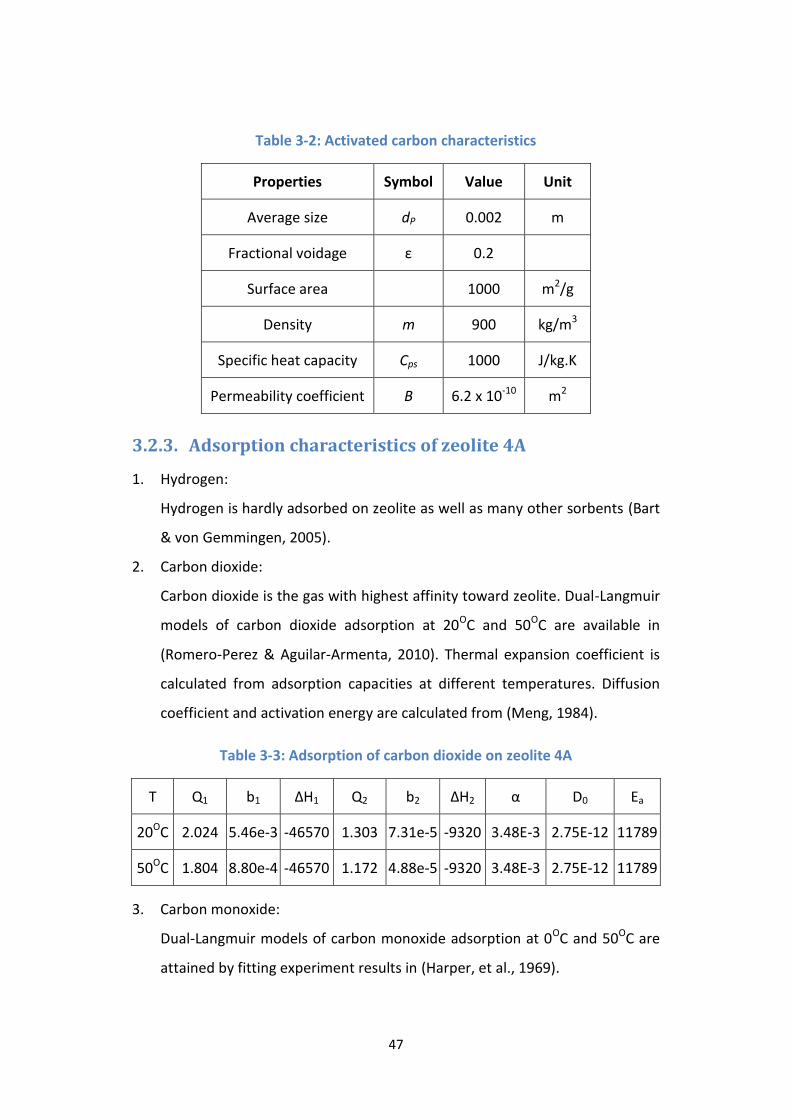
Table 3-2: Activated carbon characteristics .......................................................... 47
Table 3-3: Adsorption of carbon dioxide on zeolite 4A ......................................... 47
Table 3-4: Adsorption of carbon monoxide on zeolite 4A ..................................... 48
Table 3-5: Adsorption of ethane on zeolite 4A ...................................................... 49
Table 3-6: Adsorption of ethylene on zeolite 4A ................................................... 50
Table 3-7: Adsorption of methane on zeolite 4A .................................................. 51
Table 3-8: Adsorption of nitrogen on zeolite 4A ................................................... 51
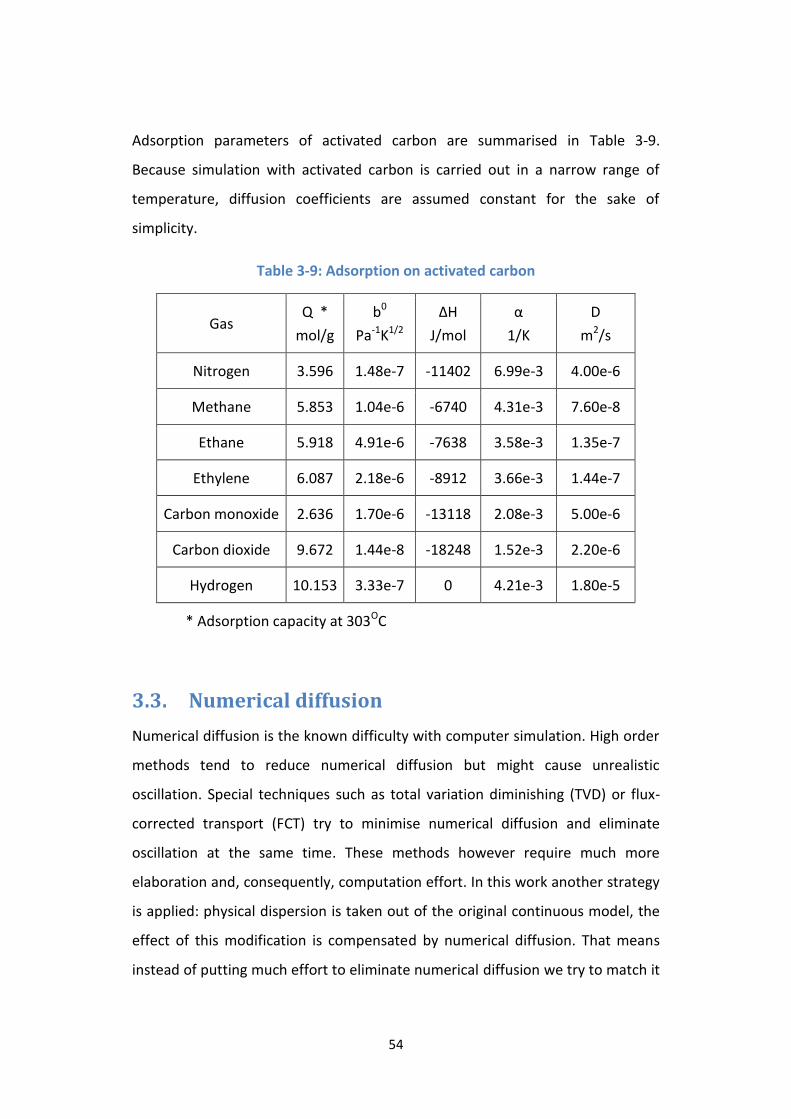
Table 3-9: Adsorption on activated carbon ........................................................... 54
Table 3-10: Feed composition for simulation ........................................................ 56
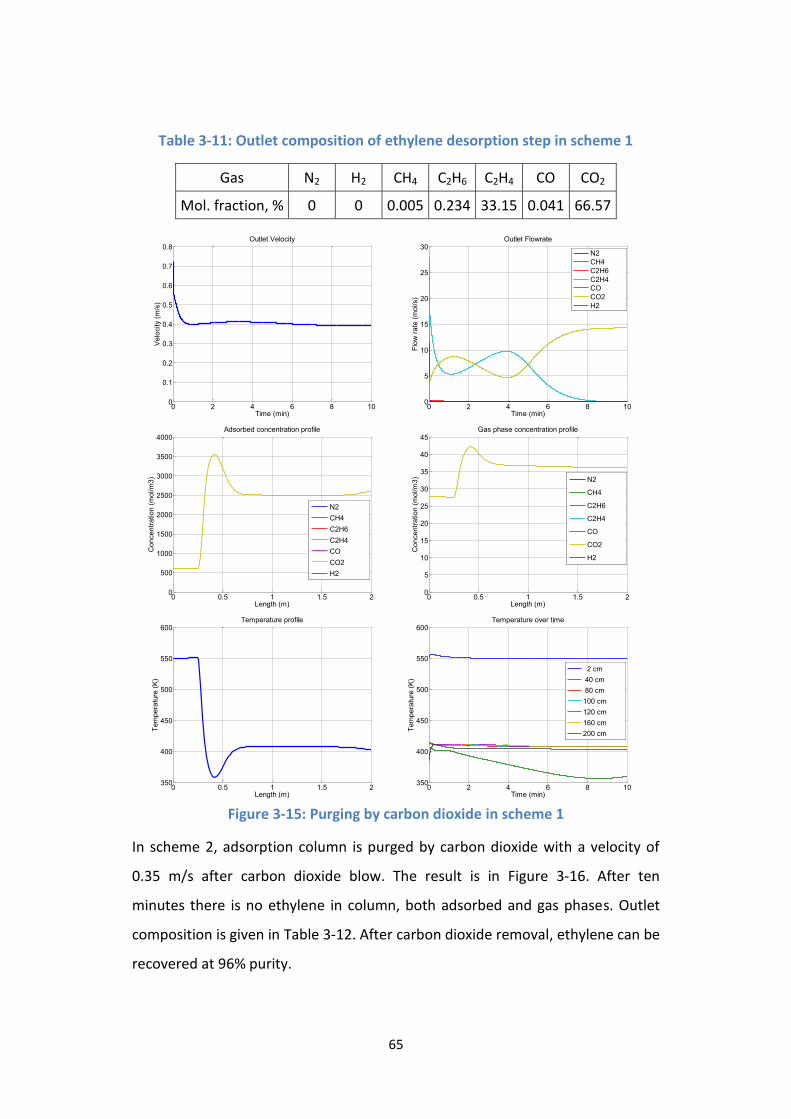
Table 3-11: Outlet composition of ethylene desorption step in scheme 1 ........... 65
Table 3-12: Outlet composition of ethylene desorption step in scheme 2 ........... 66
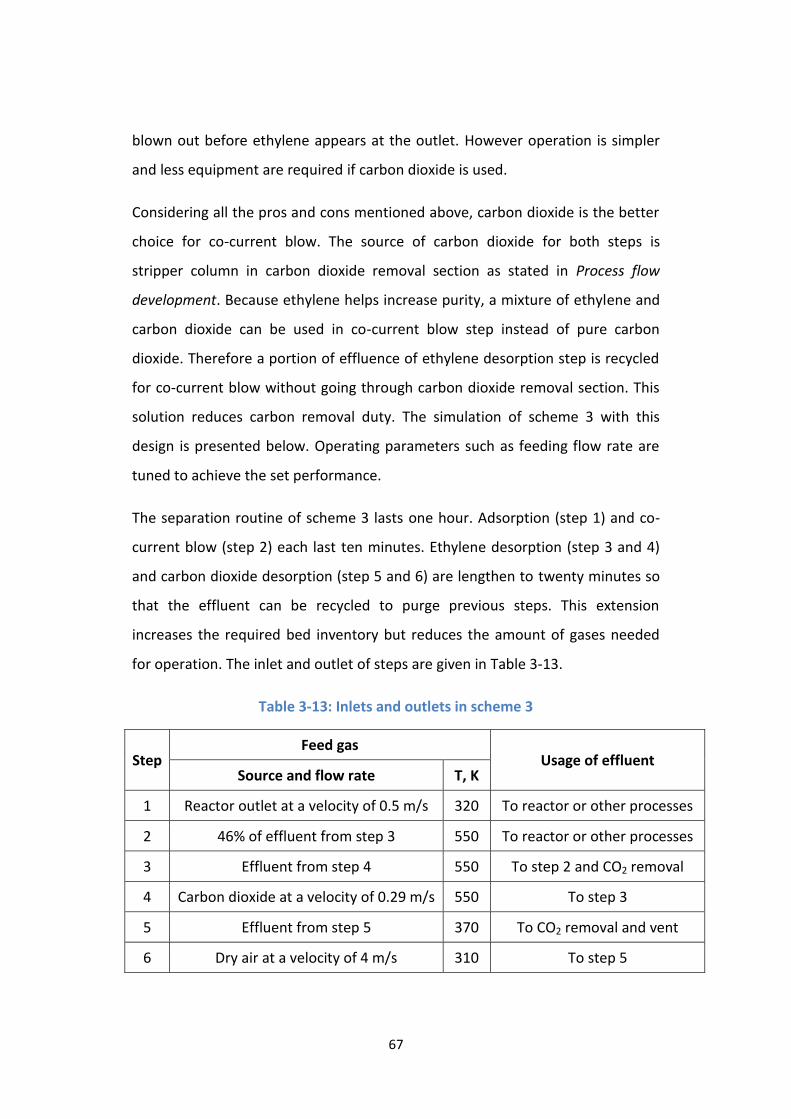
Table 3-13: Inlets and outlets in scheme 3 ............................................................ 67
Table 3-14: Composition of ethylene-rich stream in scheme 3 ............................ 68
Table 3-15: Operating cost summary .................................................................... 71
Page 14
vi
Table 3-16: Equipment cost ................................................................................... 71
Table 3-17: Feed composition for simulation ........................................................ 73
Table 3-18: Inlets and outlets in separation with activated carbon ...................... 74
Table 3-19: Composition of ethylene-rich stream in scheme 4 ............................ 75
Table 4-1: Operating ranges of mass flow controllers........................................... 81
Table 4-2: Original reactor outlet composition ..................................................... 85
Table 4-3: Composition of the feed of adsorption unit ......................................... 85
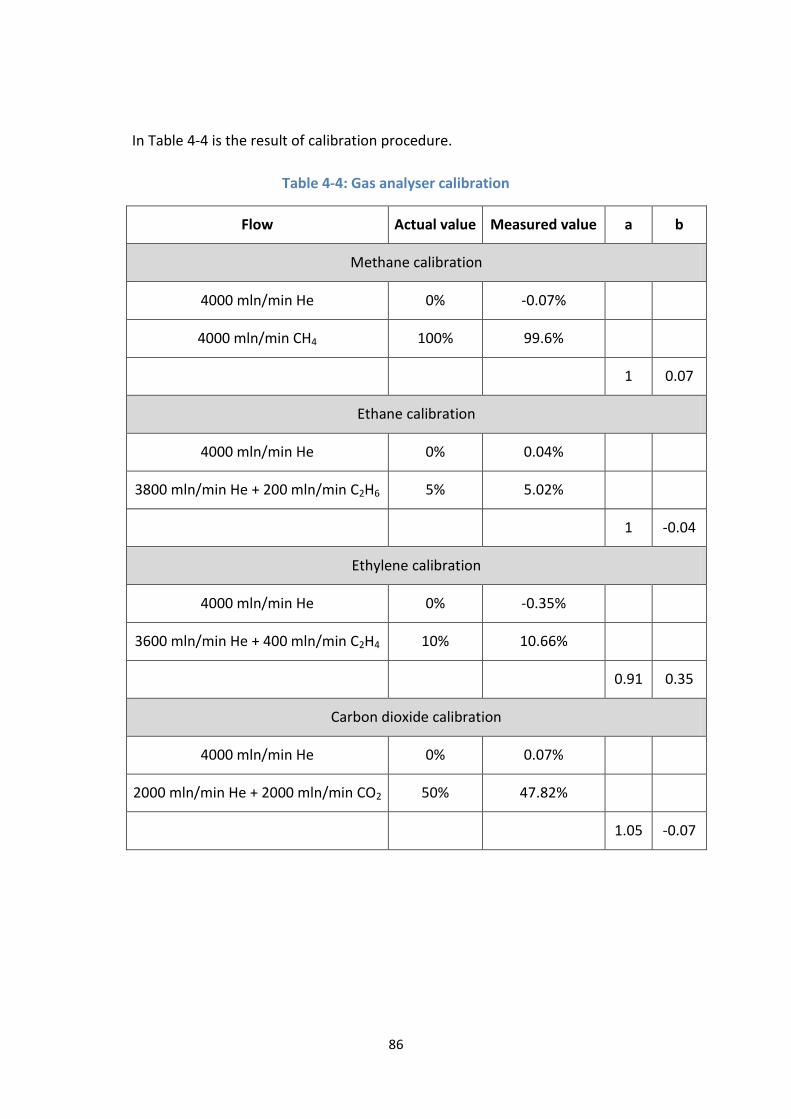
Table 4-4: Gas analyser calibration ........................................................................ 86
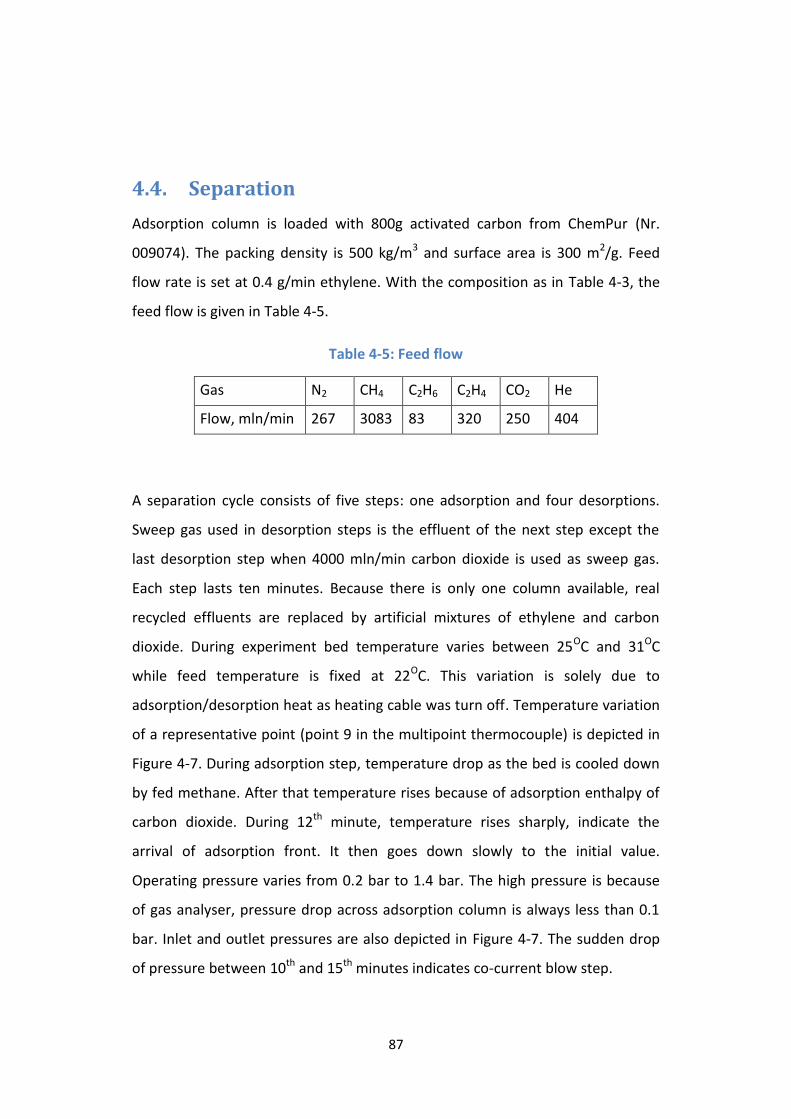
Table 4-5: Feed flow .............................................................................................. 87
Table 4-6: Composition of experimental ethylene-rich stream ............................ 90
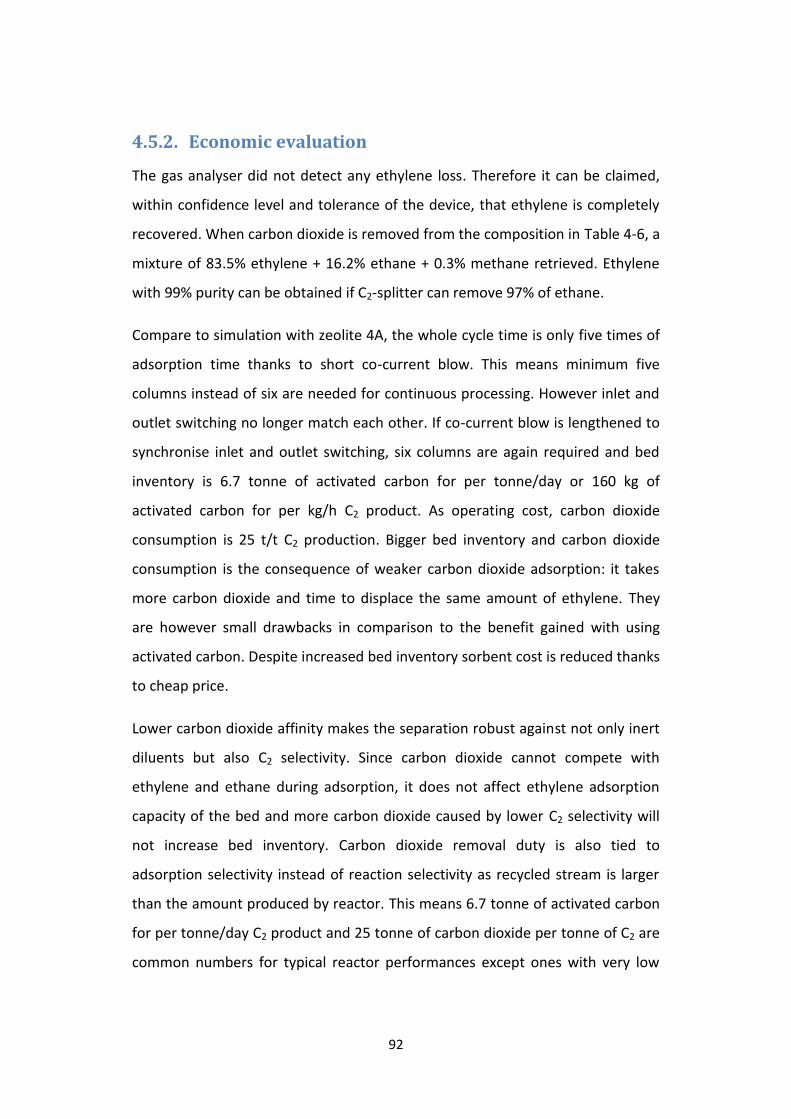
Table 4-7: Artificial reactor performance .............................................................. 93
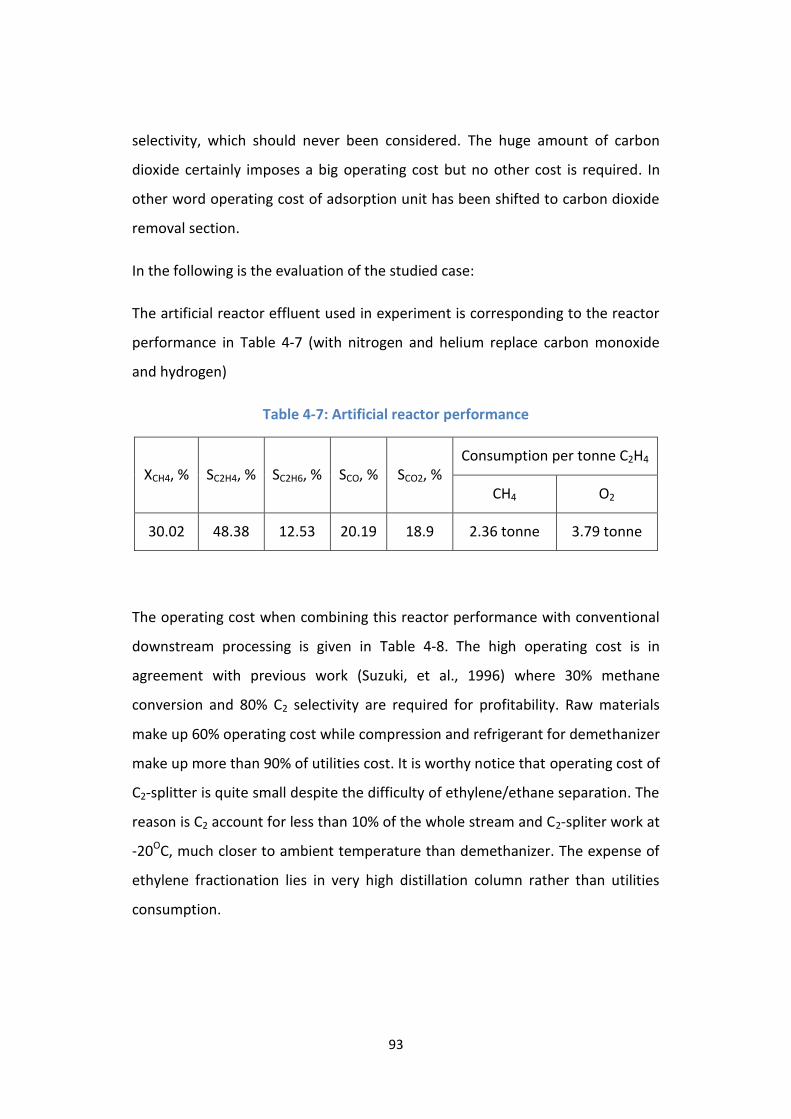
Table 4-8: Operating cost with conventional downstream process ...................... 94
Table 4-9: Operating cost with proposed downstream process ........................... 95
Table 4-10: Fixed cost comparison ........................................................................ 96
Table 4-11: Stream compositions .......................................................................... 97
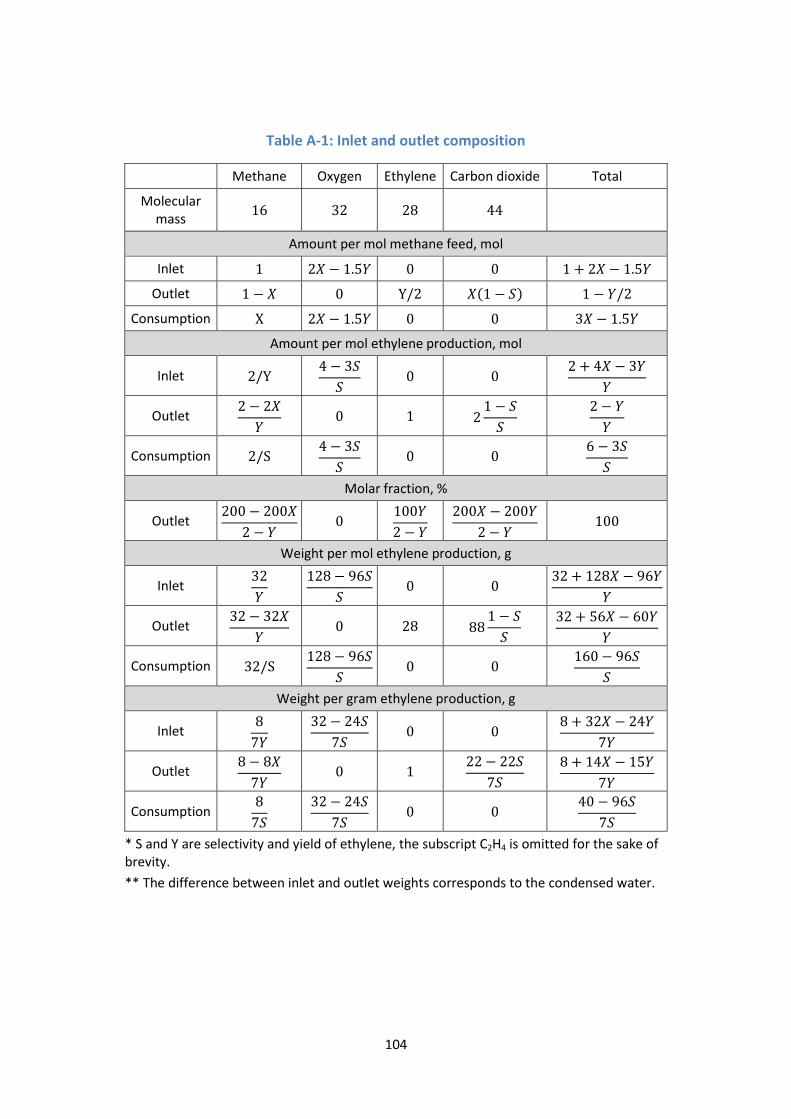
Table A-1: Inlet and outlet composition .............................................................. 104
Table C-1: Refrigerant price ................................................................................. 108
Page 15
vii
Nomenclature
Symbol Unit Dimension Description
Latin letters
a Decaying factor
b1 1/Pa M-1L1T2 Langmuir coefficient of first site
b2 1/Pa M-1L1T2 Langmuir coefficient of second site
B m2 L2 Permeability coefficient
c mol/m3 L-3 Gas phase concentration
Cp J/(mol.K) ML2T-2Θ-1 Gas specific heat capacity
Cps J/(kg.K) L2T-2Θ-1 Sorbent specific heat capacity
dp m L Particle diameter
Dbed m L Bed diameter
D m2/s L2T-1 Diffusion coefficient
f mol/m2s L-2T-1 Flux
kV m3/h L3T-1 Flow coefficient
l m L Bed length
m kg/m3 ML-3 Sorbent density
M g/mol M Molecular weight
nc Number of components
p Pa ML-1T-2 Pressure
s 1/s T-1 Adsorption rate
t s T Time
u m/s LT-1 Gas velocity
Page 16
viii
x m L Dimension x along adsorption bed
q mol/m3 L-3 Solid phase concentration
Q1 mol/m3 L-3 Saturated solid phase concentration of site 1
Q2 mol/m3 L-3 Saturated solid phase concentration of site 2
r m L Crystal radius
rp m L Particle radius
R J/(mol.K) ML2T-2Θ-1 Gas constant
S Selectivity based on number of carbon
T K T Temperature
X Conversion based on number of carbon
Y Yield based on number of carbon
Greek letters
α 1/K Θ-1 Thermal expansion coefficient
ΔH J/mol ML2T-2 Adsorption enthalpy
ε Void fraction
μ Pa.s ML-1T-1 Gas viscosity
Subscripts
i Component i
Superscripts
k Node k of spatial mesh
in Inlet
Abbreviations
ASU Air Separation Unit
bpd Barrel Per Day
Page 17
ix
C2 Ethane and ethylene
C2+ Ethane, ethylene and higher hydrocarbons
CE PCI Chemical Engineering Plant Cost Index
COP Coefficient Of Performance
CTO Coal-To-Olefins
DEA DiEthanolAmine
DRI Direct Reduced Iron
GGFR Global Gas Flaring Reduction
GTL Gas-To-Liquids
IR InfraRed
MEA MonoEthanolAmine
MFC Mass Flow Controller
MFM Mass Flow Meter
MMbpd Million barrels per day
MTO Methanol-To-Olefins
OCM Oxidative Coupling of Methane
PSA Pressure Swing Adsorption
PWM Pulse Width Modulation
RPSA Rapid Pressure Swing Adsorption
TPD Temperature Program Desorption
TSA Thermal Swing Adsorption
Page 18
1
Chapter 1. Introduction
The author started this project in 2009, one year after the national recession of
United States spread worldwide. By now it still lasts in some big economies such
as Italy, Spain while others are struggling with recovering. Although financial
sector is more concerned, petroleum industry also involved as both victim and
culprit: oil price increase has been argued as a significant cause of United States
recession (Hamilton, 2009) while fifteen refineries have been shutdown in
Western Europe since 2008 (Kent & Werber, 2013). This is not a surprise as the
importance of petroleum in modern world is well-known. We have learnt a lot
from the first and second oil crises and since then many efforts have been made
to mitigate the next one by finding substitutes for petroleum products, both
fuels and petrochemicals. Thanks to the promotion from both manufacturers and
law makers, renewable energy is gaining bigger share in both electricity
generation and transport fuels. On the other hand, petrochemicals are still
largely from fossil resources as 60% global feedstock of ethylene – the most
produced petrochemical – is from oil (2008).
Through crisis, each country has its own way to survive the oil price. For
example, Braskem run a 200 000 t/y green ethylene plant in Brazil since 2010,
taking the advantage of the surplus supplies of sugarcane. China – the largest
coal producer in the world – set a goal of producing 20% of their ethylene from
diversified sources, which practically means coal, by 2015. In China UOP alone
has licensed their advanced methanol-to-olefins (MTO) technology to four plants
with total capacity at ca. 2 Mt/y. The shale gas boom in United States, thanks to
advances in hydraulic fracturing, encourages ethylene producers to switch from
naphtha to natural gas liquid – mainly ethane cracking. By 2008, ethane was
already the biggest ethylene feedstock in US (Seddon, 2010).
All solutions above have however their own limitations.
Page 19
2
Green ethylene from ethanol meets both economic and ecologic criteria but is
hardly applicable outside Brazil, the only sustainable bio-fuel economy with vast
cultivable land, suitable climate and advanced technology.
Coal-to-olefin (CTO) technology is opposite. It produces much pollution while
large energy consumption and initial investment make the economic viability
doubtful without high oil price. The property in common with bio-ethanol
dehydration is that it also requires at the same time some exclusive conditions:
very high coal supply, very high ethylene demand but low emission standard.
Compare to the others ethane cracking is more widely applicable with the
increasing share of ethane in global feedstock. Although the carbon footprint of
ethane crackers is larger than naphtha crackers, their limitation comes from
another problem: the source of ethane. Shale gas and natural gas in general
consist of mostly methane while ethane only makes up 10 %wt. or less. With
typical cracking selectivity at 80%, this means one tonne of ethylene production
requires more than ten tonnes of methane extraction from underground.
Methane is the cleanest fossil fuel but also most expensive in term of
transportation, which practically requires pipelines. In US only, ethane
production grew 40% in 1984 – 2008 period and another 40% to nearly 1 MMbpd
in 2008 – 2012 period (Cantrell, et al., 2013), which means natural gas
production is about 10 MMbpd. The consequence is natural gas is flared in many
areas due to the lack of pipeline capacity. For example over half a million m3/day
STP was flared in North Dakota in June 2012 (Curtis & Ware, 2012). According to
Global Gas Flaring Reduction (GGFR) partnership, a World Bank-led initiative, 150
billion m3/y of natural gas are being flared or vented (World Bank, 2013). This is
equivalent to 25% of United States’ gas consumption, 30% of European Union’s
gas consumption and more than the combined gas consumption of Central and
South America. It is not only a huge waste of resource but also a tremendous
harm to environment with about 400 Mt/y of carbon dioxide emission.
Page 20
3
Technically the simplest solution for over mined methane is building more
pipelines. Pipeline network expansion however meets many obstacles because it
requires lots of land spreading in a long distance and thus raises serious concern
about environment and safety. A famous example is the case of Keystone XL: the
pipeline extension through North Dakota was proposed in 2008 (Lincoln Journal-
Star, 2008) but has not been started until now (Trans Canada, 2013), making the
doubt among relevant companies that it will ever be built (Lefebvre, 2013).
The other solution is onsite conversion of methane into ethylene or other higher
value hydrocarbon. There are two ways to do this: direct or indirect. Indirect
technologies such as gas-to-liquids (GTL) also convert raw material into syngas
like CTO then from syngas produce methanol, dimethyl ether and higher
hydrocarbons. An example of salvation effort with GTL is the mega project of
Sasol in Louisiana: a 1.5 Mt/y ethane cracker combine with a 96 000 bpd (4 Mt/y)
GTL plant (Sasol, 2013). The cracker is under construction but the final decision
on the GTL plant will only be made in 2014, the estimated building cost has risen
from $8 – $9 billion at the beginning to $11 – $14 billion. Meanwhile the plan to
build a 48 000 bpd GTL plant in Alberta has been put on hold (Sasol Canada,
2013). Talisman Energy – their Canadian partner – exited the project after
participating in the feasibility study in 2012 (Talisman Energy, 2012). Another
example is Pearl plant, the largest GTL plant in the world owned by Shell and
Government of the State Qatar. The 140 000 bpd plant costs $19 billion and is
considered profitable with free gas supply from North Field – the world’s largest
single non-associated gas field according to Shell (Shell, 2012). Despite this
success, they still announce that the company will stop pursuing the proposed
140 000 bpd GTL project in Louisiana (Royal Dutch Shell plc, 2013). The reasons
are “development cost of such a project” and “uncertainties on long-term oil and
gas prices and differentials”. These obstacles also hold true for any other
company and make GTL a risky investment.
Page 21
4
Direct conversion of methane requires fewer steps and therefore less capital
cost. The simplest reaction is thermal dehydrogenation but the high stability of
methane molecule makes the process difficult. Yet no feasible result on methane
thermal dehydrogenation has been reported. The newest attempt is the joint
project between BASF, The Linde Group and ThyssenKrupp (The Linde Group,
2013). They aimed at thermally decomposing methane into hydrogen and solid
carbon and later using hydrogen to produce syngas and consume carbon dioxide
from other processes. The project started on July 1, 2013 and is expected to last
three years.
Another alternative of direct conversion is oxidative dehydrogenation, which is
better known as oxidative coupling of methane (OCM). With the presence of
oxidant, methane reacts at lower temperature and produces different products
depend on reaction condition and the availability of oxidant. So far carbon
dioxide and oxygen are two oxidants that get the most attention. Using carbon
dioxide prevents full combustion of methane and opens the chance to reduce
carbon footprint from other processes. Useful products are higher hydrocarbon
such as ethylene or syngas in dry reforming process. Unfortunately achieved
results (Asami, et al., 1995) (Chen, et al., 1996) (Asami, et al., 1997) (Wang, et al.,
1998) (Wang, et al., 1998) (Wang, et al., 1999) (Wang & Ohtsuka, 2000) (Wang &
Ohtsuka, 2001) (Cai, et al., 2003) (Wang & Zhu, 2004) are not good enough to be
applied in commercial production.
Compare to carbon dioxide, oxygen is the stronger oxidant and can convert
methane more effectively. Since Keller et al. pioneered in this area (Keller &
Bhasin, 1982), much effort has been spent on developing the suitable catalysts
and reactors for producing ethylene from methane and oxygen:
2CH4 + O2 C2H4 + 2H2O (1.1)
Page 22
5
Although there are different explanations about mechanism, the common is the
formation of ethane via methane coupling follow by the formation of ethylene
via ethane dehydrogenation:
4CH4 + O2 2C2H6 + 2H2O (1.2)
C2H6 C2H4 + H2 (1.3)
The draw back of using oxygen is the combustion of methane and products:
CH4 + 2O2 CO2 + 2H2O (1.4)
2C2H6 + 7O2 4CO2 + 6H2O (1.5)
C2H4 + 3O2 2CO2 + 2H2O (1.6)
2H2 + O2 2H2O (1.7)
Carbon monoxide is also produced via partial oxidation or water-gas shift
reaction. Coke formation can also happen and deactivate catalyst but it is
mitigate by the presence of steam. Other products such as acetylene, propylene,
benzene, methanol,… are also produced at small rates. Since OCM process
involves ethane dehydrogenation, its performance cannot surpass ethane
cracking and is actually much inferior because of undesired reactions (1.4) –
(1.6). State of the art performance, ~50% ethylene selectivity at ~40% methane
conversion (in a recent publication (Godini, et al., 2014) 20.3% ethylene yield and
52.5% ethylene selectivity were achieved), is no match to the typical
performance of ethane cracker: ~80% ethylene yield at 60 – 75% ethane
conversion. OCM therefore cannot compete with ethane cracking as an
economic method of ethylene production. When considering as a methane
salvation method, in combination with ethane cracking, it still cannot compete
with GTL technology despite the lower capital cost as the large amount of carbon
dioxide and unconverted methane impose a big cost in separation steps. After
more than three decades of development, OCM catalysts seem to reach the
performance limit, losing the initial attention from researchers (Zavyalova, et al.,
Page 23
6
2011). It is a pity that such a promising idea is missing from the portfolio of
ethylene producers amid the big trend toward natural gas feedstock.
Based on the review of OCM, we believe that its challenges cannot be overcome
solely by catalyst or reactor development but require a comprehensive
development of the whole process, in particular the downstream section. The
typical separation methods, which spend nearly 60% plant net work on
demethanization (Zimmermann & Walzl, 2012), are not appropriate to the
unique composition of OCM reactor effluent. Researches on improving
hydrocarbon fractionation have not taken into account the presence of carbon
dioxide, which is small in conventional ethylene plant. In this work, we intended
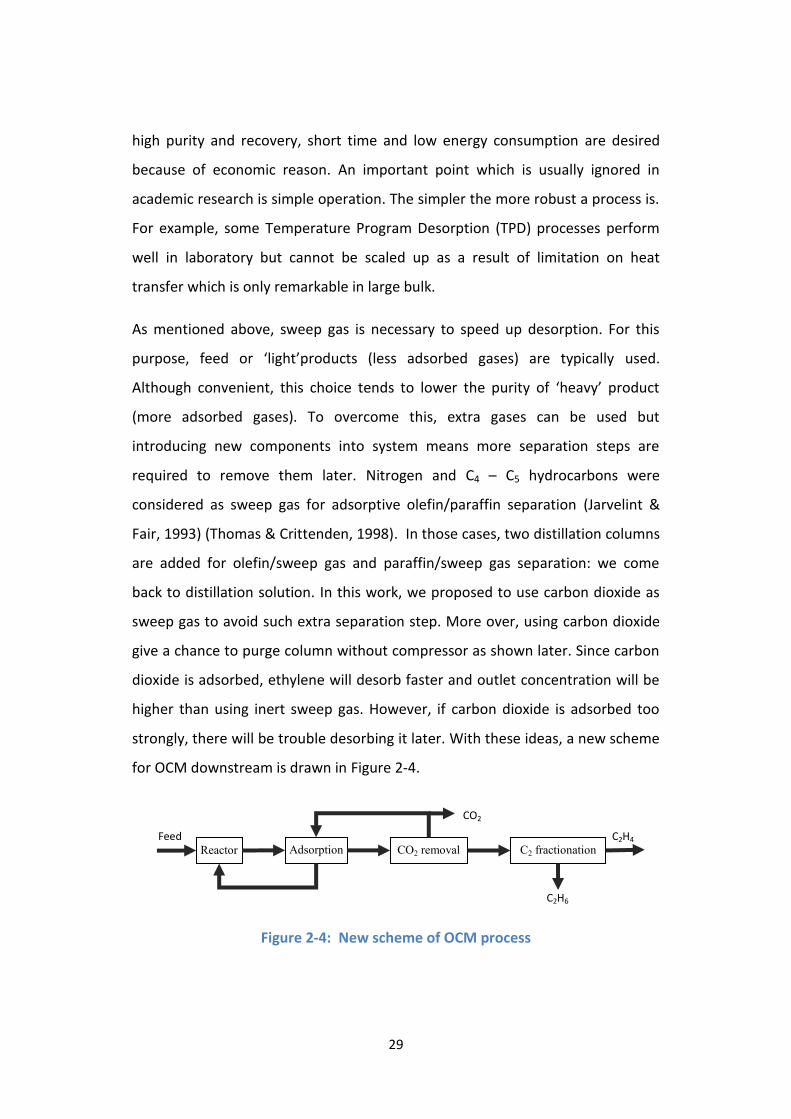
to draw a new downstream scheme for OCM process, based on adsorptive
separation. The goal of the work is to make OCM competitive with naphtha
cracking or other ethylene production from oil-based feedstock. The
competitiveness should not be restricted in remote areas where stranded gas is
very cheap or even free as the case of GTL process. If this goal is achieved, OCM
can be used as methane salvation process in combination with ethane cracker or
standalone process in the region where ethane content in natural gas is too low
for separation. The smaller scale of OCM plants, in comparison with GTL plants,
will make it suitable for small gas reserves and shorten the time to market. The
method to complete this job is firstly analysing OCM process, identifying its
challenges and conceptually deriving solution. Simulation is then used to
quantify the solution, reveal problems which cannot be noticed at the first glance
and screen out unsuitable options. Later, experimentation is used to judge the
achievement. From experiment results, conclusions are drawn as well as future
steps to bring OCM from laboratory to industry. It is worthy notice that this work
is only a step in the long way for OCM to develop into a mature technology.
Page 24
7
Chapter 2. OCM: Challenges and solutions
2.1. Cost estimation
Producing ethylene by OCM is obviously challenging: at high temperature (500 –
1000OC) and the presence of oxygen, methane and ethylene tend to be oxidized
to carbon dioxide. This tendency reduces ethylene selectivity and persists as long
as gas phase exists, no matter which catalyst is used. Because carbon dioxide is a
valueless green house gas, a low selectivity toward C2+ is clearly a waste of raw
material and an environmental problem, especially when carbon dioxide
emission regulations are tightening worldwide. Low selectivity also raises
problems in downstream and right at the reaction section: it increases both
carbon dioxide removal and reactor cooling duty. Since combusting to carbon
dioxide releases six times more heat than producing ethylene, one percent
decrement from typical selectivity results in about one percent cooling duty and
two percents carbon dioxide removal duty increment. All these potential
problems mean high selectivity is crucial to the success of OCM application.
Impractical solutions such as very low oxygen partial pressure can give very high
selectivity by sacrificing methane conversion due to the lack of oxygen. The low
conversion then raises other problems: reactor size and catalyst inventory
increase, compressor and separation section also get more duty because of
lower conversion as unconverted methane must be separated for recycling.
Therefore low conversion is also very unfavourable although methane is not
wasted and carbon dioxide emission is not a problem. The trade off between
selectivity and conversion thus leads to yield limitation at about 20%, which is
usually not attractive enough to ethylene producers.
Another challenge is temperature control. OCM process is highly exothermic
with standard enthalpies of desired reaction (1.1) and methane combustion (1.4)
are -280 kJ/mol and -890 kJ/mol respectively. There may be no problem if such
Page 25
8
exothermic reactions take place in empty tubes such as in case of steam
crackers. However, handling them in a very hot catalytic bed with limited heat
transfer area is another challenge and it is quite common to observe hotspot
around 100OC or even more in fixed bed OCM reactors (Kooh, et al., 1990)
(Dautzenberg, et al., 1992) (Schweer, et al., 1994) (Hoebink, et al., 1994)
(Mleczko & Baerns, 1995) (Taniewski, et al., 1996) (Pak & Lunsford, 1998) (Jaso,
2012). A slightly unbalanced heating/cooling when the temperature is close to
the limit of materials can lead to severe problems. Because cooling through
reactor wall alone is not enough in case of large reactors, additional gas is
essential for heat dissipation. In reported experiments, nitrogen was usually used
for this purpose as it also helps prevent explosive methane/oxygen mixture. This
practice, however, should not be applied in real production since it is difficult to
separate nitrogen later. More economical solutions are using methane, steam or
carbon dioxide as heat carrier. When methane is used, not only we avoid extra
component in the streams but selectivity is also improved as methane/oxygen
ratio is increased. The drawback is more methane need to be separated and
recycled. Steam is also a potential diluent that can be used to control excess heat
as it seems to improve selectivity and can be easily removed by cooling. There
are studies on effect of steam on OCM reaction (Zhusheng, et al., 1996) with
some focus on heat control (Liu, et al., 2008). Carbon dioxide may be a good
diluent since it can react with methane to produce ethylene at lower rate and
absorb some heat from the main reaction (Aika & Nishiyama, 1988). In that case,
the cost of carbon dioxide removal in downstream must be considered.
With the mentioned difficulties, there is a wonder whether OCM process can find
an application in industry (Labinger, 1988) (Ren, et al., 2008). Techno-economic
studies on OCM feasibility with different schemes have been conducted and
criteria have been given in term of selectivity and conversion. For example,
Suzuki et al. (Suzuki, et al., 1996) concluded that “the optimal performance of
the OCM catalyst is 30% methane conversion and 80% C2+ selectivity under some
Page 26
9
inverse correlation of conversion and selectivity”. Hoebink et al. also confirmed
that OCM as an add-on unit to naphtha cracker is economically feasible at this
reactor performance (Hoebink, et al., 1995). However, these numbers should be
updated as technology advances and market changes. In this chapter, a quick
calculation is presented to estimate the profitability of OCM process based on
comparing revenue and operating cost. Although does not cover all financial
matters, it is a good indicator for choosing among alternatives and finding out
which part of the process should be improved. For simplification we only focus
on raw material and utility cost of major steps in OCM process. With the
exclusion of minor costs and financial terms, we do not expect a full techno-
economic assessment of OCM process as it is out of the scope of this thesis.
Instead, lower limits of ethylene price produced by OCM or minimal performance
of profitable OCM are estimated. Readers interested in more comprehensive
economic evaluation of OCM combining with different productions such as
formaldehyde can find information in (Salerno, 2013).
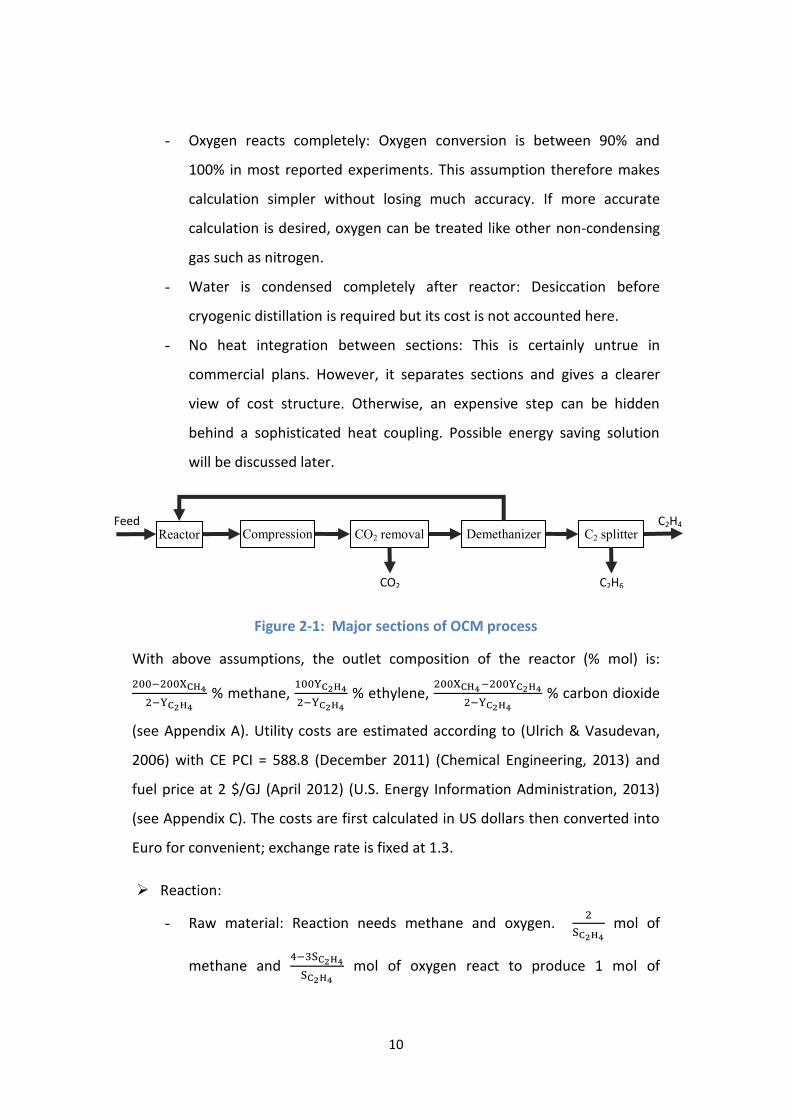
Many schemes combining OCM with ethane cracking, naphtha cracking,
oligomerization… were proposed. Their common steps, which form the basic
OCM process, are: reaction, compression, carbon dioxide removal and ethylene
separation as depicted in Figure 2-1. Operating costs per weight unit ethylene of
these steps are calculated based on conversion and ethylene selectivity with the
following assumptions:
- Carbon dioxide removal and ethylene separation utilise typical
technology: absorption and cryogenic distillation, respectively.
- For simplification, only two main reactions are considered at the
beginning: OCM reaction to ethylene (1.1) and combustion to carbon
dioxide (1.4). Later, ethane production (1.2) as well as the influence of
hydrogen and carbon monoxide will be considered.
Page 27
10
- Oxygen reacts completely: Oxygen conversion is between 90% and
100% in most reported experiments. This assumption therefore makes
calculation simpler without losing much accuracy. If more accurate
calculation is desired, oxygen can be treated like other non-condensing
gas such as nitrogen.
- Water is condensed completely after reactor: Desiccation before
cryogenic distillation is required but its cost is not accounted here.
- No heat integration between sections: This is certainly untrue in
commercial plans. However, it separates sections and gives a clearer
view of cost structure. Otherwise, an expensive step can be hidden
behind a sophisticated heat coupling. Possible energy saving solution
will be discussed later.
Figure 2-1: Major sections of OCM process
With above assumptions, the outlet composition of the reactor (% mol) is:
% methane,
% ethylene,
% carbon dioxide
(see Appendix A). Utility costs are estimated according to (Ulrich & Vasudevan,
2006) with CE PCI = 588.8 (December 2011) (Chemical Engineering, 2013) and
fuel price at 2 $/GJ (April 2012) (U.S. Energy Information Administration, 2013)
(see Appendix C). The costs are first calculated in US dollars then converted into
Euro for convenient; exchange rate is fixed at 1.3.
Reaction:
- Raw material: Reaction needs methane and oxygen.
mol of
methane and
mol of oxygen react to produce 1 mol of
Reactor Compression CO2 removal Demethanizer C2 splitter Feed
CO2
C2H6
C2H4
Page 28
11
ethylene,
mol of carbon dioxide and
mol of water. On
weight basis,
tonnes of methane and
tonnes of oxygen
are consumed to produce 1 tonne of ethylene (see Appendix A).
Methane price in April 2012 is approximately 140 €/t (U.S. Energy
Information Administration, 2013) and the price of oxygen from pipeline
is about 30 €/t (Rameshni, 2002). Pure oxygen is chosen over air
because OCM process with nitrogen dilution is economically inferior
(Eng & Chiang, 1995). Depending on particular situation building Air
Separation Unit (ASU) may be more economical than buying oxygen,
that option will be considered later.
- Utilities: Feed gas must reach reaction temperature before entering
reactor. Heating is partly done by hot reactor outlet in a waste heat
exchanger and then completed in a furnace, which requires additional
fuel. The amount of fuel depends on design, which must balance
between fuel cost and capital cost of the waste heat exchanger. It is
reasonable, though may not optimal, to let waste heat exchanger to
heat the feed up to half of reaction temperature (300OC – 400OC) and
furnace do the rest. With the feed consists of
tonnes of methane
and
tonnes of oxygen for each tonne of ethylene (see
Appendix A), fuel consumption of the furnace is approximately
GJ for each tonne of ethylene, assuming 90% efficiency
(see Appendix B). If inert gas is added, this additional gas also needs
heating. About
MJ is released by reactor when producing
1 kmol of ethylene. On weight basis, cooling duty is
GJ for
each tonne of ethylene produced (see Appendix B). Suppose that
Page 29
12
reaction heat is utilized to produce high pressure steam, the cost of
each GJ transferred is 0.05 € (see Appendix C).
Compression: Most OCM experiments were conducted at atmospheric
pressure. Cryogenic demethanizers operate between 10 and 30 bar
(Zimmermann & Walzl, 2012), with higher pressure means more
compressing cost but less chilling cost. Carbon dioxide absorption works in a
wide range of pressure, from near atmospheric for flue gas treatment to
more than 70 bar as in LNG plants. Higher pressure usually has good effect
at absorption process and can help saving steam used in striper reboiler (at
the cost of compressing). However, in case of OCM, too high pressure leads
to significant loss of ethylene. When compressor is driven by electric motor
with 90% efficiency, electricity consumption varies from 0.08 kWh/Nm3 gas
(compress to 10 bar, polytropic head = 24km) to 0.12 kWh/Nm3 gas
(compress to 30 bar, polytropic head = 36km). Electricity price is 0.075
€/kWh (see Appendix C). For 1 tonne of ethylene production, totally
Nm3 need to be compressed (see Appendix B). If inert gas is
added, this additional gas must be compressed too.
Carbon dioxide removal:
tonnes of carbon dioxide are co-
produced along with 1 tonne of ethylene (see Appendix A). Carbon dioxide is
removed from reaction product by regenerative solvent (alkanolamines) and
once-through (caustic wash) scrubbing. Operating alkanolamines absorption
system requires steam, make-up water and electricity for solvent pump
(solvent loss is not accounted). Make-up water account for a minor portion
of operating cost. Electricity and steam consumptions depend on
technology. Amine Guard FS technology by UOP is claimed to be able to
achieve carbon dioxide level below 50 ppm with reboiler duty at 1 tonne
steam/tonne carbon dioxide (UOP, 2009). Electricity consumption ranges
Page 30
13
between 0.3 and 0.4 kWh/t carbon dioxide for each bar difference between
absorber and stripper. Steam price is 5.67 €/t and electricity price is 0.075
€/kWh (see Appendix C). It is impossible with alkanolamines alone to lower
the concentration of carbon dioxide to ppm level, which is required for
cryogenic process. In any case a fine purification consisting of a caustic wash
unit is needed to reach the required carbon dioxide specification. Assuming
regenerative scrubbing can reduce carbon dioxide concentration to less than
50 ppm, each Nm3 of hydrocarbon needs about 0.1 g of caustic soda for fine
carbon dioxide removal. In undiluted cases,
kg of
caustic soda is spent for each tonne of ethylene produced (see Appendix B).
The amount increase in case of non-condensing gases dilution. Caustic soda
price is approximately 3 €/kg.
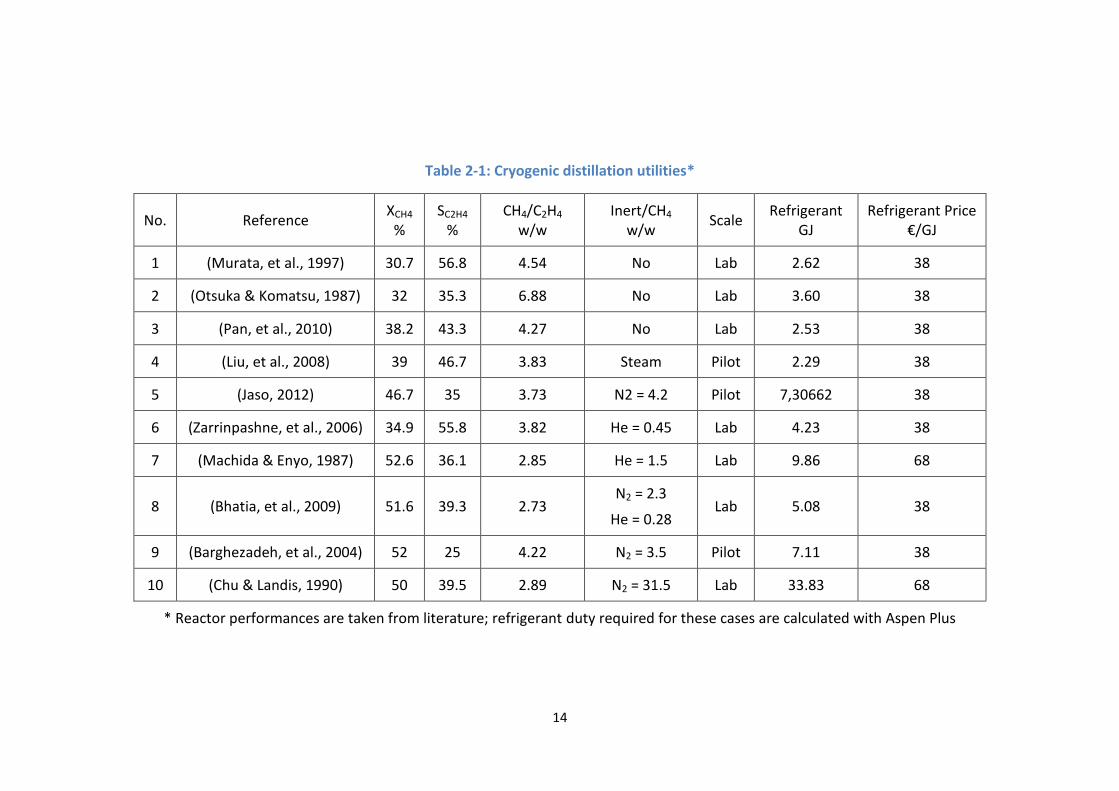
Ethylene separation: 1 tonne of ethylene must be separated from
tonnes of methane. Cryogenic distillation requires refrigerant for condenser
while reboiler is usually coupled with a gas cooler. Refrigerant price depends
on dilution as well as operating pressure. Utility requirement can be
estimated from a distillation design based on desired ethylene purity and
recovery. In the Table 2-1 are calculations of utilities required for each tonne
of ethylene with examples from literature when the column operates at 30
bar, purity and recovery are both 99%. The calculation based on Aspen Plus®
simulation, any other tool for distillation design can be used instead.
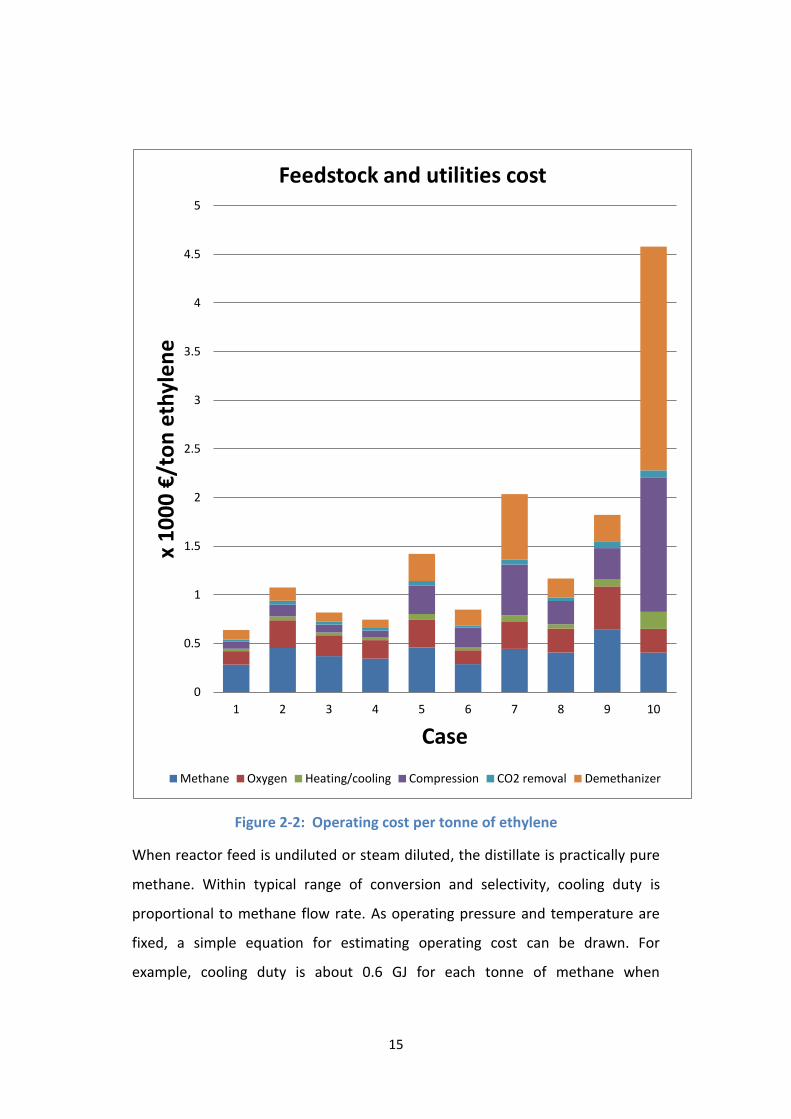
The operating costs of 10 cases are demonstrated in Figure 2-2. The figure shows
that large amount of non-condensing gas (cases 5, 7 – 10) makes operating cost
higher than ethylene price while operating cost is less than 1000 € in most
undiluted cases. Once again, we can see that nitrogen/helium dilution is not a
choice for commercial OCM. It also worthy notice that reactor cooling does not
impose much operating cost, its technical difficulty reflects more in capital
expense.
Page 31
14
Table 2-1: Cryogenic distillation utilities*
No. Reference XCH4
% SC2H4
% CH4/C2H4
w/w Inert/CH4
w/w Scale Refrigerant
GJ Refrigerant Price
€/GJ
1 (Murata, et al., 1997) 30.7 56.8 4.54 No Lab 2.62 38
2 (Otsuka & Komatsu, 1987) 32 35.3 6.88 No Lab 3.60 38
3 (Pan, et al., 2010) 38.2 43.3 4.27 No Lab 2.53 38
4 (Liu, et al., 2008) 39 46.7 3.83 Steam Pilot 2.29 38
5 (Jaso, 2012) 46.7 35 3.73 N2 = 4.2 Pilot 7,30662 38
6 (Zarrinpashne, et al., 2006) 34.9 55.8 3.82 He = 0.45 Lab 4.23 38
7 (Machida & Enyo, 1987) 52.6 36.1 2.85 He = 1.5 Lab 9.86 68
8 (Bhatia, et al., 2009) 51.6 39.3 2.73 N2 = 2.3
He = 0.28 Lab 5.08 38
9 (Barghezadeh, et al., 2004) 52 25 4.22 N2 = 3.5 Pilot 7.11 38
10 (Chu & Landis, 1990) 50 39.5 2.89 N2 = 31.5 Lab 33.83 68
* Reactor performances are taken from literature; refrigerant duty required for these cases are calculated with Aspen Plus
Page 32
15
Figure 2-2: Operating cost per tonne of ethylene
When reactor feed is undiluted or steam diluted, the distillate is practically pure
methane. Within typical range of conversion and selectivity, cooling duty is
proportional to methane flow rate. As operating pressure and temperature are
fixed, a simple equation for estimating operating cost can be drawn. For
example, cooling duty is about 0.6 GJ for each tonne of methane when
0
0.5
1
1.5
2
2.5
3
3.5
4
4.5
5
1 2 3 4 5 6 7 8 9 10
x 1
00
0 €
/to
n e
thyl
en
e
Case
Feedstock and utilities cost
Methane Oxygen Heating/cooling Compression CO2 removal Demethanizer
Page 33
16
distillation operates at 30 bar. Table 2-2 shows operating cost per tonne ethylene
of each section depend on selectivity and yield when operating pressure in
downstream section is 30 bar:
Table 2-2: Operating cost summary
Item Price* Amount Total price, €
Reaction
Methane 140 €/t
Oxygen 30 €/t
Heating 2 €/GJ
Cooling 0.05
€/GJ
Compression 0,009
€/Nm3
CO2 removal
Pump** 0,9 €/t
Steam 5.67
€/t
Caustic soda 3 €/kg
Demethanizer
Refrigerant 38
€/GJ
Total
* Utilities prices are calculated according to (Ulrich & Vasudevan, 2006) at CE PCI = 588.8
and fuel price at 2 $/GJ
** Pumping cost per tonne carbon dioxide
The total operating cost in this case can be estimated according to the equation:
Page 34
17
(2.1)
So far, only methane, ethylene and carbon dioxide are considered. Other
components such as carbon monoxide, hydrogen, oxygen,… are less important
but also affect plan operation. Their effects are discussed shortly here:
- Water: Water is condensed right after reactor and does not affect
downstream process significantly. Gas stream must be completely dry
before enter cryogenic section. There are many techniques for this
purpose: absorption, adsorption, for instance. Water adds some
operating cost but not significantly.
- Carbon monoxide, hydrogen, oxygen and non-condensing gases: These
gases add to gas flow rate through all downstream sections and increase
equipment size as well as compression duty, heat transfer duty,… They
are removed at the top of demethanizer column along with methane.
There they reduce the partial pressure of methane and thus reduce
distillate temperature and increase refrigerant price. Precise calculation
requires exact amount of these gases, which is not always available,
especially hydrogen. Approximate numbers can be estimated from
conversions of methane and oxygen and selectivity of ethylene, ethane
and carbon dioxide.
- Ethane: Ethane and ethylene have similar properties and can be
considered the same in carbon dioxide absorption and demethanizer
sections. Therefore operating cost per unit C2 can be obtained by
replacing SC2H4 and YC2H4 by SC2 and YC2 in the calculation above. The
operating cost per unit ethylene is then obtained by dividing the result
by C2H4/C2 ratio and added with cost of C2-fractionation. The operating
cost of C2-fractionation can be estimated by distillation design, similar to
demethanizer. Equation is modified considering ethane formation:
Page 35
18
(2.2)
When fractionation takes place at 30 bar, condenser duty can be up to 40 GJ/t
ethane depends on feed composition and particular design. With the price of
refrigerant at -30OC is 2 €/GJ, operating cost can be estimate from equation (2.2):
(2.3)
Equation (2.3) can be shortened to:
(2.4)
The formation of ethane reduces compression and carbon dioxide removal cost
because volumetric flow rate and carbon dioxide are reduced, but cost of C2
fractionation is added. Overall producing additional ethane saves around
€/t ethylene.
- Acetylene: Acetylene is produced by OCM reaction (0.62 % selectivity in
case 1). The amount is too small to be considered as a valuable product
but it leads to some difficulties in alternative separation techniques as
described in the later part. In conventional ethylene plants, acetylene is
hydrogenated to ethylene.
- Higher hydrocarbons: The amount of higher hydrocarbons is
insignificant and should be only considered in more detailed
calculations.
Equation (2.1) shows that operating cost depends mostly on yield and selectivity.
The importance of selectivity is at the same level with yield or even higher
although the later is more concerned in literature. For example, operating cost
increase 215 €/t ethylene when yield decreases from 20% to 10% and 499 €/t
ethylene when selectivity decreases from 60% to 30%. The reason is raw material
Page 36
19
(methane and oxygen), of which cost depends solely on selectivity, constitute the
major of operating cost in undiluted/steam diluted cases. This fact is clearly
demonstrated in Figure 2-2: All cases with selectivity less than 40% require more
than 1000 €/t operating cost although yield can be high (cases 2, 5, 7 – 9);
operating cost of case 1, the one with highest selectivity, is significantly lower
than the others although best yield is not achieved in this case. However, even in
this case, the OCM process is still not attractive enough in comparison with other
technologies. If a limit of the operating cost in equation (2.1) is set, requirement
of selectivity can be calculated from given yield or vice versa. This limit varies
with region and time. For example, average cost of ethylene production in
Southeast Asia, where naphtha is main raw material, in 2011 is about 580 €/t
(Source: Dow). In order to be considered by ethylene producers in this region,
operating cost of OCM process should not excess 580 €/t. If ethylene yield is 20%
(almost the best experimental result reported), the selectivity must be at least
60%. On selectivity – conversion (S – X) or selectivity – yield (S – Y) planes, the
real performance of OCM reactors can be represented by points while minimum
required performance is represented by hyperbolic curves. All points under the
requirement curve are disqualified for profitable ethylene production. In Figure
2-3 are the minimum required conversion and yield versus selectivity with the
limit of 580 €/t and case 1 – the best case in Table 2-1. When ethane production
is taken into account, more accurate analysis can be conducted in a similar way
using equation (2.4). As ethylene/ethane ratios are usually more than 2 in
undiluted results, the difference between equation (2.1) and (2.4) is less than 30
€. It is clear that none of the listed cases meets the requirement, even though we
did not count the cost of non-condensing gases yet.
Page 37
20
Figure 2-3: Required conversion and yield versus selectivity
After three decades of development, it seems that the limit of catalyst has been
approached. In the near future, we cannot find a performance point higher than
the requirement curves in Figure 2-3. Instead, it is more feasible to make these
curves lower than the existing performance points. This can be done in two
ways. The first way is raising ethylene price and/or lowering methane and
utilities prices, which is totally out of the scope of this work. The second way is
redesigning the whole process to save utilities and reduce production cost. In
this way, the first option to be considered is heat integration. In conventional
ethylene plant, combining cracking furnace with turbine and process steam
generator and other sophisticated heat integration led to nearly 50% reduction
of energy consumption compared to the early 1970s (Zimmermann & Walzl,
2012). Waste heat from furnace is almost enough to drive the whole
downstream process (Zimmermann & Walzl, 2012). In OCM, reactor is also the
most energy intensive unit. Assuming methane conversion and ethylene
selectivity are 40% and 50% respectively, energy released by reaction and
utilities required in downstream sections for producing 1 tonne of ethylene (30
bar downstream) are given in Table 2-3.
10%
20%
30%
40%
50%
60%
70%
50% 60% 70% 80% 90% Ethylene selectivity
Conversion
Yield
Case 1 - Conversion
Case 1 - Yield
(Murata, et al., 1997)
Page 38
21
Table 2-3: Energy requirement
Equipment Duty Energy needed, GJ
Assumption Amount Type Amount Form
Reactant heater 7.5 Heat 90% furnace efficiency
Reactor -73.6 Heat
Compressor 7200 Nm3 Gas 3.2 Work Polytropic head = 36km
Solvent pump 17 kWh Electricity 0.0612 Work
Stripper reboiler 3.2 tonne Steam 6.5 Heat
Distillation
condenser 2.1 GJ Refrigerant 7 Work COP = 0.3
Heat coupling between reactor and reboiler will be quite cheap and easy since
reactor operates at a much higher temperature than reboiler. On the other hand,
utilisation of reaction energy to compress gas and refrigerant is not so
straightforward. Energy in the form of high pressure steam produced from
reactor can be converted into work by steam turbine. Although large scale
turbines in power plant can reach 30% efficiency, about 10% efficiency should be
expected in case of waste heat recovery from reactor. Because work required by
compressors is in excess of 10% of reaction heat, extra fuel is necessary although
energy produced by reactor is far more than required in downstream processing.
Beside energy, capital cost is also a big burden: Steam turbines cost hundreds
€/kW while chilling under -100OC usually needs two or three refrigerants in
cascade which means more compressors are needed. Totally, investment in
turbomachinery can exceed hundreds million Euros.
Another option of redesigning process is adding an Air Separation Unit (ASU) and
avoiding paying for oxygen. Although air is free, ASU requires huge initial
investment and energy to operate – 245 kWh/t oxygen according to Linde
(Beysel, 2009). Hence the saving is only remarkable if free energy in the form of
mechanical work – approximately 5 GJ/t ethylene – is available. Unfortunately,
downstream processing already consumed all of this precious energy as
calculated above. To summarise, the most possible way of reducing ethylene
production cost is saving energy by utilisation of waste heat. However, since
Page 39
22
mechanical work requirement is too much, the cost will be still high. When
depreciation and financial costs like loan interest are taken into account,
conventional OCM process will be definitely screened out of any business plan.
2.2. Alternatives Overview
So far OCM has not made its way into industry. The reason is that OCM reaction
performance is far inferior to other ethylene producing reaction: The best yield
of OCM reaction is about 20% with less than 60% selectivity while commercial
ethane crackers convert more than 65% ethane with 80% selectivity. The results
is ethylene makes up more than half of ethane cracking product while it is only
10% in case of OCM. In downstream of ethane cracker, less than one tonne of
gases needs removing from one tonne of ethylene but this number is nine in case
of OCM. With the same technologies used in conventional ethylene plant, there
is no way OCM process can deliver ethylene at a competitive price. The analysis
above shows that the most problematic step is cryogenic distillation. It is not
only costly, both capital and operating costs, but also sensitive to non-
condensing gas dilution as can be seen in Figure 2-2. Although nitrogen dilution
will not be implemented, non-condensing gases such as hydrogen, carbon
monoxide and nitrogen as impurity is unavoidable and significantly increase the
cost of separation. In order to produce ethylene economically by OCM, cryogenic
distillation needs to be replaced by another technology. Three technologies have
been considered:
Absorption: Large cost of low hydrocarbon distillation comes from very low
temperature and high pressure condition, which is required for the
occurrence of liquid phase. In absorption, liquid phase is artificially added
and components dissolve or form chemical bond with the solvent in normal
condition. Solvent is later regenerated in stripper which also works at
normal condition. A solvent that selectively dissolves or reacts with
hydrocarbons is the key of success. Early attempts utilised liquid
Page 40
23
hydrocarbon such as gas naphtha (Eldred, 1923) but later ones focused on
transition metallic salts which can form complex with ethylene or other
molecules contain π bonds. Among them silver and cuprous solutions are
considered the best (Keller, et al., 1992). Silver salts such as silver nitrate
soon caught the attention (Davis & Francis, 1937) (Francis, 1949) thanks to
their solubility and availability in laboratory. High price and the fact that
silver ion – Ag+ is easily reduced by reducing agents, e. g. hydrogen or even
construction material of the equipments, hamper their large scale
applications. Common contaminants also affect the operability: hydrogen
sulphide reacts irreversibly with Ag+ to form silver sulphide and lead to silver
loss; acetylene reacts with Ag+ regardless of the anion present (Keller, et al.,
1992) and forms silver acetylides, which is extremely unstable and present a
detonation hazard when dry (Safarik & Eldridge, 1998). Thorough removal of
these contaminants before olefins separation is necessary but even 1 ppm
acetylene is still dangerous because silver acetylides will continuously build
up. Many efforts have been made to overcome these difficulties. For
example, organic solvent such as ethylene glycol or aceto-nitrile can be used
instead of water to reduce the hydration of silver ions, freeing them to
complex with olefins (Friedman & Stedman, 1945). The improvement
however did not reach “the extent desired for commercial operations”
(Strand, 1950). Other ways are using aqueous solution with additives:
monobutylamine nitrate (Strand, 1950) and phenol (Cole, 1950) increase
absorptivity; ferric nitrate (Shaw, 1949) (Pirovano, et al., 2002) and hydrogen
peroxide (Marcinkowsky, et al., 1979) prevent silver reduction while
acetylene can be dealt with by using mercuric nitrate (Shaw, 1949) or silver
permanganate (Marcinkowsky, et al., 1979). Other silver salts such as
fluoborate and fluosilicate (Van Raay & Schwenk, 1959),
hexafluorophosphate and hexafluoroantimonate (Quinn, 1965),
trifluoroacetate (Alter & Bruns, 1982) with additives such as nitric acid
Page 41
24
(Baxter, 1965), hydrogen fluoride or fluoboric acid (Baxter, 1963) were also
considered. Bimetallic salt was report to have both higher absorptivity and
stability (Baker & Knaack, 1961). Although there are different ways to cover
the disadvantages of silver salt solution, they are laborious and negatively
impact the process economic (Nijmeijer, 2003). In contrast to silver, cuprous
(Cu+) salts are cheap, for example AgBF4 solution is over 60 times more
expensive than CuNO3/ethanolamine (Miller, 1969), but insoluble in water
so hydrochloric acid (Gilliland, 1945) (Bernard & Bond, 1948), ammonia
(Robey, 1941) or organic solvents such as pyridine (Robey, 1941),
methanol/ethanolamine mixture (Evans & Scheibli, 1945), orthophenetidine
(Ray, 1952), MEA (Cobb, 1958), acetic anhydride (Uebele, et al., 1970),
xylene (Cymbaluk, et al., 1992) are used. Unfortunately, these solvents
degrade in the presence of contaminants or pose serious problem with
corrosion (acid) or high volatility (ammonia). The addition of pre-treatment
steps makes the technology economically impractical (Eldridge, 1993).
Copper acetylides are also dangerous like silver acetylides (Safarik &
Eldridge, 1998). Another problem with cuprous salt, which does not occur in
case of silver salt, is disproportionation which converts Cu(I) into Cu(II) and
metallic copper and leads to absorbent degradation. As in the case of silver,
different cuprous salts were investigated: chloride (Joshua & Stanley, 1935)
(Francis & Reid, 1948), benzenesulfonate (Robey, 1941), nitrate (Cooper &
Small, 1997), dodecylbenzenesulfonate (Tabler & Johnson, 1977) (Brown &
Hair, 1993), diketonate (Ho, et al., 1988), carboxylate (Cymbaluk, et al.,
1996) or bimetallic salt (Long, et al., 1972). The common problem with all
cuprous salts is the co-absorption of carbon monoxide. Thus absorption with
cuprous salt cannot produce high purity required in polymer grade (Barchas,
et al., 1999). Up to now olefin separation based on absorption is limited to
“very few examples” (Pirovano, et al., 2002). More detail on olefin/paraffin
separation by absorption can be found in (Reine, 2004).
Page 42
25
Membrane: Membrane separation operates at high pressure but normal
temperature. Hence major investment and running costs on cold-box are
saved. Different types of membrane like polyimide (Hayashi, et al., 1996)
(Staudt-Bickel & Koros, 2000) (Okamoto, et al., 1999), polyphenylene oxide
(Ilinich & Zamaraev, 1993), polysulfone (Park, et al., 2000) or cellulose
acetate (Ryu, et al., 2001) have been used but separation factors are too low
to be attractive for industrial purposes. Silver impregnated membranes were
developed, trying to improve selectivity via complexation (Steigelmann &
Hughes, 1973) (Hsiue & Yang, 1993) (Yang & Hsiue, 1997) (Hong, et al., 2001)
(Pinnau & Toy, 2001) (Morisato, et al., 2002) (Kang, et al., 2009). They face
similar problems as with absorption counterpart. More detail on
olefin/paraffin separation by membrane can be found in (Nijmeijer, 2003).
Adsorption: Adsorption was considered for olefin separation seventy years
ago (Kiesskalt, 1944) (Kiesskalt, 1944). Thermal swing adsorption (TSA) had
been the favourable process due to limitation of compression technology
but pressure swing adsorption (PSA) has been getting more preferred
because of smaller bed inventory. The most suitable sorbents for physical
adsorption are zeolitic while π-complexation sorbents are the best choice for
chemical adsorption. Zeolite 4A was used in commercial PSA process
(Petrofin process) for recovery of propylene. However this process has been
discontinued because the low selectivity of zeolite limits purity and recovery
of single step separation (Rege, et al., 1998) while low capacity renders
multi-steps separation impractical. Chemical adsorption processes can
achieve better performance owes to higher selectivity of π-complexation
sorbents (Yang, 2003). However, those sorbents also met the problem of
contaminant like in the case of absorption and membrane technology. In
addition, irreversible degradation of Cu+ sorbents when exposure to both
water and oxidizing agents make them unsuitable for OCM process
(Miltenburg, 2007). Regeneration is more difficult due to higher bond energy
Page 43
26
compare to physical adsorption. Several attempts to apply adsorption to the
downstream of OCM reactor have been made (Tonkovich, et al., 1993)
(Baronskaya, et al., 1996) (Kruglov, et al., 1996) (Machocki, 1996) (Bjorklund,
et al., 2001) (Kundu, et al., 2009) (Schwittay, et al., 2001). Since they also
met the problems as with general olefin separation, the improvements were
limited.
In all alternative methods, a third agent (solvent, adsorbent or membrane) is
introduced so that separation can take place without extreme condition. Agents
based on π-complexation (more details on π-complexation adsorbent can be
found in (Yang, 2003)) show the best performance regardless of method thanks
to the moderate bond energy: strong enough to give high selectivity but weak
enough for the process to be reversible (agent regeneration). Unfortunately, the
activeness of transition metal ions (Ag+ and Cu+) makes these agents easy to
degrade in the presence of contaminants. This is the reason why traditional
cryogenic distillation still dominates chemical and refining industry despite
numerous optimistic outlooks on non-distillation processes. There are two ways
to improve these processes. The first one is developing stable materials based on
π-complexation, for example by adding inhibitor to prevent degradation. The
second is developing high performance process based on less selective but stable
materials. In this work, the second approach is chosen for adsorption process.
2.3. Conceptual development
When third agent is utilized for separation, components are selectively bound to
the agents (absorbed, adsorbed…) and then released. These two processes can
happen at the same time in different places, e. g. absorber/striper in absorption
technique or two sides of membrane in membrane technique. In adsorption
these processes usually happen in the same place but at different time due to
problem with handling solid material. In physical processes, bound components
are released by pressure decrease and/or temperature increase. If no other
Page 44
27
measure is taken, pressure or temperature change must be very big to achieve a
reasonable mass transfer rate. For example, pressure difference is 100 bar in
Separex, the membrane technology by UOP to remove carbon dioxide. To
accelerate releasing process without such a big change, extra manipulation is
necessary. It can be either partial solvent vaporization in absorption technique or
using sweep gas in adsorption technique. In most cases, unbound components
are collected during binding process (raffinate) and bound components are
collected during the reversed one (extract). Separation performance therefore
depends heavily on the selectivity of binding process. If selectivity is low, more
stages are required for high purity and recovery. As selectivity of two
components A and B can be defined as
with Q is adsorption capacity, a
sorbent with QA >> QB is desired. Big QA also means less sorbent is needed. There
are several ways to increase selectivity for a given material:
- Pressure change: Adsorption capacities decrease along with pressure at
different rates depends on the component. For olefin/paraffin,
selectivity is highest in Henry region where absolute pressure is less
than 10 kPa. Such a low pressure is unacceptable because of difficulties
with vacuum technology and too large volumetric flow rate.
- Temperature change: Adsorption capacities increase when temperature
decreases, also at different rates depends on the component. Lowering
temperature can help increasing both selectivity and capacity at the cost
of cooling. Lowering temperature also slows down mass transfer, which
is not desired. In practice, there is a critical temperature below which
refrigeration must be used instead of simple cooling methods by air or
water.
- Kinetic adsorption: When retention time is short, the adsorbed amount
is less than maximum capacity. In that case selectivity can be written as
where kA and kB are less than 1 and proportional to the adsorption
Page 45
28
rates of the components. Selectivity increases if kA > kB but more
sorbent is required as the trade-off. Rege et al. (Rege, et al., 1998)
demonstrated that kinetic adsorption with zeolite 4A is not good
enough for commercial olefin/paraffin separation.
- Competitive adsorption: Since cryogenic condition can be avoided by
adding sorbent as a third agent, one can think about introducing more
components into the system to modify adsorption behaviour.
Competitive adsorption is an usual mechanism that can explain the
effect of additional components: Since total capacity for all components
are limited (due to finite surface area, pore volume,…), components
compete with others to occupy adsorption sites. Hence extra
components reduce adsorption capacity of the main components to a
certain extent depends on affinity. Higher affinity of the main
components means less reduction and selectivity,
, increase if A is
more strongly adsorbed than B. This idea has been successfully applied
in analytic chemistry when A needs to be separated from B. For
example, tailoring fluid phase composition is a common practice to
improve performance of HPLC separation. However, in production,
when A needs to be separated from all other components, this
technique may lead to more separation steps and the selectivity
improvement does not pay out. In case of OCM process, this problem
can be solved by choosing carbon dioxide as the extra component. As
carbon dioxide removal is already required, adding carbon dioxide does
not impose any new separation step, only the sequence of gas
treatment need changing: carbon dioxide removal takes place after
demethanization. This is the key idea of the proposed solution.
Solving selectivity problem is only half the way to a successful separation,
desorption process also needs careful design to ensure efficiency. Other than
Page 46
29
high purity and recovery, short time and low energy consumption are desired
because of economic reason. An important point which is usually ignored in
academic research is simple operation. The simpler the more robust a process is.
For example, some Temperature Program Desorption (TPD) processes perform
well in laboratory but cannot be scaled up as a result of limitation on heat
transfer which is only remarkable in large bulk.
As mentioned above, sweep gas is necessary to speed up desorption. For this
purpose, feed or ‘light’products (less adsorbed gases) are typically used.
Although convenient, this choice tends to lower the purity of ‘heavy’ product
(more adsorbed gases). To overcome this, extra gases can be used but
introducing new components into system means more separation steps are
required to remove them later. Nitrogen and C4 – C5 hydrocarbons were
considered as sweep gas for adsorptive olefin/paraffin separation (Jarvelint &
Fair, 1993) (Thomas & Crittenden, 1998). In those cases, two distillation columns
are added for olefin/sweep gas and paraffin/sweep gas separation: we come
back to distillation solution. In this work, we proposed to use carbon dioxide as
sweep gas to avoid such extra separation step. More over, using carbon dioxide
give a chance to purge column without compressor as shown later. Since carbon
dioxide is adsorbed, ethylene will desorb faster and outlet concentration will be
higher than using inert sweep gas. However, if carbon dioxide is adsorbed too
strongly, there will be trouble desorbing it later. With these ideas, a new scheme
for OCM downstream is drawn in Figure 2-4.
Figure 2-4: New scheme of OCM process
Reactor Adsorption CO2 removal
C2 fractionation
Feed
CO2
C2H6
C2H4
Page 47
30
2.4. Process flow development
Based on the scheme in Figure 2-4, more detailed process flow diagrams (PFD)
are developed, focusing on adsorption, carbon dioxide removal and utilisation of
unconverted methane. In order to avoid costly compression, adsorption and
carbon dioxide removal are performed at pressure similar to reactor.
2.4.1. Adsorption
Adsorption cycle essentially consists of two steps:
1. Ethylene adsorption: The dried, cooled downstream of reactor is fed to
adsorption column. Cooling temperature is chosen to balance adsorption
capacity and rate. Degree of dryness depends on adsorbent: hydrophilic
ones need desiccation while hydrophobic ones require only conventional
drying. During this step, the outlet of adsorption column comprises
methane, carbon monoxide, hydrogen,… and a part of ethane. The amount
of carbon dioxide in the outlet depends on particular design.
2. Ethylene desorption: Carbon dioxide is fed to adsorption column. At the
beginning, the outlet still comprises methane, carbon monoxide, hydrogen,…
and will be mixed with the outlet from the first step. The outlet later
contains carbon dioxide, ethylene and a part of ethane. It is put through
carbon removal section to retrieve ethylene. This step take place until all
ethylene is desorbed.
In case carbon dioxide is strongly adsorbed, an extra step to desorb carbon
dioxide is necessary:
3. Carbon dioxide desorption: When carbon dioxide is adsorbed too strongly, it
must be desorbed using sweep gas and/or increasing temperature. Air can
be chosen as it is free but air blower is needed. When this step is employed,
carbon dioxide can be desorbed completely and the outlet of the first step is
Page 48
31
free of carbon dioxide. Otherwise carbon dioxide concentration in that
outlet will be high.
For continuous production, multiple columns are implemented.
2.4.2. Carbon dioxide removal
Carbon dioxide removal section separates carbon dioxide from the outlet of the
second step in adsorption process. Carbon dioxide is recycled to purge
adsorption column and the remaining is put to C2 fractionation section to
separate ethylene and ethane. In order to recycle carbon dioxide without any
booster, the stripper is operated at higher pressure than absorber. The elevated
pressure required for circulation is achieved by solvent pump instead of gas
compressor. The cycle of carbon dioxide is similar to Rankine cycle. Caustic wash
is necessary for fine carbon dioxide removal. Additionally, carbon dioxide may be
removed from one of these streams:
If adsorption process consists of only two essential steps then the outlet of
the first step contains large amount of carbon dioxide and need carbon
dioxide removing before recirculation. Carbon dioxide removal may be not
necessary if this outlet is put to another process instead of circulated back to
OCM reactor.
If adsorption process consists of three steps then the outlet of the third step
is a mixture of carbon dioxide and air. It can be vented directly or carbon
dioxide can be separated and stored to reduce emission if it is possible, e.g.
in oil field or coal seam.
These additional removals do not need caustic wash because a certain carbon
dioxide contamination can be tolerated.
Page 49
32
2.4.3. Unconverted methane utilisation
Unconverted methane is separated along with carbon monoxide, hydrogen,
ethane,… After removing carbon dioxide (if necessary), it can be mixed with fresh
methane and circulated back to OCM reactor. When methane is received from
high pressure pipeline (> 50 bar), an injector can be used to compensate
pressure drop and methane can be circulated without any other booster.
Unconverted methane can also be used in other processes instead of
recirculation. There are many processes consume methane and can be combined
with OCM, at least one of them should be implemented to prevent inert gas
accumulation. Below are some potential choices which require neither further
separation nor compression:
Combustion: The mixture of hydrocarbons, hydrogen, and carbon monoxide
can be burned to produce energy. This energy can be used for: heating the
feed of OCM reactor up to reaction temperature – ~800OC; driving
compressors for air separation unit or C2 fractionation section; producing
electricity.
Methane reforming: When adsorption process consists of only two steps the
outlet of the first step comprises large amount of methane and carbon
dioxide along with carbon monoxide and hydrogen. Methane and carbon
dioxide can react with each other to produce carbon monoxide and
hydrogen, which are intermediary for various productions. For this purpose,
Midrex technology can be used. As shown in Table 2-4, the feed composition
of Midrex reformer (Mobarakeh plant (Vakhshouri & Hashemi, 2008)) is
compatible with the adsorption outlet. The technology was commercialised
since 1969 and – as claimed by the company – employed for 60% of global
Direct Reduced Iron (DRI) production. A problem with this option is many
important applications of syngas like methanol or ammonia production are
high pressure. In order to avoid expensive compression, only low pressure
Page 50
33
application such as direct iron reduction or Fischer-Tropsch process should
be considered (Fischer-Tropsch process can be operated at either low or
high pressure). This limitation lowers the chance of combining OCM with
syngas consuming process. Moreover, some of them, Fischer-Tropsch for
instance, are already economically challenging. However this option still
worth investigate from the environmental aspect because it consumes
carbon dioxide produced by OCM and reduces emission.
Table 2-4: Feed composition of Midrex reformer, % mol
CH4 C2H6 C3H8 C4H10 H2 H2O CO CO2 N2
14.99 1.4 0.53 0.19 35.02 13.64 18.95 14.24 1.03
2.4.4. Process flow diagram
In Figure 2-5 is process flow diagram with two steps adsorption. Oxygen feed,
reactor outlet cooling and drying as well as waste heat recovery from reactor and
C2 distillation column are not shown for clearer view. Two columns in adsorption
section represent two steps; actual number of columns is calculated in
quantitative design. It can be seen from the diagram that investment on
compressor is greatly reduced. Since C2 only add up to 10 %mol of reactor outlet,
the compressor in C2 fractionation section is ten times smaller than the
mainstream compressor required in conventional downstream scheme. When
using heat-pumped C2 fractionation technique, only one three stages compressor
is employed: C2 mixture is compressed in two stages to 8 bar, ethylene from top
of the column – after heating to ambient temperature in feed-effluent exchanger
– is compressed to 20 bar in third stage then condensed in reboiler and
circulated to the column as reflux. Compare to conventional downstream
processing, three or four mainstream and refrigerant compressors working up to
40 bar are replaced by only one compressor at 20 bar. Lower reflux ratio and less
column trays are required because ethane is partly removed in adsorption
section. Saving on investment and energy consumption is therefore remarkable.
Page 51
34
Reactor
1st step 2nd step
Amine
Absorber
Amine
Absorber
Amine
Stripper
C2 Splitter
Lean Solution
Injector
Furnace
Caustic
Wash
C2
Extract
Rich Solution
Booster Pump
Compressor
Raffinate
Feed
Reaction
Section
Adsorption
Section
Carbon dioxide
Removal Section
C2 Fractionation
Section
Methane
Combustion, Midrex Reformer, ...
C2H4
C2H6
CO2
Sweep Gas
Figure 2-5: Process flow diagram with two steps adsorption
Page 52
35
Chapter 3. Simulation of adsorption process
Chemical engineers are always curious about what happen during processes. This
information is necessary for designing, operating processes and can be obtained
via either experimentation or calculation. Well designed experiments are useful
and crucial to process development. However, they are usually time consuming,
expensive and may raise safety concern in particular when approaching process
limits. Calculation based on mathematic models can compensate these
disadvantages and speed up process development, bring it from a kind of art to a
real branch of engineering. Models vary from simple algebraic equations as in
case of double-pipe heat exchanger to complicated partial differential equations
(PDEs) as in case of fluidized bed reactor. Simple but effective methods exist for
traditional applications such as distillation and allow designing workable units
within a short time calculation giving sufficient thermodynamic information. In
case of adsorption, where processes operate in transient state rather than
steady state, it is more difficult to predict process behaviour from
thermodynamic characteristic. Computer-based simulations are often required,
especially for challenging tasks such as olefin/paraffin separation. Due to
unsteady nature, adsorption processes design requires not only calculating
spatial dimensions but also timing operating actions such as switching inlet and
outlet flows. Modelling then usually involves PDEs, which may be converted into
ordinary differential equation (ODE) or differential algebraic equation (DAE)
system depend on particular mathematic tools. Precise estimation leads to large
number of equations while simultaneous processes with very different rates
make these equations stiff. Adsorption process simulation thus becomes a
challenging problem. Despite many efforts and progresses in this area, a
compromise between details, accuracy and computing cost is still needed. In this
work, simulation is used to study zeolite 4A – the best candidate reported in
literature for olefin/paraffin separation by physical adsorption and activated
Page 53
36
carbon – the most popular sorbent. In the following are major considerations
when simulating adsorption processes and the choices for this work:
3.1. Modelling
3.1.1. Dimension
Four-dimensional space (three-dimensional Euclidean space plus time) is enough
to mathematically model any process include adsorption. Nonetheless, since
chemical processes usually consist of multi phases with distinctive characteristic,
it is a common practice to model each phase with a separate space. Interaction
between phases is then modelled by interface mass/heat transfer equations.
Hence a model with n phases may have up to 3n+1 dimensions. More
dimensions complicate model but do not always bring more benefit. The number
of dimension is therefore usually reduced to a few whenever it is possible:
Taking advantage of symmetry: When the space is symmetric, a symmetric
set of points may have one common value for a physical property and can be
represented by a single point. The number of dimensions then can be
decreased without losing the amount and quality of information. Typical
example are cylindrical vessel which can be modelled with two dimensions –
radius and length – or spherical particle which can be modelled with one
dimesion – radius. In this work cylindrical vessel is chosen as adsorber so the
number of dimensions is reduced by one.
Lumping: Physical properties of points along one dimension can be
considered to have the same value which is determined by conservation
laws. By doing this, the dimension can be taken out of calculation. The
number of dimensions as well as model complexity is then reduced at the
cost of losing details and accuracy. The accuracy can be later improved by
fitting experiment result or adding modification factors. In this work lumping
is applied to both fluid phase and solid phase. For solid phase lumping is
applied to all dimensions of sorbent particle and to radius of sorbent bed. By
Page 54
37
this choice, intraparticle process is simplified. Information such as influence
of pore length or pore diameter to separation process is unknown. Such
information is needed to tailor material but detailed modelling of
intraparticle process requires huge computation effort (Lopez-Isunza, 2013).
As the aim of this work is developing separation process based on available
material, we chose to simplify intraparticle process be cause the lost of
information is not crucial to process design and simulation time must be
short enough for optimisation. Lumping is applied to bed radius for fluid
phase. Mixing effect due to the present of particles makes velocity and
concentration along bed radius more even than the case when gases flow
through empty pipe. Wall effect still affects accuracy but it is ignorable when
bed diameter is sufficiently bigger than particle diameter,
,
which is typical in industry and will be considered in experiment setup
design. On the other hand, too large bed diameter imposes difficulties upon
fluid distribution and renders part of the bed underutilised. This problem is
however less severe in gas application and only remarkable in case of very
shallow bed applications such as rapid pressure swing adsorption (RPSA).
With above choices, the model is mathematically two-dimensional – bed length
and time. In the language of process engineering, it is a dynamic one-
dimensional model.
3.1.2. Material balance
Changing of material in a control volume is caused by convection, diffusion and
interface mass transfer. Flow pattern inside granular bed is complex but can be
expressed in several terms:
- Radial flow: Radial flow is assumed to make an ideal mixing, allowing
lumping along radius as said above.
Page 55
38
- Axial flow: Axial flow is divided into two parts: a plug flow through the
bed and dispersion which includes both molecular diffusion and various
self-induced axial mixing process. Dispersion is less significant in gas
adsorption than liquid adsorption. It is not written explicitly in material
balance equation but the effect is accounted by numerical diffusion as
described later.
Balance equation for component i is written as:
(3.1)
3.1.3. Heat balance
The heating effects of compression and friction are insignificant and ignored.
Temperature changing is assumed only due to inlet/outlet flow and
adsorption/desorption heat which means column wall is completely isolated.
Temperatures of solid and fluid phases are different because of limit heat
transfer rate. However it is impossible to measure these temperatures separately
with our experiment facility. A common temperature in between is then assigned
to both phases. In real process solid temperature will be higher than fluid
temperature during adsorption and lower during desorption. Heat capacity of
sorbent is considered make up the whole heat capacity of a control volume
because gas heat capacity is relatively very small. Heat capacity of column wall is
also ignored, which is acceptable in large diameter column. Temperature of a
control volume is regulated by the equation:
(3.2)
Page 56
39
3.1.4. Fluid dynamic
Fluid velocity plays an important role in the process as shown in above
equations. Because velocity estimation is required many times during process
simulation, it must be accurate for a meaningful simulation result but at the
same time must be simple, otherwise simulation will takes ages to finish. Several
alternatives are frequently used:
Pre-calculation: Velocity is calculated before simulation. This alternative is
usually coupled with constant velocity along the bed because it is difficult to
calculate velocity change along the bed without simulation. Velocity can be
calculated from flow rate, which is known a priori. This alternative is suitable
for liquid adsorption or gas purification where adsorption does not affect
velocity significantly. In bulk separations such as our case, the amount of
adsorbed gas is relatively big and flow rate change remarkably along the
bed. Constant velocity assumption is then not accurate.
From pressure drop, first order polynomial: It is easy to notice that there is
no flow rate without pressure drop and flow rate increases with pressure
drop as long as there is no bed deformation. Consequently comes a simple
but useful assumption: velocity is proportional to pressure drop. The
classical equation by Darcy is well-known:
(3.3)
Although more detail ones such as Kozeny-Carman equation are available,
this simple equation seems more effective with permeability coefficient B
determined empirically.
From pressure drop, second order polynomial: Velocity can be estimated
more accurate by increase the order of the polynomial. This semi-empirical
equation was developed by Ergun for column packed with rings:
Page 57
40
(3.4)
Ergun equation was later extended to other type of packing and even
fluidised bed.
Considering the trade-off between accuracy and computational cost, Darcy law is
adopted for this work with permeability coefficient taken from (Richardson, et
al., 2002). Pressure is calculated from gas concentration using ideal gas law.
3.1.5. Mass transfer rate
During adsorption a molecule is motivated by chemical potential to diffuse from
bulk fluid through laminar boundary around a solid particle to its outer surface.
From there it diffuses through the pores into the particle until being adsorbed.
The process is reserved during desorption. An extensive summary of mass
transfer model can be found in (LeVan & Carta, 2008) with many theories
developed for extraparticle and intraparticle transportation. Complete rate
equations which consider external mass transfer, pore diffusion, solid diffusion,…
are necessary for simulation to exactly follow real processes. Such exhaustive
rate equations are impractical due to not only limitation on simulation time but
also the lack of parameters. Linear driving force approximation based on
adsorbed-phase concentration is therefore chosen to solve the first problem:
(3.5)
In order to overcome the lack of parameters, the rate coefficient si is calculated
based on the slowest transportation step, which is intra-crystal diffusion
(micropore diffusion) in case of zeolite 4A:
(3.6)
Or intra-particle diffusion (macropore diffusion) in case of activated carbon:
Page 58
41
(3.7)
Diffusion coefficient depends on temperature:
(3.8)
3.1.6. Sorption equilibrium
Sorption equilibrium is the first thing to be considered when designing
adsorption process. It is standard to describe sorption equilibrium via isotherms
– the equilibrium between fluid-phase concentrations (partial pressure when
fluid is gaseous) and adsorbed-phase concentrations at a fixed temperature.
Isotherms can be qualitatively classified into five types according to Brunauer
(Brunauer, et al., 1940) or quantitatively estimated by various models: Henry
isotherm (linear isotherm), Freundlich isotherm, Langmuir isotherm, BET
isotherm,… Within a certain range real isotherm can be fitted to any model with
certain accuracy. However it is important to select the model which does not
only match the real isotherms over the entire range of process condition but also
represents the relationship between components, in particular interaction and
order of affinity. Langmuir model is suitable for microporous adsorbents like
zeolite as it matches the favourable isotherm – type I in Brunauer’s classification
– thanks to the analogy between Langmuir’s mechanism and pore filling
mechanism. The difference is Langmuir assumed homogeneous adsorption site
while zeolite pore size, and consequently adsorption characteristic, distributes in
a wide range. To fill in this gap, multi-sites Langmuir isotherm can be used with
each site represent a pore size or a range of size. Once again, the number of sites
should be chosen to balance model accuracy and complexity. Considering
components in this application, dual-site Langmuir (often called Dual-Langmuir)
model is selected for zeolite 4A with one site represents big pores which are
accessible to all molecules and the other represents small pores which are
Page 59
42
inaccessible to hydrocarbons. Multi-component Dual-Langmuir isotherm is
described by the equation:
(3.9)
Parameters of the multi-component isotherm can be approximated by pure gas
isotherms. Since adsorption sites are representative of pores with different sizes,
adsorption capacity Qi varies among components. Pore volume is assumed to be
constant and adsorption capacity is inverse proportional to the specific volume
of adsorbate. The dependence of specific volume on temperature is linearly
approximated:
(3.10)
The Langmuir adsorption coefficient represents the affinity of sorbent for
component. Its dependence on temperature is given by equation (Butt, et al.,
2003):
(3.11)
For the first site, and ΔH1i can be estimated if the values of b1i at two
different temperatures T1 and T2 are known:
(3.12)
Calculation of the second site is similar.
In case of activated carbon, Langmuir model is selected since the pores are
accessible to all gases.
Page 60
43
3.1.7. Operation
Process operation sets the boundary conditions for the simulation problem. Flow
rate, molar fraction and temperature of inlet gas are controlled. That means
and are set as boundary conditions:
(3.13)
(3.14)
Column wall is completely isolated and does not raise any boundary conditions.
Column outlet is connected to a fixed pressure environment (pout) through a one-
way control valve. Outlet flow depends on pressures at both side of the valve.
Boundary condition at outlet is:
(3.15)
In equation (3.15) concentration and temperature are at the end of adsorption
column but velocity is at the valve, velocity at the end of column can be
calculated by multiplying with the ratio between column cross area and valve
orifice. Flow coefficient kV in supercritical and subcritical cases is available in
valve datasheets. The last case represents the one-way property of the valve –
no flow when inlet pressure is less than outlet pressure.
Initial condition can be chosen freely by setting the initial gas phase
concentration, adsorbed phase concentration and temperature at each node of
the spatial mesh as desired. In this work, simulations are conducted with column
initially full of nitrogen and in equilibrium state.
Page 61
44
3.2. Simulation
3.2.1. Numerical solution
The process model is a set of PDEs with 2nc+1 unknown functions: fluid-phase
concentrations, adsorbed-phase concentrations and temperature. Finding its
analytical solutions is in general impossible and the better choice is solving it
numerically via computer simulation. While numerical solutions are only
calculated at finite number of points on a mesh within function domain, the
number of numerical methods is virtually infinite for any individual to study.
They can be classified into three categories:
Finite difference: These methods convert derivative terms into
approximated difference terms. The differential equations of unknown
function are converted to algebraic equations of unknown variables which
are the values of function at grid points. Algebraic equations are then solved
analytically (if possible) or numerically. Finite difference methods are
straight forward in term of mathematic and therefore are the first methods
invented. Difference formulas and techniques such as variable step have
been developed to improve the accuracy of the methods.
Finite element: These methods approximate solution by simple functions
whose parameters are unknown. Substituting these simple functions into
the differential equations produces residual because they are only
approximate solution. The parameters are then calculated to minimise
residuals, which mean solving an optimisation problem. This optimisation
step makes finite element methods more accurate but also computationally
demanding.
Finite volume: In these methods, the differential equations are first
converted into integral equations by integrating over the whole control
volumes around grid points. Volume integrals contain divergence term are
then convert into fluxes using divergence theorem. Function values at grid
Page 62
45
points are considered average values of the control volumes. Once the
formulas relating fluxes and average values are selected and substituted into
the integral equations, algebraic equations with these values as unknown
are achieved. These algebraic equations are solved as in case of finite
difference methods. Finite volume methods are straight forward in term of
physic with conservation laws guaranteed thanks to the nature of the
methods.
Each approach has its own advantages/disadvantages and may overlap the
others in a particular problem. In general no one can tell which approach is
better than the others. With a given mesh elaborated methods can produce
more accurate solution at the cost of computational demand. Meanwhile,
simple methods can also produce more accurate solution by using a finer mesh.
Considering our problem where differential equations and geometry are quite
simple, the second policy is more efficient in term of accuracy versus
computational cost. Finite volume method with fixed step is selected for spatial
discretisation and numerical differentiation formulas with variable steps are
employed to replace time derivative. The later job is done by standard ODE
solver supplied in Matlab.
A common problem with adsorption simulation is stiffness, which arises because
of parallel processes with very different rates. In order to overcome this
difficulty the whole simulation time is divided into small periods. Temperature is
considered constant during a period and updated at the end of each period
using equation (3.2) in integral form. Physical properties such as viscosity or
isotherms are also updated. The assumption of constant temperature is quite
close to the real process when each period lasts only few seconds.
Page 63
46
3.2.2. Components
Zeolite 4A is chosen first because it is the most intensively studied material for
olefin/paraffin separation. The characteristics of zeolite 4A are given in Table
3-1. Seven gases which are major reactants and products are considered in the
simulation: nitrogen, hydrogen, methane, ethane, ethylene, carbon monoxide
and carbon dioxide. Two main other components are omitted: water is
considered to be completely separated – this is the requirement when a
strongly hydrophilic material like zeolite is used; oxygen behaviour during
adsorption/desorption is very similar to nitrogen – replacing it by nitrogen
significantly reduces computational cost without losing much accuracy. Gas
properties such as specific heat capacities or viscosities are taken from (Poling,
et al., 2008).
Table 3-1: Zeolite 4A characteristics
Properties Symbol Value Unit
Pellet form Pellet
Average size dP 0.0032 m
Fractional voidage ε 0.5
Density m 1500 kg/m3
Specific heat capacity Cps 1000 J/kg.K
Permeability coefficient B 2.8 x 10⁻⁹ m2
Simulation with activate carbon is later conducted. The characteristics of
activated carbon are given in Table 3-2. The particle size distribution of activated
carbon is assumed to be wider than zeolite 4A. This results in lower fractional
voidage and permeability coefficient (higher pressure drop).
Page 64
47
Table 3-2: Activated carbon characteristics
Properties Symbol Value Unit
Average size dP 0.002 m
Fractional voidage ε 0.2
Surface area 1000 m2/g
Density m 900 kg/m3
Specific heat capacity Cps 1000 J/kg.K
Permeability coefficient B 6.2 x 10⁻¹⁰ m2
3.2.3. Adsorption characteristics of zeolite 4A
1. Hydrogen:
Hydrogen is hardly adsorbed on zeolite as well as many other sorbents (Bart
& von Gemmingen, 2005).
2. Carbon dioxide:
Carbon dioxide is the gas with highest affinity toward zeolite. Dual-Langmuir
models of carbon dioxide adsorption at 20OC and 50OC are available in
(Romero-Perez & Aguilar-Armenta, 2010). Thermal expansion coefficient is
calculated from adsorption capacities at different temperatures. Diffusion
coefficient and activation energy are calculated from (Meng, 1984).
Table 3-3: Adsorption of carbon dioxide on zeolite 4A
T Q1 b1 ΔH1 Q2 b2 ΔH2 α D0 Ea
20OC 2.024 5.46e-3 -46570 1.303 7.31e-5 -9320 3.48E-3 2.75E-12 11789
50OC 1.804 8.80e-4 -46570 1.172 4.88e-5 -9320 3.48E-3 2.75E-12 11789
3. Carbon monoxide:
Dual-Langmuir models of carbon monoxide adsorption at 0OC and 50OC are
attained by fitting experiment results in (Harper, et al., 1969).
Page 65
48
Figure 3-1: Adsorption isotherms of carbon monoxide on zeolite 4A
Thermal expansion coefficient is calculated from adsorption capacities at
different temperatures. Heat of adsorption, diffusion coefficient and
activation energy are from (Triebe & Tezel, 1995).
Table 3-4: Adsorption of carbon monoxide on zeolite 4A
T Q1 b1 ΔH1 Q2 b2 ΔH2 α D0 Ea
0OC 2.160 1.71e-5 -20624 1.391 1.71e-5 -20624 3.17E-3 1.21E-10 23312
50OC 1.810 3.84e-6 -20624 1.175 3.84e-6 -20624 3.17E-3 1.21E-10 23312
4. Ethane:
Sips models of ethane adsorption at 20OC and 50OC are available in (Romero-
Perez & Aguilar-Armenta, 2010). They are replaced by fitting Langmuir
models.
0
0.5
1
1.5
2
2.5
0 20 40 60 80 100
q, m
ol/
kg
Pressure, kPa
Adsorption isotherms of carbon monoxide on zeolite 4A
Experiment at 273K Model at 273K
Experiment at 323K Model at 323K
Page 66
49
Figure 3-2: Adsorption isotherms of ethane on zeolite 4A
Thermal expansion coefficient is calculated from adsorption capacities at
different temperatures. Diffusion coefficient and activation energy are
calculated from (Meng, 1984).
Table 3-5: Adsorption of ethane on zeolite 4A
T Q1 b1 ΔH1 Q2 b2 ΔH2 α D0 Ea
20OC 2.147 7.62e-5 -22908 0 0 0 5.26E-3 9.06E-13 14600
50OC 1.808 3.03e-5 -22908 0 0 0 5.26E-3 9.06E-13 14600
5. Ethylene:
Sips models of ethylene adsorption at 20OC and 50OC are available in
(Romero-Perez & Aguilar-Armenta, 2010). They are replaced by fitting
Langmuir models.
0
0.2
0.4
0.6
0.8
1
1.2
1.4
1.6
1.8
2
0 10 20 30 40 50 60 70 80
q, m
ol/
kg
Pressure, kPa
Adsorption isotherm of ethane on zeolite 4A
Sips model at 293K Langmuir model at 293K
Sips model at 323K Langmuir model at 323K
Page 67
50
Figure 3-3: Adsorption isotherms of ethylene on zeolite 4A
Thermal expansion coefficient is calculated from adsorption capacities at
different temperatures. Diffusion coefficient and activation energy are
calculated from (Meng, 1984).
Table 3-6: Adsorption of ethylene on zeolite 4A
T Q1 b1 ΔH1 Q2 b2 ΔH2 α D0 Ea
20OC 2.339 1.70e-3 -36837 0 0 0 1.16E-3 4.75E-12 13800
50OC 2.258 3.98e-4 -36837 0 0 0 1.16E-3 4.75E-12 13800
6. Methane:
Langmuir model of methane adsorption at 35OC is available in (Moore &
Koros, 2007). Thermal expansion coefficient is calculated from adsorption
0
0.5
1
1.5
2
2.5
0 10 20 30 40 50 60 70 80
q, m
ol/
kg
Pressure, kPa
Adsorption isotherm of ethylene on zeolite 4A
Sips model at 293K Langmuir model at 293K
Sips model at 323K Langmuir model at 323K
Page 68
51
capacities at different temperatures (Harper, et al., 1969). Diffusion
coefficient and activation energy are calculated from (Yucel & Ruthven,
1980).
Table 3-7: Adsorption of methane on zeolite 4A
T Q1 b1 ΔH1 Q2 b2 ΔH2 α D0 Ea
0OC 2.677 4.02e-6 -16720 0 0 0 5.92E-3 3.6E-9 34276
35OC 2.123 1.64e-6 -16720 0 0 0 5.92E-3 3.6E-9 34276
7. Nitrogen:
Langmuir model of nitrogen adsorption at 35OC is available in (Moore &
Koros, 2007). Thermal expansion coefficient is calculated from adsorption
capacities at different temperatures (Harper, et al., 1969). Diffusion
coefficient and activation energy are calculated from (Yucel & Ruthven,
1980).
Table 3-8: Adsorption of nitrogen on zeolite 4A
T Q1 b1 ΔH1 Q2 b2 ΔH2 α D0 Ea
0OC 2.903 2.66e-6 -23826 0 0 0 5.92E-3 5.3E-10 24244
35OC 2.302 7.6e-7 -23826 0 0 0 5.92E-3 5.3E-10 24244
3.2.4. Adsorption characteristics of activated carbon
Langmuir isotherms of nitrogen and hydrogen are available in (Choi, et al., 2003).
Langmuir isotherms of methane, ethane, ethylene and carbon dioxide are
attained by fitting experiment result in (Reich, et al., 1980) as shown in Figure
3-4, Figure 3-5, Figure 3-6 and Figure 3-7.
Langmuir isotherm of carbon monoxide is available in (Park, et al., 1998).
Page 69
52
Figure 3-4: Adsorption isotherms of methane on activated carbon
Figure 3-5: Adsorption isotherms of ethane on activated carbon
0
1
2
3
4
5
6
7
0 5 10 15 20 25 30 35 40
q, m
ol/
kg
Pressure, bar
Adsorption isotherms of methane on activated carbon
Experiment at 260K Model at 260K
Experiment at 301 K Model at 301 K
0
1
2
3
4
5
6
7
0 2 4 6 8 10 12 14 16 18
q, m
ol/
kg
Pressure, bar
Adsorption isotherms of ethane on activated carbon
Experiment at 260 K Model at 260 K
Experiment at 301 K Model at 301 K
Page 70
53
Figure 3-6: Adsorption isotherms of ethylene on activated carbon
Figure 3-7: Adsorption isotherms of carbon dioxide on activated carbon
0
1
2
3
4
5
6
7
8
0 2 4 6 8 10 12 14 16 18
q, m
ol/
kg
Pressure, bar
Adsorption isotherms of ethylene on activated carbon
Experiment at 260 K Model at 260 K
Experiment at 301 K Model at 301 K
0
2
4
6
8
10
0 5 10 15 20 25 30 35 40 45
q, m
ol/
kg
Pressure, bar
Adsorption isotherms of carbon dioxide on activated carbon
Experiment at 260 K Model at 260 K
Experiment at 301 K Model at 301 K
Page 71
54
Adsorption parameters of activated carbon are summarised in Table 3-9.
Because simulation with activated carbon is carried out in a narrow range of
temperature, diffusion coefficients are assumed constant for the sake of
simplicity.
Table 3-9: Adsorption on activated carbon
Gas Q *
mol/g
b0
Pa-1K1/2
ΔH
J/mol
α
1/K
D
m2/s
Nitrogen 3.596 1.48e-7 -11402 6.99e-3 4.00e-6
Methane 5.853 1.04e-6 -6740 4.31e-3 7.60e-8
Ethane 5.918 4.91e-6 -7638 3.58e-3 1.35e-7
Ethylene 6.087 2.18e-6 -8912 3.66e-3 1.44e-7
Carbon monoxide 2.636 1.70e-6 -13118 2.08e-3 5.00e-6
Carbon dioxide 9.672 1.44e-8 -18248 1.52e-3 2.20e-6
Hydrogen 10.153 3.33e-7 0 4.21e-3 1.80e-5
* Adsorption capacity at 303OC
3.3. Numerical diffusion
Numerical diffusion is the known difficulty with computer simulation. High order
methods tend to reduce numerical diffusion but might cause unrealistic
oscillation. Special techniques such as total variation diminishing (TVD) or flux-
corrected transport (FCT) try to minimise numerical diffusion and eliminate
oscillation at the same time. These methods however require much more
elaboration and, consequently, computation effort. In this work another strategy
is applied: physical dispersion is taken out of the original continuous model, the
effect of this modification is compensated by numerical diffusion. That means
instead of putting much effort to eliminate numerical diffusion we try to match it
Page 72
55
with the missing physical dispersion. The matching is not perfect but the
difference between physical dispersion and numerical diffusion is tolerable since
the influence of dispersion is quite small in gas adsorption processes. In addition
we also try to damp oscillation instead of eliminating it completely, which will
require much computation effort. This is done by setting a decaying factor a: the
oscillation amplitude decreases a times after each step. Although oscillation still
exist, it will be reduced to nearly zero after a short time if decaying factor a is
large enough. Oscillation can be eliminated (at the cost of more numerical
diffusion) if a is set to infinity. Combing two ideas mentioned above, numerical
diffusion can be tuned to match physical dispersion by changing spatial
discretisation mesh or decaying factor a in the equation:
(3.16)
The effect of numerical diffusion is tested by simulating inert bed. Figure 3-8
shows the simulation results when methane is fed to an inert column initially full
of nitrogen for 2 seconds at a velocity of 0.5 m/s. Without diffusion methane
concentration should drop suddenly to zero and nitrogen concentration should
rise suddenly to maximum at the middle of column. Instead, when spatial
discretisation step size and decaying factor are chosen as 0.5 cm and 1.5
respectively, a 15 cm transitional zone is observed. This is equivalent to physical
dispersion with dispersion coefficient DL in the range of 10-4 – 10-3 m2/s, which is
compatible with calculation by (Aris & Amundson, 1957) or (Prausnitz, 1958). The
simulation took less than 5 seconds to run (on a 3 GHz Core 2 Duo processor) and
no artificial oscillation is observed. The implementation was done at Matlab® and
the code ode15s was used.
Page 73
56
Figure 3-8: Numerical diffusion test
3.4. Simulation result with zeolite 4A
Reactor outlet composition is taken from (Salerno, 2013), where OCM reactions
are simulated based on Stansch’s kinetic (Stansch, et al., 1997). After being
desiccated and cooled down to 40OC the gas composition is:
Table 3-10: Feed composition for simulation
Gas N2 H2 CH4 C2H6 C2H4 CO CO2
Mol. fraction, % 0.6 19.1 48.5 0.5 8 2.5 20.8
3.4.1. Breakthrough
Since bed radius and cross sectional area do not appear in the model, it can
change for scaling up or down the process without affecting simulation result.
There is of course technical limitation but it is not necessary to be considered at
this stage. For convenience bed cross sectional area is assumed to be 1 m2 for
the whole simulation.
0 0.2 0.4 0.6 0.8 1 1.2 1.4 1.6 1.8 20
10
20
30
40
50
60
Length (m)
Co
nce
ntr
atio
n (
mo
l/m
3)
Gas phase concentration profile
N2
CH4
Page 74
57
Reactor outlet is fed into a 2-metre adsorption column full of nitrogen at a
velocity of 0.5 m/s. Feed temperature and initial bed temperature are both 320 K
and outlet pressure is fixed at 1.03 bar – slightly higher than atmospheric
pressure. Void fraction is assumed to be 50%. The breakthrough curve is
depicted in Figure 3-9. The initial amount of nitrogen is flushed out of the column
in few minutes. Methane and hydrogen appear at the outlet almost immediately
while carbon monoxide and ethane concentrations increase gradually. Ethylene
and carbon dioxide break through after 12.5 minutes.
Figure 3-9: Breakthrough simulation
Because outlet pressure is fixed, total concentration is almost constant (a little
variation due to temperature change): methane and hydrogen concentrations
drop when ethylene and carbon dioxide concentrations rise. The breakthrough
curve however does not reflect the actual amount of gases: total flow rate
increases along with velocity when adsorption front reaches the outlet as shown
in Figure 3-10. If online concentration monitoring is not available in real process,
0 2 4 6 8 10 12 14 160
10
20
30
40
50
60
Time (min)
Co
nce
ntr
atio
n (
mo
l/m
3)
Breakthrough curve
N2
CH4
C2H6
C2H4
CO
CO2
H2
Page 75
58
flow or velocity meter can help detecting when adsorption front approach. In
order to avoid ethylene lost adsorption step must finish few minutes before it
breaks through. This amount of time is necessary for co-current blowing, which
improve ethylene purity.
Figure 3-10: Outlet velocity and flow rates
3.4.2. Separation
Two important criteria of a separation process are purity and recovery. Ethylene
is usually required in high purity. The goal of separation is producing ethylene at
CP grade – 99% (carbon dioxide is ignored). Because ethylene is expensive, losing
it during separation is very undesirable. This work aims at 99% ethylene recovery
in the separation, which means about 1% increase of production costs compare
to complete recovery. The separation procedure, based on conceptual design in
chapter two, consists of 4 steps:
1. Adsorption: Reactor outlet is fed to adsorption column after cooling and
drying. With above operating conditions, this step is chosen to last 10
minutes. As separation process involves multi columns, the duration of other
steps are chosen to be multiple of ten minutes so that a synchronous
switching between columns can be achieved.
2. Co-current blow: The purpose of this step is wiping out all the unwanted
gases (methane, carbon monoxide,…) in the void of column as well as on the
surface of sorbent. This step is essential to achieve high purity when
0 2 4 6 8 10 12 14 160
0.05
0.1
0.15
0.2
0.25
0.3
0.35
0.4
0.45
Time (min)
Ve
locity (
m/s
)
Outlet Velocity
0 2 4 6 8 10 12 14 160
2
4
6
8
10
12
14
16
Time (min)
Flo
w r
ate
(m
ol/s)
Outlet Flowrate
N2
CH4
C2H6
C2H4
CO
CO2
H2
Page 76
59
selectivity is limited and void fraction is high. Purge gas can be carbon
dioxide, ethylene it self or a mixture of both. Sweeping away unwanted
gases needs only short time and too long blow will lead to ethylene lost. This
step is however extended to ten minutes to match adsorption step without
losing ethylene. The extension is done by adjusting flow rate.
3. Ethylene desorption: Carbon dioxide is fed to adsorption column until all
ethylene is collected at outlet. Carbon dioxide flow rate can be adjusted so
that duration is multiple of ten minutes. The trade-off between bed
inventory and amount of carbon dioxide is considered when specifying
duration.
4. Carbon dioxide desorption: Carbon dioxide is desorbed by purging with air
because it is free and diluted effluent can be emitted directly to
environment at the end of this step. The duration of this step is also a
multiple of ten minutes. Hot air is used first for faster desorption. Cool air is
used later to cool down adsorption bed simultaneously with carbon dioxide
desorption.
All steps are performed at low pressure to save compression cost. Adsorption
takes place at 320 K – around the reactor outlet temperature after cooling. Since
carbon dioxide is strongly adsorbed to zeolite, hot air is necessary at the
beginning of step 4. Cool air is needed later to cool down adsorption column for
the next cycle. In steps 2 and 3 ‘heavier’ gases can displace ‘lighter’ gases
without high temperature. However heating time in step 4 can be shortened if
the column is preheated in these steps. Higher temperature also means higher
volumetric flow rate and faster desorption. Because temperature limit for
ethylene – according to ATEX directive – is 300OC, purge gases in steps 2 and 3
are also heated up to 550 K.
The following simulations are done with a 15 cm2 cross sectional area column
and Bürkert valve type 2836 is installed at the outlet. Valve characteristic is taken
Page 77
60
from manufacturer’s datasheet (code: 154 553). Flow rates are then scaled up to
match 1 m2 cross sectional area column for convenience. Two schemes are
analysed to compare the effect of using ethylene and carbon dioxide in co-
current blow step: ethylene in scheme 1 and carbon dioxide in scheme 2. The
fourth step – carbon dioxide desorption – is not shown here because it is the
same for both schemes as we will see later. After that, the third scheme with real
production criteria – 99% recovery and purity – is presented. The general flow
sheet for all schemes with two adsorption columns is presented in Figure 3-11,
ethylene circulation is only required in scheme 1. The real number of adsorption
columns depends on the duration ratio between total cycle and adsorption step.
Heaters are hidden for a clearer view.
Reactor Adsorber 1
Reactants
AbsorberAdsorber 2 Stripper
AirEthylene Carbon dioxide
Venting
Figure 3-11: Flow sheet for schemes 1, 2, 3
Outlet gas concentrations, velocity and flow rates of adsorption step are in
Figure 3-9 and Figure 3-10. State of the column at the end of adsorption step is
depicted in Figure 3-12. Methane, ethane and carbon monoxide are displaced by
Page 78
61
carbon dioxide and ethylene; they concentrate at the end of column. There is still
some methane adsorbed at the beginning of the column due to its high
concentration in the feed. Ethane is adsorbed more strongly than methane and
carbon monoxide so its front is less steep than the others, which means
displacement of ethane is not as effective as the ones with methane and carbon
monoxide. Ethane is therefore the main concern in co-current blow step.
Ethylene is also partly displaced by carbon dioxide and forms a peak right at
carbon dioxide front. Carbon dioxide profile forms two plateaus corresponding to
the temperature wave: saturated concentration is more than 3 kmol/m3 at the
beginning of column, where temperature is only 320 K but less than 1.5 kmol/m3
at the middle of column, where temperature rises to more than 380 K. This
dependence means heating is the appropriate measure for desorbing carbon
dioxide from zeolite.
Temperature near inlet quickly rises to a peak then drops to feed gas
temperature. Temperature far from inlet increases slowly at first but sharply
when adsorption front arrives. In real process where online measurement of
adsorbate concentration is impossible, temperature monitor can help locate
adsorption front. With the assumption of temperature equilibrium between gas
and solid phase, temperature front almost coincides with concentration front.
However a small oscillation can be notice in case of temperature. This is due to
the decoupling of heat and mass balance said in section Numerical solution
above. The magnitude of oscillation is only few centigrade and does not affect
concentration calculation but simulation is much faster. The ratio of run time
over simulation time is around 2 – a quite impressive number considering the
nonlinear property of the model and the number of components.
Page 79
62
a b
c d
Figure 3-12: Simulation result of adsorption step Profiles at the end of adsorption step: concentration in adsorbed phase (a),
concentration in gas phase (b), temperature profile (c); and temperature over time at different distances from bed inlet (d)
After adsorption step there is still a significant amount of unwanted gases in
column, both adsorbed and gas phases. Co-current blow is necessary to obtain
ethylene with high purity. Simulation results of this step with ethylene and
carbon dioxide as purge gases are in Figure 3-13 and Figure 3-14 respectively,
profiles along the column are at the end of steps.
0 0.5 1 1.5 20
500
1000
1500
2000
2500
3000
3500
Length (m)
Co
nce
ntr
atio
n (
mol/m
3)
Adsorbed concentration profile
N2
CH4
C2H6
C2H4
CO
CO2
H2
0 0.5 1 1.5 20
5
10
15
20
25
30
Length (m)
Co
nce
ntr
atio
n (
mol/m
3)
Gas phase concentration profile
N2
CH4
C2H6
C2H4
CO
CO2
H2
0 0.5 1 1.5 2320
330
340
350
360
370
380
390
Length (m)
Te
mp
era
ture
(K
)
Temperature profile
0 2 4 6 8 10310
320
330
340
350
360
370
380
390
Time (min)
Te
mp
era
ture
(K
)
Temperature over time
2 cm
40 cm
80 cm
100 cm
120 cm
160 cm
200 cm
Page 80
63
Figure 3-13: Co-current blow with ethylene – scheme 1
The outlets of two cases are very similar but concentration profiles are different.
It can be seen from concentration profile in adsorbed phase that carbon dioxide
in feed gas displaces ethylene more effectively than ethylene in feed gas displace
carbon dioxide. The reason is that ethylene can only displace carbon dioxide in
one site. For the other site with smaller pore sizes it acts as inert gas.
0 2 4 6 8 100
0.005
0.01
0.015
Time (min)
Ve
locity (
m/s
)
Outlet Velocity
0 2 4 6 8 100
0.05
0.1
0.15
0.2
0.25
0.3
0.35
0.4
0.45
0.5
Time (min)
Flo
w r
ate
(m
ol/s)
Outlet Flowrate
N2
CH4
C2H6
C2H4
CO
CO2
H2
0 0.5 1 1.5 20
500
1000
1500
2000
2500
3000
3500
Length (m)
Co
nce
ntr
atio
n (
mol/m
3)
Adsorbed concentration profile
N2
CH4
C2H6
C2H4
CO
CO2
H2
0 0.5 1 1.5 20
10
20
30
40
50
60
Length (m)
Co
nce
ntr
atio
n (
mol/m
3)
Gas phase concentration profile
N2
CH4
C2H6
C2H4
CO
CO2
H2
0 0.5 1 1.5 2300
350
400
450
500
550
600
Length (m)
Te
mp
era
ture
(K
)
Temperature profile
0 2 4 6 8 10300
350
400
450
500
550
600
Time (min)
Te
mp
era
ture
(K
)
Temperature over time
2 cm
40 cm
80 cm
100 cm
120 cm
160 cm
200 cm
Page 81
64
Figure 3-14: Co-current blow with carbon dioxide – scheme 2
In scheme 1, adsorption column is purged by carbon dioxide with a velocity of
0.6 m/s after ethylene blow. The result is in Figure 3-15. After ten minutes there
is no ethylene in column, both adsorbed and gas phases. Outlet composition is
given in Table 3-11. After carbon dioxide removal, ethylene can be recovered at
99% purity.
0 2 4 6 8 100
0.002
0.004
0.006
0.008
0.01
0.012
0.014
Time (min)
Ve
locity (
m/s
)
Outlet Velocity
0 2 4 6 8 100
0.05
0.1
0.15
0.2
0.25
0.3
0.35
0.4
0.45
0.5
Time (min)
Flo
w r
ate
(m
ol/s)
Outlet Flowrate
N2
CH4
C2H6
C2H4
CO
CO2
H2
0 0.5 1 1.5 20
500
1000
1500
2000
2500
3000
3500
4000
Length (m)
Co
nce
ntr
atio
n (
mol/m
3)
Adsorbed concentration profile
N2
CH4
C2H6
C2H4
CO
CO2
H2
0 0.5 1 1.5 20
10
20
30
40
50
60
Length (m)
Co
nce
ntr
atio
n (
mol/m
3)
Gas phase concentration profile
N2
CH4
C2H6
C2H4
CO
CO2
H2
0 0.5 1 1.5 2300
350
400
450
500
550
600
Length (m)
Te
mp
era
ture
(K
)
Temperature profile
0 2 4 6 8 10300
350
400
450
500
550
600
Time (min)
Te
mp
era
ture
(K
)
Temperature over time
2 cm
40 cm
80 cm
100 cm
120 cm
160 cm
200 cm
Page 82
65
Table 3-11: Outlet composition of ethylene desorption step in scheme 1
Gas N2 H2 CH4 C2H6 C2H4 CO CO2
Mol. fraction, % 0 0 0.005 0.234 33.15 0.041 66.57
Figure 3-15: Purging by carbon dioxide in scheme 1
In scheme 2, adsorption column is purged by carbon dioxide with a velocity of
0.35 m/s after carbon dioxide blow. The result is in Figure 3-16. After ten
minutes there is no ethylene in column, both adsorbed and gas phases. Outlet
composition is given in Table 3-12. After carbon dioxide removal, ethylene can be
recovered at 96% purity.
0 2 4 6 8 100
0.1
0.2
0.3
0.4
0.5
0.6
0.7
0.8
Time (min)
Ve
locity (
m/s
)
Outlet Velocity
0 2 4 6 8 100
5
10
15
20
25
30
Time (min)F
low
ra
te (
mo
l/s)
Outlet Flowrate
N2
CH4
C2H6
C2H4
CO
CO2
H2
0 0.5 1 1.5 20
500
1000
1500
2000
2500
3000
3500
4000
Length (m)
Co
nce
ntr
atio
n (
mol/m
3)
Adsorbed concentration profile
N2
CH4
C2H6
C2H4
CO
CO2
H2
0 0.5 1 1.5 20
5
10
15
20
25
30
35
40
45
Length (m)
Co
nce
ntr
atio
n (
mol/m
3)
Gas phase concentration profile
N2
CH4
C2H6
C2H4
CO
CO2
H2
0 0.5 1 1.5 2350
400
450
500
550
600
Length (m)
Te
mp
era
ture
(K
)
Temperature profile
0 2 4 6 8 10350
400
450
500
550
600
Time (min)
Te
mp
era
ture
(K
)
Temperature over time
2 cm
40 cm
80 cm
100 cm
120 cm
160 cm
200 cm
Page 83
66
Table 3-12: Outlet composition of ethylene desorption step in scheme 2
Gas N2 H2 CH4 C2H6 C2H4 CO CO2
Mol. fraction, % 0 0 0.033 0.504 17.98 0.213 81.27
Figure 3-16: Purging by carbon dioxide in scheme 2
Unlike the previous step, the states of adsorption column after purging are
similar in two cases but outlets are different. Scheme 1 requires almost double
sweep gas flow rate, which in turn results in higher outlet flow rate and more
carbon dioxide needs removing although it is fed only in one step. The advantage
of using ethylene for co-current blow is higher purity because more paraffin is
0 2 4 6 8 100
0.1
0.2
0.3
0.4
0.5
0.6
0.7
0.8
Time (min)
Ve
locity (
m/s
)
Outlet Velocity
0 2 4 6 8 100
5
10
15
20
25
Time (min)F
low
ra
te (
mo
l/s)
Outlet Flowrate
N2
CH4
C2H6
C2H4
CO
CO2
H2
0 0.5 1 1.5 20
500
1000
1500
2000
2500
3000
3500
4000
Length (m)
Co
nce
ntr
atio
n (
mol/m
3)
Adsorbed concentration profile
N2
CH4
C2H6
C2H4
CO
CO2
H2
0 0.5 1 1.5 20
5
10
15
20
25
30
35
40
Length (m)
Co
nce
ntr
atio
n (
mol/m
3)
Gas phase concentration profile
N2
CH4
C2H6
C2H4
CO
CO2
H2
0 0.5 1 1.5 2300
350
400
450
500
550
600
Length (m)
Te
mp
era
ture
(K
)
Temperature profile
0 2 4 6 8 10300
350
400
450
500
550
600
Time (min)
Te
mp
era
ture
(K
)
Temperature over time
2 cm
40 cm
80 cm
100 cm
120 cm
160 cm
200 cm
Page 84
67
blown out before ethylene appears at the outlet. However operation is simpler
and less equipment are required if carbon dioxide is used.
Considering all the pros and cons mentioned above, carbon dioxide is the better
choice for co-current blow. The source of carbon dioxide for both steps is
stripper column in carbon dioxide removal section as stated in Process flow
development. Because ethylene helps increase purity, a mixture of ethylene and
carbon dioxide can be used in co-current blow step instead of pure carbon
dioxide. Therefore a portion of effluence of ethylene desorption step is recycled
for co-current blow without going through carbon dioxide removal section. This
solution reduces carbon removal duty. The simulation of scheme 3 with this
design is presented below. Operating parameters such as feeding flow rate are
tuned to achieve the set performance.
The separation routine of scheme 3 lasts one hour. Adsorption (step 1) and co-
current blow (step 2) each last ten minutes. Ethylene desorption (step 3 and 4)
and carbon dioxide desorption (step 5 and 6) are lengthen to twenty minutes so
that the effluent can be recycled to purge previous steps. This extension
increases the required bed inventory but reduces the amount of gases needed
for operation. The inlet and outlet of steps are given in Table 3-13.
Table 3-13: Inlets and outlets in scheme 3
Step Feed gas
Usage of effluent Source and flow rate T, K
1 Reactor outlet at a velocity of 0.5 m/s 320 To reactor or other processes
2 46% of effluent from step 3 550 To reactor or other processes
3 Effluent from step 4 550 To step 2 and CO2 removal
4 Carbon dioxide at a velocity of 0.29 m/s 550 To step 3
5 Effluent from step 5 370 To CO2 removal and vent
6 Dry air at a velocity of 4 m/s 310 To step 5
Page 85
68
The effluent of adsorption column through six steps, achieved after nearly 90
minutes running simulation, is illustrated in Figure 3-17. “Light” components are
collected during the first twenty minutes, mostly in the first ten minutes. The
second ten minutes contributes little to methane and hydrogen recoveries due
to very small flow rate but is crucial to ethylene purity. This small flow rate is
typical with displacement purge but it also gives a hint that co-current blow
duration and bed inventory can be significantly reduced. Ethylene is desorbed
during the second twenty minutes but only collected in the first half and recycled
in the second. This circulation does not only halve carbon dioxide consumption
as sweep gas but also avoids the expensive retrieval of ethylene from highly
diluted mixture. The composition of ethylene-rich stream is given in Table 3-14.
After carbon dioxide removal, 98.9% ethylene is recovered with 98.9% purity and
the main contaminate is ethane – 1%. Carbon dioxide is desorbed in the last
twenty minutes with the effluent during second half is also recycled. Although
highly diluted carbon dioxide can be emitted directly to atmosphere, this
recirculation is very beneficial because it help save a lot of air blowing duty.
Table 3-14: Composition of ethylene-rich stream in scheme 3
Gas N2 H2 CH4 C2H6 C2H4 CO CO2
Mol. fraction, % 0 0 2e-4 0.381 35.19 0.008 64.42
Page 86
69
Figure 3-17: Effluent of entire cycle in scheme 3
0 5 10 15 200
5
10
15
20
25
30
Time (min)
F l o
w r
a t
e (
m o
l / s
)
Outlet Flowrate
N2
CH4
C2H6
C2H4
CO
CO2
H2
20 25 30 35 400
5
10
15
20
25
30
35
Time (min)
F l o
w r
a t
e (
m o
l / s
)
N2
CH4
C2H6
C2H4
CO
CO2
H2
40 45 50 55 600
50
100
150
200
250
F l o
w r
a t
e (
m o
l / s
)
Time (min)
N2
CH4
C2H6
C2H4
CO
CO2
H2
Page 87
70
3.4.3. Discussion
The reactor performance from (Salerno, 2013) is 45.4% methane conversion with
39.7% ethylene selectivity and 2.5% ethane selectivity. When this reactor is
combined with conventional downstream process, the operating cost is 834 €/t
ethylene according to equation (2.4). This high operating cost is due to low
selectivity: only raw material already cost 645€. The consequence is a payout
period longer than 15 years when ethylene price is 1135 €/t (Salerno, 2013).
When separating one tonne of ethylene with scheme 3, nearly 11 tonnes of
carbon dioxide pass through adsorption column. Among them 2.9 tonnes need
separating from ethylene, 3.8 tonnes need separating from air for recirculation
and about 4 tonnes are diluted by air – less than 4% – and can be emitted to
atmosphere. Desorption steps also consume 84000 m3 air and 5.9 GJ heating for
each tonne of ethylene produced. Beside air blower, the other major equipments
required in scheme 3 are adsorption columns. Bed inventory is 4.8 tonne of
zeolite for per tonne/day or 115 kg of zeolite for per kg/h ethylene production.
The utilities consumption per tonne ethylene for downstream process in scheme
3 is summarised in Table 3-15. Costs of major equipments in adsorption section
are given in Table 3-16. For comparison, investment on compressor and
demethanizer in case of conventional downstream solution is €21 million
(Salerno, 2013).
Simulation shows that adsorptive (scheme 3) and conventional downstream
solutions require about the same initial investment (refrigerant compressors are
excluded as it is already accounted in utilities cost). Scheme 3 is slightly better as
a few percents of operating cost can be saved. Overall this particular adsorptive
separation scheme improves the profitability of OCM technology but not enough
to change its economic status. The biggest advantage of this scheme in
comparison with conventional solution is the robustness against inert diluents
such as nitrogen. No matter how much nitrogen presents in reactor outlet it will
Page 88
71
get out of adsorption column together with methane and hydrogen and does not
affect ethylene adsorption thanks to the big difference between their affinities.
Table 3-15: Operating cost summary
Item Unit Amount Price*, € Total price, €
CO2 removal
Pumping kWh 5.4 0.075 0.41
Steam tonne 6.7 5.67 37.99
Caustic soda kg 0.08 3 0.24
Adsorption
Heating GJ 5.9 2 11.8
Air blowing kWh 1680 0.075 126
Total 176.44
* Utilities prices are calculated according to (Ulrich &
Vasudevan, 2006) at CE PCI = 588.8 and fuel price at 2 $/GJ
Table 3-16: Equipment cost
Item Specification Unit Amount Price*, x1000€ Total price, x1000€
Sorbent Zeolite 4A tonne 1940 2 3880
Column 8x10 (DxH) pcs. 6 597.2 3583.2
Blower** 64500 m3/h pcs. 22 492.5 10835
Total 18298.2
* The prices of equipments are estimated by Aspen Process Economic Analyzer
** Only small blowers are available in the database of Aspen Process Economic
Analyzer. Lower price when one big blower is installed instead of 22 small ones.
Although only one of the goals set for adsorptive solution is achieved, the
studied case is far from optimal and there are points that can be improved for a
better process:
Page 89
72
Proper reactor performance: Reactor can operate at different conditions and
performance. Low selectivity means waste of raw materials and no
separation technique can help it. High selectivity however couples with low
conversion and increasing cost of methane separation may overshadow raw
material save. As adsorption can separate methane at a lower price, it
should be combined with highly selective performance.
Air blower: A major advantage of adsorptive separation is avoidance of
expensive compression (gas and refrigerant). In scheme 3, it is however
replaced by air blowing. Air blowing makes up half of initial investment (in
adsorption section) as well as 70% of separation cost and cancels the above
mentioned advantage. Although cost of air blowing can be reduced by
lowering pressure drop with bigger sorbent particles and pipes, adsorptive
separation can only be really superior when the need for air blowing is
eliminated or significantly reduced. This means it is necessary to find
another sorbent where carbon dioxide desorption is easier, even with the
sacrifice of adsorption capacity and selectivity.
One more point should be concerned with adsorptive separation is collection of
effluent. Unlike distillation, absorption or membrane processes where separated
components come out at the same time from different outlets, components
separated by adsorption come out from the same outlet at different time. This
feature enables the chance that separated component mix back together.
Simulation shows the composition at the end of adsorption column and back
mixing in column is already accounted. Out of column back mixing can still occur
in connecting pipes where Reynold number increases due to diameter reduction
and at local obstacle such as valves or pipe connections. This matter must be
taken into consideration during process design. In scheme 3, the sequence of
components come out of column matches their order of affinity: hydrogen,
methane, carbon monoxide, ethane, ethylene and carbon dioxide. Hence, back
mixing may contaminate ethylene with ethane and carbon monoxide. If the
Page 90
73
order of affinity can be changed so that carbon dioxide comes between ethylene
and other components, separation performance will be improved and the
process will be more robust toward pipe layout and switching time. All these
points will be covered in the next part.
3.5. Simulation result with activated carbon
In this simulation, a smaller outlet valve is selected (Bürkert valve type 2833,
code: 175 900) because there is no high flow rate air blowing.
Reactor outlet composition is chosen as case three (Pan, et al., 2010) in Table
2-1. Compare to the performance from (Salerno, 2013), methane conversion is
lower but selectivity is higher resulting in a little lower yield (16.5% compare to
18%). The gas composition is:
Table 3-17: Feed composition for simulation
Gas N2 H2 CH4 C2H6 C2H4 CO CO2
Mol. fraction, % 0 6.4 65.5 3.7 8.8 6.5 9.1
3.5.1. Separation
The separation cycle in case of activated carbon, scheme 4, lasts half an hour
with adsorption, co-current blow and desorption each last ten minutes. A part of
the effluent from desorption step is recycled for co-current blow. The inlet and
outlet of steps are given in Table 3-13. Because all gases are easier to desorb,
neither heat up nor air blow are required. It can be noticed that adsorption with
activated carbon is performed at lower temperature in comparison with zeolite
4A. Low temperature is usually desired since it favours adsorption. However, in
case of zeolite 4A, mass transfer rate is restricted by small pore structure and
temperature must be high enough for a reasonable diffusion rate. This problem
does not occur with the large pore structure of activated carbon and a lower
operating temperature can be chosen.
Page 91
74
Table 3-18: Inlets and outlets in separation with activated carbon
Step Feed gas
Usage of effluent Source and flow rate T, K
1 Reactor outlet at a velocity of 0.625 m/s 300 To reactor or other processes
2 26% of effluent from step 3 300 To reactor or other processes
3 Carbon dioxide at a velocity of 1 m/s 300 To step 2 and CO2 removal
The flow sheet for scheme 4 is presented in Figure 3-18. It is easy to notice that
two-step adsorption (scheme 4) requires less switching valves than three-step
adsorption (schemes 1, 2, 3). This does not only result in less investment but also
simpler operation.
Reactor
Reactants
Absorber Stripper
Rich solution
booster pump
Compressor
Lean solution
C2
Carbon dioxide C2 Splitter
Ethylene
Ethane
Absorber
Feed
Furnace
Caustic
wash
Adsorber 1 Adsorber 2 Adsorber 3
Sweep gas
Extract
Combustion, Midrex reformer,...
Raffinate
Figure 3-18: Flow sheet for scheme 4
The effluent of adsorption column through three steps is illustrated in Figure
3-17. “Light” components are collected during the first twenty minutes, mostly in
the first ten minutes. Ethylene is desorbed during the last ten minutes with
99.9% recovery. Without a dedicated carbon dioxide desorption step, there are
Page 92
75
considerable amounts of carbon dioxide in both extract and raffinate streams.
Therefore each stream is fed to its own absorber to remove carbon dioxide as
depicted in Figure 3-18. The absorber for raffinate can be however omitted if
methane and carbon dioxide are processed together, for example in burner or
Midrex methane reformer. The compositions of ethylene-rich stream before
carbon removal, after carbon removal and after ethane removal are given in
Table 3-19.
Table 3-19: Composition of ethylene-rich stream in scheme 4
Gas N2 H2 CH4 C2H6 C2H4 CO CO2
Before carbon dioxide removal
Mol. fraction, % 0 0 0.0191 2.8136 7.4323 1e-4 89.735
After carbon dioxide removal
Mol. fraction, % 0 0 0.1854 27.41 72.404 0.0006 0
After 98% ethane removal
Mol. fraction, % 0 0 0.25 0.75 99 0.0008 0
Figure 3-19: Effluent of entire cycle in scheme 4
0 5 10 15 20 25 300
5
10
15
20
25
Time (min)
Flo
w r
ate
(m
ol/s)
Outlet Flowrate
CH4
C2H6
C2H4
CO
CO2
H2
Page 93
76
3.5.2. Discussion
Operating cost with conventional downstream processing is 817 €/t ethylene in
case three, somewhat less than the case from Salerno thanks to lower raw
material cost – 583 €/t ethylene. Compare to zeolite 4A, activated carbon works
faster with cycle duration reduced by a half but separation performance is worse
with almost no ethane/ethylene separation. However neither compressor nor
blower is necessary.
Although heating and air are not required for operation, carbon removal duty is
28.6 tonne CO2 per tonne ethylene – more than double as in scheme 3.
Separation cost in scheme 4 is therefore solely cost of carbon dioxide removal –
166 €/t ethylene. Compare to scheme 3, separation cost is lightly reduced.
Compare to conventional downstream process, separation cost is reduced by
25%. Since separation makes up about 30% operating cost (in conventional
downstream process), total operating cost is reduced by 7%.
Bed inventory in scheme 4 is 3.9 tonne of activated carbon per tonne/day or 94
kg of activated carbon per kg/h ethylene production. Compare to scheme 3, bed
inventory is reduced by 18% but reduction of cost of sorbent is much more
because activated carbon can be ten times cheaper than zeolite 4A.
Based on simulation result, it can be said that methane removal with activated
carbon is more economic than conventional distillation as well as methane and
ethane simultaneous removal with zeolite 4A. The achieved result can still be
improved by:
Increasing reaction selectivity: Although separation cost is remarkably saved
(compare to conventional downstream process), total operating cost is only
reduced by a few percent as separation only makes up a small portion of
production. If reaction selectivity is increased (although conversion may
Page 94
77
decrease), operating cost will shift from raw material to separation and the
benefit of adsorptive separation will be amplified.
Lengthening desorption duration: When desorption duration is lengthened,
total cycle time will increase along with bed inventory. This means more
initial capital is required. However by lengthening desorption duration it is
possible to lower sweep gas flow rate and carbon dioxide consumption can
be saved by recirculation of diluted ethylene (the last minutes in desorption
step). Taking into consideration that operating cost contribute more than
initial capital to the final price, this compromise is likely to bring more befit.
These judgements will be implemented on experimental study.
Page 95
78
Chapter 4. Experimental study
Simulation has revealed important aspects of adsorption and useful guidelines
for designing downstream process. In the next step, single column experiment is
conducted to give more accurate information on adsorptive separation and more
concrete conclusion about the proposed solution.
4.1. Experiment setup
Adsorption experiment setup is integrated into an existing OCM mini-plant,
which already consisted of OCM fluidised-bed reactor, membrane reactor and an
absorption unit for carbon dioxide removal. The inlet of adsorption unit is
connected to the outlet of fluidised-bed reactor so that it can process reactor
effluent as described in Chapter 2. The reactor is fed with methane, oxygen and
nitrogen from cylinders installed outside mini-plant. Beside the real reactor
effluent, it is necessary to experiment on artificial ones, which may be taken
from literature or modified to test the flexibility of adsorption process. Therefore
methane, oxygen and nitrogen are also connected directly to adsorption unit
together with ethane, ethylene and carbon dioxide – the main reaction products.
Two other remarkable products – carbon monoxide and hydrogen – are either
highly toxic or explosive. For the safety reason, carbon monoxide is replaced by
nitrogen and hydrogen is replaced by helium. These replacements are acceptable
because the substitutions are similar in regard of adsorption characteristic
compare to the components of main concern – ethylene Figure 4-1.
Because both reactant and products are explosive, safety is of major concern
when setting up experiment. The mini-plant is classified as zone 2 according to
ATEX directive 94/9/EC. HAZard and OPerability (Hazop) study has been
conducted for adsorption experiment without the presence of oxygen. Therefore
oxygen will also be substituted by nitrogen in experiment. In Figure 4-2 is the
flow sheet of adsorption experiment setup in combination with fluidised-bed
Page 96
79
reactor. Gas flow rates are regulated by Mass Flow Controller (MFC) and one
Mass Flow Meter (MFM) is installed at outlet, all are manufactured by
Bronkhorst with operating range given in Table 4-1. All MFCs are calibrated at
20OC with 1% tolerance. The system is designed to operate at pressure up to 6
bar, pressure is regulated by Bürkert proportional valve type 2835 (code 175
996) installed at the outlet. For protection, a mechanical pressure relief valve is
installed at the inlet. Two three-way valves are installed at both ends of
adsorption column so that gas flow can be reversed when desired.
Figure 4-1: Adsorption isotherms on activated carbon at 0OC
0
1
2
3
4
5
6
0 1 2 3 4 5
q, m
ol/
kg
p, bar
Adsorption isotherm on activated carbon
Nitrogen Carbon monoxide Ethylene
Page 97
80
Nitrogen MFC
Methane MFC
Oxygen MFC
Ethylene MFC
Ethane MFC
CO2 MFC
Helium MFC
V-11-1
1-2
1-4
Fluidized
reactor
E1-1
1-6
V-2
2-7
2-8
2-9
2-10
2-11
2-12
Water
condenser
E1-2
1-13
1-14
Preheater
E2-12-15
Adsorber,
Heater,
Multipoint
Thermocouple
Integration
E2-2
V-4
V-5
2-18
2-20
1-21
TT
2-1
a
TT
2-2
a
PT
2-1
a
Cooler
E2-3
V-7
PT
2-2
a
F
Flowmeter
I2-1
Micro GC
IR SensorsV-6
2-29
Stack
2-30
2-31
Fluidised-bed reactor setup
2-372-36
PIC
2-1
a
V-8
He
2-162-36
V-9
CO2
V-10
C2H6
V-11
C2H4
V-16
2-382-39
2-402-41
2-422-43
V-3
2-44
TT
2-3
a
V-12
O2
V-13
CH4
V-14
N2
1-47
1-48
1-49
1-50
1-51
1-52
2-54
TU-Berlin,
Institut für Prozess- und
Verfahrenstechnik
Fachgebiet Dynamik und
Betrieb technischer Anlagen
Datum: 09.02.12
Geändert Datum: 01.03.12
R & I Fließbild
„Unifying Concepts in Catalysis“
Versuchsanlage
„Oxidative Coupling of Methane“
Bearbeiter:
Nghiem Xuan AdsorptionGeprüft: BLATT
Note:
1. Gases are supplied from gas cylinders
outside with pressure regulators (max. 8 bar).
2. E2-1 and E2-2 are integrated with ATEX
electric heater, temperatures are regulated by
PCS 7 (not shown) and limited by independent
temperature limiter (573 K, not shown).
3. E2-3 uses water as cold fluid, unregulated
temperature.
V-15
1-4
V-17
V-18
2-44
Cooling water
FI
2-1
a
2-57
V-19
V-20
Figure 4-2: Flow sheet of adsorption experiment setup
Effluent of adsorption unit flows through gas analyser. Gas analyser is very
crucial to experiment result. Gas chromatography is the typical technique in
laboratory. Although it is accurate, the sampling time (few minutes at least) is
too long in comparison with adsorption cycle. Hence online infrared (IR) gas
analyser S700 by SICK is employed for measurement. The analyser can measure
continuously because there is no separation as with chromatography. However
this feature limits the number of components can be monitored and causes
interaction between results. Careful calibration is then needed to ensure correct
results. The tolerance of infrared gas analyser using UNOR modules is less than
1% but can drift up to 1% per week and also depends on flow rate with deviation
up to 0.1% per 10 l/h. In order to minimise tolerance, weekly calibration is
performed on gas analyser and daily software calibration is performed on control
system. The measuring ranges of methane, ethane, ethylene and carbon dioxide
are 0 – 100, 0 – 30, 0 – 30 and 0 – 50 %mol respectively. They cover operating
ranges of all gases except carbon dioxide. During desorption, carbon dioxide
Page 98
81
concentration can go up to 100% and cannot be measured directly. In those
cases, carbon dioxide concentration is calculated by subtracting other gas
concentration from 100%. Since carbon dioxide will be removed by absorption,
this calculation does not affect separation performance.
Table 4-1: Operating ranges of mass flow controllers
Gas Flow rate Inlet pressure Outlet pressure
Nitrogen 0.4 – 20 l/min 2 – 11 bar 1 – 8.8 bar
Oxygen 0.2 – 10 l/min 2 – 11 bar 1 – 8.8 bar
Helium 0.4 – 20 l/min 2 – 11 bar 1 – 8.8 bar
Methane 0.2 – 10 l/min 2 – 11 bar 1 – 8.8 bar
Ethane 0.1 – 5 l/min 2 – 11 bar 1 – 8.8 bar
Ethylene 0.2 – 10 l/min 2 – 11 bar 1 – 8.8 bar
Carbon dioxide 0.2 – 8 l/min 2 – 11 bar 1 – 8.8 bar
Outlet MFM 0.4 – 20 l/min 1 – 8.8 bar 1 – 8.8 bar
Adsorption column (Figure 4-3) is made of stainless column and can be heated
up to 400OC using a 1kW EMK heating cable by Bartec. The column is 1100 mm
long, inner and outer diameters are 45 and 50 mm. Heating power and
consequently temperature are regulated via pulse width modulation (PWM) unit.
In addition, temperature is limited under 280OC via standalone BTB temperature
limiters by Bartec to follow ATEX directive. The column and heating cable are
insulated by mineral wool. A multipoint thermocouple (18 measuring points) by
Wika is implemented inside column to measure bed temperature. As mentioned
before, it is however impossible to discriminate between solid and gas phase
temperatures.
Page 99
82
Figure 4-3: Adsorption column
The adsorption setup as well as the whole mini-plant is connected to PCS 7
control system by Siemens, which based on PLC S7-400. Measurement data are
stored in the computer based Operator Station (OS). Equipments are operated
Page 100
83
via the graphical human machine interface depicted in Figure 4-4. Measured
values are illustrated at the symbols of the corresponding equipments. Special
visual effects are used to catch the attention of operator when temperatures are
higher than limits as depicted in Figure 4-5. Feeding of oxygen and flammable
gases is automatically stopped in those cases. Gas feeding is also stopped in over
pressure situation.
Figure 4-4: Human machine interface
Figure 4-5: Special states of system
A – Column over heated (>300OC)
B – Insufficient cooling (>40OC)
C – Cooling failure (>50OC)
Page 101
84
4.2. Material selection
Simulation result shows that zeolite 4A can be used for separation but its high
affinity toward carbon dioxide is a big drawback (see Appendix D for
experimental result). The ideal sorbent should adsorb carbon dioxide more than
other gases except ethylene. In that case not only operating cost is saved but
ethylene purity is also increased. Although such an ideal sorbent has not been
found yet, our simulation revealed that the adsorption characteristic of activated
carbon is more desirable than that of zeolite 4A. Adsorption isotherms of carbon
dioxide and hydrocarbons on activated carbon at 28OC are drawn in Figure 4-6
based on experimental data from (Reich, et al., 1980). It can be seen that up to 7
bar using carbon dioxide as purge gas effectively help separating ethylene from
methane. However carbon dioxide does not help in ethylene/ethane separation
as it is adsorbed less than both of them in that pressure range. This means using
activated carbon as sorbent reduces cost of methane separation but requires
extra C2-splitter. Other desired qualities of activated carbon are low price and
hydrophobicity. The later one means normal water condensing is enough and
there is no need for desiccation. Considering the relative cost of demethanizer
and C2-splitter, activated carbon is chosen as the sorbent.
Figure 4-6: Adsorption isotherms on activated carbon
0
1
2
3
4
5
6
7
0 5 10 15
q, m
ol/
kg
Pressure, bar
Methane
Ethane
Ethylene
Carbon dioxide
Page 102
85
After choosing sorbent the second decision is choosing feed composition. As
discussed in the previous chapter, adsorptive separation should be combined
with high selectivity reactor performances to minimise production cost. One of
such performances is presented in (Culp, et al., 2003) with 60% ethylene
selectivity but only 20% methane conversion. The reactor outlet composition is
given in Table 4-2. The artificial feed of adsorption unit is based on this
composition. Modifications are replacing propylene by ethylene, oxygen and
carbon monoxide by nitrogen and hydrogen by helium. Composition of the feed
used for adsorption unit is given in Table 4-3.
Table 4-2: Original reactor outlet composition
Gas N2 O2 CH4 C2H6 C3H8 C2H4 C3H6 CO CO2 H2 H2O
Mol fraction, % 3.53 1.54 69.84 1.77 0.08 6.66 0.39 0.98 5.65 9.14 0.41
Table 4-3: Composition of the feed of adsorption unit
Gas N2 CH4 C2H6 C2H4 CO2 He
Mol fraction, % 6.06 69.96 1.88 7.26 5.67 9.17
4.3. Calibration
Although calibration is performed weekly on infrared gas analyser, validation is
always performed at the beginning of the day when experiment is conducted.
First of all, pure helium is passed through gas analyser and zero point drift is read
from measured value. Then different mixtures with known composition are
passed through gas analyser and sensitivity drift is determined. Finally, measured
value is corrected by linear equation (4.1) with parameters a and b calculated
from two point measurement.
(4.1)
Page 103
86
In Table 4-4 is the result of calibration procedure.
Table 4-4: Gas analyser calibration
Flow Actual value Measured value a b
Methane calibration
4000 mln/min He 0% -0.07%
4000 mln/min CH4 100% 99.6%
1 0.07
Ethane calibration
4000 mln/min He 0% 0.04%
3800 mln/min He + 200 mln/min C2H6 5% 5.02%
1 -0.04
Ethylene calibration
4000 mln/min He 0% -0.35%
3600 mln/min He + 400 mln/min C2H4 10% 10.66%
0.91 0.35
Carbon dioxide calibration
4000 mln/min He 0% 0.07%
2000 mln/min He + 2000 mln/min CO2 50% 47.82%
1.05 -0.07
Page 104
87
4.4. Separation
Adsorption column is loaded with 800g activated carbon from ChemPur (Nr.
009074). The packing density is 500 kg/m3 and surface area is 300 m2/g. Feed
flow rate is set at 0.4 g/min ethylene. With the composition as in Table 4-3, the
feed flow is given in Table 4-5.
Table 4-5: Feed flow
Gas N2 CH4 C2H6 C2H4 CO2 He
Flow, mln/min 267 3083 83 320 250 404
A separation cycle consists of five steps: one adsorption and four desorptions.
Sweep gas used in desorption steps is the effluent of the next step except the
last desorption step when 4000 mln/min carbon dioxide is used as sweep gas.
Each step lasts ten minutes. Because there is only one column available, real
recycled effluents are replaced by artificial mixtures of ethylene and carbon
dioxide. During experiment bed temperature varies between 25OC and 31OC
while feed temperature is fixed at 22OC. This variation is solely due to
adsorption/desorption heat as heating cable was turn off. Temperature variation
of a representative point (point 9 in the multipoint thermocouple) is depicted in
Figure 4-7. During adsorption step, temperature drop as the bed is cooled down
by fed methane. After that temperature rises because of adsorption enthalpy of
carbon dioxide. During 12th minute, temperature rises sharply, indicate the
arrival of adsorption front. It then goes down slowly to the initial value.
Operating pressure varies from 0.2 bar to 1.4 bar. The high pressure is because
of gas analyser, pressure drop across adsorption column is always less than 0.1
bar. Inlet and outlet pressures are also depicted in Figure 4-7. The sudden drop
of pressure between 10th and 15th minutes indicates co-current blow step.
Page 105
88
Figure 4-7: Column temperature and pressure
22
23
24
25
26
27
28
29
30
31
32
0 5 10 15 20 25 30 35 40 45 50
Tem
pe
ratu
re, o
C
Time, min
Temperature variation during cycle
0
200
400
600
800
1000
1200
1400
1600
0 5 10 15 20 25 30 35 40 45 50
Pre
ssu
re, m
bar
Time, min
Pressure variation during cycle
Inlet Outlet
Page 106
89
The breakthrough curve is illustrated in Figure 4-8. Carbon dioxide fraction went
out of measurement range and measured value stay fixed at the maximum. One
important notice is measured methane fraction varied between 0.17 and 0.53 at
the end of cycle, when it should be 0 because all methane had been desorbed.
This wrong information is caused by the interaction between gases. In this case,
high concentrated carbon dioxide increases the measured values of methane by
infrared analyser. In order to calculate methane accumulation correctly, the
measured values of methane must be subtracted by the average value, 0.35%.
Figure 4-8: Breakthrough curve
The outlet flow rates of adsorption unit after correction is depicted in Figure 4-9.
It can be seen from both figures that outlet flow can be clearly divided into two
parts. The first part came out in the first 16 minutes (10 min. adsorption and 6
min. co-current blow) consists of methane, carbon dioxide, unmeasured nitrogen
0
10
20
30
40
50
60
70
80
90
5 10 15 20 25 30 35 40 45 50
Mo
l fra
ctio
n, %
Time, min
Breakthrough curves
Methane Ethane Ethylene Carbon dioxide
Page 107
90
and helium. The second contain mostly carbon dioxide, ethylene, ethane and
some methane as contaminant. Ethylene fraction rose quickly to nearly 10% then
declined gradually to 0%.
Figure 4-9: Outlet flow rate
Experiment shows that ethylene/ethane separation is ineffective. This was
predicted by simulation in section 3.5. On the other hand ethylene/methane
separation is excellent. Methane fraction had already dropped to 1.7% when
ethylene appeared at the outlet and approached 0% after a few minutes. The
composition of ethylene-rich stream is given in Table 4-6.
Table 4-6: Composition of experimental ethylene-rich stream
Gas CH4 C2H6 C2H4 CO2
Mol. fraction, % 0.02 1.11 5.73 93.14
0
1
1
2
2
3
3
4
4
5
0 5 10 15 20 25 30 35 40 45 50
Flo
w r
ate
, l/m
in
Time, min
Outlet flow rates
Methane Ethane Ethylene Carbon dioxide
Page 108
91
4.5. Discussion
4.5.1. Simulation – experiment comparison
Figure 4-10: Simulated temperature variation during cycle
In comparison with experiment, the trend of simulated temperature variation
(Figure 4-10) is similar but the amplitude is four times bigger. This is easy to
understand since simulation was conducted with higher adsorption capacity
(surface area is 3.3 times larger than experiment) and perfect heat insulation of
column wall is assumed. Incomplete insulation in experiment makes the process
closer to isothermal condition and causes a slight difference between
temperatures at the beginning and the end of cycle (approx. 1OC). For a detailed
comparison between experiment and simulation, the adsorption isotherm and
adsorption enthalpy for activated carbon Nr. 009074 by ChemPur is needed.
The trends of outlet flow in simulation (Figure 3-19) and experiment (Figure 4-9)
are also similar. Compare to simulation, experimental cycle was lengthened from
30 minutes to 50 minutes on purpose. This increases bed inventory by 40% but
allow effluent recirculation, which reduces carbon dioxide removal duty from
28.6 t/t ethylene to 25 t/t ethylene. Consider the low price of activated carbon,
long cycle is more economical.
0 5 10 15 20 25 305
10
15
20
25
30
35
Time (min)
Tem
pera
ture
(oC
)
Temperature over time
Page 109
92
4.5.2. Economic evaluation
The gas analyser did not detect any ethylene loss. Therefore it can be claimed,
within confidence level and tolerance of the device, that ethylene is completely
recovered. When carbon dioxide is removed from the composition in Table 4-6, a
mixture of 83.5% ethylene + 16.2% ethane + 0.3% methane retrieved. Ethylene
with 99% purity can be obtained if C2-splitter can remove 97% of ethane.
Compare to simulation with zeolite 4A, the whole cycle time is only five times of
adsorption time thanks to short co-current blow. This means minimum five
columns instead of six are needed for continuous processing. However inlet and
outlet switching no longer match each other. If co-current blow is lengthened to
synchronise inlet and outlet switching, six columns are again required and bed
inventory is 6.7 tonne of activated carbon for per tonne/day or 160 kg of
activated carbon for per kg/h C2 product. As operating cost, carbon dioxide
consumption is 25 t/t C2 production. Bigger bed inventory and carbon dioxide
consumption is the consequence of weaker carbon dioxide adsorption: it takes
more carbon dioxide and time to displace the same amount of ethylene. They
are however small drawbacks in comparison to the benefit gained with using
activated carbon. Despite increased bed inventory sorbent cost is reduced thanks
to cheap price.
Lower carbon dioxide affinity makes the separation robust against not only inert
diluents but also C2 selectivity. Since carbon dioxide cannot compete with
ethylene and ethane during adsorption, it does not affect ethylene adsorption
capacity of the bed and more carbon dioxide caused by lower C2 selectivity will
not increase bed inventory. Carbon dioxide removal duty is also tied to
adsorption selectivity instead of reaction selectivity as recycled stream is larger
than the amount produced by reactor. This means 6.7 tonne of activated carbon
for per tonne/day C2 product and 25 tonne of carbon dioxide per tonne of C2 are
common numbers for typical reactor performances except ones with very low
Page 110
93
selectivity, which should never been considered. The huge amount of carbon
dioxide certainly imposes a big operating cost but no other cost is required. In
other word operating cost of adsorption unit has been shifted to carbon dioxide
removal section.
In the following is the evaluation of the studied case:
The artificial reactor effluent used in experiment is corresponding to the reactor
performance in Table 4-7 (with nitrogen and helium replace carbon monoxide
and hydrogen)
Table 4-7: Artificial reactor performance
XCH4, % SC2H4, % SC2H6, % SCO, % SCO2, %
Consumption per tonne C2H4
CH4 O2
30.02 48.38 12.53 20.19 18.9 2.36 tonne 3.79 tonne
The operating cost when combining this reactor performance with conventional
downstream processing is given in Table 4-8. The high operating cost is in
agreement with previous work (Suzuki, et al., 1996) where 30% methane
conversion and 80% C2 selectivity are required for profitability. Raw materials
make up 60% operating cost while compression and refrigerant for demethanizer
make up more than 90% of utilities cost. It is worthy notice that operating cost of
C2-splitter is quite small despite the difficulty of ethylene/ethane separation. The
reason is C2 account for less than 10% of the whole stream and C2-spliter work at
-20OC, much closer to ambient temperature than demethanizer. The expense of
ethylene fractionation lies in very high distillation column rather than utilities
consumption.
Page 111
94
Table 4-8: Operating cost with conventional downstream process
Item Unit Amount Price*, € Total price, €
Reaction
Methane tonne 2.36 140 330.4
Oxygen tonne 3.79 30 113.7
Heating GJ 8.13 2 16.26
Cooling GJ 45.3 0.05 2.27
Compression Nm3 11019 0,009 99.17
CO2 removal
Pump** tonne 1.23 0,9 1.11
Steam tonne 1.23 5.67 6.97
Caustic soda kg 1.1 3 3.3
Demethanizer
Refrigerant GJ 4.5 38 171
C2-splitter
Refrigerant GJ 1.05 1.6 1.68
Total 745.86
* Utilities prices are calculated according to (Ulrich &
Vasudevan, 2006) at CE PCI = 588.8 and fuel price at 2 $/GJ
** Pumping cost per tonne carbon dioxide
The operating cost when combining this reactor performance with the proposed
downstream processing is summarised in Table 4-9. Total operating cost is
reduced by more than 100€ thanks to the new proposal. Although carbon
dioxide removal cost increases almost fifteen times, it is still less than the
refrigerant cost for demethanizer that we get rid of. The important improvement
is nearly twelve times reduction of compression duty. This does not only result in
the corresponding reduction of electricity consumption but also a big save of
capital cost for compressor.
Page 112
95
Table 4-9: Operating cost with proposed downstream process
Item Unit Amount Price*, € Total price, €
Reaction
Methane tonne 2.36 140 330.4
Oxygen tonne 3.79 30 113.7
Heating GJ 8.13 2 16.26
Cooling GJ 45.3 0.05 2.27
CO2 removal
Pump** tonne 25 0,9 22.5
Steam tonne 25 5.67 141.75
Caustic soda kg 0.1 3 0.3
C2-splitter
Compression Nm3 955 0,009 8.6
Refrigerant GJ 1.05 1.6 1.68
Total 637.46
* Utilities prices are calculated according to (Ulrich &
Vasudevan, 2006) at CE PCI = 588.8 and fuel price at 2 $/GJ
** Pumping cost per tonne carbon dioxide
In spite of all the improvement said above, total operating cost is still 50€ higher
than the threshold given in Chapter 2 – 580€. According to global cost curve of
2011 (source: Dow), this performance is only competitive in Northeast Asia or
Western Europe, where fifteen refineries have shut down since 2008 due to
weak profit margin (Kent & Werber, 2013) and 33% of crackers are expected to
be uneconomical by 2015 (Wanichko, 2014). This means adsorption alone is not
enough to make OCM profitable. However it opens big chance for other savings
that ensure a profitable OCM. Two of them are described below:
Oxygen cost: Adsorption process is more robust to the presence of nitrogen.
If the “light” stream is not recycled back to OCM reactor, dilution by
nitrogen instead of excess methane will not affect production cost
significantly. In that case enriched oxygen or even air can be used instead of
pure oxygen and oxygen price will be greatly reduced. Even when pure
oxygen is selected, an ASU can be installed. The surplus energy released by
Page 113
96
reactor is enough to cover electricity demand from ASU, gas compressor and
refrigerator. In any case, oxygen cost can be reduced by a half at least.
Steam cost: Steam accounts for more than 75 of utilities cost but it is already
available from reactor cooler. Extra piping is the only work required to make
use of this free steam. With a modest estimation, reactor cooler can supply
half of steam demand by carbon dioxide stripper.
With two saving options above, operating cost can be reduce to ca. 500 €/t and
operating cost by OCM is in the range of production cost in United States, where
is selected for economic evaluation. The only question left is the capital cost of
the proposed solution. Compare to conventional downstream process,
compressor size is reduced more than ten times and cryogenic equipments are
taken away. The trade-off is bigger absorption column and investment in
adsorption unit. Unlike raw materials or utilities cost, this initial expense depend
considerably on process scale. At the scale of 135 000 t/y, demethanizer costs
€6.8 million and carbon dioxide removal section (duty: 4.09 tonne CO2 per tonne
ethylene) costs €15.3 million according to (Salerno, 2013). Using six-tenths rule,
cost of carbon dioxide removal section will rise to €45.9 million with the
proposed process. A comparison between two alternatives is given in Table 4-10
with equipment costs estimated by Aspen Process Economic Analyzer. Units such
as reactor are the same in both cases and not shown.
Table 4-10: Fixed cost comparison
Item Conventional, mil. € Proposal, mil. €
Compressor 25.4 3.1
CO2 removal 15.3 45.9
Demethanizer 6.8 0
Adsorption columns 0 6.1
Sorbent 0 0.5
Total 47.5 55.6
Page 114
97
The proposed required about €8 million more fixed cost than the conventional
one. This difference is small compare to the investment the whole plan and can
be pay back within a year by the saving from operating cost. As conclusion we
can say that the proposed downstream process is superior to the conventional
one and makes OCM technology profitable. The whole process can be designed
as described in Figure 2-5 with composition of streams given in Table 4-11.
Table 4-11: Stream compositions
Stream Fraction, % mol
CH4 C2H4 C2H6 CO CO2 H2
Feed 69.96 7.26 1.88 6.06 5.67 9.17
Sweep gas 0 0 0 0 100 0
Extract 0.02 5.73 1.11 0 93.14 0
Raffinate 40.08 0 0.55 9.67 35.07 14.63
C2 0.29 83.53 16.18 0 0 0
C2H4 0.35 99.46 0.19 0 0 0
C2H6 0 4.96 95.04 0 0 0
Page 115
98
Chapter 5. Conclusions and outlook
The idea of OCM started in 1970s, after the oil crisis. Since then it has been
developed together with other alternative solutions such as renewable energy.
In recent years, when oil price again roses to the new record, new technologies
such as bio-ethanol has find theirs application and helped mitigate the impact on
economy. In ethylene industry, advances of hydraulic fracturing and horizontal
drilling technology leaded to shale gas boom and ethane is replacing naphtha as
the main raw material: the global share of ethylene from ethane and liquefied
petroleum gas (LPG) will rise from 40% in 2008 (Seddon, 2010) to nearly 50% by
2023 (Energy Security Analysis, Inc., 2013). When this feed stock is not available,
CTO technology, which comprises coal gasification followed by methanol
synthesis and MTO, and GTL technology are chosen to utilise coal and methane
from natural gas. MTO alone can also be utilised to produce ethylene from
imported methanol. It is getting popular in China with a 300 000 t/y plant
operating in Nanjing and three more planned to operate by 2015 with capacities
of 295 000 t/y, 600 000 t/y and 833 000 t/y. GTL plants are operated and planned
in North America and Middle East, where methane is abundant. These plants are
all expensive because of many conversion steps. For example a GTL plant can
cost three times as much as a traditional refinery. Despite that fact, these
technologies are still more competitive than such a direct conversion technology
as OCM, which requires less capital cost.
It is easy to point out that poor reactor performance is the weak point of OCM
technology. The trade-off between methane conversion and ethylene selectivity
leads to high direct cost due to either large raw materials consumption or large
separation duty. There is however another distinctive feature of OCM: reactor
effluent contains much more methane and carbon dioxide than any other
technology: MTO, GTL or ethane cracking. This specialty makes conventional
downstream process unsuitable to OCM and results in more direct cost. In this
Page 116
99
thesis, a new downstream process based on adsorption is proposed. It ties
separation cost to the amount of ethylene instead of methane and carbon
dioxide. Therefore it is more appropriate for the low ethylene fraction in OCM
downstream and makes this technology profitable with the current reactor
performances. Furthermore, tying separation cost to ethylene fraction makes the
proposed process more robust and flexible with reactor performance. Together
with the absent of cryogenic conditions it makes plan design and operation are
easier. Another advantage of the new proposal is the ability of utilising all the
heat released by reaction. This energy economisation, in combination with highly
selective reactor performance, can reduce carbon footprint to a point where it is
lower than for ethane cracking – a significant advantage in locations with strict
emission regulation. Overall, there is a big chance that OCM with the proposed
downstream process is competitive enough to find its industrial application in
the near future.
Beside the improvement with adsorptive separation there are still others needed
for successful commercialisation of OCM. The first of all is OCM reactor – the
heart of the process. New downstream solution has made current reactor
performances profitable. Some of them such as case 1 in Table 2-1 are even
better than the one used in experiment. However they are all nominal
performance achieved in small scale within short duration. The longest test in
Table 2-1 is case 4 with 100 hours, its performance is comparable to the one
used in experiment. The longest tests found in literature are conducted by
Cantrell et al. (Cantrell, et al., 2003) in 30 days. Their performances are however
poorer with less than 30% ethylene selectivity and less than 14% methane
conversion. In the future more tests with longer time are required before any
industrial application.
Catalyst and reactor developments are both crucial to performance stability.
Fixed-bed reactor is the most popular type and yields acceptable performances.
Page 117
100
Heat management is of great importance to long time performance as
overheated catalysts may degrade. Inert dilution or extra methane is essential to
maintain heat dissipation rate when specific heat transfer area is reduced by
scaling up. Learning from case 4, steam dilution may be a good choice as it does
not only carry out reaction heat but also prevent coke formation over catalyst
surface.
Fluidised-bed reactor is a useful solution for temperature control and can
provide nearly isothermal condition. Fluidisation required more mechanically
stable catalyst and ethylene selectivity may decrease due to back mixing. With
both pros and cons, further study should be conducted to quantitatively evaluate
this option in comparison with the standard fixed-bed reactor.
Membrane reactor also attracts interest from scientist with the potential of
improving performance. Highest C2 yield has been achieved with catalytic
membrane reactor (case 7 in Table 2-1) but ethane/ethylene ratio is quite high,
leading to low ethylene selectivity. Short contact time due to the thin catalyst
layer may be the cause of this drawback. Combination with packed catalytic bed
for further dehydrogenation of ethane should be considered. Non-catalytic
membranes were also used for the purpose of achieving the optimal oxygen
profile along reactor. Some improvements have been achieved but the
complication with membrane material poses a real difficulty for industrial
application. On the other hand, fixed-bed reactor with secondary feed point also
gives the ability to manipulate oxygen profile. Since membrane reactor is a new
concept in industry, time is needed for finding its application.
No matter which catalyst and reactor used, it is reasonable to expect selectivity
far below 100% and a large amount of by-products. Therefore the next
improvement should be utilising them to increase the profitability of the whole
process. All major by-products of OCM have their application and can be put in
other processes and converted to valuable products. This task is however much
Page 118
101
easier on paper than in the real world. Several challenges must be considered for
practical application:
Technical challenge: Connecting multiple process increases complexity,
safety concern and operation difficulty. Flexibility is significantly reduced
thanks to the requirement of not only main product quality but also by-
product quality. Comprehensive study of any proposal must analyse not only
nominal performance but also deviation from that point. The proposed
downstream solution produces two streams of by-product: ethane and
mixture of methane, carbon dioxide, carbon monoxide, hydrogen. Extra
separation is then necessary prior to processing any pure component except
ethane. Processes which can consume methane, carbon dioxide, carbon
monoxide and hydrogen together such as combustion are preferred.
Financial challenge: Adding extra equipments needs more investment. This
matter may be simple from academic perspective but of great importance in
real application.
Market challenge: Product value can be easily calculated by multiplying price
with productivity. Realising this value is however not so simple. The broader
product range the more cost of distribution network and other marketing
measure are required. For example, co-generation of electricity as in (Hugill,
et al., 2005) requires expensive power transmission network in remote area.
Another matter with expanding product range is supply/demand mismatch.
Productivity ratios are fixed by technology but demands of different
products vary independently. Supply/demand mismatch is thus inevitable
and chance is higher with more products.
These challenges signify that further study is necessary for accurate evaluation of
by-product value. As preliminary result, we suggest convert all by-products to
ethylene or higher hydrocarbons and avoid the challenges with expanding
product range. Ethane retrieved at high purity and pressure can be converted by
Page 119
102
mature ethane crackers and the mixture of methane, carbon dioxide, carbon
monoxide and hydrogen can be converted by Midrex reformer and Fischer-
Tropsch reactor (which is a part of GTL technology). Conversion of syngas via
methanol is also possible but requires more steps and higher pressure. Light
hydrocarbons from both additional processes can be separated in the same units
with OCM downstream while heavy ones need extra separation equipments. Part
of mixture stream will also be burnt to supply energy to fired heater or
compressor if necessary. Since all technology mentioned above are already
commercialised, the chance of successful combination is quite high. The
economic feasibility of Midrex reformer and low pressure Fischer-Tropscher
reactor combination has not been proved. However the ecologic effect is
definitely positive with the reduction of carbon footprint. Anyway further
intensive study is essential as profitability depends on many other factors such as
production scale or region
Last but not least is the further improvement of downstream process. The
synthesis of adsorptive process was based on available materials but there is
always the possibility to develop better ones. Apart from common qualities such
as capacity, stability, important criteria of the new sorbents include order of
affinity and the easiness of carbon dioxide desorption as discussed. For the
process itself, some analysis has been performed (see Appendix E) but there is
still the room for optimisation, which depends on the particular sorbent and
reactor performance. Another step that plays an important role in downstream
process is carbon dioxide separation. Carbon capture technology is currently an
attractive topic with much progress. However further study is necessary to tailor
these technologies for the low pressure but highly concentrated stream in the
proposal. With comprehensive development of the whole process, it is strongly
believed that oxidative coupling of methane will be a practical choice for
producing ethylene in the future.
Page 120
103
Appendix A. Material calculation
Assuming that only two reactions take place in reactor and oxygen reacts
completely:
2CH4 + O2 C2H4 + 2H2O (1.1)
CH4 + 2O2 CO2 + 2H2O (1.2)
Then 1 mol of methane fed in the reactor will produce Y/2 mol of ethylene and
X–Y mol of carbon dioxide while (1-X) mol of methane remains unconverted.
1 mol of oxygen is consumed to produce 1 mol of ethylene. 2 mol of oxygen is
consumed to produce 1 mol of carbon dioxide. Assuming total oxygen
conversion, (2X-1.5Y) mol of oxygen must be fed along with 1 mol of methane
to produce Y/2 mol of ethylene and X–Y mol of carbon dioxide.
Assuming complete water removal, inlet and outlet compositions are calculated
and summarised in Table A-1.
Page 121
104
Table A-1: Inlet and outlet composition
Methane Oxygen Ethylene Carbon dioxide Total
Molecular mass
16 32 28 44
Amount per mol methane feed, mol
Inlet 1 0 0
Outlet 0 Y/2
Consumption X 0 0
Amount per mol ethylene production, mol
Inlet 2/Y
0 0
Outlet
0 1
Consumption 2/S
0 0
Molar fraction, %
Outlet
0
100
Weight per mol ethylene production, g
Inlet
0 0
Outlet
0 28
Consumption 32/S
0 0
Weight per gram ethylene production, g
Inlet
0 0
Outlet
0 1
Consumption
0 0
* S and Y are selectivity and yield of ethylene, the subscript C2H4 is omitted for the sake of brevity.
** The difference between inlet and outlet weights corresponds to the condensed water.
Page 122
105
Appendix B. Utility calculation
1. Reactant heating
As calculated in Appendix A, reactor feed per tonne ethylene production consists
of
tonne of methane and
tonne of oxygen. It is assumed that feed
stream will be heated to 300OC below reaction temperature by waste heat
exchanger. A furnace is then needed to heat up the feed stream 300OC more.
Specific heat capacity is fixed at 40 J/mol.K for both gases. This translates into 2.5
MJ/t.K for methane (16 g/mol) and 1.25 MJ/t.K for oxygen (32 g/mol). Heat
required for each gas is calculated according to the simple equation Q=m.Cp T
With furnace efficiency is chosen as 90%, total fuel consumption of the furnace is
2. Reactor cooling
As calculated in Appendix A,
kmol of carbon dioxide are produced along
with 1 kmol of ethylene. 280 MJ are released when producing 1 kmol of ethylene
via reaction (1.1) and 890 MJ are released when producing 1 kmol of carbon
dioxide via reaction (1.2). In total,
MJ are released by both
reactions when 1 kmol of ethylene is produced. This translates into
GJ/t ethylene production.
3. Compression
As calculated in Appendix A, total flow rate per ethylene flow rate is
mol/mol
at reactor outlet. This means production of 1 kmol of ethylene (28k g) requires
compression of
kmol gases, which is equivalent to
Nm3. In other
words,
Nm3 need to be compressed to produce 1 tonne of ethylene.
Page 123
106
4. Caustic soda
In the feed stream of caustic wash tower 1 kmol of ethylene is accompanied by
kmol of methane. The standard volume is then
Nm3
per kmol ethylene, which is equivalent to
Nm3 per tonne
ethylene. Since each Nm3 needs about 0.1 g caustic soda, caustic soda
consumption is
kg/t ethylene production.
Page 124
107
Appendix C. Utility price
Utilities prices are calculated according to equation (C.1) (Ulrich & Vasudevan,
2006):
Cu = a (CE PCI) + b (Cf) (C.1)
where Cu is the price of the utility in USD, Cf is the price of fuel in $/GJ, CE PCI is
the dimensionless index issued monthly by Chemical Engineering (Chemical
Engineering, 2013), and a and b are coefficients whose units depend on utility
type.
In this work, CE PCI is chosen as 588 (December 2011). Natural gas is chosen as
fuel with price about 2 $/GJ in April 2012 (U.S. Energy Information
Administration, 2013). The utility prices are converted from USD to EUR with
exchange rate at 1.3.
1. Cooling water
For cooling water, a = 0.0001 + 3x10⁻⁵q-1 and b = 0.003 with q is capacity in m3/s
(maximum 10). q is chosen as 10 concerning the scale of OCM plant. The price of
cooling water is 0.05 €/GJ
2. Electricity
For electricity, a = 1.3x10⁻⁴ and b = 0.01. Electricity price calculated by equation
(C.1) is 0.0965 $/kWh or 0.0743 €/kWh. The round up value of 0.075 €/kWh is
used for cost calculation.
3. Steam
For steam, a = 2.7x10⁻⁵m-0.9 and b = 0.0034p0.05 with m is capacity in kg/s
(maximum 40) and p is pressure in barg. p is chosen as 1 since reboiler works at
low temperature and m is chosen as maximum value 40. Steam price calculated
by equation (C.1) is 7.37 $/t or 5.67 €/t.
Page 125
108
4. Refrigerant
For refrigerant, a = 0.6Q-0.9T-3 and b = 1.1x10⁶T-5 with Q is cooling capacity in kJ/s
(maximum 1000) and T is absolute temperature. Q is chosen as 1000 concerning
the scale of OCM plant. Refrigerant prices at different temperature are given in
Table C-1.
Table C-1: Refrigerant price
Temperature, OC Price, €/GJ Application
-30 2 Deethanizer
-138 38 Demethanizer
-153 68 Demethanizer with excess uncondensed gas
Page 126
109
Appendix D. Experiment with zeolite 4A
Adsorption column was loaded with 800g zeolite 4A, which was supplied by Carl
Roth GmbH (article number: 8471) in the form of 1.6 – 2.6 mm pellets. The same
flow as the experiment with activated carbon (Table 4-5) was fed to the column
in ten minutes (totally 44072 mln of gases). Then 26250 mln of carbon dioxide
were fed to the column in 20 minutes. Finally the column is purged by 235563
mln of nitrogen in 170 minutes. This extreme long time is to ensure the
maximum desorption efficient. In other words, it ensures that nitrogen
consumption will be minimised. In order to accelerate desorption, the column is
heated up and later cooled down to the original temperature. Due to the limited
nitrogen flow rate, it is only heated up to 70OC instead of more than 200OC as in
simulation. As the result, nitrogen consumption is 58890 Nm3/t ethylene – more
than double of the simulation result. The carbon dioxide outlet flow rate and
column temperature is depicted in Figure D-1. Experiment confirmed that the
high affinity toward carbon dioxide make zeolite unsuitable of the application.
Figure D-1: Carbon dioxide desorption with zeolite 4A
0
20
40
60
80
0 50 100 150 200
Mo
l fra
ctio
n, %
Time, min
Carbon dioxide
30
40
50
60
70
80
0 50 100 150 200
Tem
pe
ratu
re, o
C
Time, min
Temperature
Page 127
110
Appendix E. Three-step scenario
As said in the conceptual development section, the adsorptive separation
process involves two essential steps, adsorption and ethylene desorption, and
one optional step – carbon dioxide desorption. Two-step scenario is discussed in
Chapter 4. Here three-step scenario is investigated. The extra step lasts twenty
minutes. 8000 mln/min air is used to purge carbon dioxide; the effluent of the
last ten minutes is recycled (artificially) to save air consumption. Breakthrough
curve and outlet flow rate are depicted in Figure E-1, the values of carbon
dioxide measurement at the beginning of the third step are approximate.
Ethylene separation performance is similar to two-step scenario but ‘light’
stream contains much less carbon dioxide. The prices of carbon dioxide
separation are longer cycle, which means bigger bed inventory, and air
consumption at 20000 m3/t ethylene production. Although air consumption is
four times less than the case of zeolite thanks to the lower affinity of carbon
dioxide, it still requires significant compressing effort.
Page 128
111
Figure E-1: Breakthrough curve and outlet flow rate – three-step scenario
Another problem arises with the third step is revamping. In comparison with
zeolite, activated carbon has bigger pore and consequently faster mass transfer
rate. Therefore the durations of adsorption/desorption steps are inverse
proportional to gas flow rates. For example if feed flow rate from reactor is
doubled, adsorption time will be halved. Carbon dioxide flow rate is doubled
together with feed flow rate and ethylene desorption time will be also halved.
This means, in two-step scenario, the same adsorption unit can process double
amount of feed gas just by reducing duration of all steps by a half. The only
0 10 20 30 40 50 60 70 80 90
100
0 10 20 30 40 50 60 70
Mo
l fra
ctio
n, %
Time, min
Breakthrough curves
Methane Ethane Ethylene Carbon dioxide
0
2
4
6
8
10
12
0 10 20 30 40 50 60 70
Flo
w r
ate
, l/m
in
Time, min
Outlet flow rates
Methane Ethane Ethylene Carbon dioxide Total
Page 129
112
limitation is the switching rate between columns. The same practice in three-
step scenario will require also double air flow rate. When air blower is already at
full capacity, either extra blower or extra columns need to be installed to handle
higher feed flow rate. Figure E-2 demonstrates a case study of revamping for
double feed flow rate but sweep gases flow rates are fixed. Adsorption step is
shortened but total cycle duration stays almost the same. The number of
columns, which is equal to cycle duration – adsorption duration ratio, must be
increased for continuous processing.
In general, two-step scenario is more recommended.
Figure E-2: Revamp for double feed flow rate in three-step scenario
0 10 20 30 40 50 60 70 80 90
100
0 10 20 30 40 50 60 Mo
l fra
ctio
n, %
Time, min
Breakthrough curves
Methane Ethane Ethylene Carbon dioxide
0
2
4
6
8
10
12
0 10 20 30 40 50 60 Flo
w r
ate
, l/m
in
Time, min
Outlet flow rates
Methane Ethane Ethylene Carbon dioxide Total
Page 130
113
References
Aika, K. & Nishiyama, T., 1988. Utilisation of CO2 in the Oxidative Coupling of Methane
over PbO-MgO and PbO-CaO. J. Chem. Soc., Chem. Commun., pp. 70 - 71.
Alter, E. & Bruns, L., 1982. Process for Separating off Olefins from Gases Containing
Olefins. USA, Patent No. 4328382.
Aris, R. & Amundson, N. R., 1957. Some Remarks on Longitudinal Mixing or Diffusion in
Fixed Bed. AIChE Journal, 3(2), pp. 280 - 282.
Asami, K. et al., 1995. Conversion of methane with carbon dioxide into C2 hydrocarbons
over metal oxides. Applied Catalysis A: General, Volume 126, pp. 245-255.
Asami, K., Kusakabe, K.-i., Ashi, N. & Ohtsuka, Y., 1997. Synthesis of ethane and ethylene
from methane and carbon dioxide over praseodymium oxide catalysts. Applied Catalysis
A: General, Volume 156, pp. 43-56.
Baker, B. B. & Knaack, D. F., 1961. Process for the Separation of Hydrocarbons. USA,
Patent No. 3007981.
Barchas, R., McCue, R., Wallsgrove, C. & Whitney, M., 1999. Chemical Absorption
Process for Recovering Olefins from Cracked Gases. USA, Patent No. 5859304.
Barghezadeh, E., Hassan, A. & Hassan, A., 2004. Preparation of Catalyst and Use for High
Yield Conversion of Methane to Ethylene. USA, Patent No. US20040220053A1.
Baronskaya, N. A., Woldman, L. S., Davydov, A. A. & Buyevskaya, O. V., 1996. Ethylene
Recovery from the Gas Product of Methane Oxidative Coupling by Temperature Swing
Adsorption. Gas Sep. Purif., 10(1), pp. 85 - 88.
Bart, H.-J. & von Gemmingen, U., 2005. Adsorption. In: Ullmann's Encyclopedia of
Industrial Chemistry. s.l.:Wiley-VCH, pp. 1 - 75.
Baxter, W. N., 1963. Process for the Separation of Hydrocarbons. USA, Patent No.
3101381.
Baxter, W. N., 1965. Process for the Separation of Hydrocarbons. USA, Patent No.
3218366.
Bernard, G. G. & Bond, D. C., 1948. Separation of Olefins from Hydrocarbon Mixtures.
USA, Patent No. 2451376.
Beysel, G., 2009. Enhanced Cryogenic Air Separation - a Proven Process applied to
Oxyfuel. Cottbus, s.n.
Page 131
114
Bhatia, S., Thien, C. Y. & Mohamed, A. R., 2009. Oxidative Coupling of Methane (OCM) in
a Catalytic Membrane Reactor and Comparison of its Performance with other Catalytic
Reactors. Chemical Engineering Journal, Volume 148, pp. 525 - 532.
Bjorklund, M. C., Kruglov, A. V. & Carr, R. W., 2001. Further Studies of the Oxidative
Coupling of Methane to Ethane and Ethylene in a Simulated Countercurrent Moving Bed
Chromatographic Reactor. Ind. Eng. Chem. Res., Volume 40, pp. 2236-2242.
Brown, R. E. & Hair, R. L., 1993. Monoolefin/Paraffin Separation by Selective Absorption.
USA, Patent No. 5202521.
Brunauer, S., Deming, L. S., Deming, W. E. & Teller, E., 1940. On a Theory of the van der
Walls Adsorption of Gases. J. Am. Chem. Soc., 62(7), pp. 1723 - 1732.
Butt, H., Graf, K. & Kappl, M., 2003. Adsorption. In: Physics and Chemistry of Interfaces.
Weinheim: Wiley-VCH.
Cai, Y. et al., 2003. Selective conversion of methane to C2 hydrocarbons using carbon
dioxide over Mn–SrCO3 catalysts. Catalysis Letters, 86(4), pp. 191-195.
Cantrell, J. et al., 2013. Consider GTL as an Economic Alternative for Stranded Natural
Gas and Ethane. Hydrocarbon Processing.
Cantrell, R. D. et al., 2003. Catalysts for the Oxidative Dehydrogenation of Hydrocarbons.
USA, Patent No. US6576803B2.
Chemical Engineering, 2013. Chemical Engineering Plant Cost Index. [Online]
Available at: http://www.che.com/pci/
Chen, C., Xu, Y., Li, G. & Guo, X., 1996. Oxidative coupling of methane by carbon dioxide:
a highly C2 selective La203/ZnO catalyst. Catalysis Letters, Volume 42, pp. 149-153.
Choi, B.-U., Choi, D.-K., Lee, Y.-W. & Lee, B.-K., 2003. Adsorption Equilibria of Methane,
Ethane, Ethylene, Nitrogen, and Hydrogen onto Activated Carbon. Journal of Chemical
Engineering and Data, Volume 48, pp. 603 - 607.
Chu, P. & Landis, E., 1990. Selective Oxidative Coupling. USA, Patent No. US4914252.
Cobb, J. R., 1958. Recovery of Olefin Hydrocarbons. USA, Patent No. 2855433.
Cole, R. M., 1950. Solvent Extraction of Unsaturated Hydrocarbons. USA, Patent No.
2523681.
Cooper, J. B. & Small, K., 1997. Process for Recovering Olefins from Gaseous Mixtures.
USA, Patent No. 5639935.
Page 132
115
Culp, G. L. et al., 2003. Methods for Manufacturing Olefins from Lower Alkans by
Oxidative Dehydrogenation. USA, Patent No. US6518476B1.
Curtis, T. & Ware, T., 2012. Restricting North Dakota Gas-flaring Would Delay Oil Output,
Impose Cost. Oil & Gas Journal, 110(11), pp. 96 - 106.
Cymbaluk, T. H., Nowack, G. P. & Johnson, M. M., 1996. Copper (I) Carboxylate-
containing Olefin Complexing Reagents. USA, Patent No. 5523512.
Cymbaluk, T. H., Tabler, D. C., Johnson, M. M. & Nowack, G. P., 1992. Method for
Preparing Olefin Complexing Reagents and Use thereof. USA, Patent No. 5104570.
Dautzenberg, F. M. et al., 1992. Catalyst and Reactor Requirements for the Oxidative
Coupling of Methane. Catalysis Today, 13(4), pp. 503 - 509.
Davis, H. S. & Francis, A. W., 1937. Method for Recovery of Olefins from Gaseous or
Liquid Mixtures. USA, Patent No. 2077041.
Eldred, B. E., 1923. Process of Separaing Olefines from Gaseous Mixtures. USA, Patent
No. 1465600.
Eldridge, R. B., 1993. Olefin/Paraffin Separation Technology: a Review. Ind. Eng. Chem.
res., 32(10), pp. 2208 - 2212.
Energy Security Analysis, Inc., 2013. A Perfect Storm: Global Natural Gas Liquids 2013 -
2023, s.l.: s.n.
Eng, D. & Chiang, P.-H., 1995. Methane Oxidative Coupling: Technical and Economic
Evaluation of Chemical Cogenerative Fuel Cell. Energy & Fuels, Volume 9, pp. 794 - 801.
Evans, T. W. & Scheibli, J. R., 1945. Recovery of Olefins. USA, Patent No. 2376239.
Francis, A. W., 1949. Separation of Olefins. USA, Patent No. 2463482.
Francis, A. W. & Reid, E. E., 1948. Separation of Olefins. USA, Patent No. 2445520.
Friedman, B. S. & Stedman, R. F., 1945. Process for the Separation of an Unsaturated
Hydrocarbons from a Hydrocarbon Mixture. USA, Patent No. 2391404.
Gilliland, E. R., 1945. Concentration of Olefins. USA, Patent No. 2369559.
Godini, H. R. et al., 2014. Performance Analysis of a Porous Packed Bed Membrane
Reactor for Oxidative Coupling of Methane: Structural and Operational Characteristics.
Energy & Fuel, 28(2), pp. 877 - 890.
Hamilton, J. D., 2009. Causes and Consequences of the Oil Shock of 2007-08.
Washington, s.n.
Page 133
116
Harper, R. J., Stifel, G. R. & Anderson, R. B., 1969. Adsorption of Gases on 4A Synthetic
Zeolite. Canadian Journal of Chemistry, Volume 47, pp. 4661 - 4670.
Hayashi, J. et al., 1996. Separation of Ethane/Ethylene and Propane/Propylene Systems
with a Carbonized BPDA-pp'ODA Polyimide Membrane. Ind. Eng. Chem. Res., 35(11), pp.
4176-4181.
Hoebink, J. H. B. J., Couwenberg, P. M. & Marin, G. B., 1994. Fixed Bed Reactor Design
for Gas Phase Chain Reactions Catalysed by Solids: the Oxidative Coupling of Methane.
Chemical Engineering Science, 49(24), pp. 5453 - 5463.
Hoebink, J. H. B. J. et al., 1995. Economics of the Oxidative Coupling of Methane as an
Add-on Unit for Naphtha Cracking. Chem. Eng. Technol., Volume 18, pp. 12 - 16.
Hong, S. U., Kim, J. Y. & Kang, Y. S., 2001. Effect of Water on the Facilitated Transport of
Olefins through Solid Polymer Electrolyte Membranes. Journal of Membrane Science,
Volume 184, pp. 39 - 48.
Ho, W. S. W., Doyle, G., Savage, D. W. & Pruett, R. L., 1988. Olefin Separation via
Complexation with Cuprous Diketonate. Ind. Eng. Chem. Res., 27(2), pp. 334 - 337.
Hsiue, G. H. & Yang, J. S., 1993. Novel Methods in Separation of Olefin/Paraffin Mixture
by Functional Polymeric Membranes. Journal of Membrane Science, Volume 82, pp. 117
- 128.
Hugill, J., Tilemans, J., Dijsktra, S. & Spoelstra, S., 2005. Feasibility Study on the Co-
generation of Ethylene and Electricity through Oxidative Coupling of Methane. Applied
Thermal Engineering, Volume 25, pp. 1259 - 1271.
Ilinich, O. M. & Zamaraev, K. I., 1993. Separation of Ethylene and Ethane over
Polyphenylene Oxides Membranes: Transient Increase of Selectivity. Journal of
Membrane Science, Volume 82, pp. 149 - 155.
Jarvelint, H. & Fair, J. R., 1993. Adsorptive Separation of Proylen-Propane Mixtures. Ind.
Eng. Chem. Res., 32(10), pp. 2201 - 2207.
Jaso, S., 2012. Modeling and Design of the Fluidized Bed Reactor for the Oxidative
Coupling of Methane. s.l.:Technische Universität Berlin.
Joshua, W. P. & Stanley, H. M., 1935. Separation and Recovery of Olefines from Gases
Containing the Same. USA, Patent No. 2005500.
Kang, Y. S., Char, K. H. & Kang, S. W., 2009. Silver Nanoparticle/Polymer Nanocomposite
Membranes for Olefin/Paraffin Separation and Method of Preparing the same.. USA,
Patent No. 7491262 B2.
Page 134
117
Keller, G. E. & Bhasin, M. M., 1982. Synthesis of Ethylene via Oxidative Coupling of
Methane: I. Determination of Active Catalysts. Journal of Catalysis, 73(1), pp. 9 - 19.
Keller, G., Marcinkowsky, M. E., Verma, S. K. & Williamson, K. D., 1992. Olefin Recovery
and Purification via Silver Complexation. In: Separation and Purification Technology.
New York: Marcel Dekker Inc..
Kent, B. & Werber, C., 2013. Refinery Closures Hurt Europe's Energy Security.
Hydrocarbon Processing.
Kiesskalt, S., 1944. Process of Adsorbing Gases and Vapours. USA, Patent No.
US2349098.
Kiesskalt, S., 1944. Process of Adsorbing Gases and Vapours. USA, Patent No.
US2354383.
Kooh, A., Dubois, J.-L., Mimoun, H. & Cameron, C. J., 1990. Oxidative Coupling of
Methane: Maximizing the Yield of Coupling Products under Cofeed Operating
Conditions. Catalysis Today, 6(4), pp. 453 - 462.
Kruglov, A. V., Bjorklund, M. C. & Carr, R. W., 1996. Optimization of the Simulated
Countercurrent Moving-Bed Chromatographic reactor for the Oxidative Coupling of
Methane. Chemical Engineering Science, 51(11), pp. 2945-2950.
Kundu, P. K., Zhang, Y. & Ray, A. K., 2009. Modeling and simulation of simulated counter
current moving bed chromatographic reactor for oxidative coupling of methane.
Chemical Engineering Science, Volume 64, pp. 5143 - 5152.
Labinger, J. A., 1988. Oxidative Coupling of Methane: An Inherent Limit to Selectivity.
Catalysis Letter, Volume 1, pp. 371 - 376.
Lefebvre, B., 2013. US refiners don’t care if Keystone XL pipeline gets built. Hydrocarbon
Processing.
LeVan, M. D. & Carta, G., 2008. Adsorption and Ion Exchange. In: Perry's Chemical
Engineer's Handbook. 8th ed. s.l.:McGraw-Hill.
Lincoln Journal-Star, 2008. TransCanada Proposes Second Oil Pipeline. 12 June.
Liu, H. et al., 2008. Scale up and Stability Test for Oxidative Coupling of Methane over
Na2WO4-Mn/SiO2 Catalyst in a 200 ml Fixed-bed Reactor. Journal of Natural Gas
Chemistry, Volume 17, pp. 59 - 63.
Long, R. B., Caruso, F. A. & de Feo, R. J., 1972. Bimetallic Salts and Derivatives thereof,
their Preparation and Use in the Complexing of Ligands. USA, Patent No. 3651159.
Page 135
118
Lopez-Isunza, F., 2013. Modelling Fixed-bed Multicomponent Adsorption for Ultra-low
Sulphur Diesel. The Hague, s.n.
Machida, K. & Enyo, M., 1987. Oxidative Dimerization of Methane over Cerium Mixed
Oxides and its Relation with their Ion-conducting Characteristic. J. Chem. Soc., Chem.
Commun., pp. 1639 - 1640.
Machocki, A., 1996. Methane Oxidative Coupling in an Undiluted Reaction Mixture in a
Reactor-Adsorber System with Gas Recirculation. Applied Catalysis A: General, Volume
146, pp. 391-400.
Marcinkowsky, A. E., Keller, G. E. & Verma, S. K., 1979. Olefin Separation Process. USA,
Patent No. 4174353.
Meng, H., 1984. Sorption Equilibria and Kinetics of Sequential Sorption in Zeolite
Molecular Sieves. McMaster University: s.n.
Miller, S. A., 1969. Ethylene and its Industrial Derivatives. London: Ernest Benn.
Miltenburg, A. v., 2007. Adsorptive Separation of Light Olefin/Paraffin Mixture -
Dispersion of CuCl in Faujasite Zeolites. Technische Universiteit Delft: s.n.
Mleczko, L. & Baerns, M., 1995. Catalytic Oxidative Coupling of Methane - Reaction
Engineering Aspects and Process Schemes. Fuel Processing Technology, 42(2 - 3), pp. 217
- 248.
Moore, T. T. & Koros, W. J., 2007. Gas Sorption in Polymers, Molecular Sieves and Mixed
Matrix Membranes. Journal of Applied Polymer Science, Volume 104, pp. 4053 - 4059.
Morisato, A., He, Z., Pinnau, I. & Merkel, T. C., 2002. Transport Properties of PA 12-
PTMO/AgBF4 Solid Polymer Electrolyte Membranes for Olefin/Paraffin Separation.
Desalination, Volume 145, pp. 347 - 351.
Murata, K., Hayakawa, T. & Fujita, K., 1997. Excellent Effect of Lithium-doped Sulfated
Zirconia Catalysts for Oxidative Coupling of Methane to Give Ethene and Ethane. Chem.
Commun., pp. 221 - 222.
Nijmeijer, D. C., 2003. Gas-Liquid Membrane Contractors for Olefin/Paraffin Separation.
University of Twente: s.n.
Nölken, E., 1966. Process for Isolating Olefins from Mixtures by Absorption. USA, Patent
No. 3284530.
Okamoto, K. et al., 1999. Olefin/Paraffin Separation through Carbonized Membranes
Derived from an Asymetric Polyimide Hollow Fiber Membrane. Ind. Eng. Chem. Res.,
38(11), pp. 4424 - 4432.
Page 136
119
Otsuka, K. & Komatsu, T., 1987. Active Catalysts in Oxidative Coupling of Methane. J.
Chem. Soc., Chem. Commun, pp. 388 - 389.
Pak, S. & Lunsford, J. H., 1998. Thermal Effects during the Oxidative Coupling of
Methane over Mn/Na2WO4/SiO2 and Mn/Na2WO4/NgO catalysts. Applied Catalysis A:
General, Volume 168, pp. 131 - 137.
Pan, D., Ji, S., Wang, W. & Li, C., 2010. Oxidative Coupling of Methane in a Dual-bed
Reactor Comprising of Particle/Cordierite Monolithic Catalysts. Journal of Natural Gas
Chemistry, Volume 17, pp. 600 - 604.
Park, J.-H.et al., 1998. Adsorber dynamics and optimal design of layered beds for
multicomponent gas adsorption. Chemical Engineering Science, 53(23), pp. 3951 - 3963.
Park, Y. S., Won, J. & Kang, Y. S., 2000. Preparation of Poly(ethylene glycol) Brushes on
Polysulfone Membranes for Olefin/Paraffin Separation. Langmuir, Volume 16, pp. 9662 -
9665.
Pinnau, I. & Toy, L. G., 2001. Solid Polymer Electrolyte Composite Membranes for
Olefin/Paraffin Separation. Journal of Membrane Science, Volume 184, pp. 39 - 48.
Pirovano, C., Sanfilippo, D., Saviano, F. & Piovesan, L., 2002. Process for the Separation
of Light Olefins from Paraffins. USA, Patent No. 6414210.
Poling, B. E. et al., 2008. Physical and Chemical Data. In: Perry's Chemical Engineer's
Handbook. 8th ed. s.l.:McGraw-Hill.
Prausnitz, J. M., 1958. Longitudinal Dispersion in a Packed Bed. AIChE Journal, 4(1), pp.
14M - 22M.
Quinn, H. W., 1965. Use of Complex Fluoro Salts to Separate Olefins from Paraffins. USA,
Patent No. 3189658.
Rameshni, M., 2002. Cost Effective Options to Expand SRU Capacity Using Oxygen, s.l.:
s.n.
Ray, G. C., 1952. Recovery of Olefin Hydrocarbons. USA, Patent No. 2589960.
Rege, S. U., Padin, J. & Yang, R. T., 1998. Olefin/Paraffin Separations by Adsorption: pi-
complexation vs. Kinetic Separation. AIChE Journal, 44(4), pp. 799 - 809.
Reich, R., Ziegler, W. T. & Rogers, K. A., 1980. Adsorption of Methane, Ethane and
Ethylene Gases and their Binary and Ternary Mixtures and Carbon Dioxide on Activated
Carbon at 212 - 301 K and Pressures to 35 atmospheres. Ind Eng. Chem. Process Des.
Dev., Volume 19, pp. 336 - 344.
Page 137
120
Reine, T. A., 2004. Olefin/Paraffin Separation by Reactive Absorption. s.l.:The University
of Texas at Austin.
Ren, T., Patel, M. K. & Blok, K., 2008. Steam Cracking and Methane to Olefins: Energy
Use, CO2 Emissions and Production Costs. Energy, Volume 33, pp. 817 - 833.
Richardson, J. F., Harker, J. H. & Backhurst, J. R., 2002. Particle Technology and
Separation Processes. In: Coulson and Richardson's Chemical Engineering. 5th ed.
Oxford: Butterworth-Heinemann.
Robey, R. F., 1941. Concentration of Olefins. USA, Patent No. 2245719.
Robey, R. F., 1941. Process for Concentrating and Storing Olefins. USA, Patent No.
2235119.
Romero-Perez, A. & Aguilar-Armenta, G., 2010. Adsorption Kinetics and Equilibria of
Carbon Dioxide, Ethylene, Ethane on 4A (CECA) Zeolite. J. Chem. Eng. Data, 55(9), pp.
3625 - 3630.
Royal Dutch Shell plc, 2013. Shell will not pursue US Gulf Coast GTL project, s.l.: s.n.
Ryu, J. H. et al., 2001. Facilitated Olefin Transport by reversible Olefin Coordination to
Silver Ions in a Dry Cellulose Acetate Membrane. Chem. Eur. J., 7(7), pp. 1525 - 1529.
Safarik, D. J. & Eldridge, R. B., 1998. Olefin/Paraffin Separations by Reactive Absorption:
a Review. Ind. Chem. Eng. Res., 37(7), pp. 2571 - 2581.
Salerno, D., 2013. Optimal Synthesis of Downstream Process using the Oxidative
Coupling of Methane Reaction. Technische Universität Berlin: s.n.
Sasol Canada, 2013. Canada Gas-to-Liquids project, s.l.: s.n.
Sasol, 2013. Sasol’s world-scale ethane cracker & gas-to-liquids facility, s.l.: s.n.
Savoy, M., 1951. Concentration of Olefins. USA, Patent No. 2561822.
Schweer, D., Mleczko, L. & Baerns, M., 1994. OCM in a Fixed-bed Reactor: Limits and
Perspectives. Catalysis Today, 21(2 - 3), pp. 357 - 369.
Schwittay, C., Turek, T. & Lintz, H.-G., 2001. Oxidative Coupling of Methane to Ethylene
in a Reactor-Separator. Chemie Ingenieur Technik, 73(6), p. 670.
Seddon, D., 2010. PETROCHEMICAL ECONOMICS - Technology Selection in a Carbon
Constrained World. s.l.:Imperial College Press.
Shaw, J. A., 1949. Treatment of Coke-oven Gas. USA, Patent No. 2471550.
Page 138
121
Shell, 2012. Pearl GTL - an overview, s.l.: s.n.
Stansch, Z., Mleczko, L. & Baerns, M., 1997. Comprehensive Kinetics of Oxidative
Coupling of Methane over the La2O3/CaO catalyst. Ind. Eng. Chem. Res., Volume 36, pp.
2568 - 2579.
Staudt-Bickel, C. & Koros, W. J., 2000. Olefin/Paraffin Gas Separations with 6FDA-based
Polyimide Membranes. Journal of Membrane Science, Volume 170, pp. 205 - 214.
Steigelmann, E. F. & Hughes, R. D., 1973. Process for Separation of Unsaturated
Hydrocarbons. USA, Patent No. 3758603.
Strand, C. P., 1950. Selective Solvent Separation of Unsaturated Hydrocarbons. USA,
Patent No. 2515140.
Suzuki, S., Sasaki, T. & Kojima, T., 1996. New Process Development of Natural Gas
Conversion Technology to Liquid Fuels via OCM Reaction. Energy & Fuels, Volume 10,
pp. 531 - 536.
Tabler, D. C. & Johnson, M. M., 1977. Hydrocarbon Separations. USA, Patent No.
4025574.
Talisman Energy, 2012. Talisman Energy exits GTL project, s.l.: s.n.
Taniewski, M., Lachowicz, A., Skutil, K. & Czechowicz, D., 1996. The Effect of Dilution of
the Catalyst Bed on its Heat-transfer Characteristics in Oxidative Coupling of Methane.
Chemical Engineering Science, 51(18), pp. 4271 - 4278.
The Linde Group, 2013. Research cooperation develops innovative technology for
environmentally sustainable syngas production from carbon dioxide and hydrogen, s.l.:
s.n.
Thomas, W. J. & Crittenden, B., 1998. Adsorption Technology and Design. Oxford:
Butterworth-Heinemann.
Tonkovich, A. L., Carr, R. W. & Aris, R., 1993. Enhanced C2 Yields from Methane
Oxidative Coupling by Means of a Separative Chemical Reactor. Science, 8 October,
Volume 262, pp. 221 - 223.
Trans Canada, 2013. Keystone XL Pipeline. [Online]
Available at: http://keystone-xl.com/about/the-project/
Triebe, R. W. & Tezel, F. H., 1995. Adsorption of Nitrogen, Carbon Monoxide, Carbon
Dioxide and Nitric Oxide on Molecular Sieves. Gas. Sep. Purif., 9(4), pp. 223 - 230.
Page 139
122
U.S. Energy Information Administration, 2013. [Online]
Available at: www.eia.gov
Uebele, C. E., Grasselli, R. K. & Nixon, W. C., 1970. Olefin Recovery Process. USA, Patent
No. 3514488.
Ulrich, G. D. & Vasudevan, P. T., 2006. How to Estimate Utility Costs. Chemical
Engineering, pp. 66 - 69.
UOP, 2009. UOP Amine Guard FS Technology for Acid Gas Removal, s.l.: s.n.
Vakhshouri, K. & Hashemi, M. M. Y. M., 2008. Simulation Study of Radial Heat and Mass
Transfer inside a Fixed Bed Reactor. International Journal of Chemical and Biological
Engineering, 1(1), pp. 1 - 8.
Van Raay, H. G. & Schwenk, U., 1959. Process for Separating Olefinic Hydrocarbons using
Silver Fluoborate and Silver Fluosilicate Solutions. USA, Patent No. 2913505.
Wang, S. & Zhu, Z. H., 2004. Catalytic Conversion of Alkanes to Olefins by Carbon Dioxide
Oxidative Dehydrogenations - A Review. Energy & Fuels, Volume 18, pp. 1126-1139.
Wang, Y. & Ohtsuka, Y., 2000. CaO–ZnO Catalyst for Selective Conversion of Methane to
C2 Hydrocarbons Using Carbon Dioxide as the Oxidant. J. Catal., Volume 192, p. 252–
255.
Wang, Y. & Ohtsuka, Y., 2001. Mn-based binary oxides as catalysts for the conversion of
methane to C2 hydrocarbons with carbon dioxide as oxidant. Applied Catalysis A:
General, Volume 219, p. 183–193.
Wang, Y., Takahashi, Y. & Ohtsuka, Y., 1998. Carbon dioxide-induced selective
conversion of methane to C2 hydrocarbons on CeO2 modi®ed with CaO. Applied
Catalysis A: General, Volume 172, pp. L203 - L206.
Wang, Y., Takahashi, Y. & Ohtsuka, Y., 1999. Carbon Dioxide as Oxidant for the
Conversion of Methane to Ethane and Ethylene Using Modified CeO2 Catalysts. Journal
of Catalysis, Volume 186, p. 160–168.
Wang, Y., Zhuang, Q., Takahashi, Y. & Ohtsuka, Y., 1998. Remarkable enhancing effect of
carbon dioxide on the conversion of methane to C2 hydrocarbons using praseodymium
oxide. Catalysis Letters, Volume 56, p. 203–206.
Wanichko, J., 2014. The ethane addiction: How long will the US advantage last?.
Hydrocarbon Processing.
World Bank, 2013. [Online]
Available at: http://go.worldbank.org/016TLXI7N0
Page 140
123
Yang, J. S. & Hsiue, G. H., 1997. Selective Olefin Permeation through Ag(I) Contained
Silicone Rubber-graft-poly (acrylic acid) Membranes. Journal of Membrane Science,
Volume 126, pp. 139 - 149.
Yang, R. T., 2003. Sorbents for Applications. In: Adsorbents: Fundamentals and
Applications. s.l.:John Wiley & Sons.
Yang, R. T., 2003. π-complexation Sorbents and Applications. In: Adsorbents:
Fundamentals and Applications. USA: John Wiley & Sons.
Yucel, H. & Ruthven, D. M., 1980. Diffusion in 4A Zeolite - Study of the Effect of Crysral
Size. J. C. S. Faraday I, Volume 76, pp. 60 - 70.
Zarrinpashne, S., Ahmadi, R. & Zekordi, M., 2006. Catalyst Direct Conversion of Methane
to Ethane and Ethylene. USA, Patent No. US20060155157A1.
Zavyalova, U., Holena, M., Schlögl, R. & Baerns, M., 2011. Statistical Analysis of Past
Catalytic Data on Oxidative Methane Coupling for New Insights into the Composition of
High-Performance Catalysts. ChemCatChem, Volume 3, p. 1935 – 1947.
Zhusheng, X. et al., 1996. Role of Steam on the Reaction Performance of Methane
Oxidative Coupling over Basic Catalysts. Chemical Engineering Science, 51(4), pp. 515 -
519.
Zimmermann, H. & Walzl, R., 2012. Ethylene. In: Ullmann's Encyclopedia of Industrial
Chemistry. s.l.:Wiley-VCH, pp. 465 - 529.
Page 141
List of contribution
Scientific papers
Godini H. R., Jašo S., Martini W., Stünkel S., Salerno D., Nghiem Xuan S., Song S.,
Sadjadi S., Trivedi H., Arellano-Garcia H., Wozny G., 2012. Concurrent Reactor
Engineering, Separation Enhancement and Process Intensification:
Comprehensive Unicat Approach for Oxidative Coupling of Methane. Technical
Transaction, 109 (5), pp. 63 – 74.
Shankui S., Stünkel S., Godini H. R., Nghiem Xuan S., Wozny G., Yuan J., 2012.
Investigation on membrane-assisted CO2 removal process for oxidative coupling
of methane in mini-plant scale. Technical Transaction, 109 (5), pp. 223 – 232.
Nghiem Xuan S., Arellano-Garcia H., Tran T. K., Wozny G., 2012. Oxidative
Coupling of Methane: a new process concept for the improvement of the
downstream processing by using adsorption, Technical Transaction, 109 (5), pp.
233 – 242.
Godini H. R., Xiao S., Jašo S., Stünkel S., Salerno D., Nghiem Xuan S., Song S.,
Wozny G., 2013. Techno-Economic Analysis of Integrating the Methane Oxidative
Coupling and Methane Reforming Processes, Fuel Processing Technology,
Volume 106, pp. 684–694.
Page 142
Conferences
Oral presentation at 2nd Doktorandenseminar Adsorption, Braunschweig,
Germany, September 15 – 16, 2011. Adsorption Process in the Downstream of
Oxidative Coupling of Methane.
Oral presentation at AIChE Annual Meeting, Minneapolis, USA, October 16 – 21,
2011. Adsorptive Separation in the Downstream of the Oxidative Methane
Coupling Process.
Oral presentation at 19th International Conference Process Engineering and
Chemical Plant Design, Krakow, Poland, September 25 – 27, 2012. Oxidative
Coupling of Methane: a new process concept for the improvement of the
downstream processing by using adsorption.