28
European Telecommunications Network Operators’ Association DRIVING THE DIGITAL FUTURE PUBLICATION NOVEMBER 2012 Annual Economic Report 2012 20 YEARS
European Te lecommunicat ions Network Operators ’ Assoc ia t ion
Driving the Digital Future
publication november 2012
Annual Economic Report 2012
20 years
2
Third Annual Economic ReportETNO
1. introduction 4
2. twenty years of revolution 8
3. market trends 10
4. revenue and service trends 16
5. investment trends 18
6. broadband 21
7. next generation access networks (nga) 22
8. new broadband services 24
9. ranking in european and World top companies 26
Contents
What is etno
etno has been the voice of europe’s telecommunications network operators since 1992.
etno’s 38 member companies and 12 observers* from europe and beyond represent a significant
part of total ict activity in europe. they account for an aggregate annual turnover of more than €600 billion and employ over 1.6 million people. etno companies are the main drivers of broadband and are committed to its continual growth in europe.
etno members also hold new entrant positions outside their national markets. etno brings
together the main investors in innovative and high-quality e-communications platforms and
services, representing 70% of total sector investment.
etno strongly contributes to shaping a favourable regulatory and commercial environment for its members
to continue to deploy innovative and high quality services and platforms for the benefit of european consumers and businesses.
* December 2012
years
3
Third Annual Economic Report ETNO
FRANCE
BELGIUM
LUXEMBOURG
NETHERLANDS
GERMANY
UNITED KINGDOM
IRELAND
DENMARK
SWEDEN
FINLAND
AUSTRIA
ITALY
SPAIN GREECEPORTUGAL
SWITZERLAND
SLOVENIA
CROATIA
BOSNIA-HERZEGOVINA
CZECH REP.
SLOVAKIA
HUNGARYROMANIA
BULGARIA
ALBANIA
CYPRUS
F.Y.R.O.M(Former Yugoslav
Republic of Macedonia)
TURKEY
POLAND
LITHUANIA
LATVIA
ESTONIA
NORWAY
ICELAND
MALTA
LIECHTENSTEIN
EuropEan TElEcommunicaTions nETwork opEraTors’ associaTion
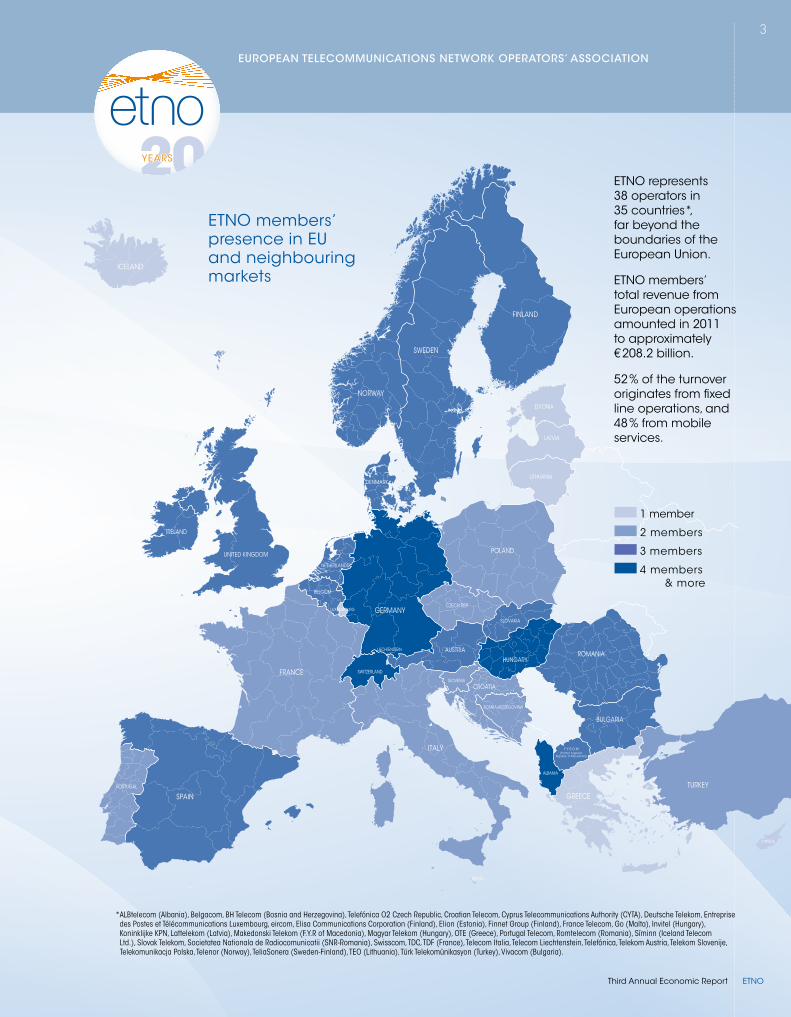
1 member
2 members
3 members
4 members & more
etno members’ presence in eu and neighbouring markets
* ALBtelecom (Albania), Belgacom, BH Telecom (Bosnia and Herzegovina), Telefónica O2 Czech Republic, Croatian Telecom, Cyprus Telecommunications Authority (CYTA), Deutsche Telekom, Entreprise des Postes et Télécommunications Luxembourg, eircom, Elisa Communications Corporation (Finland), Elion (Estonia), Finnet Group (Finland), France Telecom, Go (Malta), Invitel (Hungary), Koninklijke KPN, Lattelekom (Latvia), Makedonski Telekom (F.Y.R of Macedonia), Magyar Telekom (Hungary), OTE (Greece), Portugal Telecom, Romtelecom (Romania), Síminn (Iceland Telecom Ltd.), Slovak Telekom, Societatea Nationala de Radiocomunicatii (SNR-Romania), Swisscom, TDC, TDF (France), Telecom Italia, Telecom Liechtenstein, Telefónica, Telekom Austria, Telekom Slovenije, Telekomunikacja Polska, Telenor (Norway), TeliaSonera (Sweden-Finland), TEO (Lithuania), Türk Telekomünikasyon (Turkey), Vivacom (Bulgaria).
etno represents 38 operators in 35 countries*, far beyond the boundaries of the european union.
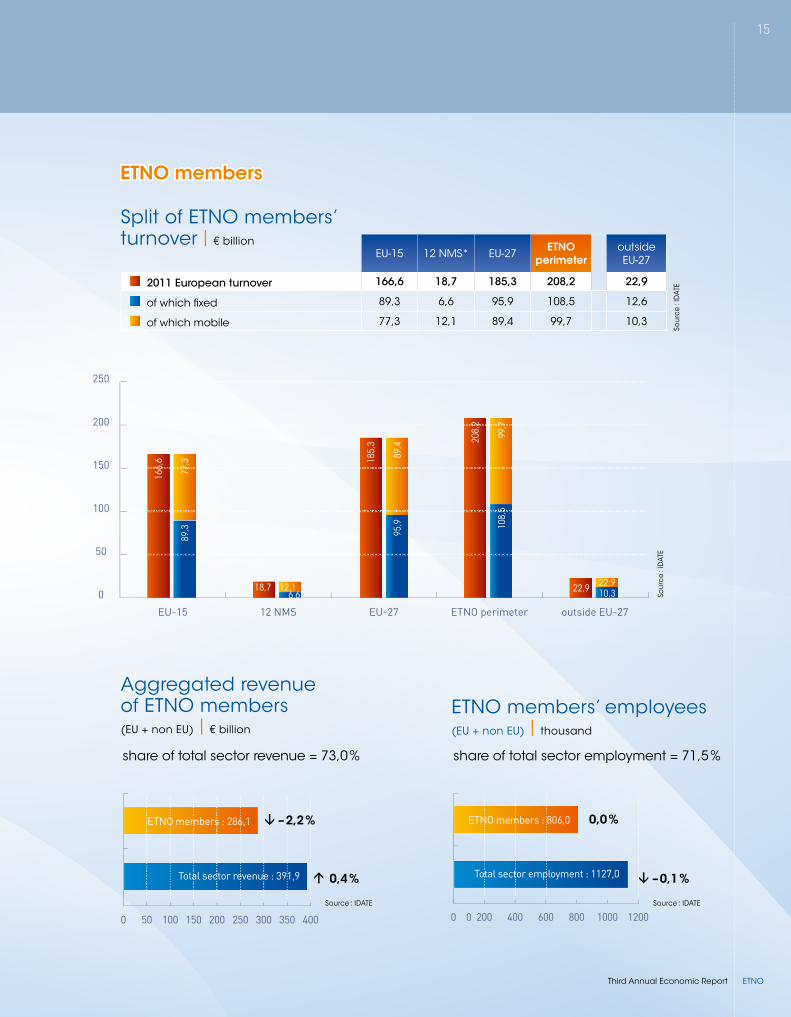
etno members’ total revenue from european operations amounted in 2011 to approximately € 208.2 billion.
52 % of the turnover originates from fixed line operations, and 48 % from mobile services.
20 years
4
1992 1996 1997 1998 2000 2002 2003 2007 2009 2010 2011 2012telecom review (liberalisation of voice communications markets postponed)
mobiles Directive (licensing procedures for new entrants in the mobile market) "Full competition" Directive (liberalisation of voice telephony markets to be effective from 1 Jan. 1998)
bill on the separation of cable activities (structural separation of cable activities for telcos in a dominant position)
effective liberalisation of voice telephony markets in most eu countries
unbundling regulation
telecom package (incl. Directive on Universal Service and Directive on Access and Interconnection)
recommendation on relevant markets (leading to national analyses of relevant markets for remedies to be implemented when necessary)
second telecom review
telecoms reform package
a Digital agenda for europe
infra-community roaming regulation
report on the cost of non-europe in telecommunication markets ('Steps towards a truly internal market for e-communications in the run-up to 2020')
2 recommendations to boost investments in nga (cost assessment method for wholesale access prices and non-discriminatory access) annouced by Digital agenda commissioner
european regulatory agenda
Third Annual Economic ReportETNO
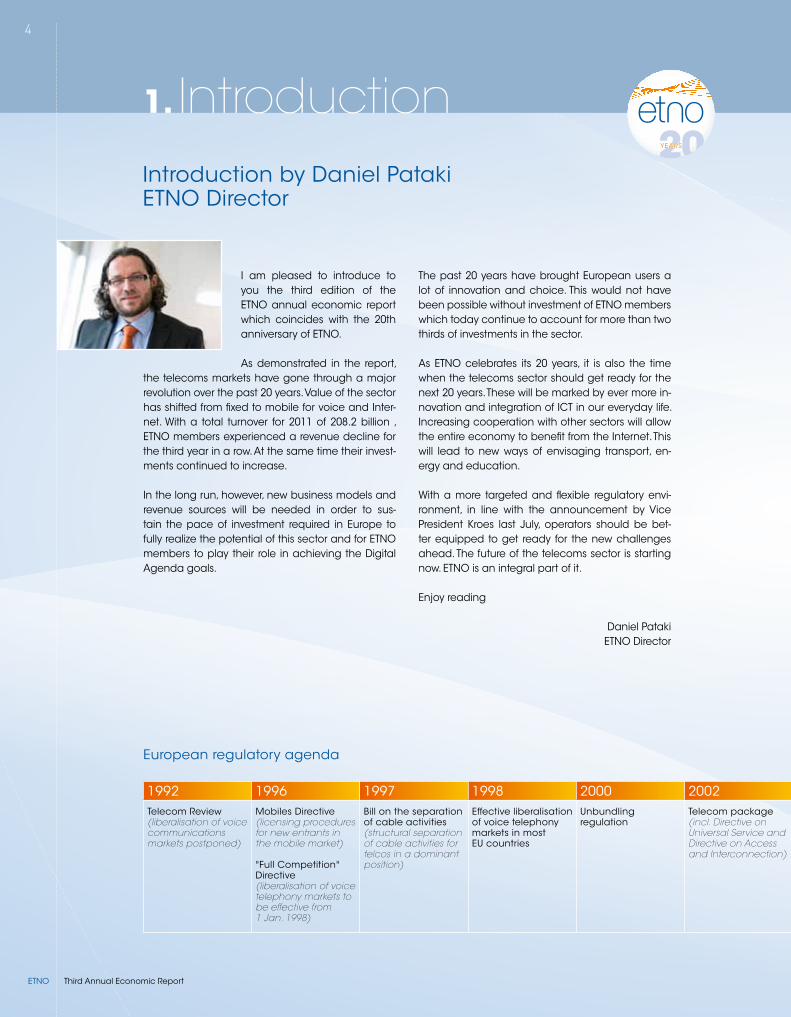
i am pleased to introduce to you the third edition of the etno annual economic report which coincides with the 20th anniversary of etno. as demonstrated in the report,
the telecoms markets have gone through a major revolution over the past 20 years. value of the sector has shifted from fixed to mobile for voice and inter-net. With a total turnover for 2011 of 208.2 billion , etno members experienced a revenue decline for the third year in a row. at the same time their invest-ments continued to increase. in the long run, however, new business models and revenue sources will be needed in order to sus-tain the pace of investment required in europe to fully realize the potential of this sector and for etno members to play their role in achieving the Digital agenda goals.
the past 20 years have brought european users a lot of innovation and choice. this would not have been possible without investment of etno members which today continue to account for more than two thirds of investments in the sector. as etno celebrates its 20 years, it is also the time when the telecoms sector should get ready for the next 20 years. these will be marked by ever more in-novation and integration of ict in our everyday life. increasing cooperation with other sectors will allow the entire economy to benefit from the internet. this will lead to new ways of envisaging transport, en-ergy and education. With a more targeted and flexible regulatory envi-ronment, in line with the announcement by vice president Kroes last July, operators should be bet-ter equipped to get ready for the new challenges ahead. the future of the telecoms sector is starting now. etno is an integral part of it. enjoy reading
Daniel patakietno Director
introduction by Daniel pataki etno Director
1. Introduction20 years
5
1992 1996 1997 1998 2000 2002 2003 2007 2009 2010 2011 2012telecom review (liberalisation of voice communications markets postponed)
mobiles Directive (licensing procedures for new entrants in the mobile market) "Full competition" Directive (liberalisation of voice telephony markets to be effective from 1 Jan. 1998)
bill on the separation of cable activities (structural separation of cable activities for telcos in a dominant position)
effective liberalisation of voice telephony markets in most eu countries
unbundling regulation
telecom package (incl. Directive on Universal Service and Directive on Access and Interconnection)
recommendation on relevant markets (leading to national analyses of relevant markets for remedies to be implemented when necessary)
second telecom review
telecoms reform package
a Digital agenda for europe
infra-community roaming regulation
report on the cost of non-europe in telecommunication markets ('Steps towards a truly internal market for e-communications in the run-up to 2020')
2 recommendations to boost investments in nga (cost assessment method for wholesale access prices and non-discriminatory access) annouced by Digital agenda commissioner
Third Annual Economic Report ETNO
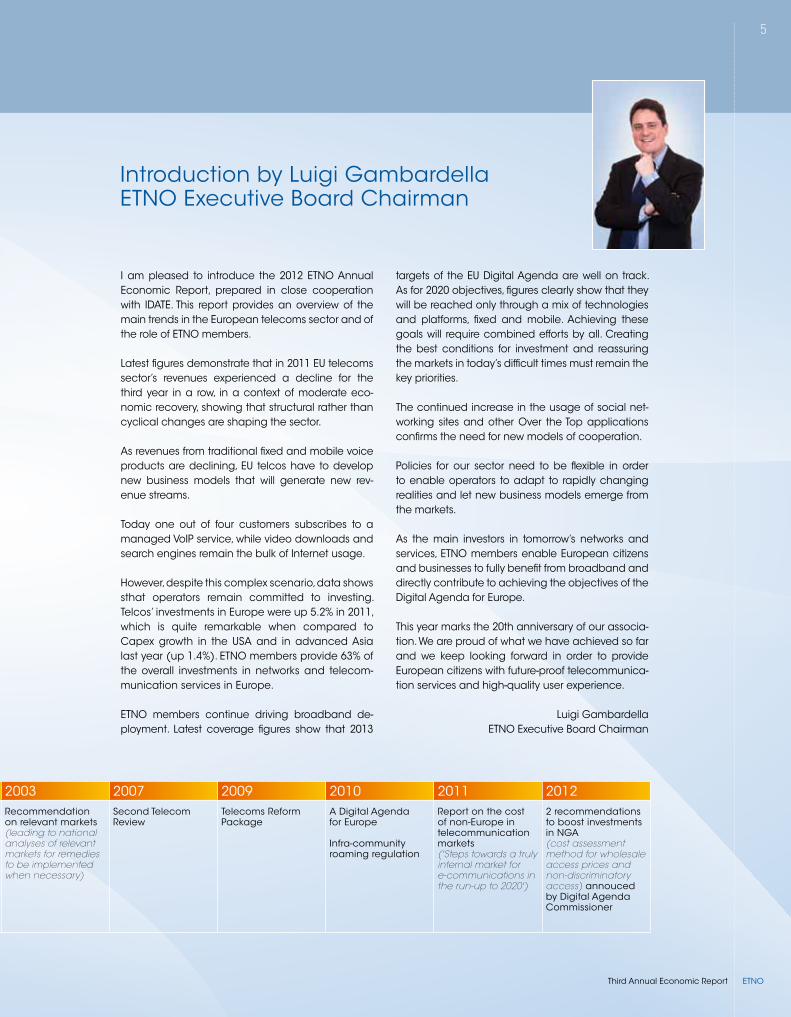
i am pleased to introduce the 2012 etno annual economic report, prepared in close cooperation with iDate. this report provides an overview of the main trends in the european telecoms sector and of the role of etno members. latest figures demonstrate that in 2011 eu telecoms sector’s revenues experienced a decline for the third year in a row, in a context of moderate eco-nomic recovery, showing that structural rather than cyclical changes are shaping the sector.
as revenues from traditional fixed and mobile voice products are declining, eu telcos have to develop new business models that will generate new rev-enue streams. today one out of four customers subscribes to a managed voip service, while video downloads and search engines remain the bulk of internet usage. however, despite this complex scenario, data shows sthat operators remain committed to investing. telcos’ investments in europe were up 5.2% in 2011, which is quite remarkable when compared to capex growth in the usa and in advanced asia last year (up 1.4%). etno members provide 63% of the overall investments in networks and telecom-munication services in europe. etno members continue driving broadband de-ployment. latest coverage figures show that 2013
targets of the eu Digital agenda are well on track. as for 2020 objectives, figures clearly show that they will be reached only through a mix of technologies and platforms, fixed and mobile. achieving these goals will require combined efforts by all. creating the best conditions for investment and reassuring the markets in today’s difficult times must remain the key priorities. the continued increase in the usage of social net-working sites and other over the top applications confirms the need for new models of cooperation. policies for our sector need to be flexible in order to enable operators to adapt to rapidly changing realities and let new business models emerge from the markets. as the main investors in tomorrow’s networks and services, etno members enable european citizens and businesses to fully benefit from broadband and directly contribute to achieving the objectives of the Digital agenda for europe. this year marks the 20th anniversary of our associa-tion. We are proud of what we have achieved so far and we keep looking forward in order to provide european citizens with future-proof telecommunica-tion services and high-quality user experience. luigi gambardella
etno executive board chairman
introduction by luigi gambardella etno executive board chairman
6
1992 1997 1999 2000 2005 2007 2008creation of etno
6 million mobile subscribers in europe (etno perimeter) at year end
500,000 broadband subscribers in europe (etno perimeter) at year end
european mobile subscriber base passes the 100-million mark
more than 100 mobile operators in europe (etno perimeter)
vodafone-manneman merger in a €180-billion transaction
purchase of orange by France telecom (€40 billion excl. debt) and of us mobile operator voicestream by Deutsche telekom ($35 billion)
5 umts licences granted in the uK for £22.4 billion
6 umts licences granted in germany for €50.8 billion
european mobile subscriber base passes the 500-million mark
european broadband subscriber base passes the 100-million mark
mobile retail revenues exceed fixed retail revenues in overall europe (etno perimeter)
industry and market
Third Annual Economic ReportETNO
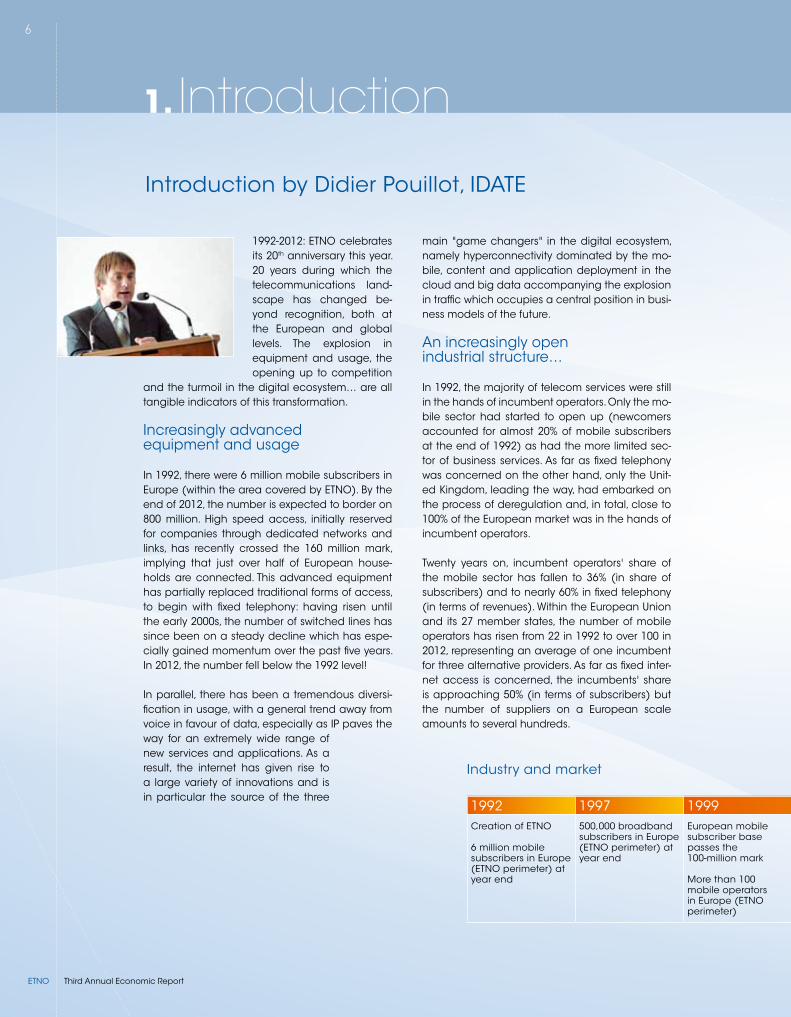
1992-2012: etno celebrates its 20th anniversary this year. 20 years during which the telecommunications land-scape has changed be-yond recognition, both at the european and global levels. the explosion in equipment and usage, the opening up to competition
and the turmoil in the digital ecosystem… are all tangible indicators of this transformation.
increasingly advanced equipment and usage
in 1992, there were 6 million mobile subscribers in europe (within the area covered by etno). by the end of 2012, the number is expected to border on 800 million. high speed access, initially reserved for companies through dedicated networks and links, has recently crossed the 160 million mark, implying that just over half of european house-holds are connected. this advanced equipment has partially replaced traditional forms of access, to begin with fixed telephony: having risen until the early 2000s, the number of switched lines has since been on a steady decline which has espe-cially gained momentum over the past five years. in 2012, the number fell below the 1992 level!
in parallel, there has been a tremendous diversi-fication in usage, with a general trend away from voice in favour of data, especially as ip paves the way for an extremely wide range of new services and applications. as a result, the internet has given rise to a large variety of innovations and is in particular the source of the three
main "game changers" in the digital ecosystem, namely hyperconnectivity dominated by the mo-bile, content and application deployment in the cloud and big data accompanying the explosion in traffic which occupies a central position in busi-ness models of the future.
an increasingly open industrial structure…
in 1992, the majority of telecom services were still in the hands of incumbent operators. only the mo-bile sector had started to open up (newcomers accounted for almost 20% of mobile subscribers at the end of 1992) as had the more limited sec-tor of business services. as far as fixed telephony was concerned on the other hand, only the unit-ed Kingdom, leading the way, had embarked on the process of deregulation and, in total, close to 100% of the european market was in the hands of incumbent operators.
twenty years on, incumbent operators' share of the mobile sector has fallen to 36% (in share of subscribers) and to nearly 60% in fixed telephony (in terms of revenues). Within the european union and its 27 member states, the number of mobile operators has risen from 22 in 1992 to over 100 in 2012, representing an average of one incumbent for three alternative providers. as far as fixed inter-net access is concerned, the incumbents' share is approaching 50% (in terms of subscribers) but the number of suppliers on a european scale amounts to several hundreds.
introduction by Didier pouillot, iDate
1. Introduction
7
1992 1997 1999 2000 2005 2007 2008creation of etno
6 million mobile subscribers in europe (etno perimeter) at year end
500,000 broadband subscribers in europe (etno perimeter) at year end
european mobile subscriber base passes the 100-million mark
more than 100 mobile operators in europe (etno perimeter)
vodafone-manneman merger in a €180-billion transaction
purchase of orange by France telecom (€40 billion excl. debt) and of us mobile operator voicestream by Deutsche telekom ($35 billion)
5 umts licences granted in the uK for £22.4 billion
6 umts licences granted in germany for €50.8 billion
european mobile subscriber base passes the 500-million mark
european broadband subscriber base passes the 100-million mark
mobile retail revenues exceed fixed retail revenues in overall europe (etno perimeter)
Third Annual Economic Report ETNO
at the level of etno, the situation is slightly more optimistic insofar as its members, incumbent operators on their respective domestic markets, have often taken up positions in alternative op-erators abroad as part of their internationalization. overall, their share of the sector's total revenue is about 60%. they also provide 63% of the invest-ment made in networks and telecommunication services in europe and account for almost 72% of the activity of operators of all origins.
…and operators face increasing challenges within the digital ecosystem
in more general terms, operators' standing is measured in relation to what is now referred to as the digital ecosystem, which itself has also been in a state of upheaval, in particular since the early 2000s insofar as value has shifted both down-stream towards content provision and upstream towards intelligent equipment and nowadays above all in terminals. operators find themselves in the midst of these developments, under pres-sure with respect to their own growth. after a long period of continuous growth, their revenue has begun to fall since 2009; for the first time last year, there was a slowdown in revenue from mobile ser-vices throughout europe. operators' capitalization is shrinking just as google's, or more strikingly ap-ple's, is soaring. in september 2012, the consoli-dated market value of the five largest european incumbent operators is not even a third of apple's value!
Drivers of change among others
among all the factors that have transformed the telecommunications landscape in the last 20 years, quite a few others could also have been mentioned. regulation is indisputably one of them, owing to the growing importance of the au-thorities of the commission and national regula-tors. the economic climate is also another, which of course partially explains why the sector has been in a slump in recent years, over and above the structural factors mentioned earlier. mention could also have been made, half way through these two decades, of the "reprehensible exuber-ance" of operators that got carried away with the dot.com bubble and became involved in com-mitting huge sums to activities promising grossly overestimated rewards. nowadays, it is financing the ngan, needed to meet the boom in traffic, which raises a number of questions concerning the development of business models to enable european industry to regain the initiative.
all these factors merely serve to highlight further the challenges faced by operators throughout this period and those they must still face today such as how to achieve a return to growth and to continue to invest in an increasingly restrictive environment?
Didier pouillothead of bu telecom strategy,
iDate
8
Third Annual Economic ReportETNO
2. Twenty years of revolution
0
50
100
150
200
250
300
201220112007200219971992
70,090,3
104,285,7
62,8 58,784,0
130,9
234,9
283,1 273,3 272,4
5,7
28,9
94,9
140,2 141,8 141,8
8,2 11,7
35,957,2
68,7 71,1
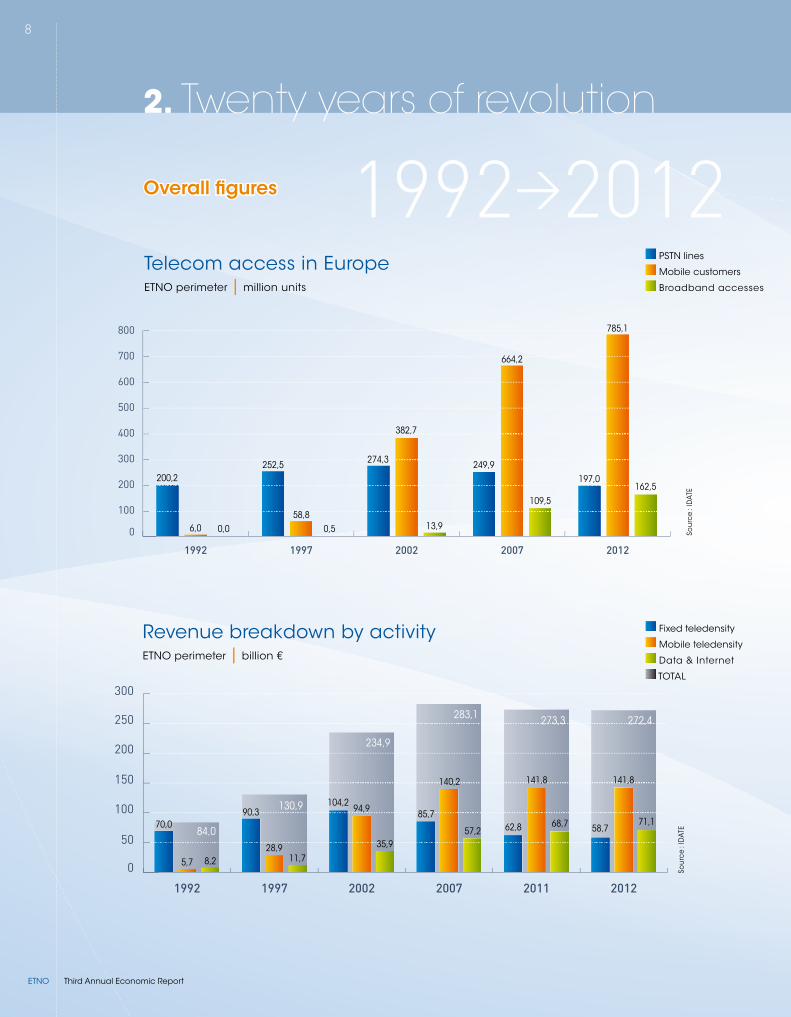
Fixed teledensity
mobile teledensity
Data & internet
totalso
urc
e : i
Dat
e
revenue breakdown by activity etno perimeter | billion €
0
100
200
300
400
500
600
700
800
20122007200219971992
197,0249,9274,3252,5
200,2
785,1
664,2
382,7
58,86,0
162,5
109,5
13,90,50,0 sou
rce
: iD
ate
telecom access in europe etno perimeter | million units
pstn lines
mobile customers
broadband accesses
Overall figures 1992>2012
9
Third Annual Economic Report ETNO
0
30
60
90
120
150
20122007200219971992
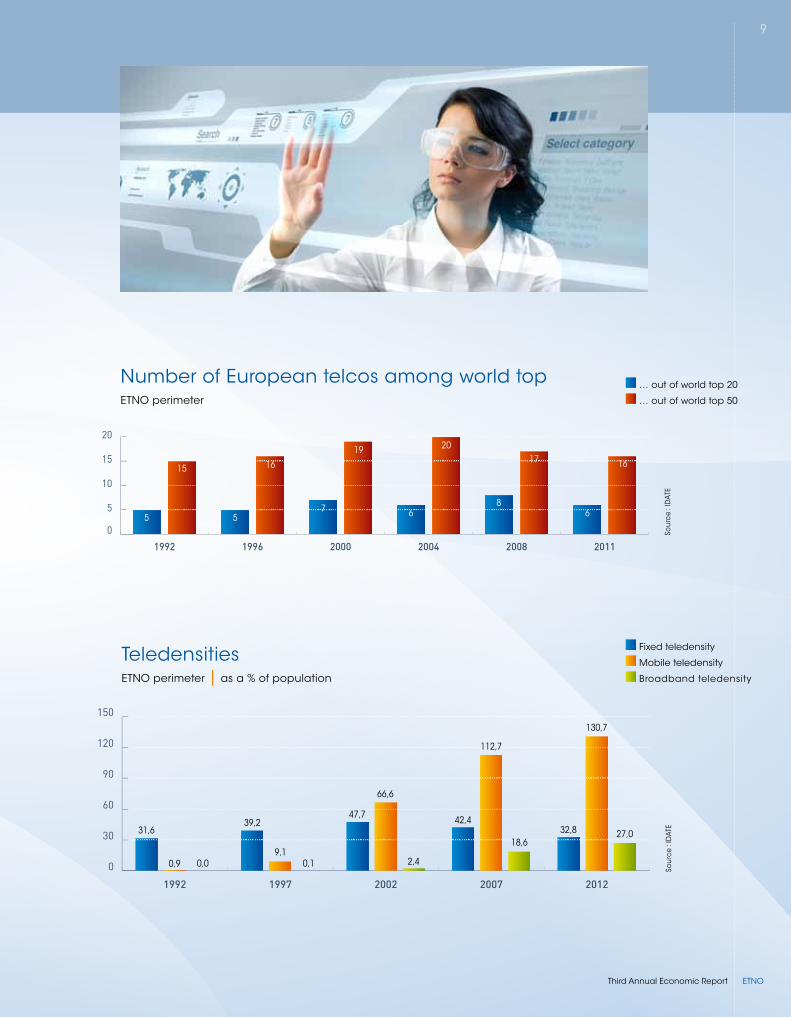
32,842,447,7
39,231,6
130,7
112,7
66,6
9,10,9
27,018,6
2,40,10,0
Fixed teledensity
mobile teledensity
broadband teledensityso
urc
e : i
Dat
eteledensities etno perimeter | as a % of population
Fixed teledensity
mobile teledensity
Data & internet
total
0
5
10
15
20
201120082004200019961992
5 57 6
86
15 16
19 2017 16
… out of world top 20
… out of world top 50
sou
rce
: iD
ate
number of european telcos among world topetno perimeter
pstn lines
mobile customers
broadband accesses
10
Third Annual Economic ReportETNO
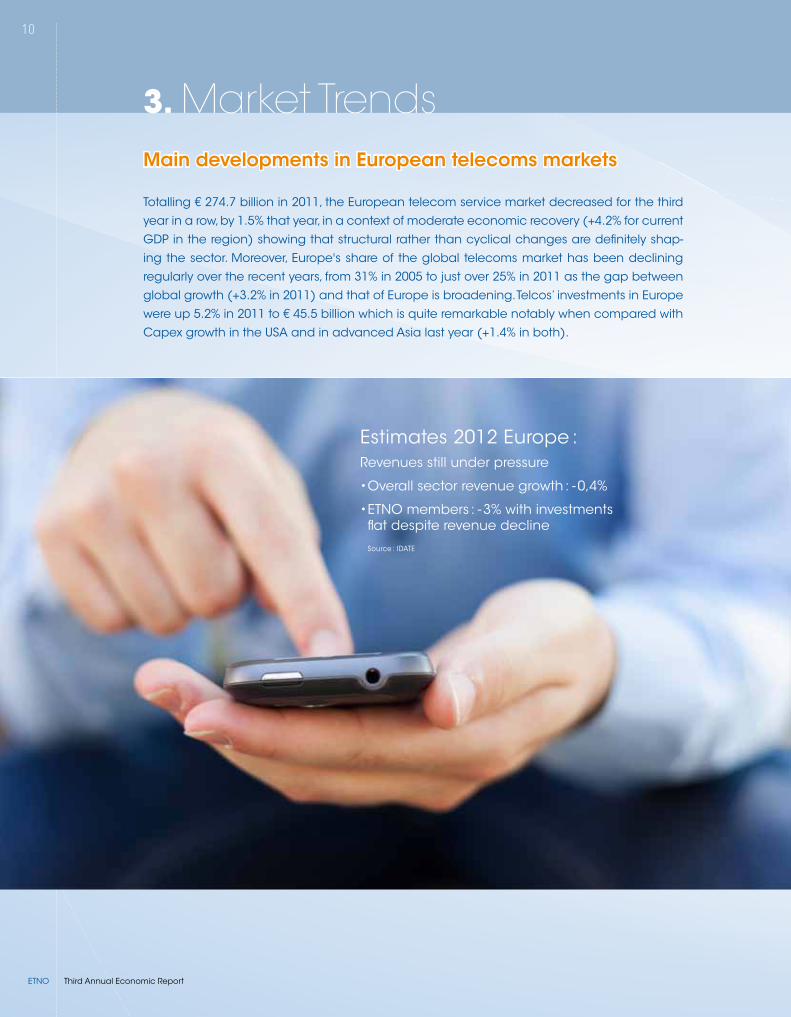
3. Market TrendsMain developments in European telecoms markets
totalling € 274.7 billion in 2011, the european telecom service market decreased for the third
year in a row, by 1.5% that year, in a context of moderate economic recovery (+4.2% for current
gDp in the region) showing that structural rather than cyclical changes are definitely shap-
ing the sector. moreover, europe's share of the global telecoms market has been declining
regularly over the recent years, from 31% in 2005 to just over 25% in 2011 as the gap between
global growth (+3.2% in 2011) and that of europe is broadening. telcos’ investments in europe
were up 5.2% in 2011 to € 45.5 billion which is quite remarkable notably when compared with
capex growth in the usa and in advanced asia last year (+1.4% in both).
estimates 2012 europe :revenues still under pressure
•Overallsectorrevenuegrowth:-0,4%
•ETNOmembers:-3%withinvestments flat despite revenue decline source : iDate
11
Third Annual Economic Report ETNO
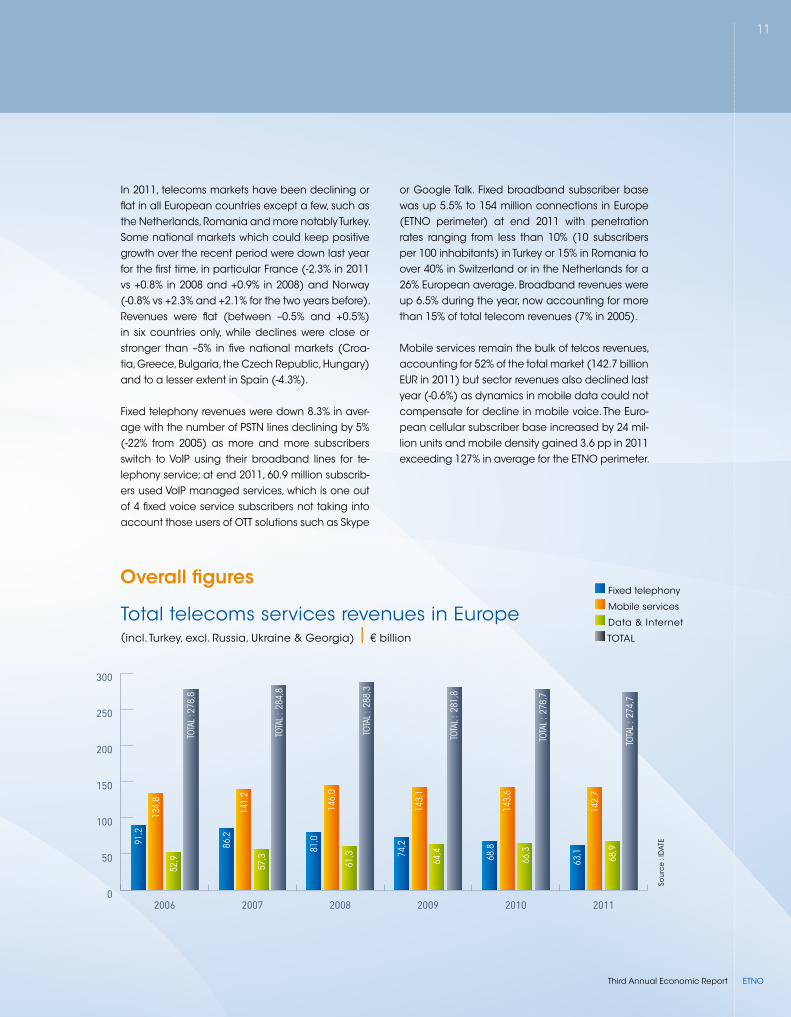
in 2011, telecoms markets have been declining or flat in all european countries except a few, such as the netherlands, romania and more notably turkey. some national markets which could keep positive growth over the recent period were down last year for the first time, in particular France (-2.3% in 2011 vs +0.8% in 2008 and +0.9% in 2008) and norway (-0.8% vs +2.3% and +2.1% for the two years before). revenues were flat (between –0.5% and +0.5%) in six countries only, while declines were close or stronger than –5% in five national markets (croa-tia, greece, bulgaria, the czech republic, hungary) and to a lesser extent in spain (-4.3%).
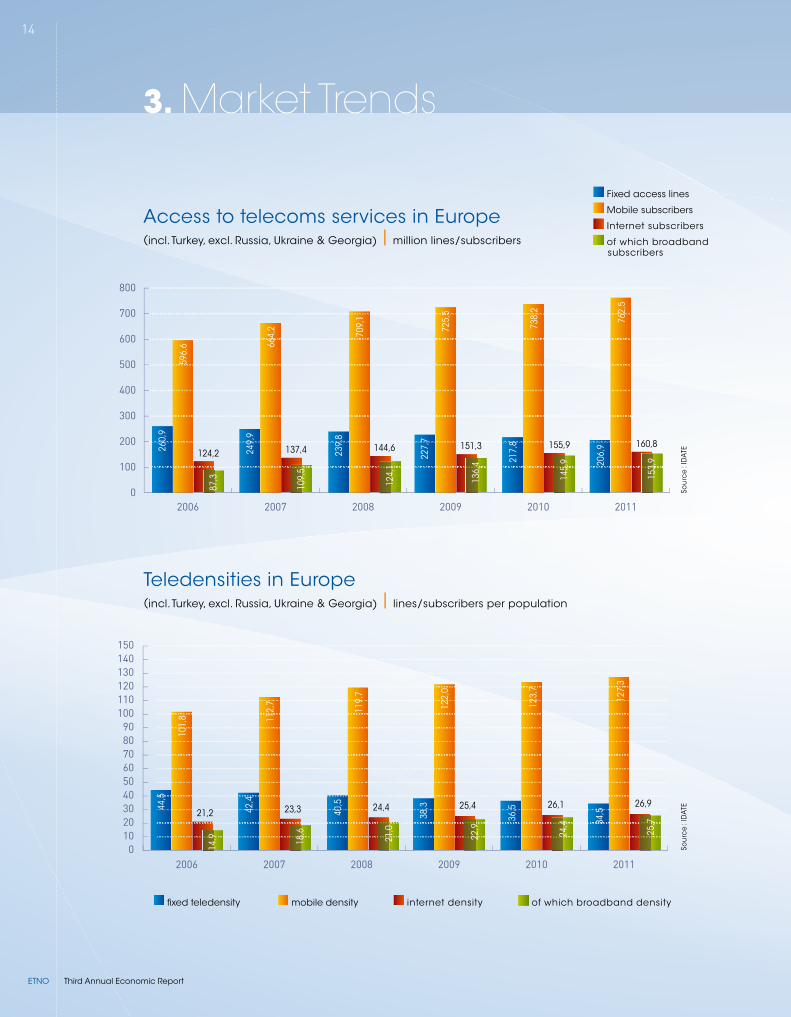
Fixed telephony revenues were down 8.3% in aver-age with the number of pstn lines declining by 5% (-22% from 2005) as more and more subscribers switch to voip using their broadband lines for te-lephony service; at end 2011, 60.9 million subscrib-ers used voip managed services, which is one out of 4 fixed voice service subscribers not taking into account those users of ott solutions such as skype
or google talk. Fixed broadband subscriber base was up 5.5% to 154 million connections in europe (etno perimeter) at end 2011 with penetration rates ranging from less than 10% (10 subscribers per 100 inhabitants) in turkey or 15% in romania to over 40% in switzerland or in the netherlands for a 26% european average. broadband revenues were up 6.5% during the year, now accounting for more than 15% of total telecom revenues (7% in 2005).
mobile services remain the bulk of telcos revenues, accounting for 52% of the total market (142.7 billion eur in 2011) but sector revenues also declined last year (-0.6%) as dynamics in mobile data could not compensate for decline in mobile voice. the euro-pean cellular subscriber base increased by 24 mil-lion units and mobile density gained 3.6 pp in 2011 exceeding 127% in average for the etno perimeter.
Overall figures
0
50
100
150
200
250
300
201120102009200820072006
91,2
86,2
81,0
74,2
68,8
63,1
134,
8
141,
2
146,
0
143,
1
143,
6
142,
7
52,9
57,3
61,3
64,4
66,3
68,9
TOTA
L : 2
78,8
TOTA
L :
284,
8
TOTA
L :
288,
3
TOTA
L :
281,
8
TOTA
L :
278,
7
TOTA
L :
274,
7
sou
rce
: iD
ate
total telecoms services revenues in europe(incl. turkey, excl. russia, ukraine & georgia) | € billion
Fixed telephony
mobile services
Data & internet
total
12
Third Annual Economic ReportETNO
-3
-2
-1
0
1
2
3
4
5
2010-20112009-20102008-20092007-20082006-2007
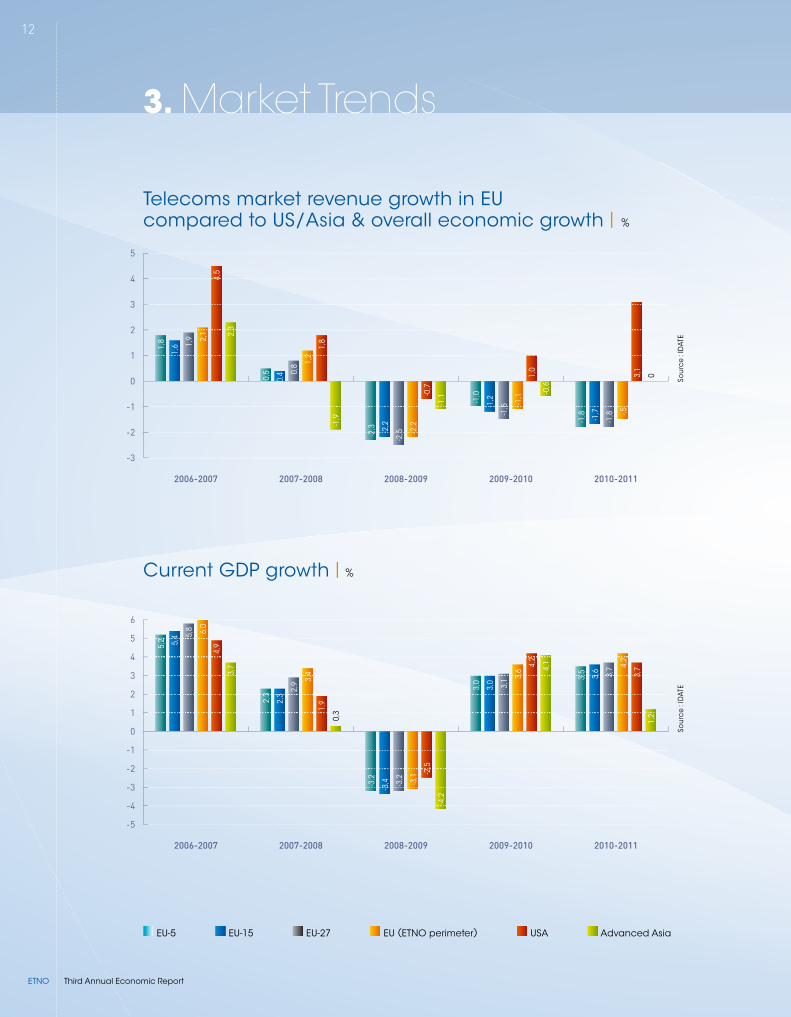
telecoms market revenue growth in eu compared to us/asia & overall economic growth | %
current gDp growth | %
sou
rce
: iD
ate
sou
rce
: iD
ate
3. Market Trends1,
8
0,5
-2,3
-1,0
-1,8
2,1
1,2
-2,2
-1,1
-,5
1,6
0,4
-2,2
-1,2
-1,7
4,5
1,8
-0,7
1,0
3,1
1,9
0,8
-2,5
-1,5
-1,8
2,3
-1,9
-1,1
-0,6
0
-5
-4
-3
-2
-1
0
1
2
3
4
5
6
2010-20112009-20102008-20092007-20082006-2007
5,2
2,3
3,0 3,
5
6,0
3,4
-3,1
3,6
4,2
5,4
2,3
-3,4-3,2
3,0
3,6
4,9
1,9
-2,5
4,2
3,7
5,8
2,9
-3,2
3,1
3,73,7
0,3
-4,2
4,1
1,2
eu-5 eu-15 eu-27 eu (etno perimeter) usa advanced asia
13
Third Annual Economic Report ETNO
-1.5
-1.0
-0.5
0.00.5
1.0
1.5
2.0
2.5
3.0
3.5
TV services
IT services
Telecom services
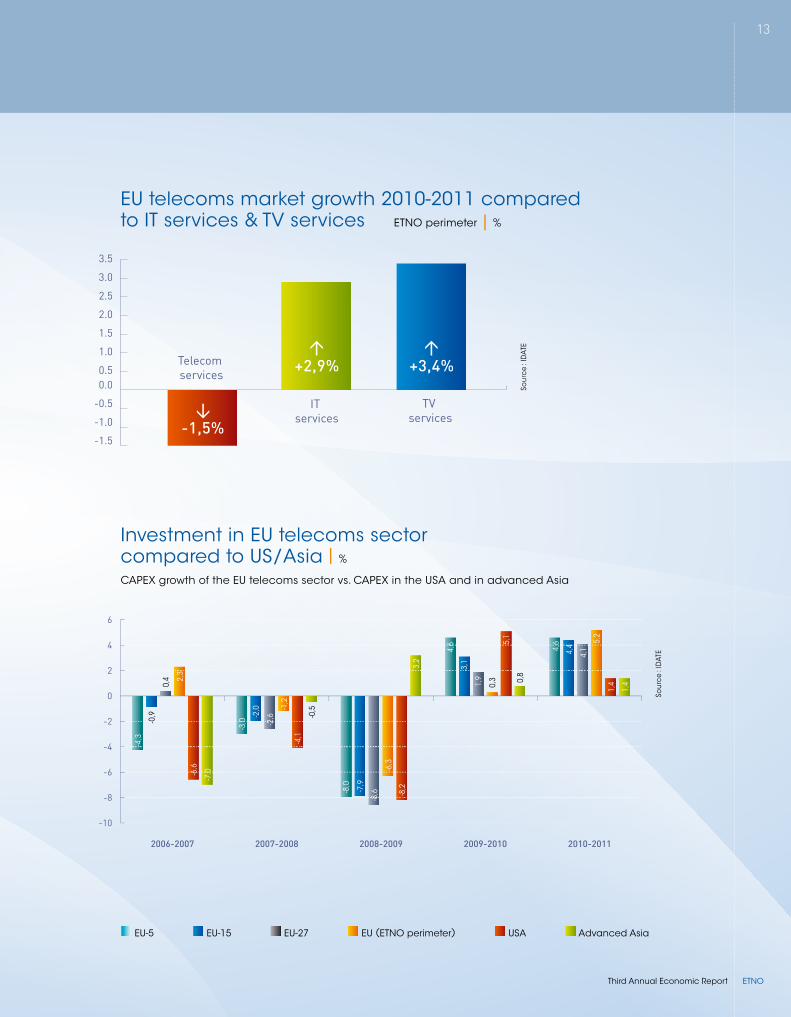
eu telecoms market growth 2010-2011 compared to it services & tv services etno perimeter | %
t-1,5%
u+3,4%
u+2,9%
sou
rce
: iD
ate
investment in eu telecoms sector compared to us/asia | %
capeX growth of the eu telecoms sector vs. capeX in the usa and in advanced asia
sou
rce
: iD
ate
-10
-8
-6
-4
-2
0
2
4
6
2010-20112009-20102008-20092007-20082006-2007
-4,3
-3,0
4,6
4,6
2,3
-1,2
-6,3
0,3
5,2
-0,9 -2
,0
-7,9
-8,0
3,1
4,4
-6,6
-4,1
-8,2
5,1
1,40,
4
-2,6
-8,6
1,9
4,1
-7,0
-0,5
3,2
0,8
1,4
eu-5 eu-15 eu-27 eu (etno perimeter) usa advanced asia
14
Fixed access lines
mobile subscribers
internet subscribers
of which broadband
subscribers
Third Annual Economic ReportETNO
0
100
200
300
400
500
600
700
800
201120102009200820072006
2011201020092008200720060
30
60
90
120
150
20
50
80
110
140
10
40
70
100
130so
urc
e : i
Dat
eso
urc
e : i
Dat
e
access to telecoms services in europe(incl. turkey, excl. russia, ukraine & georgia) | million lines/subscribers
teledensities in europe(incl. turkey, excl. russia, ukraine & georgia) | lines/subscribers per population
124,2
21,2
260,
944
,5
87,3
14,9
249,
942
,4
109,
518
,6
239,
840
,5
124,
121
,0
227,
738
,3
136,
422
,9
217,
836
,5
145,
924
,4
206,
934
,5
153,
925
,7
596,
610
1,8
664,
211
2,7
709,
111
9,7
725,
512
2,0
738,
212
3,7
762,
512
7,3
137,4
23,3
144,6
24,4
151,3
25,4
155,9
26,1
160,8
26,9
3. Market Trends
fixed teledensity mobile density internet density of which broadband density
15
Third Annual Economic Report ETNO
0
50
100
150
200
250
outside EU-27ETNO perimeterEU-2712 NMSEU-15
sou
rce
: iD
ate
sou
rce
: iD
ate
ETNO members
split of etno members’ turnover | € billion
eu-15 12 nms* eu-27ETNO
perimeteroutside eu-27
2011 European turnover 166,6 18,7 185,3 208,2 22,9
of which fixed 89,3 6,6 95,9 108,5 12,6
of which mobile 77,3 12,1 89,4 99,7 10,3
aggregated revenue of etno members (eu + non eu) | € billion
source : iDate
0 50 100 150 200 250 300 350 400
Total sector revenue : 391,9
ETNO members : 286,1OO
a
m
c
s
e
66
e
0 0 200 400 600 800 1000 1200
Total sector employment : 1127,0
ETNO members : 806,0
t
NN
t
m
p
share of total sector revenue = 73,0 %
t – 2,2 % 0,0 %
u 0,4 % t – 0,1 %
etno members’ employees (eu + non eu) | thousand
share of total sector employment = 71,5 %
source : iDate
166,
6
77,3
89,3
185,
3
89,4
95,9
208,
2
99,7
108,
5
22,9 22,910,3
18,7 12,16,6
16
Third Annual Economic ReportETNO
0
100
200
300
400
500
600
700
800
201120102009200820072006
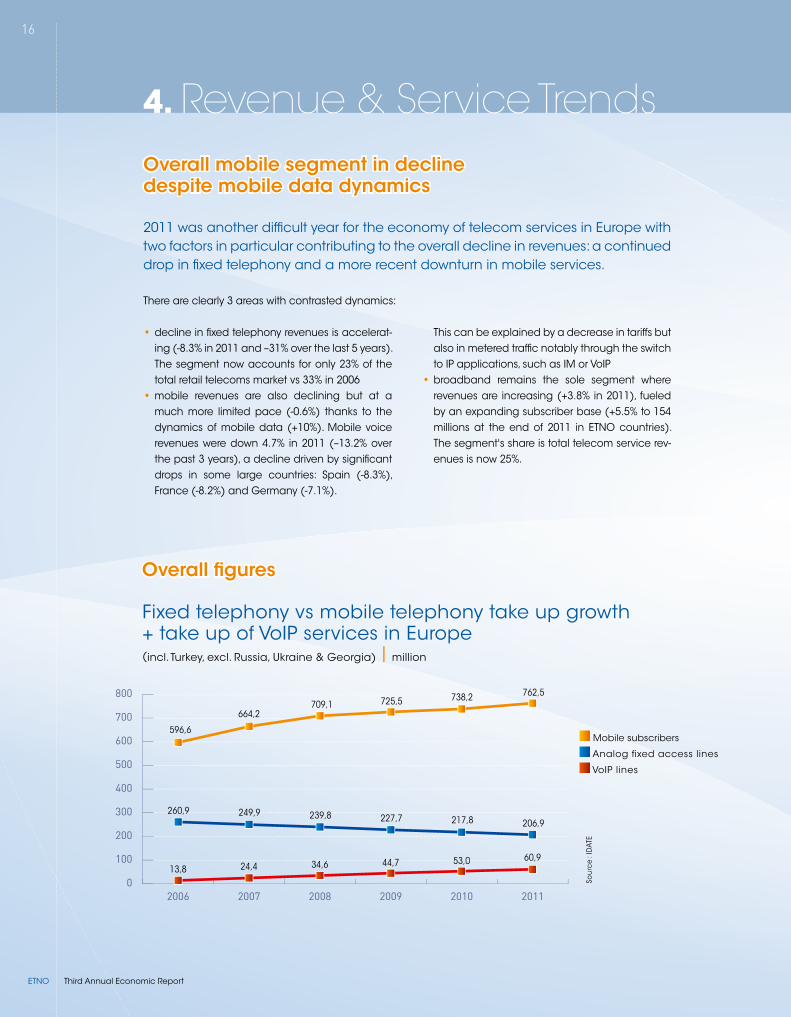
260,9 249,9 239,8 217,8227,7 206,9
596,6
664,2709,1
738,2725,5762,5
13,8 24,4 34,6 53,044,7 60,9
4. Revenue & Service Trends
• decline in fixed telephony revenues is accelerat-ing (-8.3% in 2011 and –31% over the last 5 years). the segment now accounts for only 23% of the total retail telecoms market vs 33% in 2006
• mobile revenues are also declining but at a much more limited pace (-0.6%) thanks to the dynamics of mobile data (+10%). mobile voice revenues were down 4.7% in 2011 (–13.2% over the past 3 years), a decline driven by significant drops in some large countries: spain (-8.3%), France (-8.2%) and germany (-7.1%).
this can be explained by a decrease in tariffs but also in metered traffic notably through the switch to ip applications, such as im or voip
• broadband remains the sole segment where revenues are increasing (+3.8% in 2011), fueled by an expanding subscriber base (+5.5% to 154 millions at the end of 2011 in etno countries). the segment's share is total telecom service rev-enues is now 25%.
Overall mobile segment in decline despite mobile data dynamics
2011 was another difficult year for the economy of telecom services in europe with two factors in particular contributing to the overall decline in revenues: a continued drop in fixed telephony and a more recent downturn in mobile services.
there are clearly 3 areas with contrasted dynamics:
Overall figures
Fixed telephony vs mobile telephony take up growth + take up of voip services in europe(incl. turkey, excl. russia, ukraine & georgia) | million
sou
rce
: iD
ate
mobile subscribers
analog fixed access lines
voip lines
17
Third Annual Economic Report ETNO
4. Revenue & Service Trends
ETNO members
0
50
100
150
200
250
20112010200920082007
sou
rce
: iD
ate
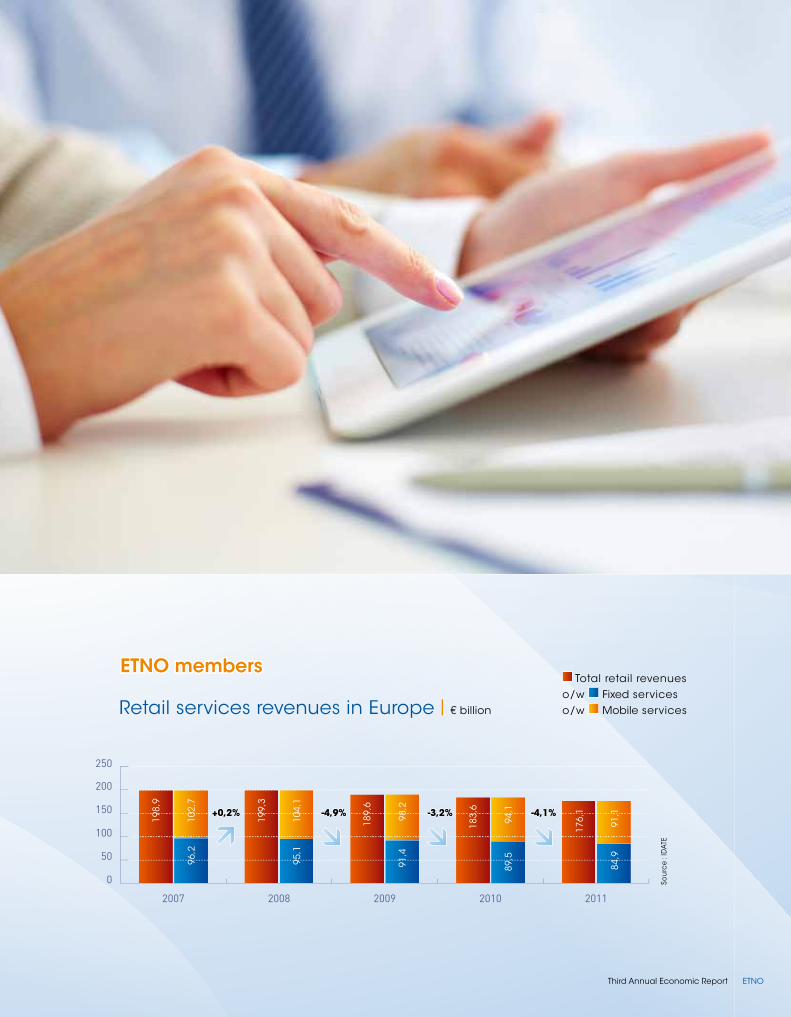
retail services revenues in europe | € billion
total retail revenueso/w Fixed services o/w mobile services
102,
7
104,
1
98,2
94,1
91,1
198,
9
199,
3
189,
6
183,
6
176,
1
96,2
95,1
91,4
89,5
84,9
+0,2% -4,9% -3,2% -4,1%

18
Third Annual Economic ReportETNO
5. Investment Trends
the number of Fttx homes passed increased to 123.9 million at the end of 2011, of which 28 mil-lion Ftth/b homes passed (+35% compared to the end of 2010) with etno accounting for 43% of this total. the situation remains very diverse according to the countries, with few of them largely or almost fully covered mainly in eastern countries (lithuania is 95% covered with Ftth/b). in western countries, large deployments of vDsl or Fttla networks (in germany, in the uK, in belgium…) appear to have retained investments in Ftth until now.
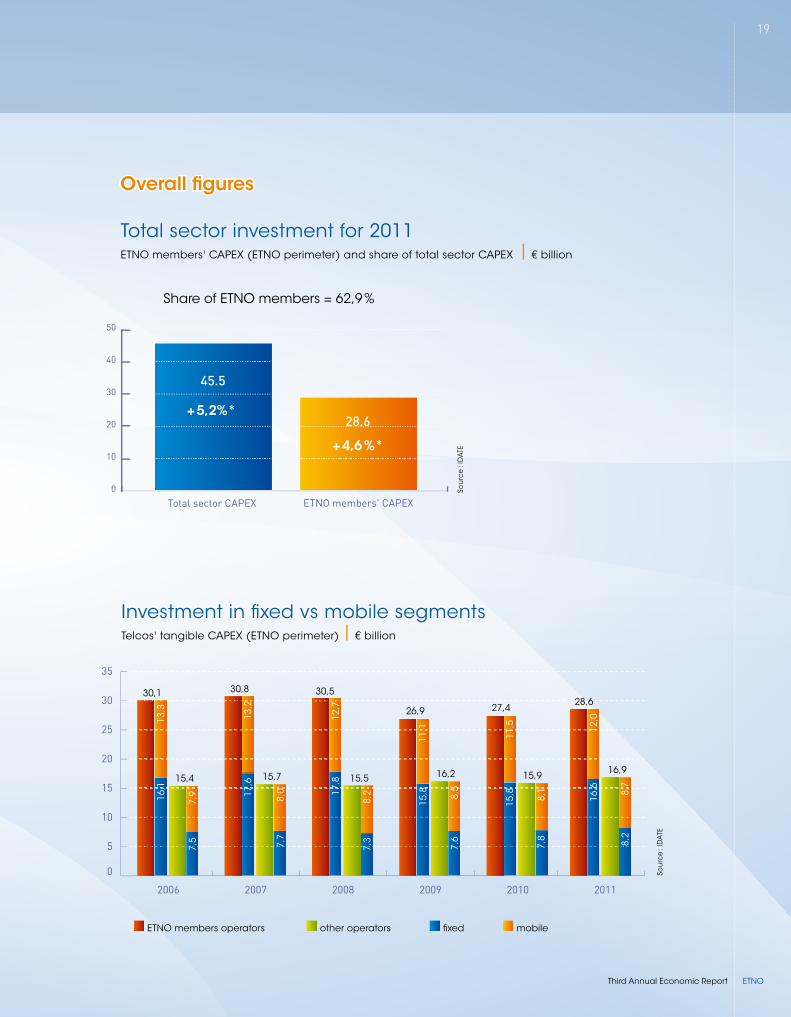
the number of Ftth/b subscribers reached 5.2 mil-lion at the end of 2011, a 34%-growth over one year, which represents a 18.6% penetration rate in areas covered. investments in mobile networks represented 45.5% of the total capeX in europe in 2011 or € 20.7 bil-lion, a 5.6% increase compared to 2010 as network operators need more and more capacity to meet customer demand for mobile data, investing in 3g+ and first 4g networks. etno members accounted for nearly 63% of this expenditure.
ETNO members accounting for more than two thirds of investment in fixed networks
investments in wireline networks in europe amounted to € 24.8 billion, increasing by 4.9% in 2011 compared to 2010 (with etno members still accounting for 67% of this expenditure) and regaining levels very close to pre-crisis spending.
19
Third Annual Economic Report ETNO
0
10
20
30
40
50
Total sector CAPEX ETNO members' CAPEX
Overall figures
total sector investment for 2011 etno members' capeX (etno perimeter) and share of total sector capeX | € billion
sou
rce
: iD
ate
share of etno members = 62,9 %
+ 5,2%*
+ 4,6 %*
28.6
45.5
investment in fixed vs mobile segments telcos' tangible capeX (etno perimeter) | € billion
0
5
10
15
20
25
30
35
201120102009200820072006
13,3
13,2
12,7
11,1
11,5 12
,0
30,1
15,4
7,916
,1
7,5
30,8
15,7
8,017
,6
7,7
30,5
15,5
8,217
,8
7,3
26,9
16,2
8,5
15,8
7,6
27,4
15,9
8,1
15,8
7,8
28,6
16,9
8,7
16,6
8,2
sou
rce
: iD
ate
etno members operators other operators fixed mobile

20
Third Annual Economic ReportETNO
ETNO members
aggregated investment by etno members in europe etno members' tangible capeX in europe (etno perimeter) | € billion
share of revenue devoted to capeX in 2011 part of turnover devoted to investment (etno members) | percent
sou
rce
: iD
ate
0
5
10
15
20
25
30
35
20112010200920082007
outside EU-27 ETNO perimeterEU-2712 NMSEU-15
sou
rce
: iD
ate
24,3
23,9
21,0
21,7
22,2
3,9 3,6
2,9 2,8 2,8
28,2
27,5
23,9
24,5
25,0
30,8
30,5
26,9
27,4 28
,6
2,6 3,0
3,0 2,93,6
eu-15 12 nms eu-27ETNO
perimeteroutside eu-27
tangible capeX/turnover 13,3% 14,8% 13,5% 13,7% 15,4%
fixed 14,8% 18,6% 15,0% 15,2% 16,2%
mobile 11,7% 12,7% 11,8% 12,1% 14,5%
5. Investment Trends
eu-15
12 nms
eu-27
outside eu-27 etno perimeter
21
Third Annual Economic Report ETNO
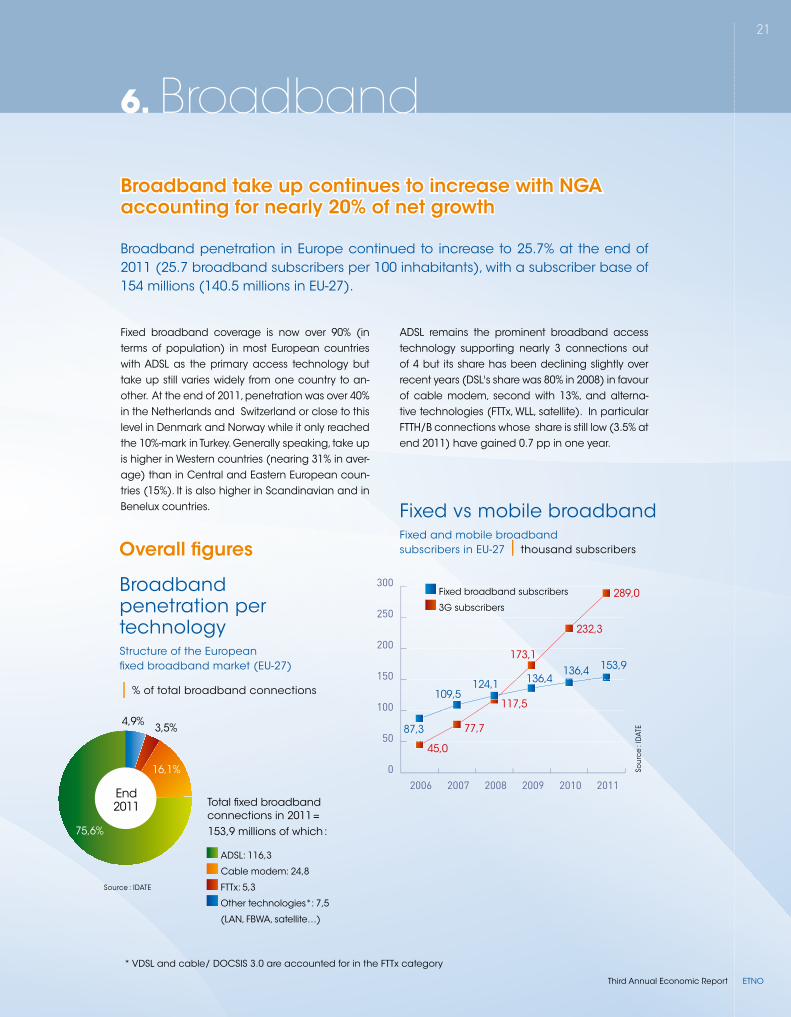
Broadband take up continues to increase with NGA accounting for nearly 20% of net growth
broadband penetration in europe continued to increase to 25.7% at the end of 2011 (25.7 broadband subscribers per 100 inhabitants), with a subscriber base of 154 millions (140.5 millions in eu-27).
Overall figures
broadband penetration per technology structure of the european fixed broadband market (eu-27)
| % of total broadband connections
Fixed broadband coverage is now over 90% (in terms of population) in most european countries with aDsl as the primary access technology but take up still varies widely from one country to an-other. at the end of 2011, penetration was over 40% in the netherlands and switzerland or close to this level in Denmark and norway while it only reached the 10%-mark in turkey. generally speaking, take up is higher in Western countries (nearing 31% in aver-age) than in central and eastern european coun-tries (15%). it is also higher in scandinavian and in benelux countries.
aDsl remains the prominent broadband access technology supporting nearly 3 connections out of 4 but its share has been declining slightly over recent years (Dsl's share was 80% in 2008) in favour of cable modem, second with 13%, and alterna-tive technologies (Fttx, Wll, satellite). in particular Ftth/b connections whose share is still low (3.5% at end 2011) have gained 0.7 pp in one year.
75,6%
end 2011 total fixed broadband
connections in 2011 = 153,9 millions of which :
aDsl: 116,3
cable modem: 24,8
Fttx: 5,3
other technologies*: 7,5
(lan, FbWa, satellite…)
source : iDate
Fixed vs mobile broadband Fixed and mobile broadband subscribers in eu-27 | thousand subscribers
sou
rce
: iD
ate
0
50
100
150
200
250
300
201120102009200820072006
87,3
45,0
109,5
77,7
124,1
117,5
136,4136,4
232,3
173,1153,9
289,0
* vDsl and cable/ Docsis 3.0 are accounted for in the Fttx category
6. Broadband
16,1%
3,5%4,9%
Fixed broadband subscribers
3g subscribers
22
Third Annual Economic ReportETNO
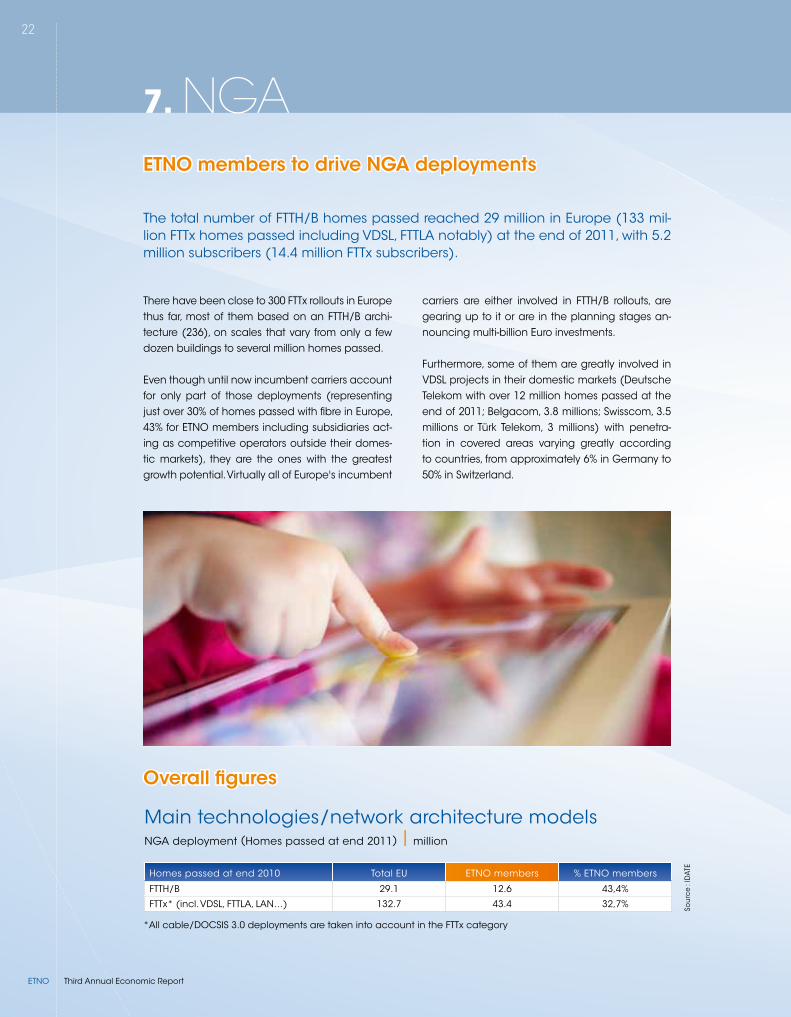
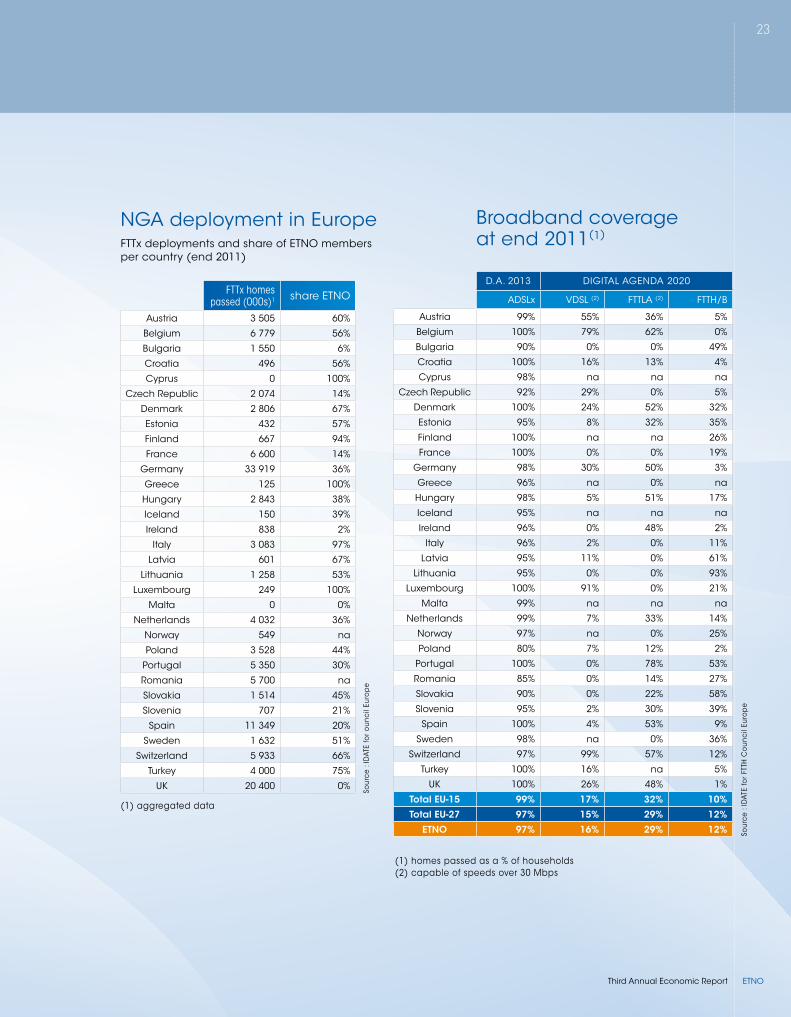
there have been close to 300 Fttx rollouts in europe thus far, most of them based on an Ftth/b archi-tecture (236), on scales that vary from only a few dozen buildings to several million homes passed.
even though until now incumbent carriers account for only part of those deployments (representing just over 30% of homes passed with fibre in europe, 43% for etno members including subsidiaries act-ing as competitive operators outside their domes-tic markets), they are the ones with the greatest growth potential. virtually all of europe's incumbent
carriers are either involved in Ftth/b rollouts, are gearing up to it or are in the planning stages an-nouncing multi-billion euro investments.
Furthermore, some of them are greatly involved in vDsl projects in their domestic markets (Deutsche telekom with over 12 million homes passed at the end of 2011; belgacom, 3.8 millions; swisscom, 3.5 millions or türk telekom, 3 millions) with penetra-tion in covered areas varying greatly according to countries, from approximately 6% in germany to 50% in switzerland.
ETNO members to drive NGA deployments
the total number of Ftth/b homes passed reached 29 million in europe (133 mil-lion Fttx homes passed including vDsl, Fttla notably) at the end of 2011, with 5.2 million subscribers (14.4 million Fttx subscribers).
Overall figures
sou
rce
: iD
ate
main technologies/network architecture models nga deployment (homes passed at end 2011) | million
homes passed at end 2010 total eu etno members % etno members
Ftth/b 29.1 12.6 43,4%
Fttx* (incl. vDsl, Fttla, lan…) 132.7 43.4 32,7%
*all cable/Docsis 3.0 deployments are taken into account in the Fttx category
7. NGA
23
Third Annual Economic Report ETNO
nga deployment in europe Fttx deployments and share of etno members per country (end 2011)
broadband coverage at end 2011(1)
sou
rce
: iD
ate
for
ou
ncil
euro
pe
(1) aggregated data
(1) homes passed as a % of households(2) capable of speeds over 30 mbps
sou
rce
: iD
ate
for
Ftth
co
unc
il eu
rop
e
FTTx homes passed (000s)1 share etno
austria 3 505 60%
belgium 6 779 56%
bulgaria 1 550 6%
croatia 496 56%
cyprus 0 100%
czech republic 2 074 14%
Denmark 2 806 67%
estonia 432 57%
Finland 667 94%
France 6 600 14%
germany 33 919 36%
greece 125 100%
hungary 2 843 38%
iceland 150 39%
ireland 838 2%
italy 3 083 97%
latvia 601 67%
lithuania 1 258 53%
luxembourg 249 100%
malta 0 0%
netherlands 4 032 36%
norway 549 na
poland 3 528 44%
portugal 5 350 30%
romania 5 700 na
slovakia 1 514 45%
slovenia 707 21%
spain 11 349 20%
sweden 1 632 51%
switzerland 5 933 66%
turkey 4 000 75%
uK 20 400 0%
D.a. 2013 Digital agenDa 2020
aDslx vDsl (2) Fttla (2) Ftth/b
austria 99% 55% 36% 5%
belgium 100% 79% 62% 0%
bulgaria 90% 0% 0% 49%
croatia 100% 16% 13% 4%
cyprus 98% na na na
czech republic 92% 29% 0% 5%
Denmark 100% 24% 52% 32%
estonia 95% 8% 32% 35%
Finland 100% na na 26%
France 100% 0% 0% 19%
germany 98% 30% 50% 3%
greece 96% na 0% na
hungary 98% 5% 51% 17%
iceland 95% na na na
ireland 96% 0% 48% 2%
italy 96% 2% 0% 11%
latvia 95% 11% 0% 61%
lithuania 95% 0% 0% 93%
luxembourg 100% 91% 0% 21%
malta 99% na na na
netherlands 99% 7% 33% 14%
norway 97% na 0% 25%
poland 80% 7% 12% 2%
portugal 100% 0% 78% 53%
romania 85% 0% 14% 27%
slovakia 90% 0% 22% 58%
slovenia 95% 2% 30% 39%
spain 100% 4% 53% 9%
sweden 98% na 0% 36%
switzerland 97% 99% 57% 12%
turkey 100% 16% na 5%
uK 100% 26% 48% 1%
Total EU-15 99% 17% 32% 10%
Total EU-27 97% 15% 29% 12%
ETNO 97% 16% 29% 12%
24
Third Annual Economic ReportETNO
8. New Broadband Services
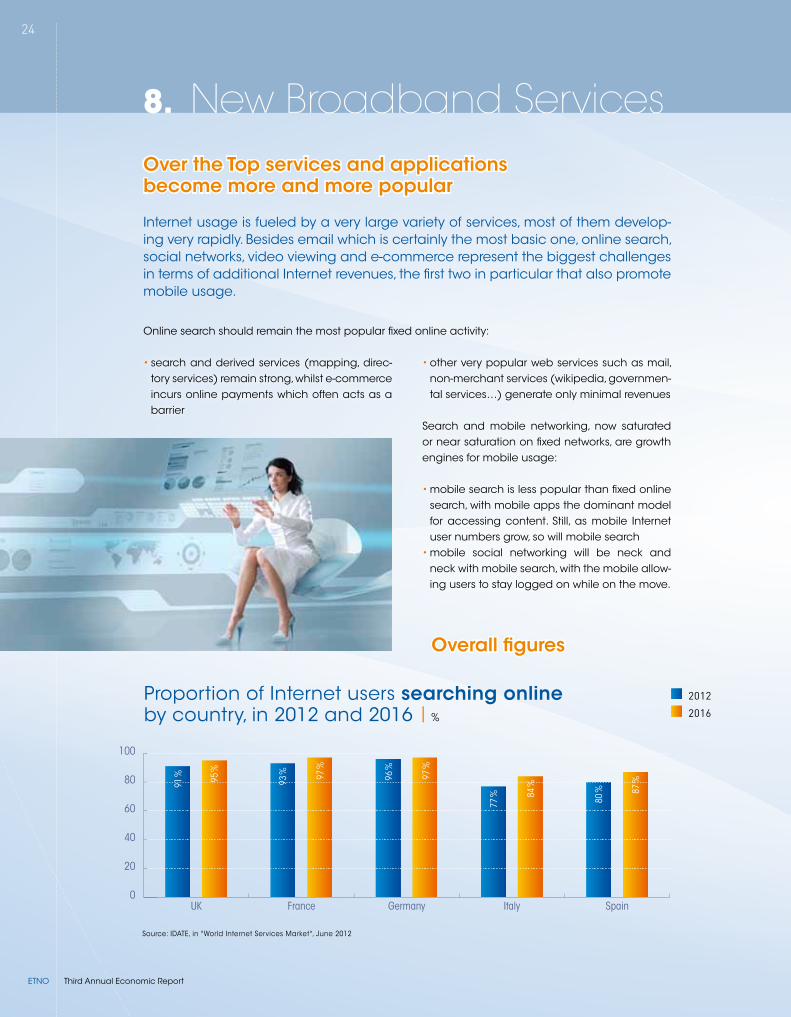
• search and derived services (mapping, direc-tory services) remain strong, whilst e-commerce incurs online payments which often acts as a barrier
• other very popular web services such as mail, non-merchant services (wikipedia, governmen-tal services…) generate only minimal revenues
search and mobile networking, now saturated or near saturation on fixed networks, are growth engines for mobile usage:
• mobile search is less popular than fixed online search, with mobile apps the dominant model for accessing content. still, as mobile internet user numbers grow, so will mobile search
• mobile social networking will be neck and neck with mobile search, with the mobile allow-ing users to stay logged on while on the move.
proportion of internet users searching online by country, in 2012 and 2016 | %
2012
2016
source: iDate, in "World internet services market", June 2012
0
20
40
60
80
100
SpainItalyGermanyFranceUK
91 %
93 % 96
%
77 % 80
%
95 %
97 %
97 %
84 %
87 %
Overall figures
Over the Top services and applications become more and more popular
internet usage is fueled by a very large variety of services, most of them develop-ing very rapidly. besides email which is certainly the most basic one, online search, social networks, video viewing and e-commerce represent the biggest challenges in terms of additional internet revenues, the first two in particular that also promote mobile usage.
online search should remain the most popular fixed online activity:

25
Third Annual Economic Report ETNO
use of social networks by country, in 2012 and 2016 | % of internet users
2012
2016
010
2030
4050
6070
80
SpainItalyGermanyFranceUK
source: iDate, in "World internet services market", June 2012
use of online video services by country, in 2012 and 2016 | % of internet users
2012
2016
source: iDate, in "World internet services market", June 2012
0
20
40
60
80
100
SpainItalyGermanyFranceUK
proportion of internet users shopping online by country, in 2012 and 2016 | % of internet users
2012
2016
source: iDate, in "World internet services market", June 2012
010
2030
4050
6070
80
SpainItalyGermanyFranceUK
65 %
77 %
57 %
63 %
54 %
71 %
63 %
19 %
61 %
29 %
70 %
79 %
60 %
69 %
58 %
75 %
68 %
23 %
65 %
33 %
84 %
86 %
80 % 85
%
87 %
88 %
90 %
83 % 89
%
90 %
26
Third Annual Economic ReportETNO
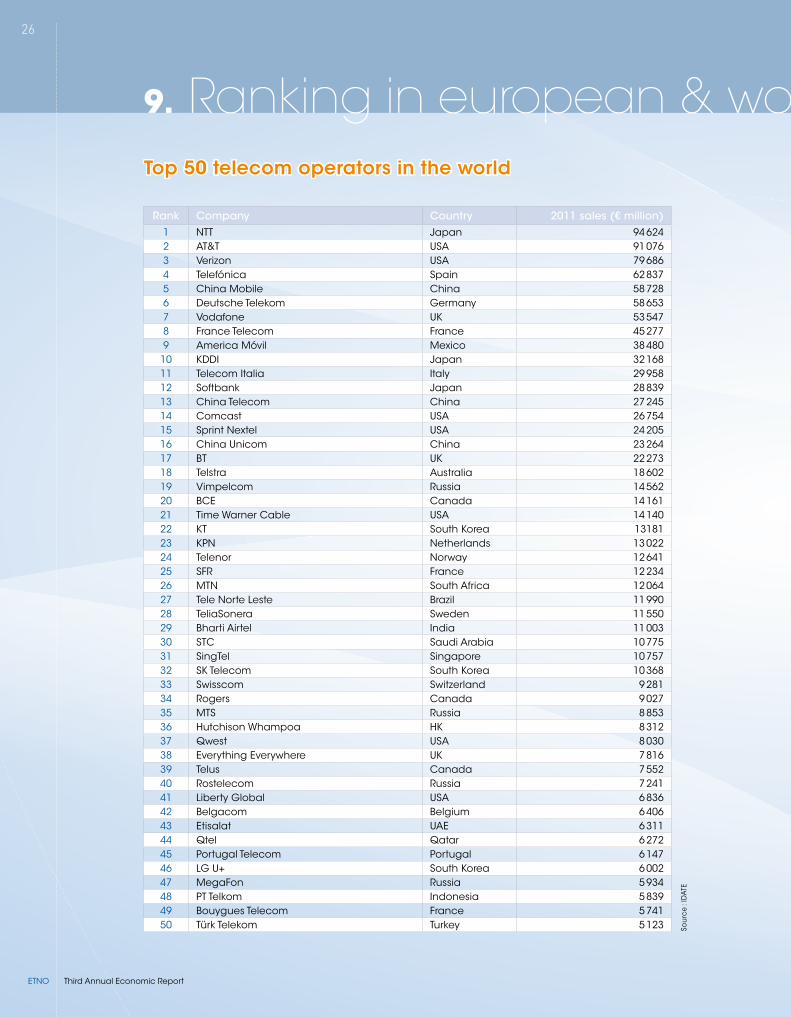
rank company country 2011 sales (€ million)1 ntt Japan 94 6242 at&t usa 91 0763 verizon usa 79 6864 telefónica spain 62 8375 china mobile china 58 7286 Deutsche telekom germany 58 6537 vodafone uK 53 5478 France telecom France 45 2779 america móvil mexico 38 480
10 KDDi Japan 32 16811 telecom italia italy 29 95812 softbank Japan 28 83913 china telecom china 27 24514 comcast usa 26 75415 sprint nextel usa 24 20516 china unicom china 23 26417 bt uK 22 27318 telstra australia 18 60219 vimpelcom russia 14 56220 bce canada 14 16121 time Warner cable usa 14 14022 Kt south Korea 1318123 Kpn netherlands 13 02224 telenor norway 12 64125 sFr France 12 23426 mtn south africa 12 06427 tele norte leste brazil 11 99028 teliasonera sweden 11 55029 bharti airtel india 11 00330 stc saudi arabia 10 77531 singtel singapore 10 75732 sK telecom south Korea 10 36833 swisscom switzerland 9 28134 rogers canada 9 02735 mts russia 8 85336 hutchison Whampoa hK 8 31237 Qwest usa 8 03038 everything everywhere uK 7 81639 telus canada 7 55240 rostelecom russia 7 24141 liberty global usa 6 83642 belgacom belgium 6 40643 etisalat uae 6 31144 Qtel Qatar 6 27245 portugal telecom portugal 6 14746 lg u+ south Korea 6 00247 megaFon russia 5 93448 pt telkom indonesia 5 83949 bouygues telecom France 5 74150 türk telekom turkey 5 123
9. Ranking in european & world companiesTop 50 telecom operators in the world
sou
rce
: iD
ate
27
Third Annual Economic Report ETNO
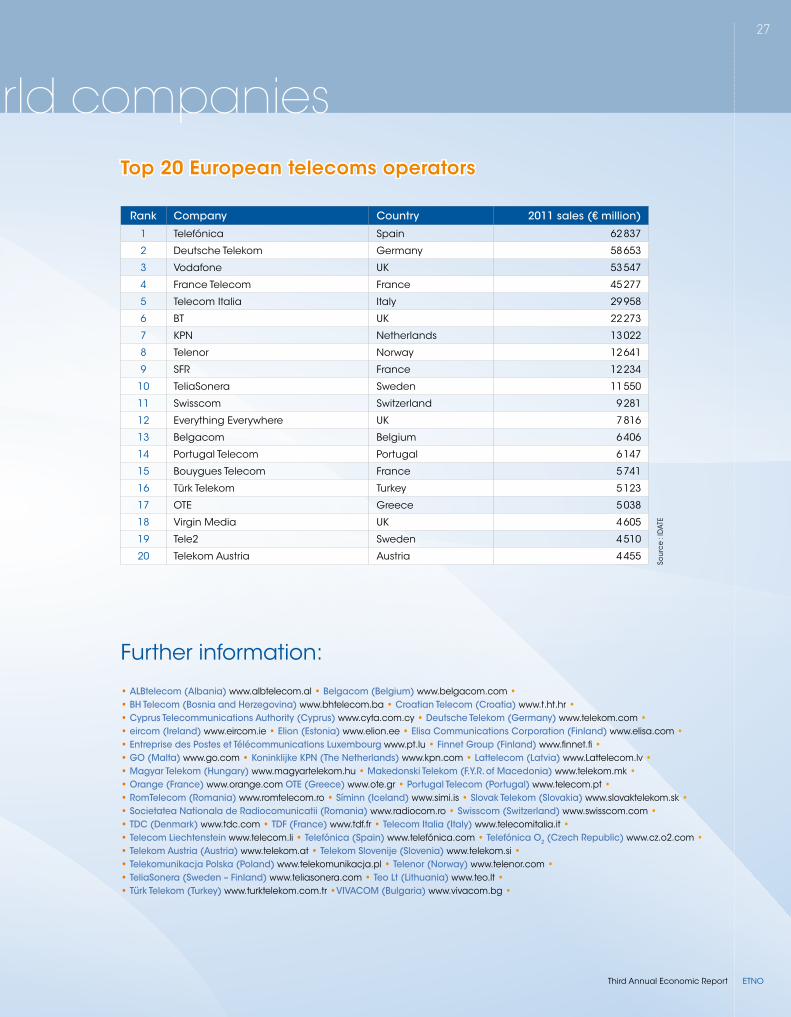
rank company country 2011 sales (€ million)
1 telefónica spain 62 837
2 Deutsche telekom germany 58 653
3 vodafone uK 53 547
4 France telecom France 45 277
5 telecom italia italy 29 958
6 bt uK 22 273
7 Kpn netherlands 13 022
8 telenor norway 12 641
9 sFr France 12 234
10 teliasonera sweden 11 550
11 swisscom switzerland 9 281
12 everything everywhere uK 7 816
13 belgacom belgium 6 406
14 portugal telecom portugal 6 147
15 bouygues telecom France 5 741
16 türk telekom turkey 5 123
17 ote greece 5 038
18 virgin media uK 4 605
19 tele2 sweden 4 510
20 telekom austria austria 4 455
Top 20 European telecoms operators
9. Ranking in european & world companies
• alBtelecom (albania) www.albtelecom.al • Belgacom (Belgium) www.belgacom.com •• BH Telecom (Bosnia and Herzegovina) www.bhtelecom.ba • croatian Telecom (croatia) www.t.ht.hr •• cyprus Telecommunications authority (cyprus) www.cyta.com.cy • Deutsche Telekom (Germany) www.telekom.com •• eircom (ireland) www.eircom.ie • Elion (Estonia) www.elion.ee • Elisa communications corporation (Finland) www.elisa.com •• Entreprise des postes et Télécommunications luxembourg www.pt.lu • Finnet Group (Finland) www.finnet.fi •• Go (malta) www.go.com • koninklijke kpn (The netherlands) www.kpn.com • lattelecom (latvia) www.lattelecom.lv •• magyar Telekom (Hungary) www.magyartelekom.hu • makedonski Telekom (F.Y.r. of macedonia) www.telekom.mk • • orange (France) www.orange.com oTE (Greece) www.ote.gr • portugal Telecom (portugal) www.telecom.pt • • romTelecom (romania) www.romtelecom.ro • síminn (iceland) www.simi.is • slovak Telekom (slovakia) www.slovaktelekom.sk • • societatea nationala de radiocomunicatii (romania) www.radiocom.ro • swisscom (switzerland) www.swisscom.com • • TDc (Denmark) www.tdc.com • TDF (France) www.tdf.fr • Telecom italia (italy) www.telecomitalia.it • • Telecom liechtenstein www.telecom.li • Telefónica (spain) www.telefónica.com • Telefónica o2 (czech republic) www.cz.o2.com • • Telekom austria (austria) www.telekom.at • Telekom slovenije (slovenia) www.telekom.si • • Telekomunikacja polska (poland) www.telekomunikacja.pl • Telenor (norway) www.telenor.com • • Teliasonera (sweden – Finland) www.teliasonera.com • Teo lt (lithuania) www.teo.lt • • Türk Telekom (Turkey) www.turktelekom.com.tr •ViVacom (Bulgaria) www.vivacom.bg •
Further information:so
urc
e : i
Dat
e

albtelecom (albania)
belgacom (belgium)
bh telecom (bosnia and herzegovina)
cyprus telecommunications
authority (cyprus)
Deutsche telekom group*
eircom (ireland)
elion enterprises ltd. (estonia)
elisa corporation (Finland)
go (malta)
Koninklijke Kpn (the netherlands)
lattelecom (latvia)
orange(France)
ote (greece)
entreprise des postes et télécommunications
(luxembourg)
portugal telecom(portugal)
societatea nationala de radiocomunicatii
(romania)
romtelecom (romania)
síminn (iceland telecom ltd.)
swisscom (switzerland)
tDc (Denmark)
tDF (France)
telecom italia (italy)
telecom liechtenstein(liechtenstein)
telefónica (spain)
telefónica czech republic (czech republic)
telekom austria(austria)
orange polska (poland)
telenor (norway)
telekom slovenije(slovenia)
teliasonera (sweden-Finland)
teo (lithuania)
türk telekom(turkey)
net (croatia)
vivacom (bulgaria)
* Deutsche Telekom Group companies who are members of ETNO: Deutsche Telekom, Hrvastki Telekom, Magyar Telekom, Makedonski Telekom & Slovak Telekom
etno members
etno observers
ETNO a.i.s.b.l. • Av. Louise 54 • 1050 Brussels, Belgium • Tel: +32 (0)2 219 32 42 • Fax: +32 (0)2 219 64 12 • eMail: [email protected] • www.etno.eu


