B Television and Japanese Children a longitudinal study from zero to twelve Interim report from zero to five etter Broadcasting for Children Project 2010
| Date post: | 23-Apr-2018 |
| Category: |
Documents |
| Upload: | phungxuyen |
| View: | 215 times |
| Download: | 1 times |

BTelevision and Japanese Children
a longitudinal study from zero to twelveInterim report from zero to five
etterBroadcastingfor ChildrenProject 2010

Contents
1
Foreword 2
Acknowledgments 3
Method 5
SECTION 1: Media use in the first six years
Longitudinal Change in Television Watching 8
Genres of TV Programs 10
Videos and Video Games 12
SECTION 2: Television and the Lives of Preschoolers
The Home Media Environment 15
Daily Activities and Media Exposure 17
Parental Filtering Behavior 19
Child-rearing stress on mothers 24
Overview of “Better Broadcasting for Children” Project 26

Foreword
This is an interim research report about “Better Broadcasting for Children Project”, carried out by
NHK Broadcasting, Culture Research Institute.
Since January 2003, the project conducted yearly survey which explores the relationship between
children’s media use and family environment, children’s everyday life, parents’ beliefs/control about
children’s media use, parents’ own media use, children’s mental/physical development, and socio-
economic indices, such as parental occupation.
This survey is a longitudinal panel study, which follows about 1,000 children from 0 to 12 year-old.
There are some studies that explore the effect of media use on children, but scarcely any study
followed the same group of children for a long period of time. This longitudinal design makes this
project unique and distinctive one.
The phase 6 survey, which is conducted in January 2008, completed the survey on pre-school
period, i.e., infancy (0 to 5 year-old), and we have started longitudinal analyses using accumulated
data from this first 6 years of data collection. This report is the summary of the results of these
analyses.
Immediately after birth, infants are exposed to various screen media, including Television. In many
families, while spending time with their parents, infants listen to the sound and turn their faces to what
their parents watch on the television. Willingly or not, infants are exposed to various media. What does
media exposure mean for children’s development? Children’s development is a very complicated
process. Many factors including attitude toward parenting, family environment, and relationship with
family members/friends, contribute children’s mental/physical development. As one of these factors,
what kind of role do screen media play? What effect other factors have on screen media exposure
itself?
“Better Broadcasting for Children Project” has started to answer these questions. In this report, we
summarize the current situation of screen media exposure (mainly television) among children, and
explore the factors which determine the amount of media exposure. Since this survey is longitudinal
panel design, which follows the same group of children, it is possible to show the chronological
change of screen media exposure more accurately than cross-sectional design.
It is possible to assume that media usage is one aspect of each family’s culture. Each child differs in
amount and content of television program he/she exposed to. For example, their parents’ habit, i.e.,
how long parents watch television, or what kind of program they prefer is expected to have effect on
children’s media exposure. In this report, we are investigating the factors which correlate with amount
of children’s television exposure.
Forward
2

3
Acknowledgments
We hereby express our deep appreciation to all of the following people for their special cooperation
with the study.
The children and their families who have participated in the study
The General Planning Bureau and the School Board of Kawasaki City
Kindergartens and nursery schools in Kawasaki City
The Ethics Committee of the project:
Hiroshi Azuma, psychologist
Masao Itou, special advisor, the RIKEN Brain Science Institute
Sigehiko Kamoshita, honorary president, the National Center for Global Health and Medicine
Yoshiko Nomoto, past principal, Shin Nihon Nursery
Hiroko Hara, visiting professor, Josai International University
Tsutomu Hotta, president, the Sawayaka Welfare Foundation
We would like to take this opportunity to express our heartfelt gratitude to all those individuals
who graciously contributed their efforts during the research and design phases of the project and
gave us their guidance and advice. These include Takemochi Ishii, chairperson and CEO, the Tokio
Marine Research Institute; Takasi Saeki, professor, Aoyama Gakuin University; Keiitchi Katsura,
researcher on mass media; Takeshi Yourou, human anatomist; Hideaki Koizumi, brain scientist;
Nobuko Utida, professor, Ochanomizu University; Rika Kayama, psychiatrist and professor, Rikkyo
University; Toshiyuki Sawaguchi, director, Humanity Neuroscience Institute; Kenji Nihei, pediatric
neurologist; Michitaka Hirose, professor, the Research Center for Advanced Science and Technology,
the University of Tokyo; Shigekazu Sakai, professor and deputy director, the Global Information and
Telecommunication Institute, Waseda University; Takasi Kawai, professor, the Global Information and
Telecommunication Institute, Waseda University; Shinji Miyadai, sociologist and professor, Tokyo
Metropolitan University; and Masako Tanimura, research director, Department of Pediatric and
Adolescent Growth, National Center for Child Health and Development.
In addition, the following professionals have provided advice for this project from global and outward-
looking perspectives: Sarah L. Friedman, past project scientist and scientific coordinator, the National
Institute of Child Health and Human Development (NICHD); and Aletha C. Huston, professor, the
University of Texas.
Acknowledgment

Last but certainly not least, we are extremely thankful to the following people, who gave various
forms of valuable advice for the project: Naoki Ogi, education critic; Naoko Misawa, psychological
counselor; Michiko Tuchiya, research scientist on childcare studies; Takeo Masaki, professor emeritus,
Nippon Sport Science University; Takashi Muto, professor, Shiraume Gakuen University; Anne Wood,
British educational program creator; Mary Ann Dudko, American educational program creator; Cheryl
Ann Hassen, Canadian educational program creator; Jan-Willem Bult, Dutch educational program
creator; Milton Chen, senior fellow and executive director emeritus, the George Lucas Educational
Foundation; Michael Rich, professor, Harvard University; Peter C. Scheidt, director, the National
Children's Study Program Office, the National Institute of Child Health and Human Development
(NICHD); Ellen A. Wartella, professor, Northwestern University; Elizabeth A. Vandewater, assistant
professor, the University of Texas at Austin; Miriam E. Bar-on, professor, Loyola University Chicago;
Ed Donnerstein, professor, the University of Arizona; and Joseph J. Campos, professor, the University
of California.
This study was conducted as a joint effort of the NHK Broadcasting Culture Research Institute and
the following university researchers.
Noboru Kobayashi, specialist in pediatric medicine and honorary president, the National
Children's Hospital in Tokyo
Hiroshi Akuto, sociologist and president, Toyo Eiwa University
Yukuo Konishi, director, the Center for Baby Science, Doshisha University
Masuo Koyasu, professor (developmental psychology), Kyoto University
Yoichi Sakakibara, professor (pediatrics), Ochanomizu University
Akira Sakamoto, professor (social psychology), Ochanomizu University
Masumi Sugawara, professor (pediatrics), Ochanomizu University
Yasuko Minoura, professor emeritus (anthropology), Ochanomizu University
Nobuo Isshiki, professor (children media studies), Konan Women’s University
The study was designed and analyzed, and the report was written, by the following individuals.
Masumi Sugawara, professor, Ochanomizu University
Nobuo Isshiki, professor, Konan Women’s University
Atsushi Sakai, associate professor, University of Yamanashi
Kumiko Mukaida, associate professor, Komazawa Women’s Junior College
Sachi Tajima, lecturer, Kanto Junior College
Satoko Matsumoto, research fellow, Ochanomizu University
Hiroto Murohashi, associate fellow, Ochanomizu University
Syunro Nakai, senior researcher, the NHK Broadcasting Culture Research Institute
Noriko Nishimura, principal researcher, the NHK Broadcasting Culture Research Institute
4

Method
5
Method
Participants and Data
1,600 families with children who were born in Kawasaki-city during February to July 2002 were randomly sampled by districts, and 1,368 families who agreed to participate to the study were registered as the participant of this project. The data were collected once a year, mainly in January.
Data Collection Procedure
The data were collected by mailing questionnaires to each family. The content of the questionnaire is comprised from roughly the following two dimensions:
1)Television, video, video game viewing/using weekly diary
In this diary, parents are asked to record child’s usage of television, video, and vide-game everyday (24 hours) in 15 minutes unit.The important feature of this diary is that there are columns to record “how” and “with whom” child views/uses the media. For “how” column, it is required distinguish the following three types of situation:
1) Background television: TV is on in the room where child is, but child is not watching
2) Viewing while doing other things: Child is watching TV but engaging in other things at the
same time
3) Attentive viewing: Child is watching TV without engaging in any other things
In this project, we define amount of time 2) + 3) as “watching time” and 1) + 2) + 3) as “exposure time”.We assume that the presence of other person when child is watching TV is important for media usage supervision point of view; therefore, we set the following three categories:
1) Watching children alone, without adults companion
2) Watching with parents
3) Watching with adults other than parents
2)Questionnaire on media usage and child development
In this questionnaire, wide variety of questions including child physical development (ex. height, weight), children’s psychosocial development, children and parents’ media use and attitude, parental beliefs and control on children’ media use, attitude toward parenting. There are separate questionnaire booklets for Parent 1 (for primary caregiver, i.e., those spend the longest time with target child, mostly mother), and for Parent 2 (for secondary caregiver, i.e., those spend long time with target child next to Parent 1, mostly father).
6
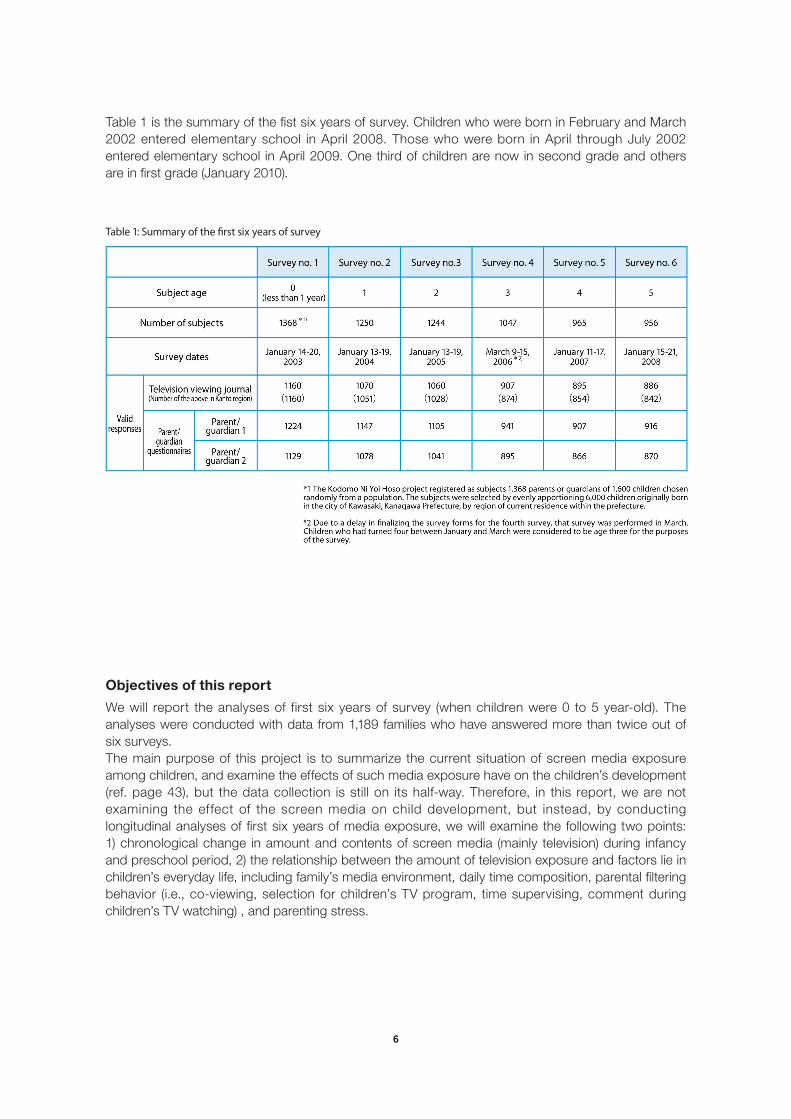
Table 1 is the summary of the fist six years of survey. Children who were born in February and March 2002 entered elementary school in April 2008. Those who were born in April through July 2002 entered elementary school in April 2009. One third of children are now in second grade and others are in first grade (January 2010).
Objectives of this report
We will report the analyses of first six years of survey (when children were 0 to 5 year-old). The analyses were conducted with data from 1,189 families who have answered more than twice out of six surveys.The main purpose of this project is to summarize the current situation of screen media exposure among children, and examine the effects of such media exposure have on the children’s development (ref. page 43), but the data collection is still on its half-way. Therefore, in this report, we are not examining the effect of the screen media on child development, but instead, by conducting longitudinal analyses of first six years of media exposure, we will examine the following two points: 1) chronological change in amount and contents of screen media (mainly television) during infancy and preschool period, 2) the relationship between the amount of television exposure and factors lie in children’s everyday life, including family’s media environment, daily time composition, parental filtering behavior (i.e., co-viewing, selection for children’s TV program, time supervising, comment during children’s TV watching) , and parenting stress.
Table 1: Summary of the �rst six years of survey

Media use in the first six years
Key Findings1
7
Longitudinal Change in Television Watching
● Children spend an average of about 90 minutes per day watching TV.
● Children who were exposed to TV or watched TV for longer periods of time at age zero tend to spend longer time doing so at age five.
● In the first six years of life, the time spent with TV by children alone remains unchanged (about 30 minutes per day), while the time spent with adults in front of the TV tends to decrease.
Genres of TV Programs
● The time children spend watching and the way they watch TV differ by genre.
● Children are likely to watch educational programs and cartoons by themselves alone and to watch programs of other genres with adults.
● Children tend to watch educational programs intended for young children less and to watch cartoons for children more as they grow.
Videos and Video Games
● Two-year-olds are the most likely to be exposed to videos and use them for the longest periods of time.
● The percentage of children who spend time with video games increases with age, with a gap between boys and girls.

Figure 1 shows the average amounts of time children with the TV. As noted earlier, we distinguish the following three types of situation: 1) background television: TV is on in the room where a child is, but he/she is not watching, 2) viewing while doing other things: a child is watching TV but doing other things at the same time 3) attentive viewing: a child is watching TV without doing any other things. In this project, we define amount of time 2) +3) as “watching time” and 1) +2) +3) as “exposure time”. The amount of exposure time of TV per day peaks at age one (3:24), then gradually declines as children grow (2:44 at age two, 2:26 at age three, 2:13 at age four, 2:09 at age five). This decline is caused by a marked drop in the amount of ‘background television’ time from 111 minutes at age zero to 24 minutes at age five. On the contrary, there are no major changes in the amounts of time of ‘viewing while doing other things’ and ‘attentive viewing’ after age two (about 60 minutes and 30 minutes, respectively). Therefore the amount of watching time of TV remains unchanged, approximately 90 minutes per day at ages two to five. These results suggest that zero-year-olds are more likely to be exposed to background television, whereas children over the age of one are more likely to watch television on their own initiative. As figure 2 shows, the amount of exposure time of TV tends to be slightly longer among girls than boys at all ages. Since no gender differences are found in the amount of time of ‘attentive viewing’ at any age, this gender gap is mainly brought by differences in the amounts of time of ‘background television’ and ‘viewing while doing other things”.
Children spend an average of about 90 minutes per day watching TV,
8
Longitudinal Change in Television Watching
Fig. 1: Longitudinal changes in exposure time of TV
Fig. 2: Longitudinal changes in exposure time by gender
9
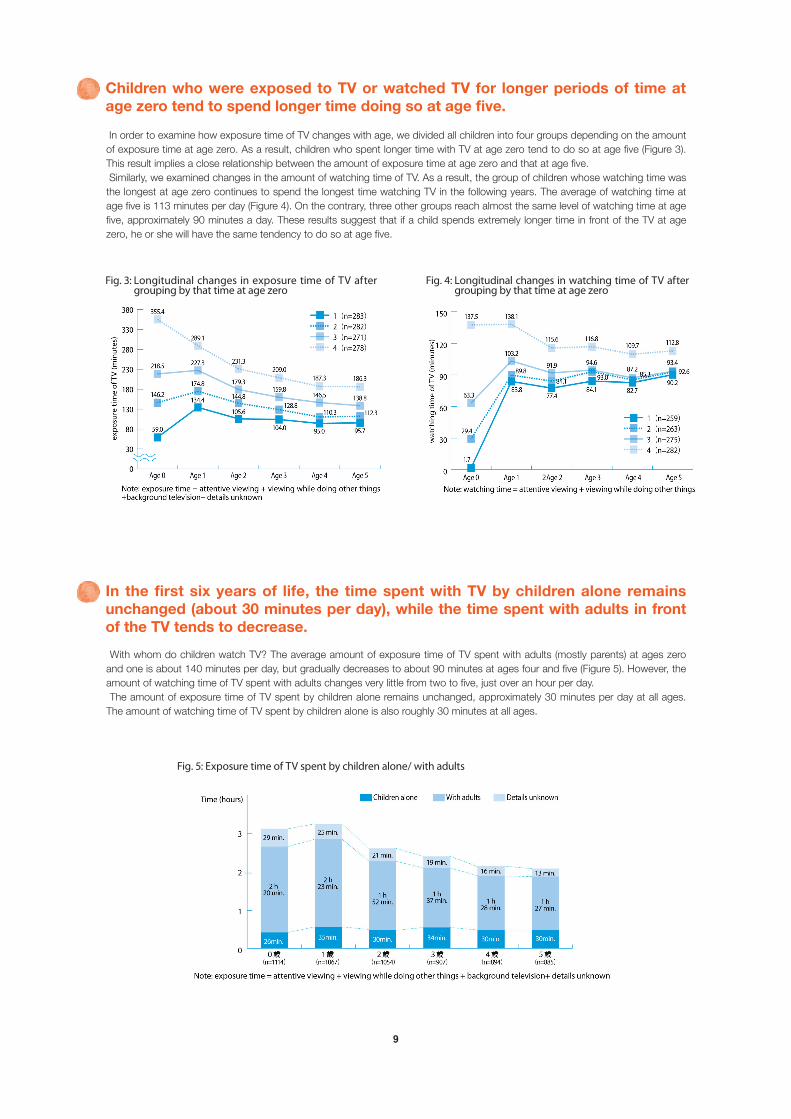
In order to examine how exposure time of TV changes with age, we divided all children into four groups depending on the amount of exposure time at age zero. As a result, children who spent longer time with TV at age zero tend to do so at age five (Figure 3). This result implies a close relationship between the amount of exposure time at age zero and that at age five. Similarly, we examined changes in the amount of watching time of TV. As a result, the group of children whose watching time was the longest at age zero continues to spend the longest time watching TV in the following years. The average of watching time at age five is 113 minutes per day (Figure 4). On the contrary, three other groups reach almost the same level of watching time at age five, approximately 90 minutes a day. These results suggest that if a child spends extremely longer time in front of the TV at age zero, he or she will have the same tendency to do so at age five.
Children who were exposed to TV or watched TV for longer periods of time at age zero tend to spend longer time doing so at age five.
Fig. 3: Longitudinal changes in exposure time of TV after grouping by that time at age zero
Fig. 4: Longitudinal changes in watching time of TV after grouping by that time at age zero
With whom do children watch TV? The average amount of exposure time of TV spent with adults (mostly parents) at ages zero and one is about 140 minutes per day, but gradually decreases to about 90 minutes at ages four and five (Figure 5). However, the amount of watching time of TV spent with adults changes very little from two to five, just over an hour per day. The amount of exposure time of TV spent by children alone remains unchanged, approximately 30 minutes per day at all ages. The amount of watching time of TV spent by children alone is also roughly 30 minutes at all ages.
In the first six years of life, the time spent with TV by children alone remains unchanged (about 30 minutes per day), while the time spent with adults in front of the TV tends to decrease.
Fig. 5: Exposure time of TV spent by children alone/ with adults
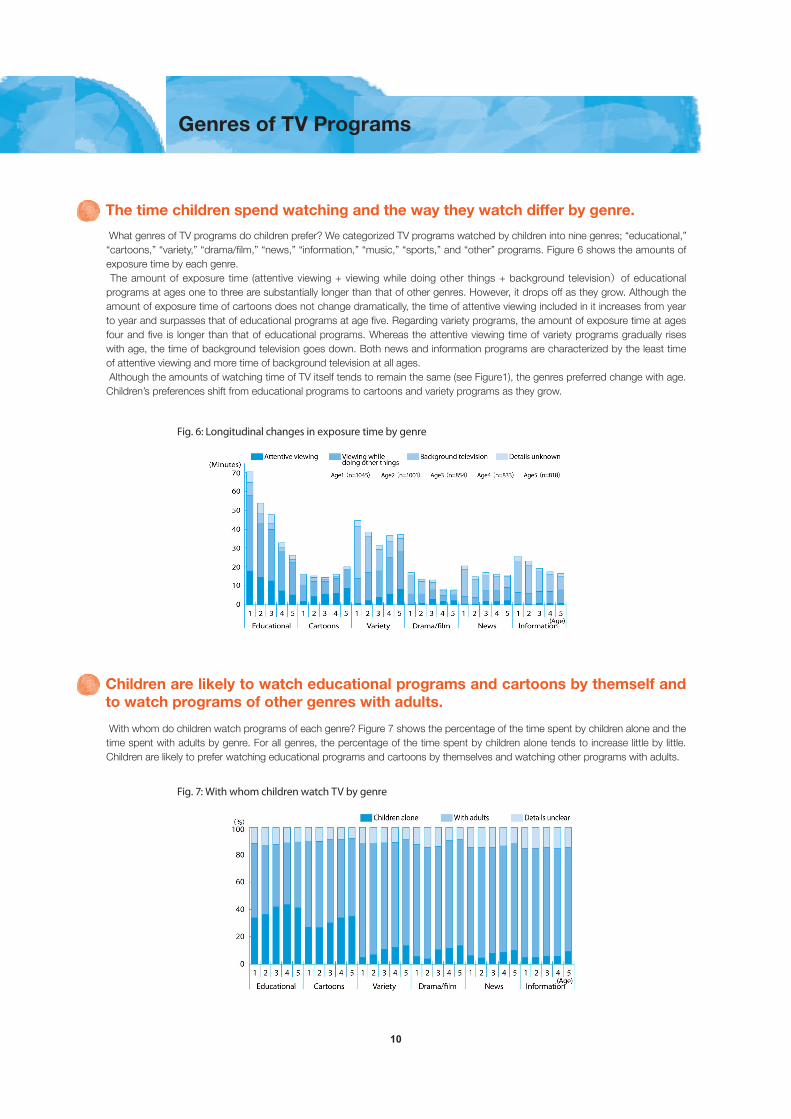
What genres of TV programs do children prefer? We categorized TV programs watched by children into nine genres; “educational,” “cartoons,” “variety,” “drama/film,” “news,” “information,” “music,” “sports,” and “other” programs. Figure 6 shows the amounts of exposure time by each genre. The amount of exposure time (attentive viewing + viewing while doing other things + background television)of educational programs at ages one to three are substantially longer than that of other genres. However, it drops off as they grow. Although the amount of exposure time of cartoons does not change dramatically, the time of attentive viewing included in it increases from year to year and surpasses that of educational programs at age five. Regarding variety programs, the amount of exposure time at ages four and five is longer than that of educational programs. Whereas the attentive viewing time of variety programs gradually rises with age, the time of background television goes down. Both news and information programs are characterized by the least time of attentive viewing and more time of background television at all ages. Although the amounts of watching time of TV itself tends to remain the same (see Figure1), the genres preferred change with age. Children’s preferences shift from educational programs to cartoons and variety programs as they grow.
The time children spend watching and the way they watch differ by genre.
Genres of TV Programs
Fig. 6: Longitudinal changes in exposure time by genre
10
With whom do children watch programs of each genre? Figure 7 shows the percentage of the time spent by children alone and the time spent with adults by genre. For all genres, the percentage of the time spent by children alone tends to increase little by little. Children are likely to prefer watching educational programs and cartoons by themselves and watching other programs with adults.
Children are likely to watch educational programs and cartoons by themself and to watch programs of other genres with adults.
Fig. 7: With whom children watch TV by genre

11
Two major programs for children are educational programs and cartoons. However, the targets differ according to the program, ranging from infants to high school students. Among them, we focused on both educational programs specifically designed for young children and cartoons for children and examined how they were watched. Figure 8 shows the amounts of exposure time of those programs.The amount of exposure time of educational programs specifically made for young children peaks at age one, averaging just under an hour. The average amount of attentive viewing time of these educational programs at age one is 17 minutes per day, which occupy as much as 70% of the attentive viewing of TV itself at age one (24 minutes, see Figure 1); however, the amount of exposure time of these educational programs falls sharply to 20 minutes at age five. On the other hand, there are no major changes in the amount of exposure time of cartoons for children, but the attentive viewing included in it rises little by little with age.Figure 9 shows with whom children watch these programs. While the percentage of the time spent by children alone slightly increases as they grow for each genre, no major changes are apparent.
Children tend to watch educational programs for young children less and to watch cartoons for children more as they grow.
Fig. 8: Longitudinal changes in exposure time of educational programs for young children and cartoons for children
Fig. 9: With whom children watch educational programs for young children and cartoons for children
12
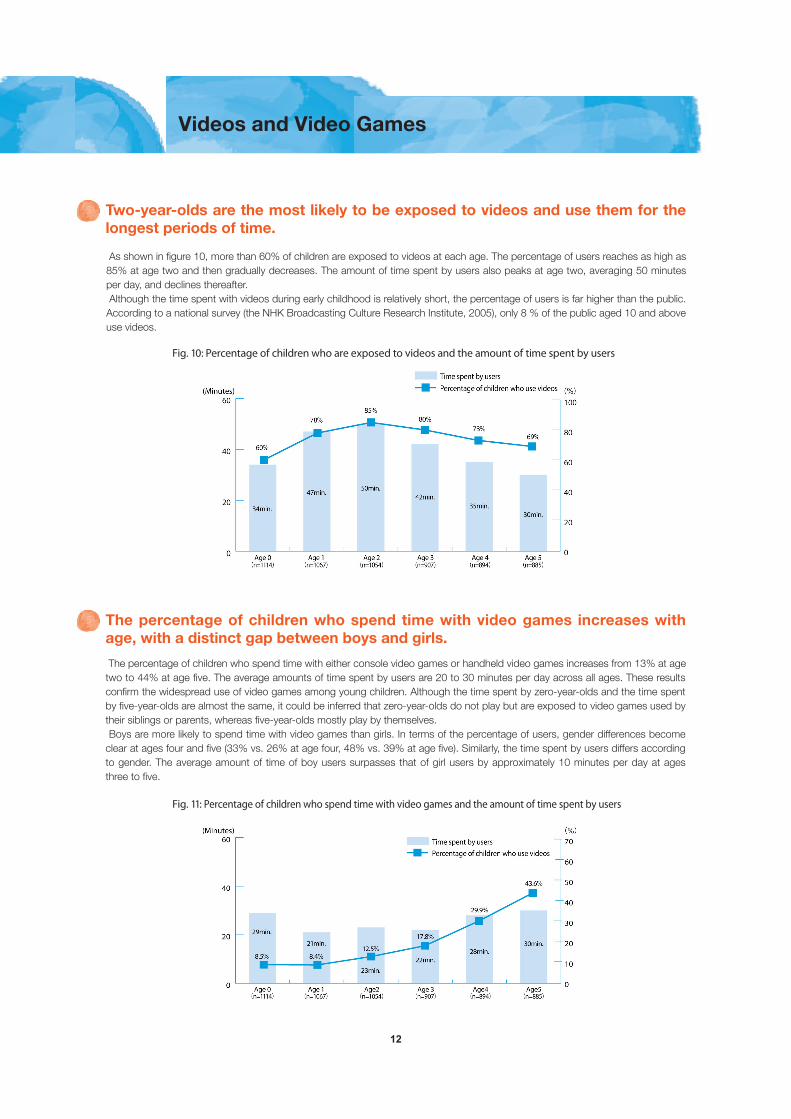
As shown in figure 10, more than 60% of children are exposed to videos at each age. The percentage of users reaches as high as 85% at age two and then gradually decreases. The amount of time spent by users also peaks at age two, averaging 50 minutes per day, and declines thereafter. Although the time spent with videos during early childhood is relatively short, the percentage of users is far higher than the public. According to a national survey (the NHK Broadcasting Culture Research Institute, 2005), only 8 % of the public aged 10 and above use videos.
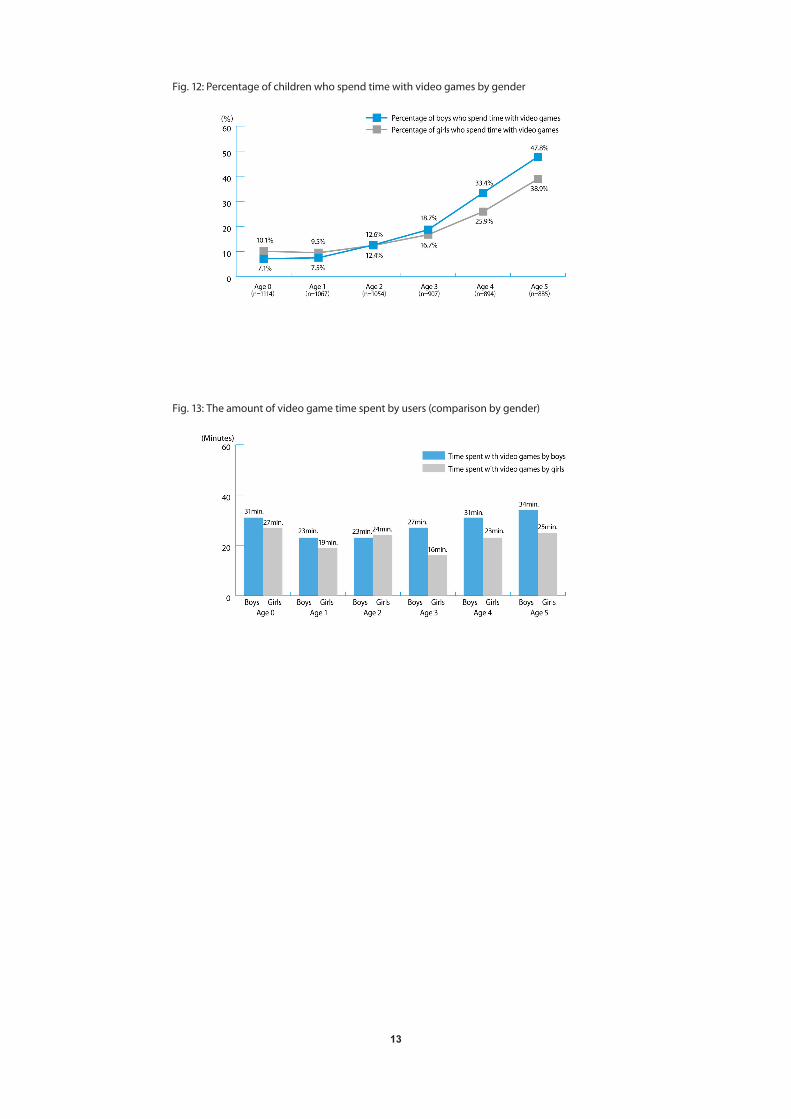
The percentage of children who spend time with either console video games or handheld video games increases from 13% at age two to 44% at age five. The average amounts of time spent by users are 20 to 30 minutes per day across all ages. These results confirm the widespread use of video games among young children. Although the time spent by zero-year-olds and the time spent by five-year-olds are almost the same, it could be inferred that zero-year-olds do not play but are exposed to video games used by their siblings or parents, whereas five-year-olds mostly play by themselves. Boys are more likely to spend time with video games than girls. In terms of the percentage of users, gender differences become clear at ages four and five (33% vs. 26% at age four, 48% vs. 39% at age five). Similarly, the time spent by users differs according to gender. The average amount of time of boy users surpasses that of girl users by approximately 10 minutes per day at ages three to five.
Two-year-olds are the most likely to be exposed to videos and use them for the longest periods of time.
The percentage of children who spend time with video games increases with age, with a distinct gap between boys and girls.
Videos and Video Games
Fig. 10: Percentage of children who are exposed to videos and the amount of time spent by users
Fig. 11: Percentage of children who spend time with video games and the amount of time spent by users
13
Fig. 12: Percentage of children who spend time with video games by gender
Fig. 13: The amount of video game time spent by users (comparison by gender)
Key Findings2
14
Television and the Lives of Preschoolers
The Home Media Environment● 99.8% of households with children under 1 had television sets, and more than 10% had
three or more sets.
● About 98% of households had video players; just under 80% had personal computers; about 50% had video games.
● About 10% of children had television sets in their own rooms.
Daily Activities and Media Exposure● Young children spent 1.2 to 2 times more on television than playing outdoors.
● Children spent just under 30 minutes per day on print media. The amount of time spent on picture books and other books was related to the amount of time spent to television.
Parental Filtering Behavior● As children grow, the amount of time parents spend watching television declines.
● The more parents spend time watching television, the more time children are exposed to television.
● Parents have positive and negative opinion about television viewing during infancy.
● Children whose parents believe television has a positive influence spend more time watching to television.
● Selective filtering of television program by parents becomes more frequent as children grow.
● Children with parents who filtered television program spent less time on television.
Mothers’ Child-rearing Stress● Through age three, when mothers had more positive view on child-rearing, children
spent less time in contact with television.
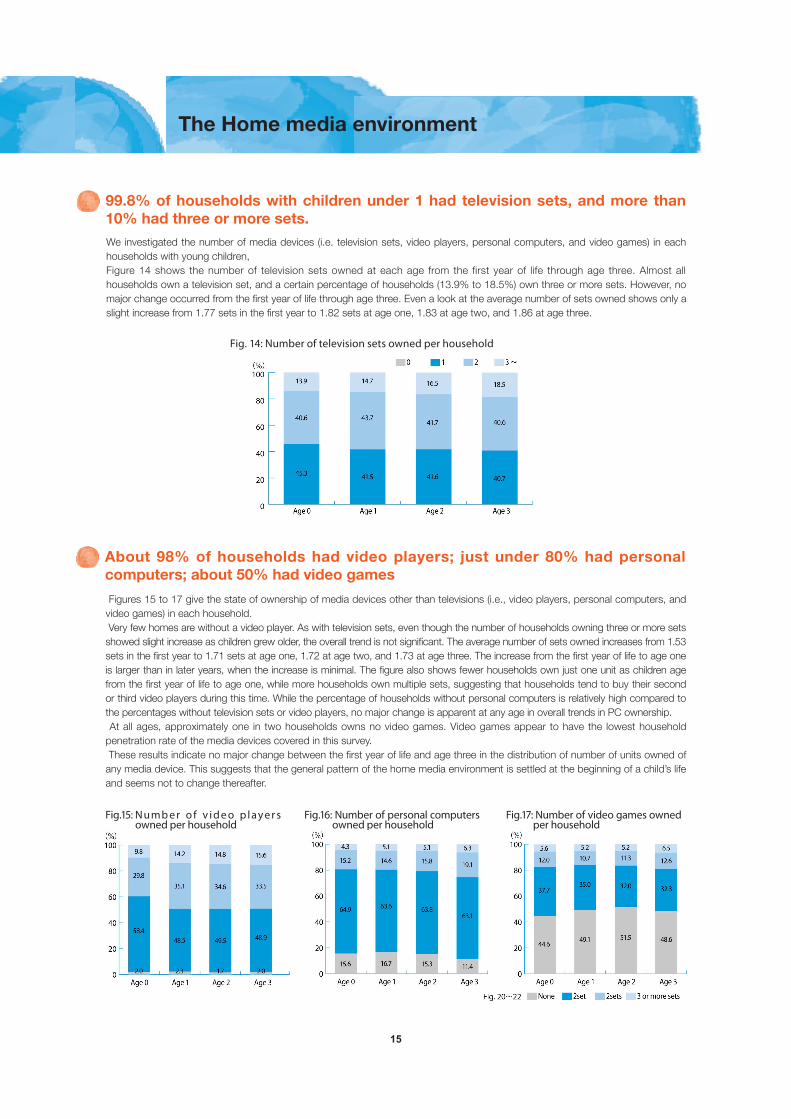
We investigated the number of media devices (i.e. television sets, video players, personal computers, and video games) in each households with young children,Figure 14 shows the number of television sets owned at each age from the first year of life through age three. Almost all households own a television set, and a certain percentage of households (13.9% to 18.5%) own three or more sets. However, no major change occurred from the first year of life through age three. Even a look at the average number of sets owned shows only a slight increase from 1.77 sets in the first year to 1.82 sets at age one, 1.83 at age two, and 1.86 at age three.
99.8% of households with children under 1 had television sets, and more than 10% had three or more sets.
Fig. 14: Number of television sets owned per household
Figures 15 to 17 give the state of ownership of media devices other than televisions (i.e., video players, personal computers, and video games) in each household. Very few homes are without a video player. As with television sets, even though the number of households owning three or more sets showed slight increase as children grew older, the overall trend is not significant. The average number of sets owned increases from 1.53 sets in the first year to 1.71 sets at age one, 1.72 at age two, and 1.73 at age three. The increase from the first year of life to age one is larger than in later years, when the increase is minimal. The figure also shows fewer households own just one unit as children age from the first year of life to age one, while more households own multiple sets, suggesting that households tend to buy their second or third video players during this time. While the percentage of households without personal computers is relatively high compared to the percentages without television sets or video players, no major change is apparent at any age in overall trends in PC ownership. At all ages, approximately one in two households owns no video games. Video games appear to have the lowest household penetration rate of the media devices covered in this survey. These results indicate no major change between the first year of life and age three in the distribution of number of units owned of any media device. This suggests that the general pattern of the home media environment is settled at the beginning of a child’s life and seems not to change thereafter.
About 98% of households had video players; just under 80% had personal computers; about 50% had video games
Fig.15: Numb e r o f v i d e o p lay e r s owned per household
Fig.17: Number of video games owned per household
Fig.16: Number of personal computers owned per household
15
The Home media environment

Fig.18: Television sets in children's rooms and time exposed to television
16
Table 2: Television sets in children's rooms
Table 3: Video players in children's rooms
Table 4: Videogames in children's rooms
Table 2 shows the percentages of children who had television sets in their own rooms.The results show that the percentage of children with televisions in their own rooms (table 2) is around 10% for all ages, significantly lower than the results of a survey in the United States, in which 30% of children aged three or younger have television sets in their own rooms (Kaiser Foundation, 2003). However, the results also show a slight increase in the percentage of children with television sets in their own rooms as they get older.Is there any relationship between children having television sets in their own rooms and the time they spend on television? Figure 18 compares time exposed to television between the subgroup of children divided by the ownership of television in their own rooms. Across all ages, while time exposed to television is relatively longer for children with television sets in their rooms, the difference between these two groups has decreased by age three (T4). It is expected to follow this relationship between children’s ownership and time spent on television, as children’s activities begin to extend beyond the home.Tables 3 and 4 give the percentages of children who have media devices other than television sets (e.g., video players or video games) in their own rooms. Across all ages, the percentage of children who have video players in their own rooms (table 3) is around 6 to 7%. The number of children with video games in their own rooms also increased gradually with age, from 2.1% in the first year of life to almost double that figure at 4.1% by age three. Reports indicate the percentage of children owning video games increases with age (Benesse Institute for the Child Sciences and Parenting, 2007), and we expect the percentage of children with video games in their own rooms will continue to increase as they grow up.
Sources: Benesse Institute for the Child Sciences and Parenting (2007). Dai san-kai kosodate seikatsu kihon chosa (shochuban) (“Third basic survey of child-rearing lifestyles [elementary and junior-high-school edition]”), preliminary reportKaiser Foundation (2003). Zero to Six: Electronic Media in the Lives of Infants, Toddlers and Preschoolers
About 10% of children had television sets in their own rooms..

Young children spend approximately 1.2 to 2 times more on television than the time they spend playing outdoors exposed to television.
17
Daily Activities and Media Exposure
A survey on time spent on various activities by young children through age six living in the Metropolitan area (NHK Broadcasting Culture Research Institute; Children’s Time Use Survey, 2003) indicates that free time at home, a figure obtained by subtracting time spent on necessary activities (sleeping, bathing, time for transportation) from 24 hours is roughly six hours in the first four years of life, but falls from five to four hours over ages four through six. An important perspective when discussing the impact of media on children’s development will likely be how this free time at home is allotted to activities involving screen media, such as television, videos, and video games within the various other activities (i.e., communication with parents, caregivers, and peers/friends, reading picture books, or playing outdoors), which are necessary for children’s development during early childhood. By using media-use diary, we measured the time children spent on screen media; playing outdoors at age one and above and time spent reading picture and other books at age two and above. Figure 19 shows the change in the average time spent each day age one through age five. Children spend approximately 90 minutes per day at age one playing outdoors, peaking at over two hours at age three. The time spent on outdoor activities starts to decreases at age four, when time in the home shortens as most children enter kindergarten or nursery school, falling to roughly 90 minutes at age five. Comparing this figure to the average time per day exposed to television (fig. 19), it became clear that children spent at least 1.2 to 2 times as long in rooms where the television was turned on than playing outside. By dividing children into subgroups with “high” (children who spend at least the average amount of time playing outdoors) and the “low” (children who spend less time than average playing outdoors), levels of time for outdoor activities, we examined the relationship between time spent on television and outdoor activities (fig. 20). , The results show that at age two and above, the time exposed to television is somewhat shorter for the “high” group than in the “low” group.
Fig.19: Average time spent each day playing outdoors and exposed to television
Fig. 20: Amount of time spent playing outdoors and television
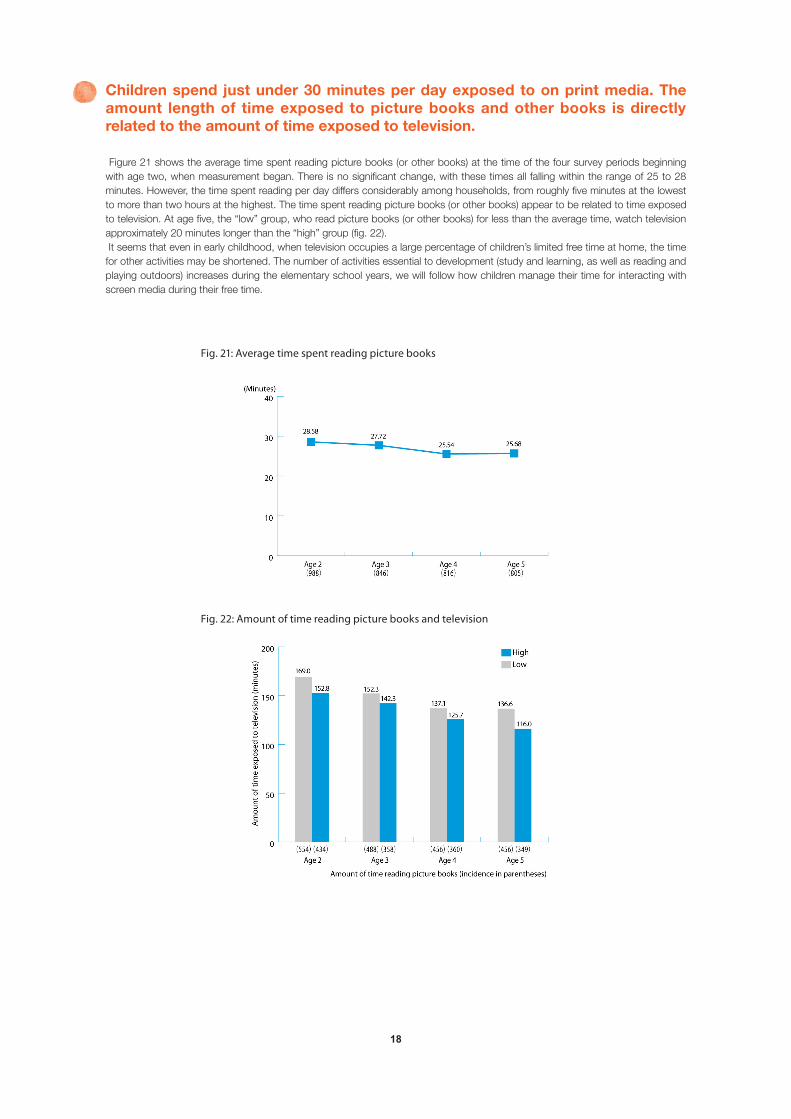
Figure 21 shows the average time spent reading picture books (or other books) at the time of the four survey periods beginning with age two, when measurement began. There is no significant change, with these times all falling within the range of 25 to 28 minutes. However, the time spent reading per day differs considerably among households, from roughly five minutes at the lowest to more than two hours at the highest. The time spent reading picture books (or other books) appear to be related to time exposed to television. At age five, the “low” group, who read picture books (or other books) for less than the average time, watch television approximately 20 minutes longer than the “high” group (fig. 22). It seems that even in early childhood, when television occupies a large percentage of children’s limited free time at home, the time for other activities may be shortened. The number of activities essential to development (study and learning, as well as reading and playing outdoors) increases during the elementary school years, we will follow how children manage their time for interacting with screen media during their free time.
Children spend just under 30 minutes per day exposed to on print media. The amount length of time exposed to picture books and other books is directly related to the amount of time exposed to television.
18
Fig. 21: Average time spent reading picture books
Fig. 22: Amount of time reading picture books and television

The fathers and mothers of children were asked how much time they spent watching television each day by using ten-point scale ranging from “do not watch television” to “eight or more hours.” Tables 5and 6 summarize the distribution of responses for each year from the child’s first year of life through age five. The tables show that among both fathers and mothers, for all children’s ages, many parents watch television “about two hours” per day. Table 6 shows that while 32.4% of mothers with children in the first year of life watch television for “about five hours” or more daily, this percentage gradually decreases at ages one and above, falling to 10.6% when children have reached age five. On the other hand, the percentage of respondents who answer they watch television less than “about one hour” per day increase from 14.4% when children were in the first year of life to 33.1% when children have reached the age of five. Table 5 shows similar trends for fathers, although not to the same degree as for mothers. As children grow, the number of parents spending long periods of time watching television tends to decrease, while that of watching for just brief periods tends to increase.
As children grow, the amount of time parents spend watching television declines.
Parental Filtering Behaviors
19
Table 5: Fathers' time watching television
Table 6: Mothers' time watching television

It is conceivable that during early childhood, children are often exposed to television while with their parents. If so, we would expect a close relationship between the time spent by parents watching television and time likewise spent by children. Figures 23 and 24 show how the time spent by children exposed to television changes over the years, depending on the length of time fathers and mothers spend watching television. The length of time parents spent watching television without doing any other activities was converted to a score of 0 through 10, with those giving the answer “do not watch television” assigned a score of 0 and those giving the answer “eight or more hours” assigned a score of 10. Parents whose scores are average or higher are grouped into the “high” group, while those with scores of less than average are grouped into the “low” group. Figure 23 shows that the amount of time children exposed to television decreases with age regardless of the length of time fathers spent watching television. In addition, the amount of time children exposed to television is higher among those whose fathers are in the high group than those with fathers in the low group at all ages. Figure 24 shows that for both groups of mothers, the amount of time children exposed to television follows a different course, from that of fathers; in other words, peaking at age one, then decreasing. However, as we saw with fathers, the amount of time children exposed to television is higher among those with mothers in the group spending more time with television than with mothers in the group spending less time with television across all ages. The difference in scores between the two groups is also larger than for the results for fathers. This suggests a relationship between the time parents spend with television and the time children spend exposed to television, and this is particularly marked for mothers.
Parents who watched television for longer times also tended to have children who spent more time exposed to television.
20
Fig. 23: Fathers' time watching television and children's time exposed to television
Fig. 24: Mothers' time watching television and children's time exposed to television

How television affects children’s development is a big concern for parents with young children. Table 7 shows the distribution of responses when fathers and mothers were asked to choose one from five options about descriptions their views on the effects of television on children, from “mostly negative” to “mostly positive.” The results show that for children at all ages, 30 to 40 percents of parents think that the influence of television is positive, i.e., “ mostly positive”, “more positive than negative”, and those who think negative (“mostly negative” and “more negative than positive”) is 10 to 20 percent. Those who answered “not sure” was 30 to 40 percent up to age four, but this percentage increases to 50% at age five. The percentage of mothers who answer “not sure” consistently occupies the largest proportion. These results suggest that parents have positive and negative opinion about television viewing during infancy.
Figures 25 and 26 show how the amount of time children spend with television changes over the years depending on fathers’ and mothers’ attitude toward the effects of television. Parental attitude on the effects of television are grouped as follows: those responding that the influence of television is “mostly negative” or “more negative than positive” are grouped into the negative group, while those responding that the influence of television is “mostly positive” or “more positive than negative” are grouped into the positive group. Both figures show that for both fathers and mothers, the time children spend on television peaks at age one, then follows a downward course. Across all ages, children whose parents have positive attitude toward the effects of television spend more time exposed to television than those whose parents have negative attitude.
Parents have positive and negative opinion about television viewing infancy.
Children whose parents believe television has a positive influence spend more time on television.
21
Table 7: Parental attitude toward the e�ect of television
Fig. 25: Fathers' attitude toward the e�ects of television and children' s time exposed to television
Fig. 26: Mothers' attitude toward the e�ects of television and children' s time exposed to television

Parental involvement in children’s exposure to television is called filtering behavior. Watching television together with children or discussing the content of television programs with them is known as “shared filtering,” while regulation of children’s viewing (time and contents) the way children watch television and the programs they watch is known as “selective filtering.” In this survey, parents were asked to respond to two questions on shared filtering and four questions on selective filtering (shown in table 7) by selecting from five options: “agree” (five points), “somewhat agree” (four points), “neither agree or disagree” (three points), “somewhat disagree” (two points), and “disagree” (one point). Table 8 summarizes how the distributions of fathers and mothers into the “yes” group, whose answer are “true” or “somewhat true,” and the “no” group, whose answer are “somewhat false” or “false,” change as children grow. First, the results show that the number of fathers who frequently watch television with their children increases at age one, while the number who discuss the content of television programs with their children increases at age two, with each of these results remaining largely unchanged in subsequent years. On the other hand, the number of mothers who frequently watch television with their children peaked at age one, while the number who discuss the content of television programs with their children peaks at age two, with the number of mothers giving each of these answers exhibiting a slow decline over subsequent years. Figure 27 shows changes in average of total scores for two shared-filtering items (with a minimum total score of 1 and a maximum of 5 with children’s ages. As seen in this graph, while the score for mothers began to decrease after age two, the score for fathers increased at age two, then remained at that elevated level, with scores for both gradually drawing closer together.Results for the four selective-filtering items show that for both mothers and fathers, the increase in numbers of parents giving these answers is relatively significant from the first year of life through age two, followed by a gentle upward trend. Figure 28 is shows changes in the average total scores for these four selective-filtering items (with a minimum total score of 1 and a maximum of 5 with children’s ages. While this graph also shows a relatively large increase through age two followed by a gentle upward trend, mothers’ scores remained higher than those of the fathers at all points in time.
Selective filtering of television program by parents becomes more frequent as children grow.
22
Table 8: Changes in �ltering behavior of television programs by fathers and mothers
Fig. 27: Changes in fathers' and mothers' shared �ltering Fig. 28: Changes in program selective �ltering by fathers and mothers

Parental selective filtering constitutes regulation of time children spend on television by keeping this time as short as possible. Table 7 shows that a relatively high proportion of parents use this filtering when children are in the first year of life, keeping children from watching programs with content they do not want their children to see (41.2% of mothers and 24.3% of fathers) or turning off the television during meals (37.8% of mothers and 25.9% of fathers). But does selective filtering by parents change the amount of time children spend on television? Figures 29 and 30 show how the amount of time children spend on television changes over the years, depending on the level of parental selective filtering. As above, we categorized the level of parental selective filtering activities by calculating average total scores for the four relevant selective-filtering items and grouping parents whose scores are average or higher into the “high” group and those with scores of less than average into the “low” group. These two figures shows that across all ages and for both fathers and mothers, children of parents in the high filtering behavior group spend less time on television than those of parents in the low filtering behavior group. The difference between these two groups is already apparent from age one, when the amount of time children spends on television peaks. In general, the apparent difference is roughly in the range of 40 to 50 minutes. These results indicate that throughout the early childhood years, the time parents spend with television, their attitude toward the effects of television, and their filtering behaviors may be linked to the time children spend on television. At the same time, as suggested by the fact that the number of parents watching television for long periods of time decreases, while the number of parents watching television for short periods of time increases, and parental attitude toward the effects of television changes at age two, when children’s vocabulary increase drastically, parental attitudes toward television also appear to change along with the development of their children. In the future, there may be a need for more careful consideration of what causal relationships may exist between parental attitudes toward television and their filtering behaviors and the amount of time children spend on television, focusing on children’s activities and their language development.
Children with parents who filtered television program spend relatively less time on television.
Fig. 29: Fathers' �ltering behaviors (selective) and the amount of time children are exposed to television
Fig.30: Mothers' �ltering behaviors (selective) and the amount of time children are exposed to television
23

24
Is there any relationship between mothers’ parenting stress and the amount of time children spend on television? In this survey, the parenting stress is categorized into positive feelings about raising children (“positive attitudes toward childrearing” hereinafter) and negative feelings about raising children (“negative attitudes toward childrearing” hereinafter). Positive attitudes toward childrearing are calculated by adding the responses (choosing from five levels) to the following three statements: “I feel fulfilled,” “Every day is a new experience for me,” and “I feel more confident.” The minimum score is 3 points and the maximum score 15 points, and a higher score indicates a higher level of positive attitudes toward childrearing. Negative attitudes toward childrearing are calculated by adding the responses to the following three statements: “I do not have enough time,” “I cannot do the things I want to do,” and “I do not have any time to take breaks.” The minimum score is 3 points and the maximum score 15 points. Higher scores indicate stronger negative attitudes toward childrearing. Figure 31 indicates changes in these scores as children age from the first year of life through age five. While at every age positive attitudes exceed negative attitudes, the difference between these two scores is at its lowest at age two. Positive attitudes toward childrearing are highest from birth through age one, decline somewhat at age two, then remain largely unchanged in subsequent years. Although negative attitudes toward childrearing are strongest from birth through age two, it continues to decrease from age three. It appears that while mothers feel strongly the newness, the freshness, and the sense of fulfillment being mothers soon after the child is born (from birth through age one), they are also vulnerable to stress due to their limited time and activities during this time. The positive attitude of mothers toward childrearing declines around age two, as children become strongly self-assertive, while negative maternal attitudes toward childrearing decline from age three, since this is when children become better able to care for themselves and spend more time outside the home at kindergarten or elsewhere, reducing maternal burdens. Figure 32 examines the relationship between positive attitudes toward childrearing, with respondents whose scores are higher than average grouped into the “high” group and those with scores of less than average into the “low” group, and the amount of time children exposed to television. From the first year of life through age three, children whose mothers are in the group with low positive attitudes toward childrearing group spend more time exposed to television than those whose mothers are in the group with high positive attitudes toward childrearing group. At age four and above, no relation is apparent between positive maternal attitudes toward childrearing and the amount of time children spent exposed to television.
Through age three, when mothers had more positive view on childrearing, children spent less time in contact with television.
Child-rearing stress on mothers
Fig. 31: Changes over the years in positive and negative maternal attitudes toward childrearing
Fig. 32: Positive maternal attitudes toward childrearing and the amount of time children are exposed to television

Next, figure 33 examines the relationship between negative attitudes toward childrearing, with respondents whose scores are higher than average grouped into the “high” group and those with scores of less than average into the “low” group, and the amount of time children exposed to television. In contrast to positive attitudes toward childrearing, no relation is apparent between levels of negative maternal attitudes toward childrearing and the amount of time children spent exposed to television at any age from the first year of life through age five. From the results above, we can safely say that from the first year of life through age three, children whose mothers feel generally positive toward childrearing spend less time exposed to television. On the other hand, there is no relationship between a mother’s negative attitudes toward childrearing and the amount of time her children spend on television. While no causal relationship can be identified from these results, they suggest that a mother who feels positive toward child-rearing may encourage her children to spend less time on television. There may be a need for more careful examination of the mechanism by which the parenting stress influences the amount of time children exposed to television, taking into account various related factors (such as playing outdoors, reading picture books, and parental filtering behaviors).
25
Fig. 33: Negative maternal attitudes toward childrearing and the amount of time children are exposed to television

26
Overview of “Better Broadcasting for Children” Project
Objectives of “Better Broadcasting for Children” Project
The NHK Broadcasting Culture Research Institute launched “Better Broadcasting for Children” Project
in November 2001. At that time, there was increased concern about the widespread use of screen
media including television, videos, and video games among children and the effect of exposure to
such screen media on their mental/physical development not just in Japan but around the world.
However, methodologically valid and reliable research seemed scarce focusing on children’s exposure
to screen media and its impact on their development at the time. For this reason, this project began
with the goal of clarifying the relationship between media exposure and children’s mental/physical
development based on scientific surveys.
Research hypotheses
At the start of the project, the team of researchers and the NHK Broadcasting Culture Research
Institute discussed and determined various specifics, including the research framework, hypotheses,
and survey design. The research hypotheses are listed below (see Figure 1).
(1) The contents and amount of exposure to screen media may influence children’s physical
growth, cognitive development, social development, and formation of belief systems.
(2) The influences of media exposure on children may vary in direction (positive or negative) and
magnitude depending on how (and with whom) they use those screen media.
(3) The influences of media exposure on children may vary in magnitude depending on
their family background and living environment. Children’s family background and living
environment may also affect the contents and amount of children’s media exposure and how
(and with whom) they use those screen media.
Fig. 34: Conceptual model for survey design

27
Survey design
After about a year of preparation, the first survey was conducted in January 2003.
This study is a twelve year follow-up study whose participants are about 1,000 children born in 2002.
The purpose of the follow-up study is to explore the relationship between screen media exposure and
child development through yearly surveys. We have finished the phase 8 survey in 2010. As shown
in Figure 35, we also carried out the pilot study from 2003 to 2005, along with the long-term follow-
up study. The purpose of the pilot study was to collect data from older children and to reexamine the
design of later surveys of the follow-up study. In the pilot study, four separate surveys were developed
and annually administered to four different age groups (3 years, 6 years, 9 years, and 12 years of age
in 2003) for three years. Each age group was comprised of about 100 participants.
Future directions
Children in the follow-up study are now (2010) in second grade in elementary school. They currently
enjoy not only television but also videos/DVDs and video games and will soon become active users
of mobile phones and the Internet. We will continue to follow their multi-media usage and its influence
on their development and explore the media environment and broadcasting which are beneficial for
children’s healthy development.
Fig. 35: Survey design
About 100 subjectsAge12
Subgroup Survey(implemented 2003-2005)
Longitudinal Cohort Study
Age9
Age6
Age3
Age0
Age13
Age10
Age7
Age4
Age1
2003 2004 20052006 2007 2008
2009 2010Age2
Age14
Age11
Age8
Age5
Age3
Age4
Age5
Age6
Age7
About 100 subjects
About 100 subjects
About 100 subjects
About 1,000 subjects


