EU agricultural production and trade: Can more efficiency prevent increasing ‘land-grabbing’ outside of Europe? Research Report* Harald von Witzke (Humboldt University Berlin) Steffen Noleppa (agripol – network for policy advice GbR) * This research has benefited from the contributions and sponsorship of Bayer CropScience and Syngenta.
Transcript
EU agricultural production and trade:
Can more efficiency prevent increasing
‘land-grabbing’ outside of Europe?
Research Report*
Harald von Witzke
(Humboldt University Berlin)
Steffen Noleppa
(agripol – network for policy advice GbR)
* This research has benefited from the contributions and sponsorship of Bayer CropScience and Syngenta.
ii
Can more efficiency prevent increasing ‘land-grabbing’ outside of Europe?
List of Content
1. Problem setting and objective of the analysis 1
2. Theoretical framework and methodological considerations 2
3. International agricultural trade of the EU 6
4. Conversion of agricultural into land trade 12
5. EU virtual land trade under technology and policy change 14
6. Conclusions 17
List of references 19
Annex 23
iii
Can more efficiency prevent increasing ‘land-grabbing’ outside of Europe?
List of Figures
Figure 1: Leading agricultural commodity exporters and importers by value, 2008 (in billion USD) 6
Figure 2: Agricultural export and import quantities, EU-27, 1999-2008 (in million tons) 7
Figure 3: Net trade quantities, EU-27, 1999-2008 (in million tons) 7
Figure 4: Agricultural exports and imports of the EU-15 and EU-27 in 2004 (in million tons) 9
Figure 5: Agricultural exports, imports and net trade for key commodities, EU-27 (in million tons) 11
Figure 6: EU arable land virtually traded (in million ha) 13
Figure 7: Composition of the land exports and imports and resulting net land trade of the EU, 2007/2008 (in million ha) 14
Figure 8: Net land imports of the EU under changing technologies and policies (in million ha) 16
Figure 9: The ‘golden’ triangle of productivity growth 18
iv
Can more efficiency prevent increasing ‘land-grabbing’ outside of Europe?
List of Abbreviations
BMELV Bundesministerium für Ernährung, Landwirtschaft und Verbraucherschutz
CAP Common Agricultural Policy
EC European Commission
EU European Union
FAO Food and Agriculture Organization (of the United Nations)
FAPRI Food and Agricultural Policy Research Institute
LEL Landesanstalt für Entwicklung der Landwirtschaft und der Ländlichen Räume
LfL Bayerische Landesanstalt für Landwirtschaft
OECD Organization for Economic Co-operation and Development
SITC Standard International Trade Classification
USDA United States Department of Agriculture
WTO World Trade Organization
1
Can more efficiency prevent increasing ‘land-grabbing’ outside of Europe?
1. PROBLEM SETTING AND OBJECTIVE OF THE ANALYSIS
The economic environment in which farmers in the European Union (EU) have to make their investment and production decisions has changed quite dramatically in past decades and especially in recent years. Key drivers of this change are numerous. Major drivers, however, are the following:
The European Union has grown to 27 member states, representing more than 500 million consumers (LANZIERI, 2009) to be nourished by just 9 million people working full-time in agriculture (EUROSTAT, 2009).
Beginning in the 1990s the European Union has embarked on a con-tinuing reform process of its Common Agricultural Policy (CAP) which has resulted in more liberal agricultural markets and will con-tinue to do so in the future.
The reform process has been guided also by World Trade Organiza-tion (WTO) negotiations. As a result, in many key commodities farmers now produce for the market rather than for the govern-ment.
Globalization of the world economy has not bypassed agriculture. To the contrary, international trade has grown rapidly and has led to an international interdependence of national agricultural and trade poli-cies.
The production of crops for bio-energy was virtually nonexistent in the European Union some 20 years ago. It has grown rapidly since then and constitutes a significant portion of farming activities (e.g. BANSE et al., 2008; SCARLAT et al., 2008 OECD and FAO, 2009).
In addition, the long term trend of declining world market prices has come to an end. With the turn of the millennium, agricultural com-modity prices have tended to increase - albeit with significant fluc-tuations as in the past, as global demand growth has outstripped the growth in supply (VON WITZKE et al. 2008; 2009).
Public agricultural research investments have declined and acted to reduce productivity growth over the past 20 years (PARDEY et al, 2007; PARDEY, 2009).
On balance, these changes resulted in the European Union becoming one of the largest agricultural commodity trading regions in terms of value and volume, a fact that is not too surprising since international agricultural trade has grown rapidly over the last few decades and trade expansion is expected to continue (e.g. AKSOY and BEGHIN, 2005; USDA, 2010). This includes agricultural trade by the European Union (e.g. WTO, 2009).
Another major change is the fact that the European Union has evolved into the single most important importer of agricultural commodities and food (EUROSTAT, 2010b).
Obviously, agricultural commodities do not fall from heaven like manna. Rather they are produced using a variety of inputs. When goods are traded internationally, it is as if the inputs which have been used in their
Key drivers of EU agriculture ...
... have resulted in an increasing trade
2
Can more efficiency prevent increasing ‘land-grabbing’ outside of Europe?
production are traded as well. That is, international trade in goods re-sults in a ‘virtual’ trade of inputs as well. Natural resources including agricultural land and water represent essential inputs in the production of agricultural commodities and other goods. In recent years it has be-come obvious that natural resources play an ever more important role, accounting for about one fourth of the value of world merchandise trade (RUTA, 2010).
While the virtual trade in water has gained some attention both in re-search and the public debate of the consequences of globalization (see, e.g., HOEKSTRA, 2003; CHAPAGAIN et al., 2006), the virtual trade in agri-cultural land has not yet received much attention. Only few studies have looked at the ‘land footprint’ of agriculture (e.g., STEGER, 2005; WÜRTEN-
BERGER et al., 2006; BURKE at al., 2008; VAN SLEEN, 2009). Usually, they have been limited to selected goods and regions.
As the European Union now has emerged as the world’s largest im-porter of agricultural commodities (see chapter 3), it is reasonable to assume that the European Union now is a major importer of virtual ag-ricultural land.
The overall objective of this study is to quantify how much ‘virtual’ (ALLAN, 1993; 1994) land the European Union is using in third countries. More specifically, this study will provide answers to the following two questions:
How much virtual land is used outside the European Union for agri-cultural purposes and how has the virtual land use of the European Union changed over time?
How much virtual land would the European Union use under alterna-tive scenarios focussing on changes in policies and technologies?
This report is organised as follows:
First, theoretical and methodological considerations regarding virtual land trade will be discussed (chapter 2).
Second, agricultural trade flows of the European Union and their changes over time will be presented (chapter 3).
Third, the virtual trade in agricultural land of the European Union is quantified under several alternative scenarios (chapter 4 and chap-ter 5).
The paper concludes with some implications of the findings for vir-tual land trade as well as agricultural and research policy (chap-ter 6).
2. THEORETICAL FRAMEWORK AND METHODOLOGICAL CONSIDERATIONS
The concept of virtual inputs was initially developed by ALLAN (1993; 1994) for water. His basic idea is as follows: Essentially, any good being produced requires water. The water used in the production of a good is considered virtual water. When a good is traded internationally the vir-tual water is traded simultaneously (e.g. HOEKSTRA, 2003; HOEKSTRA and HUNG, 2003).
Analysing trade of inputs such as land
Objective of the study
Structure of the report
3
Can more efficiency prevent increasing ‘land-grabbing’ outside of Europe?
Here we modify this concept so it can be applied to land in agricultural commodity production. By analogy, we define virtual land as the amount of land that is required to produce one unit of a given agricultural good. For instance, if it takes ‘X’ hectares of land to produce one metric ton of wheat, then ‘X’ is the number of hectares of virtual land contained in one metric ton of wheat, and exporting one metric ton of wheat from one country to another is equivalent to the export of ‘X’ hectares of vir-tual land. In essence, the import of agricultural goods adds land to the domestic resource base, while the export acts to reduce it.
Much like other resources, land suitable for the production of agricultural commodities is unevenly distributed around the globe. As there is no strong correlation between the availability of land and other resources in a nation and its food needs, international agricultural trade is an impor-tant means by which food is moved from where it is abundant to where it is scarce.
The standard model of international trade theory stipulates that com-parative cost and, thus, price advantage is the key determinant of inter-national trade in goods. A country is an exporter of a good which it manages to produce at relatively lower cost than others and an importer of goods which it produces at higher cost than others.
The Heckscher-Ohlin model of international trade (e.g., LEAMER, 1995) is based entirely on relative differences in factor endowments, and thus differences in factor prices, as causes of differences in comparative cost advantage and disadvantage between countries. A country which is characterised by a relative abundance of a production factor is charac-terised by a relative low price for this input. Therefore, it has a com-parative advantage in the production of goods which require relatively much of this production factor, all other things being equal. For in-stance, a country with a relative abundance of capital and scarcity of labour will be an exporter of capital intensive goods while importing la-bour intensive goods.
An application of the Heckscher-Ohlin model to agricultural commodity trade would suggest that a country with a relative abundance of farm land would be an exporter of land intensive crops such as wheat, corn or soybeans all other things being equal.
If the assumptions of the standard trade model of neoclassical econom-ics are met, the concept of virtual trade in land, water or other re-sources would not contain information that goes beyond what is known from the Heckscher-Ohlin model. It would just be a different way of il-lustrating it.
However, things are different when one or more of the assumptions of the standard model of neoclassical trade theory are violated. In the real world, this is often the case, as government market intervention in agri-culture continues to be pervasive around the globe leading to a multi-tude of distortions of economic incentives and international trade flows because countries do not specialise in the production of goods for which they have comparative advantage (e.g. TYERS and ANDERSON, 1992; ANDERSON, 2009; 2010; ANDERSON et al., 2010).
In addition, the existence of externalities acts to result in trade flows which do not reflect the true comparative advantages of countries. In essence, an economic externality is an unintended effect of an economic
Concept of virtual land trade
The standard trade model
Violations and externalities
4
Can more efficiency prevent increasing ‘land-grabbing’ outside of Europe?
activity on a bystander. Externalities can be positive or negative. They may occur in production as well as in consumption. In the case of a negative externality in production, there are costs caused by the pro-duction of a good which are not borne by the producer. This is the pri-vate marginal cost of production, which determines the supply, is below the social marginal cost. As the producer does not bear the full cost, factor input and production are higher than socially optimal.
Externalities and market distortions are of relevance for the purpose of this paper. To take an example: The rapidly growing world food needs could be met by expanding the acreage in the European Union or else-where or by increasing the productivity of the land being farmed al-ready. The expansion of the acreage, however results in costs to society which the tiller of this land does not have to pay for. The reason for this is that deforestation or the conversion of grassland into cropland results in large emission of greenhouse gases which, in turn, result in large costs to society (e. g. STERN, 2006). In fact, these types of agricultural land use changes result in 18 percent of the man made part of global warming and contribute more to global warming than manufacturing or transportation (VON WITZKE et al., 2008).
The conversion of agricultural trade into land trade is a rather complex issue. In principle, there are different approaches to quantifying virtual land use (e. g. WÜRTENBERGER et al., 2006). In this paper we use what we refer to as an indicator approach.
Starting point of the analysis are international agricultural trade flows. Available trade statistics are based on internationally agreed upon classification of commodities. The Standard International Trade Classification (SITC) is the most widely used classification in trade analysis. The SITC is based on the degree of processing. Although goods produced from identical raw materials may end up in different classifications they can be attributed to their raw mate-rial, again. In addition, SITC is time proven in international trade analysis (XIMING and FUKAO, 2010). Therefore, it will be used here.
In our analysis of international agricultural trade we include not only SITC0 (Food and live animals) and SITC1 (Beverages and tobacco) – as it is often the case (e.g. EUROSTAT, 2010b) – but additionally SITC22 (Oil-seeds and oleaginous fruits), SITC263 (Cotton), SITC268 (Wool), as well as SITC4 (Animal and vegetable oils, fats and waxes).
For SITC0, SITC1, SITC22, SITC263, SITC268, and SITC4, export and import data in terms of value and volume were generated from EUROSTAT (2010a). Data for EU-27 are available for the years 1999-2008. Hence, this time period is covered here.
The calculations of virtual land trade developments are based on average data for 1999/2000 and 2007/2008. Weighted averages are used in order to avoid distortions in results caused by annual fluc-tuations.
Trade volumes were converted into tradable agricultural raw prod-ucts; and the resulting volume was related to regional yields in or-der to compute land used for exports and imports. Excluded from this analysis were tradable products which cannot be associated (a) to the use of land, i.e. fish and water, and (b) to a specific agri-
Application of an indicator-based methodology
5
Can more efficiency prevent increasing ‘land-grabbing’ outside of Europe?
cultural raw product, i.e. products summarised in SITC categories ‘others’, ‘confidential’ and ‘miscellaneous’.
Some very particular products such as spices were also excluded because of data and resource limitations. The products not included in this analysis have accounted for roughly 20 percent of EU-27’s agricultural trade in 2007/2008.
Finally, 240 categories of tradable products are included into our analysis. This represents 50 percent more of what has been included in other recent studies. STEGER (2005), e.g., has analysed 149 trad-able products for the EU-15 and the year 2000 while VAN SLEEN (2009) has included 150 products for the EU-27 and the year 2005.
The analysis of land use associated with agricultural trade is straightforward for unprocessed crops. In this case, only specific yields have to be known for proper conversion. Detailed information on yield can be found in EUROSTAT (2009), FAPRI (2010) and FAO (2010), e.g.
The calculations are more complex for livestock based commodities, and for processed agricultural products, such as flour, macaroni or oilcakes.
Meat and dairy products were converted into crops using feed ratios and feed mix percentages. Our calculations are mainly based on conversion rates provided by SULLIVAN et al. (1992). They have been updated in order to account for increased feeding efficiency and im-proved feeding technologies.
Processed products have been converted into agricultural raw prod-ucts using a rather broad spectrum of processing parameters. Nu-merous weights, measures and conversion factors had to be com-bined, based on FAO (2001) and USDA (1992). They have been up-dated using additional data sources such as STEGER (2005), BELIZT et al. (2008), SCHÖFFL (2008), and VAN SLEEN 2009).
A particular issue arises because agricultural raw materials may be processed into goods which end up in different SITC. An example is oilseeds which usually are processed into oil cake and oil. Butter, cheese and dry milk have to be converted to liquid milk equivalents. Approaches on dealing with coupled products and information on crushing factors were used to avoid double counting of hectares (e.g., SULLIVAN et al., 1992; FAO, 2001; VAN DAM and ELBERSEN, 2004).
Thus, it was possible to ‘translate’ traded goods into more than 40 crops such as wheat, corn, coarse grains (mainly consisting of bar-ley, rye, oats, grain sorghum, and millet), rice, soybeans, palm fruits and nine other oilseeds, oleaginous fruits, sugar beet and sugar cane, coffee, cocoa, tea and tobacco, potatoes as well as ad-ditional 20 fruits and vegetables.
240 categories of tradable products covered
Finally, more than 40 crops covered
6
Can more efficiency prevent increasing ‘land-grabbing’ outside of Europe?
3. INTERNATIONAL AGRICULTURAL TRADE OF THE EU
The EU continues to be one of the world’s largest agricultural commodity exporting and importing countries. This is depicted in figure 1.
Figure 1: Leading agricultural commodity exporters and importers by value, 2008 (in billion USD)
Exporters Importers
Country Value Country Value
United States 134.0 Extra EU-27 173.1
Extra EU-27 127.6 United States 115.9
Brazil 61.4 China 86.8
Canada 54.1 Japan 80.6
China 42.3 Russia 34.3
Source: Own figure based on WTO (2009).
As is evident, the EU is now the world’s single largest agricultural im-porter even when intra-EU trade is excluded, while it is second only to the United States in exports. In total, net imports of the EU-27 amounted to 45.5 billion USD in 2008.
Amid the many changes the European Union has gone through during the last decade or so, it is not all too surprising to find that her interna-tional agricultural trade patterns have changed significantly as well. Fig-ure 2 depicts the changes in EU-extra import and export quantities be-tween 1999 and 2008:
The volume of agricultural imports has always exceeded exports during the time period considered.
Including SITC22, SITC263, SITC268 and SITC4 in addition to SITC0 and SITC1 does not increase the export volume by much. However, it acts to increase the volume of imports by about 30 mil-lion metric tons. To a large extent this reflects the fact that the European Union is the world’s second most important importer of oilseeds.
Total agricultural exports in terms of volume have slightly decreased over time.
Total agricultural imports, however, have grown considerably from almost 107 million metric tons around the turn of the millennium to more than 132 million metric tons in 2008 which represents an in-crease of 24 percent
The resulting net trade position in terms of quantity is presented with figure 3. It combines the information of figure 2 in that it exhibits the agricultural net exports of the EU-27. As is obvious, the European Union continues to be a major net importer of agricultural commodities. In fact, the net import quantities can be considered impressive and almost doubled during the time period analysed here.
EU is a large world agricultural trader
EU is an impressive net importer of agricultural goods
7
Can more efficiency prevent increasing ‘land-grabbing’ outside of Europe?
Figure 2: Agricultural export and import quantities, EU-27, 1999-2008 (in million tons)
Source: Own figure based on EUROSTAT (2010a, b).
Figure 3: Net trade quantities, EU-27, 1999-2008 (in million tons)
Source: Own figure based on EUROSTAT (2010a, b).
-80
-60
-40
-20
0
1999 2000 2001 2002 2003 2004 2005 2006 2007 2008
Official agricultural trade Total agricultural trade
Official agricultural trade (SITC0 and SITC1)
Total agricultural trade (SITC0, SITC1, SITC22+263+266, and SITC4)
0
20
40
60
80
100
120
1999 2000 2001 2002 2003 2004 2005 2006 2007 2008
Exports Imports
020406080
100120140
1999 2000 2001 2002 2003 2004 2005 2006 2007 2008
Exports Imports
8
Can more efficiency prevent increasing ‘land-grabbing’ outside of Europe?
More details and additional information on international agricultural trade of the EU-27 is provided with Annex A. Agricultural exports and imports as well as the net trade position of the European Union are in terms of value. It becomes obvious that the net trade position of the EU-27 can be characterised similarly in terms of value with one exception: Contrary to volume, agricultural export values increased slightly during the past decade.
The recent increase in agricultural export values of the European Union in part has been the result of international agricultural market develop-ments since the turn of the millennium. The long-term trend in world market prices during which farmers around the world have produced ever more food for ever more humans at ever declining prices has come to an end. Since the turn of the millennium, agricultural commodity prices have tended to increase albeit with significant fluctuations as in the past.
The reason for the upward trend in international agricultural commodity prices is that global demand growth has outstripped the growth in sup-ply:
Demand growth is driven by a continued rapid population growth and increasing per capita food consumption in developing and newly industrialising countries.
Food supply growth, however, cannot keep pace with the growth in demand for a variety of reasons including increasing global scarci-ties in resources for food production (including land, water and energy) as well as a general neglect of agriculture and its infrastruc-ture in many parts of the world (VON WITZKE et al. 2008; 2009).
The latter includes declining investment in public agricultural re-search (PARDEY, 2009) which is aggravated by a regulatory environ-ment in many countries which discourages agricultural innovation.
Besides those market developments additional driving factors deter-mined agricultural trade of the European Union after the turn of the millennium:
The reform process of the CAP certainly has had an impact on the agricultural net trade position of the European Union. Domestic price supports have been reduced significantly or they have been discon-tinued altogether. Export subsidies and import duties have been reduced as well.
Direct payments have increasingly become decoupled from actual production. While the decoupled payments continue to show signifi-cant production effects (VON WITZKE et al., 2010) the incentives to produce have declined as a consequence of policy reform and modu-lation.
The mandatory set aside requirement has been discontinued re-cently. While this will most likely increase production, its effects will not begin to show up until 2009/10, i.e. post the time period considered here.
The ‘Everything But Arms’ agreement which permits unrestricted European Union market access for the least developed countries probably also contributed to the growth in net imports.
Recent market developments determine trade
Additional trade determinants
9
Can more efficiency prevent increasing ‘land-grabbing’ outside of Europe?
In addition the European Union made further concessions in the WTO negotiation which have led to lower import barriers on many agricultural markets.
The increasing value of the EUR against the USD during the time period considered here acted to make European Union exports more and foreign imports into the European Union less expensive.
With increasing income consumers’ demand in the European Union has shifted more towards ‘food away from home’ as well as more processed and prepared foods both of which are often considered to result in an increasing use of agricultural commodities for a given number of consumer calories.
During the time period covered here the European Union grew in mem-bers from 15 to 27 member states. Enlargement, however, should not be considered a key driving force with respect to recent agricultural trade developments. Figure 4 depicts agricultural EU-extra exports and imports of the EU-15 respectively EU-27 in 2004, the year when ten new member states joined the European Union. It becomes obvious that the numbers are similar indicating that self sufficiency was rather high in the new member states before accession.
Figure 4: Agricultural exports and imports of the EU-15 and EU-27 in 2004 (in million tons)
Source: Own figure based on EUROSTAT (2010a, b).
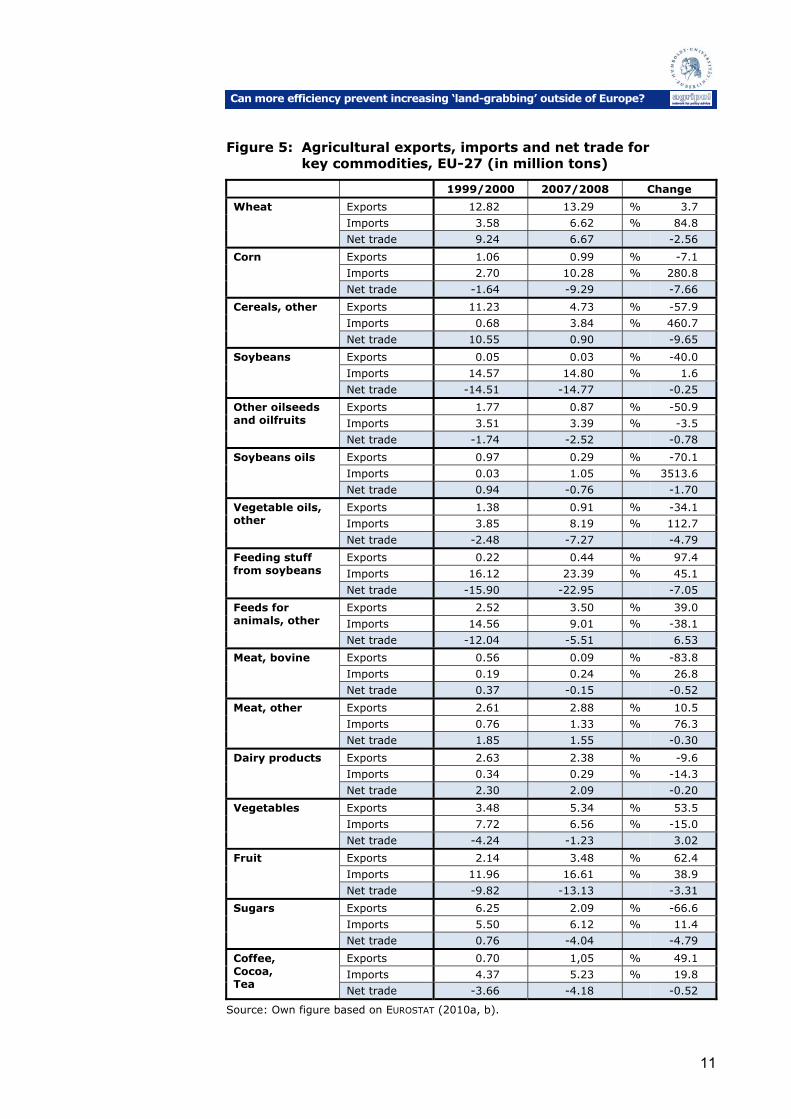
Figure 5 summarises the change in trade patterns for selected but im-portant agricultural commodities and commodity groups. More specific trade data and details on single agricultural commodities are exhibited in Annex B.
Grains
In total grains, the decline in export and the increase in imports are far above average. While the exports for wheat went up slightly and corn exports have declined by 7 percent, the export quantity of other grains (barley, rye, triticale, oats, etc) is down by more than half. Grain Im-ports rose significantly with more than 20 million metric tons in 2007/2008. This is three times more than less a decade ago. In wheat, net exports have declined by 2.5 million metric tons. In corn, the net
0
20
40
60
80
100
120
Exports Imports
EU-15 EU-27
Particular role of EU enlargement
Selected markets in detail
10
Can more efficiency prevent increasing ‘land-grabbing’ outside of Europe?
import quantity more than quadrupled. In other grains net exports have declined to near zero. Consequently, the European Union lost its position as a net exporter of grain and has become a net importer in recent years.
In addition to the variables discussed above this is likely to reflect sub-stitution processes in the European Union, as feed corn acreage is now used to produce bioenergy. The same is true for grains other than corn. In Germany alone, 1.5 million metric tons of grains are used for bio-energy production (LFL and LEL, 2009; 2010). In addition, decline in animal production, mainly in beef and milk, has reduced the use of feed grains. Furthermore, the decoupled direct payments to farmers have increased the profitability of oilseeds relative to grains and have also contributed to the changing EU trade pattern in grains.
Oilseeds
The European Union is a large net importer of oilseeds and oilseeds products. Its net import position has become even more pronounced. European Union specific imports are second only to China.
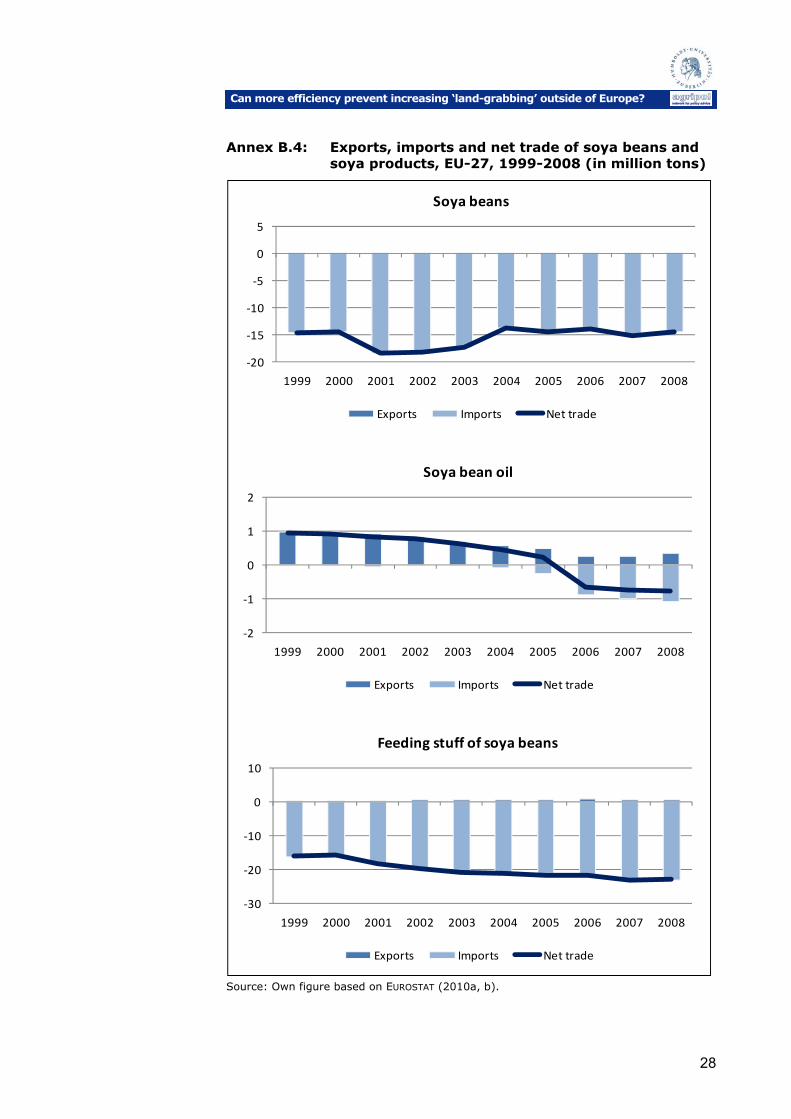
Although soybeans imports have remained largely unchanged, there is a large increase in the import quantities in soybean oil, palm oil and other vegetable oils. In soybeans oil, the European Union has switched from a net export to a net import position. While feedstuff imports of soybeans have increased by about seven million metric tons, net imports of other feedstuffs have declined by roughly the same amount.
Despite increasing rapeseed production in the European Union – particu-larly caused by the reform of the sugar market regime which led to an increasing acreage planted to rapeseed – net imports of rapeseed oils have increased considerably partly reflecting a substantial increase of rapeseed oil consumption for food.
Meat
Bovine meat exports are down by more than 80 percent while other meat exports (mostly pig meat) have gone up by around 10 percent. The increase of imports in meats, both bovine and other meats, has been above average. In total meat, the European Union is still a net ex-porter, but exports went down from 2.2 to 1.4 million metric tons.
Several factors have contributed to the changing trade flows in meat. One of them results from the EU dairy quota regime. About two thirds of all cows in the European Union are dairy cows. With increasing produc-tivity of cows a smaller herd size (and thus calves) is needed to meet the quota. Bovine meat production, hence, reflects the reduction in the number of beef cattle for fattening. Herd size has declined from 93 mil-lion animals in 2000 to 89 million in 2008. This likely is also the result of slaughter premiums, reduced EU import tariffs and export subsidies as well as the BSE-crisis.
The EU market regulations in pork and poultry traditionally have been fairly liberal. Production in the European Union had to struggle with in-creasing competition. A further issue are the limitations imposed by the European Union on the transportation of live animals. This has dramati-cally reduced, e.g., sales in the Middle and Near East.
11
Can more efficiency prevent increasing ‘land-grabbing’ outside of Europe?
Figure 5: Agricultural exports, imports and net trade for key commodities, EU-27 (in million tons)
1999/2000 2007/2008 Change
Wheat Exports 12.82 13.29 % 3.7
Imports 3.58 6.62 % 84.8
Net trade 9.24 6.67 -2.56
Corn Exports 1.06 0.99 % -7.1
Imports 2.70 10.28 % 280.8
Net trade -1.64 -9.29 -7.66
Cereals, other Exports 11.23 4.73 % -57.9
Imports 0.68 3.84 % 460.7
Net trade 10.55 0.90 -9.65
Soybeans Exports 0.05 0.03 % -40.0
Imports 14.57 14.80 % 1.6
Net trade -14.51 -14.77 -0.25
Other oilseeds and oilfruits
Exports 1.77 0.87 % -50.9
Imports 3.51 3.39 % -3.5
Net trade -1.74 -2.52 -0.78
Soybeans oils Exports 0.97 0.29 % -70.1
Imports 0.03 1.05 % 3513.6
Net trade 0.94 -0.76 -1.70
Vegetable oils, other
Exports 1.38 0.91 % -34.1
Imports 3.85 8.19 % 112.7
Net trade -2.48 -7.27 -4.79
Feeding stuff from soybeans
Exports 0.22 0.44 % 97.4
Imports 16.12 23.39 % 45.1
Net trade -15.90 -22.95 -7.05
Feeds for animals, other
Exports 2.52 3.50 % 39.0
Imports 14.56 9.01 % -38.1
Net trade -12.04 -5.51 6.53
Meat, bovine Exports 0.56 0.09 % -83.8
Imports 0.19 0.24 % 26.8
Net trade 0.37 -0.15 -0.52
Meat, other Exports 2.61 2.88 % 10.5
Imports 0.76 1.33 % 76.3
Net trade 1.85 1.55 -0.30
Dairy products Exports 2.63 2.38 % -9.6
Imports 0.34 0.29 % -14.3
Net trade 2.30 2.09 -0.20
Vegetables Exports 3.48 5.34 % 53.5
Imports 7.72 6.56 % -15.0
Net trade -4.24 -1.23 3.02
Fruit Exports 2.14 3.48 % 62.4
Imports 11.96 16.61 % 38.9
Net trade -9.82 -13.13 -3.31
Sugars Exports 6.25 2.09 % -66.6
Imports 5.50 6.12 % 11.4
Net trade 0.76 -4.04 -4.79
Coffee, Cocoa, Tea
Exports 0.70 1,05 % 49.1
Imports 4.37 5.23 % 19.8
Net trade -3.66 -4.18 -0.52
Source: Own figure based on EUROSTAT (2010a, b).
12
Can more efficiency prevent increasing ‘land-grabbing’ outside of Europe?
Dairy
Dairy exports have declined by about 10 percent. This is mainly the re-sult of the reform process of the CAP which has resulted in a significant reduction in the domestic minimum price (intervention price) and in ex-port subsidies. In addition, an enlargement effect contributed to the de-cline in dairy exports: Quotas in the new member states were set below self sufficiency.
Fruit and vegetables
Fruit and vegetable exports have increased considerably. This reflects the enlargement of the European Union which included countries with a significant production potential. Fruit imports, in particular imports of tropical fruit, increased at the same time. Income growth in the new member states and, hence, changes in consumer preferences can be attributed to this particular development.
Sugar
The reform of the EU sugar policy in 2006 is beginning to have an im-pact on EU production and trade. Domestic minimum producer prices have been reduced by almost 40 percent. The sugar production quota has been reduced too. In addition sugar beets are used for the produc-tion of bioethanol. All this led to a substantial decrease of exports (al-most 70 percent) and an increase of imports (10 percent). Conse-quently, the European Union lost its net export position and became a net importer of sugars.
4. CONVERSION OF AGRICULTURAL INTO LAND TRADE
The quantities of agricultural commodities and processed products which are traded have been translated into arable land requirements for ex-ported and imported goods using the approach presented in chapter 2. The results of this procedure are displayed in figure 6.
As can be seen, virtual land exports have declined to 14 million hectares (minus 17 percent) during the time period considered here, while virtual land imports have gone up to almost 49 million hectares (plus 15 per-cent). In 2007/08 the virtual net import of land has amounted to almost 35 million hectares. This is an increase of almost 10 million hectares and nearly 40 percent relative to 1999/2000. Thus, the European Union is using approximately one third of her own utilized arable area outside its own territory.
The numbers are impressive: The currently occupied arable land in third countries (34.9 million hectares) is almost equivalent to the entire terri-tory of Germany; and the increase of virtual land trade between 1999/2000 and 2007/2008 amounts to 9.6 million hectares which is larger than the land area of Hungary or Portugal.
A major cause of the substantial growth in virtual land import is the in-creased use of soybeans and related products. They accounted for an increase of about 3.7 million hectares. Additional substantial contribu-tions have resulted from coarse grains (plus 2.7 million hectares), wheat (plus 1.6 million hectares) and corn (plus 1.5 million hectares). Palm
EU land trade amounts to 35 million hectares …
… and is equivalent to the territory of Germany
13
Can more efficiency prevent increasing ‘land-grabbing’ outside of Europe?
fruits have contributed an additional 1.0 million hectares to the increase in net imports of virtual land. Other oilseeds, oleaginous fruits and vege-tables have acted to slightly reduce net imports.
Figure 6: EU arable land virtually traded (in million ha)
Source: Own calculations.
The resulting virtual land trade by commodity (group) for 2007/2008 is displayed in figure 7.
0
10
20
30
40
50
1999/2000 2007/2008
Arable land exported
Wheat Corn Coarse Grains Rice
Soya Palm Other Oilseeds Sugar crops
Coffee, Cocoa, Tea Fruits Vegetables Others
0
10
20
30
40
50
1999/2000 2007/2008
Arable land imported
14
Can more efficiency prevent increasing ‘land-grabbing’ outside of Europe?
Figure 7: Composition of the land exports and imports and resulting net land trade of the EU, 2007/2008 (in million ha)
Land exports Land imports Net land trade
Wheat 3.28 2.57 0.71
Corn 0.56 2.48 -1.92
Coarse grains 2.92 1.40 1.52
Rice 0.04 0.53 -0.49
Soybeans 1.71 19.24 -17.53
Palm fruits 0.05 2.61 -2.56
Other oilseeds 3.47 8.59 -5.12
Sugar crops 0.15 0.44 -0.29
Coffee, Cocoa, Tea 0.44 6.72 -6.28
Fruits 0.95 3.31 -2.36
Vegetables 0.22 0.56 -0.35
Others 0.31 0.54 -0.23
Total 14.10 48.99 -34.90
Source: Own calculations.
As is evident, the European Union is now a net exporter of virtual land in wheat and coarse grains only. All other commodities and commodity groups result in a net import of land. Soybean is the key commodity in this regard, as it accounts for more than 50 percent of the virtual land net import.
The calculations above include arable land only. Grassland is adding ad-ditional hectares to net land imports of the European Union. However, suitable data are not available. A rough approximation of virtual grass-land imports can be based on an analysis by SCHÖNLEBER (2009) which suggests that the traded quantities of red meat and dairy products would result in an additional land use of approximately 1 million hec-tares.
In sum, the European Union continues to be a major net importer of agricultural commodities. Net import quantities have increased signifi-cantly. Therefore, the European Union is not only a major importer of virtual agricultural land but is importing an increasing virtual agricultural acreage. The question is, now, how different technology and policy envi-ronments may alter the amount of virtual land grabbed by the EU out-side its territory?
5. EU VIRTUAL LAND TRADE UNDER TECHNOLOGY AND POLICY CHANGE
In the following we will analyse how alternative technologies and policies affect virtual land trade flows between the European Union and the rest of the world. Three scenarios for the European Union will be considered. They include increasing land productivity, i.e. yields, expansion of the acreage planted to organically produced crops, and growing bioenergy production.
Grassland activities add additional land
Three scenarios
15
Can more efficiency prevent increasing ‘land-grabbing’ outside of Europe?
Scenario ‘Yield increase’
Productivity growth in world agriculture has been on a decline since the Green Revolution of the 1960s and 1970s. From the 1960s through the 1980s productivity growth in world agriculture averaged around four percent. It is now down to about one percent with a continuing tendency towards further decline (FAO, 2008; VON WITZKE et al., 2008). There are two reasons for this:
One of them has been the fact that the productive potential of crops has increasingly been captured by traditional breeding methods such that additional productivity growth can only be realised by ever increasing investment in agricultural research.
And the second reason is that exactly this has not happened. To the contrary public agricultural research has experienced significant cut-backs, in particular when it comes to research aiming at productivity growth (PARDEY at al., 2007; PARDEY, 2009). Moreover, private agri-cultural research is faced with a regulatory environment in many countries that discourages innovation.
Yield growth in the European Union is an illustrative example for this. Since the 1990s wheat yields have increased by an annual rate of around 0.6 percent (EUROSTAT, 2009).
In the scenario ‘Yield increase’ we calculate the change in virtual agricul-tural land imports by the European Union under the assumption that the actual annual yield growth in the European Union was 50 percent higher than the actual growth during the time period between 1999/2000 and 2007/08. In wheat, to take an example, this would imply a yield increase of 7.7 percent rather than 5.1 percent.
Scenario ‘Expanded organic farming’
The number of organic farming enterprises in the European Union has grown year by year. The number of consumers buying organic food products has increased as well. The European Union has policies in place which subsidize organic farming and encourage its expansion (EC, 2004).
Despite this, only about 3 percent of arable land and 4 percent of total agricultural land in the European Union are farmed organically (SCHAACK, 2010). Policy targets for organic farming are formulated by individual member states and not by the European Union. The German Govern-ment, e.g., in its sustainability strategy aims at a minimum of 20 per-cent of all agricultural land to be farmed organically (BUNDESREGIERUNG, 2008).
Yields in organic farming are lower than in conventional farming (see, e.g., NOMISMA, 2008). In the scenario ‘Expanded organic farming’ we calculate the change in agricultural land use which would have resulted if 20 percent of cropland in the European Union had been farmed or-ganically in 2007/08.
Scenario ‘EU’s biofuels mandate’
Initially the European Union had formulated the objective of using 20 percent renewable energy in total energy consumption (EUROPEAN
PARLIAMENT and EUROPEAN COUNCIL, 2007). The EU recently changed this objective and now aims at using 10 percent renewable energy respec-
Yield increases 50 percent up
Organic farming on 20 percent of land
16
Can more efficiency prevent increasing ‘land-grabbing’ outside of Europe?
tively 5.6 percent biofuels in road transportation (EUROPEAN PARLIAMENT and EUROPEAN COUNCIL, 2009; AL-RIFAI et al., 2010).
According to AL-RIFFAI et al. (2010) this would imply the production of 10 percent more biodiesel and 157 percent more bioethanol than in 2008. In addition this would result in imports of biodiesel or biodiesel crops by 15 percent and of bioethanol by 500 percent (albeit from a rather low base). This in turn would lead to a growing sunflower, soy-beans, rapeseed and palm fruit demand for biodiesel production as well as an increased use of wheat, sugar (cane and or beets) and maize for bioethanol production. The production and import changes of these crops, being necessary to achieve the EU bioenergy objective, which have been generated by AL-RIFFAI et al. (2010) are used for the calcula-tion of the change in virtual agricultural land imports by the European Union.
Applying the selected parameters of the three defined scenarios to our indicator based approach results in acreages imported as depicted in figure 8.
Figure 8: Net land imports of the EU under changing technologies and policies (in million ha)
Source: Own calculations.
The ‘Yield increase’ acts to significantly reduce EU virtual land imports. It would save about 5.3 million hectares of cropland outside the Euro-pean Union. In fact, had productivity growth in the European Union been double of what it was in the 1999/2000 to 2007/08 period the virtual land import would have been about 10 million hectares lower and had remained roughly at the 1999/2000 level.
Expanding acreage of organically farmed land would have the opposite effect. Under the assumption of this scenario the virtual agricultural land net import would increase by 10.2 million hectares to a total of 45.2 hectares. This is an increase in virtual land net import of almost 30 per-cent.
Achieving the EU biofuel objective would increase the amount of virtually imported land as well. However, the order of magnitude would be much smaller than in the scenario with expanded organic farming acreage. Net
-50
-40
-30
-20
-10
0
Reference scenario
Scenario ' Yield increase'
Scenario 'Expanded organic farming'
Scenario 'EU's biofuels mandate'
Biofuels mandate of the EU boosts consumption
Results for the three scenarios
Higher yields decrease land imports
Organic farming and also biofuels increase land imports
17
Can more efficiency prevent increasing ‘land-grabbing’ outside of Europe?
imports of virtual land would increase by slightly more than 3 million hectares.
6. CONCLUSIONS
Global food demand is likely to double in the first half of the 21st century (VON WITZKE et al., 2008). This rapidly growing demand can be satisfied by expanding the agricultural acreage or by producing more on the land being farmed already. From the 1960s to the 1980s about 80 percent of global food production growth was the result of productivity growth and only 20 percent was accounted for by expanding the acreage. As the land that is available for food production is limited on a global scale, the production growth necessary to meet the rapidly growing world food needs must be based even more on productivity growth (e.g. RUNGE et al, 2003; BRUINSMA, 2003; FAO, 2008).
The European Union is a net food importer. Her net imports have gone up significantly in the past decade. In fact the European Union is now tied with China as the world’s largest net importer in terms of value. As a consequence, the European Union has become a large importer of vir-tual agricultural land. This would not be a major issue had the growth in net imports of virtual land not had negative economic externalities in the form of reductions in natural habitats such as tropical rain forests and increasing greenhouse gas emissions from converting forests and grass-lands into cropland.
In this paper it has been demonstrated that increasing production of agricultural commodities in the European Union would significantly re-duce net food imports. The analysis presented in this paper also sug-gests that it would also significantly reduce the import of virtual land from around the world. Moreover it has become clear that declining food production through expansion of organic production or bioenergy acre-age would have the opposite effect.
Increasing agricultural productivity growth by just 0.3 percentage points per annum for major crops would reduce the European Union’s net im-port of virtual land by 5.3 million hectares.
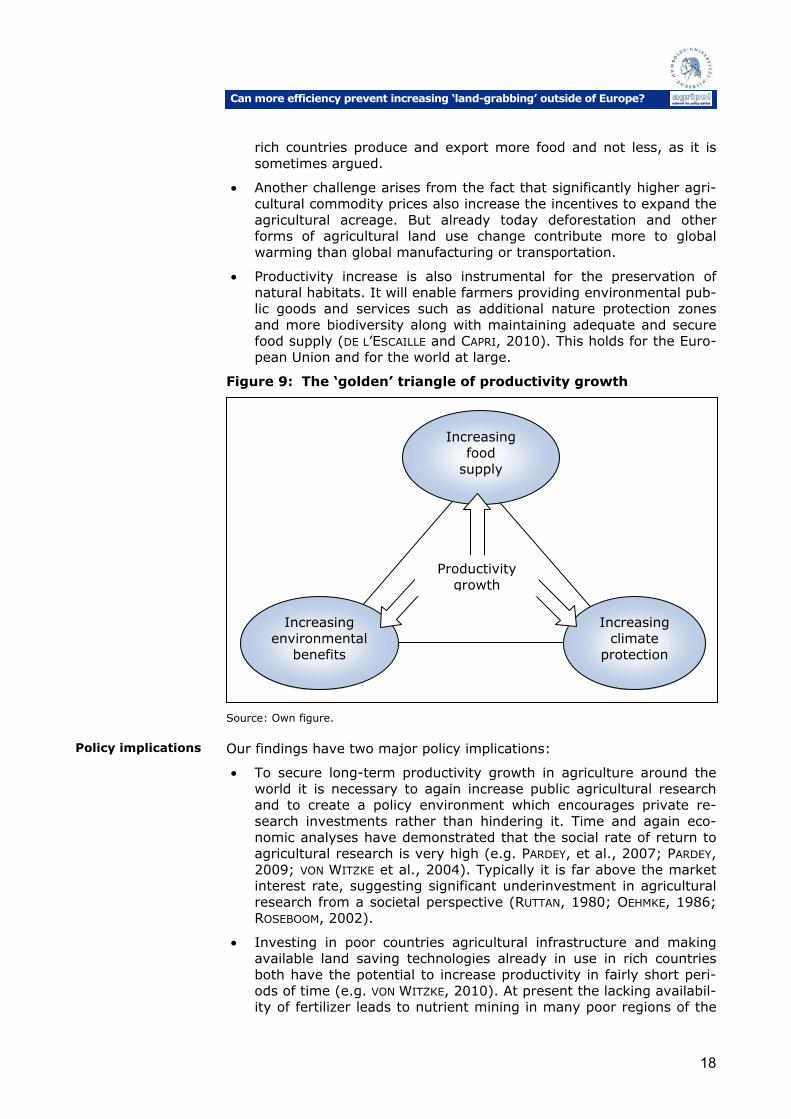
In sum, productivity growth in European Union agriculture (or in other regions of the world) is the key in dealing with at least three global chal-lenges (see also figure 9):
One of them is the fight against malnutrition around the globe. Eco-nomic analyses of agricultural commodity markets suggest signifi-cantly higher prices in the future. Most of these analyses arrive at price increases in the range of about 15 to 30 percent. However, when higher energy prices are accounted for, the commodity price increases will be much higher (VON WITZKE et al, 2009).
While it may be desirable that the poor countries of the world con-tribute more to meeting their food needs, it has become apparent that these countries will not – even under the best of all realistic scenarios – be close to become self sufficient in food in the decades ahead. In fact, the food import gap of developing countries is ex-pected to quintuple between 2000 and 2030 (BRUINSMA, 2003). Therefore, the food needs of the world can only be met when the
Productivity growth is a key in meeting global challenges
18
Can more efficiency prevent increasing ‘land-grabbing’ outside of Europe?
rich countries produce and export more food and not less, as it is sometimes argued.
Another challenge arises from the fact that significantly higher agri-cultural commodity prices also increase the incentives to expand the agricultural acreage. But already today deforestation and other forms of agricultural land use change contribute more to global warming than global manufacturing or transportation.
Productivity increase is also instrumental for the preservation of natural habitats. It will enable farmers providing environmental pub-lic goods and services such as additional nature protection zones and more biodiversity along with maintaining adequate and secure food supply (DE L’ESCAILLE and CAPRI, 2010). This holds for the Euro-pean Union and for the world at large.
Figure 9: The ‘golden’ triangle of productivity growth
Source: Own figure.
Our findings have two major policy implications:
To secure long-term productivity growth in agriculture around the world it is necessary to again increase public agricultural research and to create a policy environment which encourages private re-search investments rather than hindering it. Time and again eco-nomic analyses have demonstrated that the social rate of return to agricultural research is very high (e.g. PARDEY, et al., 2007; PARDEY, 2009; VON WITZKE et al., 2004). Typically it is far above the market interest rate, suggesting significant underinvestment in agricultural research from a societal perspective (RUTTAN, 1980; OEHMKE, 1986; ROSEBOOM, 2002).
Investing in poor countries agricultural infrastructure and making available land saving technologies already in use in rich countries both have the potential to increase productivity in fairly short peri-ods of time (e.g. VON WITZKE, 2010). At present the lacking availabil-ity of fertilizer leads to nutrient mining in many poor regions of the
Policy implications
Increasing food
supply
Increasing climate
protection
Increasing environmental
benefits
Productivity growth
19
Can more efficiency prevent increasing ‘land-grabbing’ outside of Europe?
world resulting in soil degradation which is costly to reverse. About 40 percent of the potential yield is lost to pests and diseases. Almost half of it could be avoided if farmers in poor countries had access to crop protection measures. Making of modern seed varie-ties available to farmers in poor countries can also increase food production there. A significant portion of crops is lost post harvest because of lacking infrastructure for storage, transportation and handling.
LIST OF REFERENCES
AKSOY, M.A.; BEGHIN, J.C. (2005): Global agricultural trade and developing countries. Washington, DC: World Bank.
ALLAN, J.A. (1993): Fortunately there are substitutes for water otherwise our hydro-political futures would be impossible. In: Priorities for Water Resources Allocation and Management (1993), p. 13-26. London: ODA.
ALLAN, J.A. (1994): Overall perspectives on countries and regions. In: Rogers, P.; Lydon, P. (eds.): Water in the Arab world: Perspectives and prognoses, p. 65-100. Cambridge, MA: Harvard University Press.
AL-RIFFAI, P.; DIMARANAN, B.; LABORDE, D. (2010): Global trends and envi-ronmental impact study of the EU biofuels mandate. Washington, DC: IFPRI.
ANDERSON, K. (2009): Distortions to agricultural incentives: A global perspective, 1955-2007. Washington, DC: World Bank.
ANDERSON, K.; COCKBURN, J.; MARTIN, W. (eds.) (2010): Agricultural price distortions, inequality and poverty. Washington, DC: World Bank.
ANDERSON, K. (2010): The political economy of agricultural price distor-tions. Cambridge: Cambridge University.
BANSE, M.; VAN MEIJL, H.; TABEAU, A.; WOLTJER, G. (2008): Will EU biofuel policies affect global agricultural markets? In: European Review of Agricultural Economics (35), p. 117-141.
BELIZT, H.D.; GROSCH, W.; SCHIEBERLE, P. (2008): Lehrbuch der Lebens-mittelchemie. Heidelberg: Springer.
BRUINSMA, J. (ed.) (2003): World agriculture towards 2015/30. London: Earthscan.
BUNDESREGIERUNG (2008): Nationale Nachhaltigkeitsstrategie "Perspektiven für Deutschland" (Stand: Dezember 2008). Berlin: Bundesregierung.
BURKE, M.; OLESON, K.; MCCULLOUGH, E.; GASKELL, J. (2008): A global model tracking water, nitrogen and land inputs and virtual transfers from industrialized meat production and trade. Heidelberg: Springer.
CHAPAGAIN, A.K.; HOEKSTRA, A.Y; SAVENIJE, H.H.G. (2006): Water saving through international trade of agricultural products. In: Hydrology and Earth System Sciences (10), p. 455–468.
20
Can more efficiency prevent increasing ‘land-grabbing’ outside of Europe?
DE L’ESCAILLE, T.; CAPRI, E. (2010): Multifunctional landscapes: Why good field margin management is important and how it can be achieved. Piacenza: OPERA.
EC (EUROPEAN COMMISSION) (2004): European action plan for organic food and farming. Brussels: EC.
EUROPEAN PARLIAMENT; EUROPEAN COUNCIL (2007): Renewable energy road map: Renewable energies in the 21st century: Building a more sustainable future. Brussels: EC.
EUROPEAN PARLIAMENT; EUROPEAN COUNCIL (2009): Directive 2009/28/EC of the European Parliament and of the Council of 23 April 2009 on the promotion of the use of energy from renewable sources and amend-ing and subsequently repealing directives 2001/77/EC and 2003/30/EC. Brussels: EC.
EUROSTAT (2009): Agricultural statistics: Main results – 2007-08. Luxem-bourg: Eurostat.
EUROSTAT (2010a): EU27 trade since 1995 by SITC. Statistics – data-base. Luxembourg: Eurostat.
EUROSTAT (2010b): Extra-EU27 trade by product group. Statistics – main tables. Luxembourg: Eurostat.
FAO (FOOD AND AGRICULTURE ORGANIZATION) (2001): Inter-temporal changes of conversion factors, extraction rates, and productivity of crops and livestock and related matters: 1963-67 to 1993-97. Rome: FAO.
FAO (FOOD AND AGRICULTURE ORGANIZATION) (2008): World agriculture towards 2030/2050. Rome: FAO.
FAPRI (FOOD AND AGRICULTURAL POLICY RESEARCH INSTITUTE) (2010): FAPRI 2009 U.S. and world agricultural outlook database. Ames, IA: FAPRI.
HOEKSTRA, A.Y. (2003): Virtual water: An introduction. In: Hoekstra, A.Y. (ed.): Virtual water trade: Proceedings of the international expert meeting on virtual water trade. Value of water research report series (11), p. 13-23. Delft: IHE.
HOEKSTRA, A.Y.; HUNG, P.Q. (1993): Virtual water trade: A quantification of virtual water flows between nations in relation to international crop trade. In: Hoekstra, A.Y. (ed.): Virtual water trade: Proceed-ings of the international expert meeting on virtual water trade. Value of water research report series (11), p. 25-47. Delft: IHE.
LANZIERI, G. (2009): Eurostat data in focus: First demographic estimates for 2009. Luxembourg: Eurostat.
LEAMER, E.E. (1995): The Heckscher-Ohlin Model in Theory and Practice. In: Princeton Studies in International Economics (77). Princeton, NJ: Princeton University.
LFL (BAYERISCHE LANDESANSTALT FÜR LANDWIRTSCHAFT ); LEL (LANDESANSTALT FÜR
ENTWICKLUNG DER LANDWIRTSCHAFT UND DER LÄNDLICHEN RÄUME) (2009): Agrarmärkte 2008. Schwäbisch Gmünd: LEL.
21
Can more efficiency prevent increasing ‘land-grabbing’ outside of Europe?
LFL (BAYERISCHE LANDESANSTALT FÜR LANDWIRTSCHAFT ); LEL (LANDESANSTALT FÜR
ENTWICKLUNG DER LANDWIRTSCHAFT UND DER LÄNDLICHEN RÄUME) (2010): Agrarmärkte 2009. Schwäbisch Gmünd: LEL.
NOMISMA (2008): European agriculture of the future: The role of plant protection products – economic impacts. Bologna: Nomisma.
OECD (ORGANIZATION FOR ECONOMIC COOPERATION AND DEVELOPMENT); FAO
(FOOD AND AGRICULTURE ORGANIZATION) (2009): OECD-FAO agricultural outlook 2009-2018. Paris: OECD.
OEHMKE, J.F. (1986): Underinvestment in public agricultural research. In: Agricultural Economics (1), p. 53-65.
LEY, T.; GLEWWE, P. (2007): Science, technology and skills. St. Paul, MN: University of Minnesota, Science and Technology Center.
PARDEY, P.G. (2009): Determinants of agricultural innovation and pro-ductivity growth. Paper presented at the inaugural meeting of the Humboldt Forum for Food and Agriculture in Davos, Switzerland, February 1-3, 2009. Berlin: HFFA.
ROSEBOOM, J. (2002): Underinvestment in agricultural R & D revisited. In: Quarterly Journal of International Agriculture (41), p. 297-316.
RUTTAN, V.W. (1980): Bureaucratic productivity: The case of agricultural research. In: Public Choice (35), p. 529-547.
RUNGE, C.F.; SENAUER, B.; PARDAY, P.G.; ROSEGRANT, M.W. (2003): Ending hunger in our lifetime. Baltimore, MD: Johns Hopkins University Press.
RUTA, M. (2010): What will the 2010 World Trade Report be about? Geneva: WTO.
SCARLAT, N.; DALLEMAND, J.F.; GALLEGO-PINILLA, F. (2008): Impact on agri-cultural land resources of biofuels production and use in the Euro-pean Union. Presentation at the International Conference and Exhi-bition on ‘Bioenergy: Challenges and Opportunities’ April 6th – 9th 2008: Guimarães: Universidade do Minho.
SCHNAACK, D. (2010): Organic area and sales in Europe 2008. Nuremberg: BioFach.
SCHÖFFL, H. (2008): Zuckergehalt und künstliche Süssstoffe in Er-frischungsgetränken (Limonaden) und Eistees. Wien: AK Wien.
SCHÖNLEBER, N. (2009): Entwicklung der Nahrungsmittelnachfrage und der Angebotspotenziale der Landwirtschaft in der Europäischen Union. Hohenheim: Universität Hohenheim.
STEGER, S. (2005): Der Flächenrucksack des europäischen Außenhandels mit Agrarprodukten: Welche Globalisierung ist zukunftsfähig? Wup-pertal Papers 152. Wuppertal: Wuppertal Institut für Klima, Umwelt, Energie.
SULLIVAN, J.; RONINGEN, V.; LEETMAA, S.; GRAY, D. (1992): A 1989 global database for the Static WOrld Policy SIMulation (SWOPSIM) model-ling framework. Staff report AGES 9215: Washington, DC: USDA.
22
Can more efficiency prevent increasing ‘land-grabbing’ outside of Europe?
TYERS, R; ANDERSON, K. (1992): Disarray in world food markets: A quan-titative assessment. Cambridge: Cambridge University.
USDA (UNITED STATES DEPARTMENT OF AGRICULTURE) (1992): Weights, measures, and conversion factors for agricultural commodities and their products. Washington, DC: USDA.
USDA (UNITED STATES DEPARTMENT OF AGRICULTURE) (2010): Agricultural baseline projections 2010-2019. Washington, DC: USDA.
VAN DAM, J.; ELBERSEN, W. (2004) Palm oil production for oil and biomass: The solution for sustainable oil production and certifiably sustainable biomass production? Wageningen: The Biomass Upstream Consor-tium.
VAN SLEEN, M. (2009): EU virtual land flows: An assessment of EU agri-cultural land use through international trade. Groningen: Rijksuni-versiteit.
VON WITZKE, H.; NOLEPPA, S.; SCHWARZ, G. (2008): Global agricultural market trends and their impacts on European Union agriculture. Department of Agricultural Economics, Working Paper 84. Berlin: Humboldt University Berlin.
VON WITZKE, H.; NOLEPPA, S.; SCHWARZ, G. (2009): Impacts of future energy price and biofuel production scenarios on international crop prices, production and trade. Proceedings of the international confe-rence on ‘The Economics of Alternative Energy Sources and Globali-zation: The Road Ahead’. Orlando, FL: Center for North American Studies.
VON WITZKE, H.; NOLEPPA, S.; SCHWARZ, G. (2010): Decoupled payments to EU farmers, production, and trade: An economic analysis for Germany. Department of Agricultural Economics, Working Paper 90. Berlin: Humboldt University Berlin.
VON WITZKE, H. (2010): Towards a third green revolution. Augsburg: Öl-baum (forthcoming)
WÜRTENBERGER, L.; KOELLER, T.; BINDER, C.R. (2006): Virtual land use and agricultural trade: Estimating environmental and socio-economic impacts. In: Ecological Economics (57), p. 679-697.
XIMING, Y.; FUKAO, K. (2010): Commodity classification systems for trade statistics. Tokyo: Institute for Economic Research.
23
Can more efficiency prevent increasing ‘land-grabbing’ outside of Europe?
ANNEX
List of Annexes Annex A: Additional general information on agricultural
trade of the EU Annex A.1: Agricultural export and import values, EU-27,
1999-2008 (in billion EUR) 24 Annex A.2: Net trade values, EU-27, 1999-2008
(in billion EUR) 24 Annex B: Detailed information on agricultural trade
of the EU-15 Annex B.1: Exports, imports and net trade of meat and dairy
products, EU-27, 1999-2008 (in million tons) 25 Annex B.2: Exports, imports and net trade of grains, EU-27,
1999-2008 (in million tons) 26 Annex B.3: Exports, imports and net trade of rice and cereal
preparations, EU-27, 1999-2008 (in million tons) 27 Annex B.4: Exports, imports and net trade of soya beans and
soya products, EU-27, 1999-2008 (in million tons) 27 Annex B.5: Exports, imports and net trade of palm fruits and
palm products, EU-27, 1999-2008 (in million tons) 29 Annex B.6: Exports, imports and net trade of rapeseed and
rapeseed products, EU-27, 1999-2008 (in million tons) 29
Annex B.7: Exports, imports and net trade of other oilseeds and oleaginous fruit products, EU-27, 1999-2008 (in million tons) 31
Annex B.8: Exports, imports and net trade of fruit and fruit products, EU-27, 1999-2008 (in million tons) 31
Annex B.9: Exports, imports and net trade of vegetables, EU-27, 1999-2008 (in million tons) 33
Annex B.10: Exports, imports and net trade of sugar and sugar preparations, EU-27, 1999-2008 (in million tons) 33
Annex B.11: Exports, imports and net trade of coffee, cocoa and tea, EU-27, 1999-2008 (in million tons) 35
Annex B.12: Exports, imports and net trade of wine, cotton and tobacco, EU-27, 1999-2008 (in million tons) 36
24
Can more efficiency prevent increasing ‘land-grabbing’ outside of Europe?
Annex A.1: Agricultural export and import values, EU-27, 1999-2008 (in billion EUR)
Source: Own figure based on EUROSTAT (2010a, b).
Annex A.2: Net trade values, EU-27, 1999-2008
(in billion EUR)
Source: Own figure based on EUROSTAT (2010a, b).
-30
-20
-10
0
1999 2000 2001 2002 2003 2004 2005 2006 2007 2008
Official agricultural trade Total agricultural trade
Official agricultural trade (SITC0 and SITC1)
Total agricultural trade (SITC0, SITC1, SITC22+263+266, and SITC4)
0
20
40
60
80
100
1999 2000 2001 2002 2003 2004 2005 2006 2007 2008
Exports Imports
0
20
40
60
80
100
120
1999 2000 2001 2002 2003 2004 2005 2006 2007 2008
Exports Imports
25
Can more efficiency prevent increasing ‘land-grabbing’ outside of Europe?
Annex B.1: Exports, imports and net trade of meat and dairy products, EU-27, 1999-2008 (in million tons)
Source: Own figure based on EUROSTAT (2010a, b).
-0.8
-0.4
0.0
0.4
0.8
1999 2000 2001 2002 2003 2004 2005 2006 2007 2008
Bovine meat
Exports Imports Net trade
-1
0
1
2
3
1999 2000 2001 2002 2003 2004 2005 2006 2007 2008
Other meat
Exports Imports Net trade
-1
0
1
2
3
1999 2000 2001 2002 2003 2004 2005 2006 2007 2008
Dairy products
Exports Imports Net trade
26
Can more efficiency prevent increasing ‘land-grabbing’ outside of Europe?
Annex B.2: Exports, imports and net trade of grains, EU-27, 1999-2008 (in million tons)
Source: Own figure based on EUROSTAT (2010a, b).
-20
-10
0
10
20
1999 2000 2001 2002 2003 2004 2005 2006 2007 2008
Wheat
Exports Imports Net trade
-12
-8
-4
0
4
1999 2000 2001 2002 2003 2004 2005 2006 2007 2008
Corn
Exports Imports Net trade
-5
0
5
10
15
1999 2000 2001 2002 2003 2004 2005 2006 2007 2008
Other grains
Exports Imports Net trade
27
Can more efficiency prevent increasing ‘land-grabbing’ outside of Europe?
Annex B.3: Exports, imports and net trade of rice and cereal preparations, EU-27, 1999-2008 (in million tons)
Source: Own figure based on EUROSTAT (2010a, b).
-2
-1
0
1
1999 2000 2001 2002 2003 2004 2005 2006 2007 2008
Rice
Exports Imports Net trade
-1
0
1
2
3
4
1999 2000 2001 2002 2003 2004 2005 2006 2007 2008
Cereal meals and flours
Exports Imports Net trade
-2
0
2
4
6
1999 2000 2001 2002 2003 2004 2005 2006 2007 2008
Other cereal preparation
Exports Imports Net trade
28
Can more efficiency prevent increasing ‘land-grabbing’ outside of Europe?
Annex B.4: Exports, imports and net trade of soya beans and soya products, EU-27, 1999-2008 (in million tons)
Source: Own figure based on EUROSTAT (2010a, b).
-20
-15
-10
-5
0
5
1999 2000 2001 2002 2003 2004 2005 2006 2007 2008
Soya beans
Exports Imports Net trade
-2
-1
0
1
2
1999 2000 2001 2002 2003 2004 2005 2006 2007 2008
Soya bean oil
Exports Imports Net trade
-30
-20
-10
0
10
1999 2000 2001 2002 2003 2004 2005 2006 2007 2008
Feeding stuff of soya beans
Exports Imports Net trade
29
Can more efficiency prevent increasing ‘land-grabbing’ outside of Europe?
Annex B.5: Exports, imports and net trade of palm fruits and palm products, EU-27, 1999-2008 (in million tons)
Source: Own figure based on EUROSTAT (2010a, b).
-0.02
0.00
0.02
0.04
0.06
0.08
1999 2000 2001 2002 2003 2004 2005 2006 2007 2008
Palm nuts and kernels
Exports Imports Net trade
-6
-4
-2
0
2
1999 2000 2001 2002 2003 2004 2005 2006 2007 2008
Palm nuts and kernel oil
Exports Imports Net trade
-4
-3
-2
-1
0
1
1999 2000 2001 2002 2003 2004 2005 2006 2007 2008
Feeding stuff of palm nuts and kernels
Exports Imports Net trade
30
Can more efficiency prevent increasing ‘land-grabbing’ outside of Europe?
Annex B.6: Exports, imports and net trade of rapeseed and rape-seed products, EU-27, 1999-2008 (in million tons)
Source: Own figure based on EUROSTAT (2010a, b).
-4
-2
0
2
4
1999 2000 2001 2002 2003 2004 2005 2006 2007 2008
Rapeseed
Exports Imports Net trade
-0.8
-0.4
0.0
0.4
0.8
1999 2000 2001 2002 2003 2004 2005 2006 2007 2008
Rapeseed oil
Exports Imports Net trade
-0.6
-0.3
0.0
0.3
1999 2000 2001 2002 2003 2004 2005 2006 2007 2008
Feeding stuff of rapeseed
Exports Imports Net trade
31
Can more efficiency prevent increasing ‘land-grabbing’ outside of Europe?
Annex B.7: Exports, imports and net trade of other oilseeds and oleaginous fruit products, EU-27, 1999-2008 (in million tons)
Source: Own figure based on EUROSTAT (2010a, b).
-3
-2
-1
0
1
1999 2000 2001 2002 2003 2004 2005 2006 2007 2008
Sunflower seed
Exports Imports Net trade
-0.4
-0.2
0.0
0.2
0.4
1999 2000 2001 2002 2003 2004 2005 2006 2007 2008
Olive oil
Exports Imports Net trade
-60
-40
-20
0
20
1999 2000 2001 2002 2003 2004 2005 2006 2007 2008
Other oilseeds and oleaginous fruit
Exports Imports Net trade
32
Can more efficiency prevent increasing ‘land-grabbing’ outside of Europe?
Annex B.8: Exports, imports and net trade of fruit and fruit products, EU-27, 1999-2008 (in million tons)
Source: Own figure based on EUROSTAT (2010a, b).
-15
-10
-5
0
5
1999 2000 2001 2002 2003 2004 2005 2006 2007 2008
Fruit
Exports Imports Net trade
-3
-2
-1
0
1
1999 2000 2001 2002 2003 2004 2005 2006 2007 2008
Fruit juices
Exports Imports Net trade
-2
-1
0
1
1999 2000 2001 2002 2003 2004 2005 2006 2007 2008
Fruit preparations
Exports Imports Net trade
33
Can more efficiency prevent increasing ‘land-grabbing’ outside of Europe?
Annex B.9: Exports, imports and net trade of vegetables, EU-27, 1999-2008 (in million tons)
Source: Own figure based on EUROSTAT (2010a, b).
-1
0
1
2
1999 2000 2001 2002 2003 2004 2005 2006 2007 2008
Potatoes
Exports Imports Net trade
-6
-4
-2
0
2
1999 2000 2001 2002 2003 2004 2005 2006 2007 2008
Manioc
Exports Imports Net trade
-6
-4
-2
0
2
4
1999 2000 2001 2002 2003 2004 2005 2006 2007 2008
Other vegetable
Exports Imports Net trade
34
Can more efficiency prevent increasing ‘land-grabbing’ outside of Europe?
Annex B.10: Exports, imports and net trade of sugar and sugar preparations, EU-27, 1999-2008 (in million tons)
Source: Own figure based on EUROSTAT (2010a, b).
-6
-4
-2
0
2
1999 2000 2001 2002 2003 2004 2005 2006 2007 2008
Cane sugar, raw and molasse
Exports Imports Net trade
-0.6
-0.3
0.0
0.3
1999 2000 2001 2002 2003 2004 2005 2006 2007 2008
Beet sugar, raw and molasse
Exports Imports Net trade
-2
0
2
4
6
8
1999 2000 2001 2002 2003 2004 2005 2006 2007 2008
Other sugar (mainly refined)
Exports Imports Net trade
35
Can more efficiency prevent increasing ‘land-grabbing’ outside of Europe?
Annex B.11: Exports, imports and net trade of coffee, cocoa and tea, EU-27, 1999-2008 (in million tons)
Source: Own figure based on EUROSTAT (2010a, b).
-3
-2
-1
0
1
1999 2000 2001 2002 2003 2004 2005 2006 2007 2008
Coffee
Exports Imports Net trade
-2.0
-1.5
-1.0
-0.5
0.0
0.5
1999 2000 2001 2002 2003 2004 2005 2006 2007 2008
Cocoa
Exports Imports Net trade
-0.6
-0.4
-0.2
0.0
0.2
1999 2000 2001 2002 2003 2004 2005 2006 2007 2008
Tea
Exports Imports Net trade
36
Can more efficiency prevent increasing ‘land-grabbing’ outside of Europe?
Annex B.12: Exports, imports and net trade of wines, cotton and tobacco, EU-27, 1999-2008 (in million tons)