Project no: SSPE-CT-2004-502459 (STREP) Project acronym: MEDFROL Project title: Market and Trade Policies for Mediterranean Agriculture: The case of fruit/vegetable and olive oil Instrument: Specific Targeted Research Projects Thematic Priority: Policy-orientated research Report title: Supply chain analysis of the olive oil market in The EU (Case studies for The Netherlands and Germany) Period covered: from: 04/2004 to 03/2006 Date of preparation: 31/03/2006 Start date of project: 01/04/2004 Duration: 3 years Project coordinator name: Prof. K. Mattas, Dr. G. Baourakis Project coordinator organisation name:MAICh Revision [final] Report prepared for the Medfrol Project “Market and Trade Policies for the Mediterranean Agriculture: The case of fruit / vegetables and olive oil” under the European Sixth Framework Program, Priority 8.1, Policy-Oriented Research, Integrating and Strengthening the European Research Area. Views in this paper are those of the authors and do not necessarily reflect those of the institutions of affiliation, the Medfrol project and the EU. Any errors in the paper are in the responsibility of the authors.
Transcript
Project no: SSPE-CT-2004-502459 (STREP)
Project acronym: MEDFROL
Project title: Market and Trade Policies for Mediterranean Agriculture: The case of
fruit/vegetable and olive oil
Instrument: Specific Targeted Research Projects
Thematic Priority: Policy-orientated research
Report title:
Supply chain analysis of the olive oil market in The EU
(Case studies for The Netherlands and Germany)
Period covered: from: 04/2004 to 03/2006 Date of preparation: 31/03/2006 Start date of project: 01/04/2004 Duration: 3 years Project coordinator name: Prof. K. Mattas, Dr. G. Baourakis Project coordinator organisation name:MAICh Revision [final]
Report prepared for the Medfrol Project “Market and Trade Policies for the Mediterranean Agriculture: The case of fruit / vegetables and olive oil” under the European Sixth Framework Program, Priority 8.1, Policy-Oriented Research, Integrating and Strengthening the European Research Area. Views in this paper are those of the authors and do not necessarily reflect those of the institutions of affiliation, the Medfrol project and the EU. Any errors in the paper are in the responsibility of the authors.
2
TABLE OF CONTENTS
LIST OF TABLES.......................................................................................................................................... 3 1 A EUROPEAN OUTLOOK FOR THE OLIVE OIL MARKET ......................................................... 4
1.1 EDIBLE OILS AND FATS .................................................................................................................... 4 1.2 THE OLIVE OIL MARKET ................................................................................................................... 7 1.3 TRADE TRENDS IN EUROPEAN OLIVE OIL MARKET ............................................................................. 9 1.4 EXTRA EU OLIVE OIL IMPORT TRADE WITH MEDITERRANEAN COUNTRIES ...................................... 11
1.4.1 Tunisia..................................................................................................................................... 11 1.4.2 Turkey ..................................................................................................................................... 12 1.4.3 Syria: an abitious new project for “High Quality Olive Production and Processing”................ 13
1.5 TRENDS IN THE EUROPEAN OLIVE OIL MARKET ............................................................................... 13 2 THE NETHERLANDS OLIVE OIL SUPPLY CHAIN ..................................................................... 16
2.1 INTRODUCTION ............................................................................................................................. 16 2.2 THE DEMAND SIDE......................................................................................................................... 16 2.3 THE SUPPLY SIDE........................................................................................................................... 20
2.3.1 Imports – Exports..................................................................................................................... 20 2.3.2 Wholesale trade ....................................................................................................................... 22 2.3.3 Food industry........................................................................................................................... 22 2.3.4 Food Retailing ......................................................................................................................... 22 2.3.5 Specialised shops ..................................................................................................................... 22 2.3.6 Business relationships between the different players in the supply chain ................................... 23 2.3.7 Quality and labelling issues...................................................................................................... 25 2.3.8 Institutional structure............................................................................................................... 26 2.3.9 Dutch oils and fats industry...................................................................................................... 27
2.4 CONCLUSIONS............................................................................................................................... 28 REFERENCES ............................................................................................................................................. 29 3 THE OLIVE OIL SUPPLY CHAIN IN GERMANY ......................................................................... 31
3.1 INTRODUCTION ............................................................................................................................. 31 3.2 THE DEMAND SIDE......................................................................................................................... 31 3.3 THE SUPPLY SIDE........................................................................................................................... 35
3.3.1 Imports – Exports..................................................................................................................... 35 3.3.2 Wholesale trade ....................................................................................................................... 38 3.3.3 Food industry........................................................................................................................... 38 3.3.4 Food Retailing ......................................................................................................................... 38 3.3.5 Specialised shops ..................................................................................................................... 39 3.3.6 Big consumers.......................................................................................................................... 39 3.3.7 Business relationships between the different players in the supply chain ................................... 39 3.3.8 Quality and labelling issues...................................................................................................... 42 3.3.9 Institutional structure............................................................................................................... 43
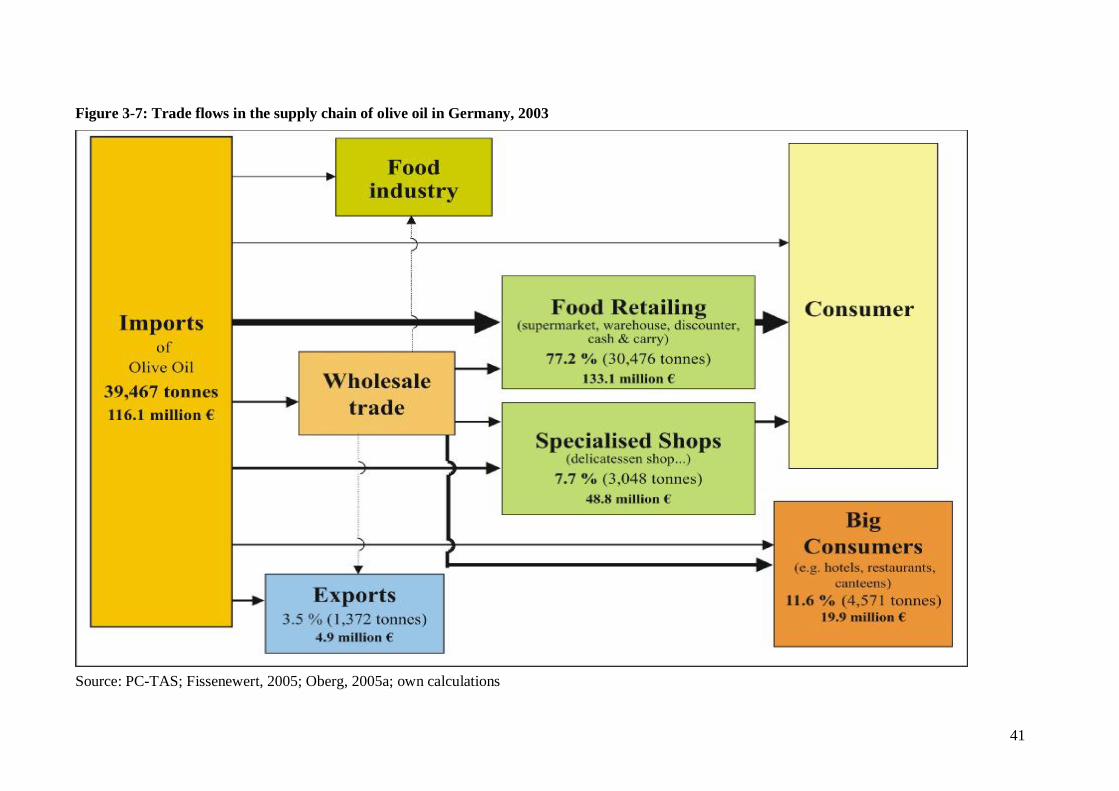
Figure 1-1Main edible oil and fat consumption, in the EU-15 in 2002 ............................................................... 4 Figure 1-2 Edible oil and fat consumption trends, in EU (15) in volume terms ................................................... 4 Figure 1-3 EU-15 Trends in the vegetable oil market (domestic supply in 1997-2002)....................................... 5 Figure 1-4, EU-25, Edible oils and fats consumption in 2002 ............................................................................ 6 Figure 1-5, Trends in EU olive oil production, imports, exports and total supply ............................................... 7 Figure 1-6, olive oil domestic supply in EU-25, in 2002..................................................................................... 7 Figure 1-7, Trends of olive oil imports in the global market............................................................................... 9 Figure 1-8, Exports of virgin olive oil by EU and Mediterranean countries in 2003 ........................................... 9 Figure 1-9Virgin olive oil imports in EU and Mediterranean countries, in 2002 .............................................. 10 Figure 2-1, Trends in vegetable oil consumption in the Netherlands ................................................................ 17 Figure 2-2, Composition of vegetable oil consumption in The Netherlands in 2003 .......................................... 18 Figure 2-3 Edible oils consumption trends in The Netherlands (total volume in thousand tonnes) .................... 19 Figure 2-4, Imports of virgin olive oil in (2003)............................................................................................... 20 Figure 2-5 Trade flows in the supply chain of olive in The Netherlands in 2003 ............................................... 24 Figure 3-1: Imports of virgin olive oil in Germany (2003) ............................................................................... 32 Figure 3-2: Development of the consumption of edible oils in 1997 vs. 2003 in %............................................ 34 Figure 3-3: Development of the consumption of edible oils in 1997 vs. 2003 in %............................................ 34 Figure 3-4: Suppliers of olive oil to the importers in terms of volume , in %..................................................... 36 Figure 3-5: Recipients of olive oil in terms of value, in %. ............................................................................... 37 Figure 3-6: Acquisition and selling mechanisms of the importers (in %) .......................................................... 40 Figure 3-7: Trade flows in the supply chain of olive oil in Germany, 2003....................................................... 41
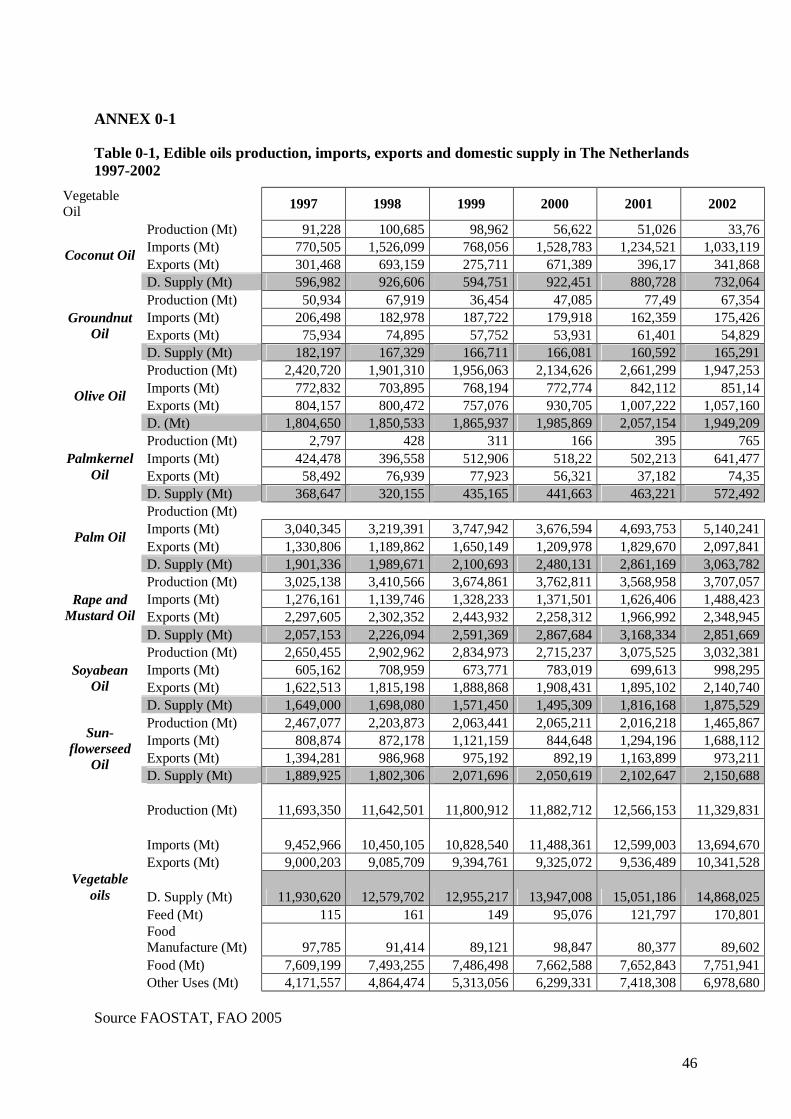
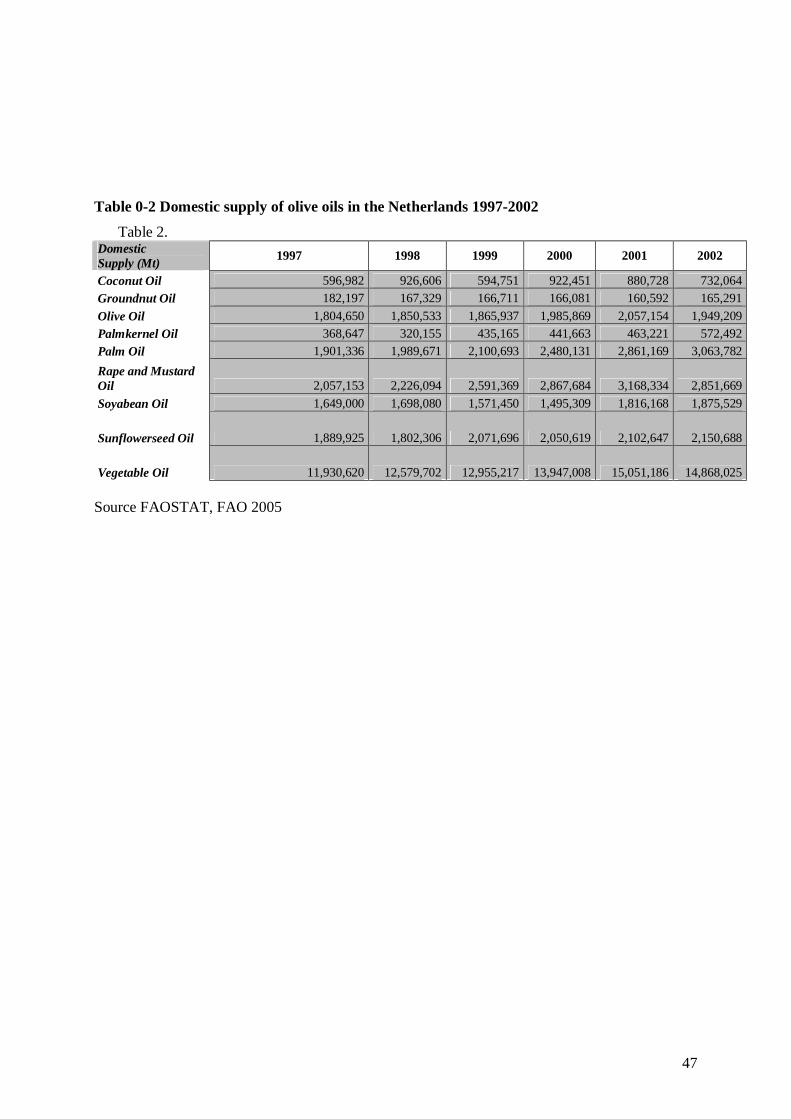
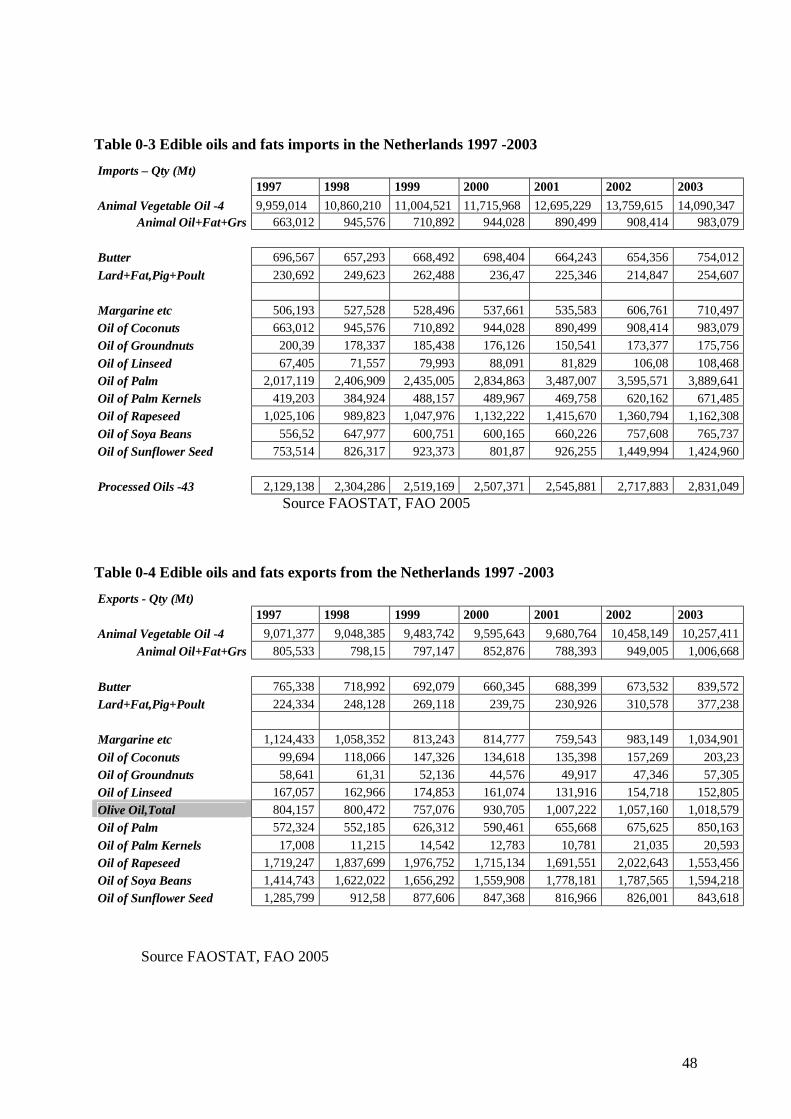
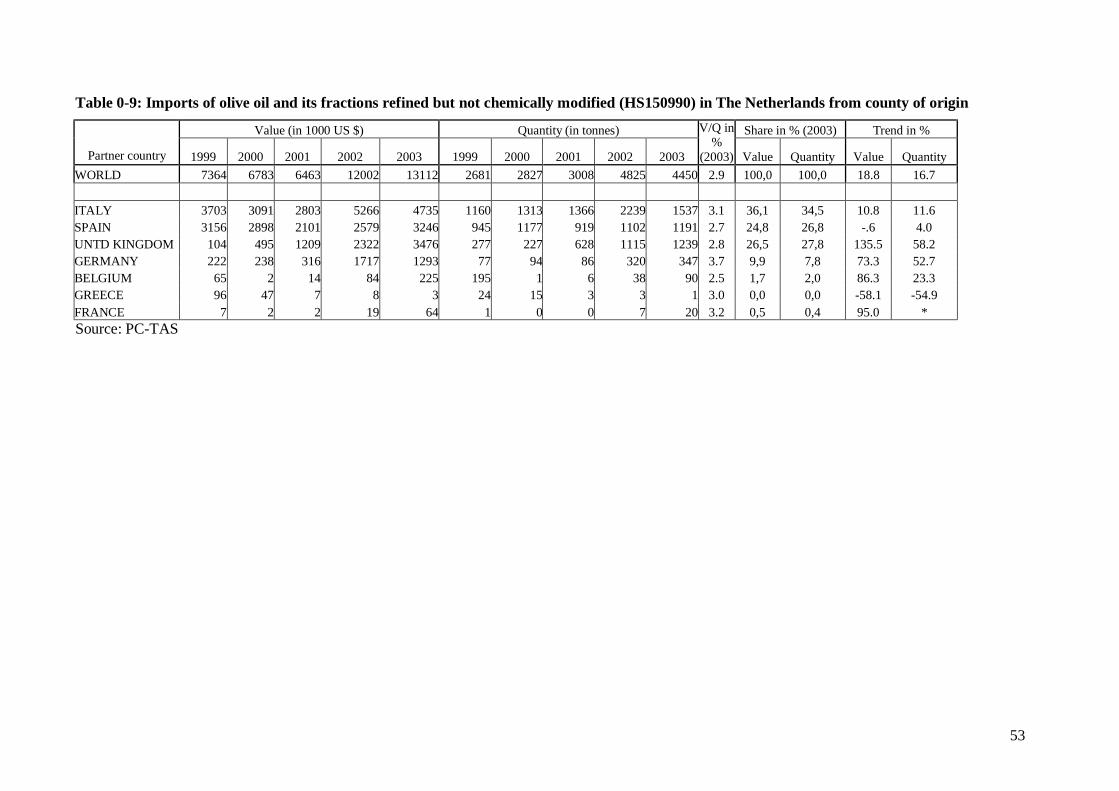
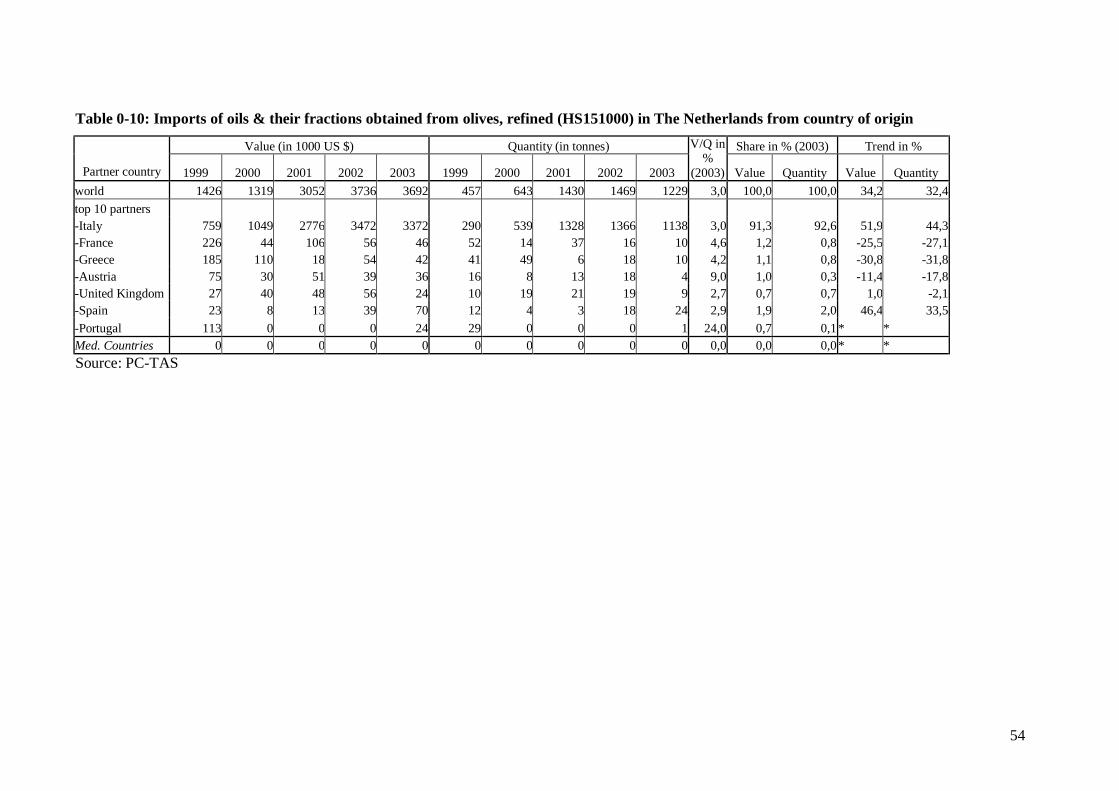
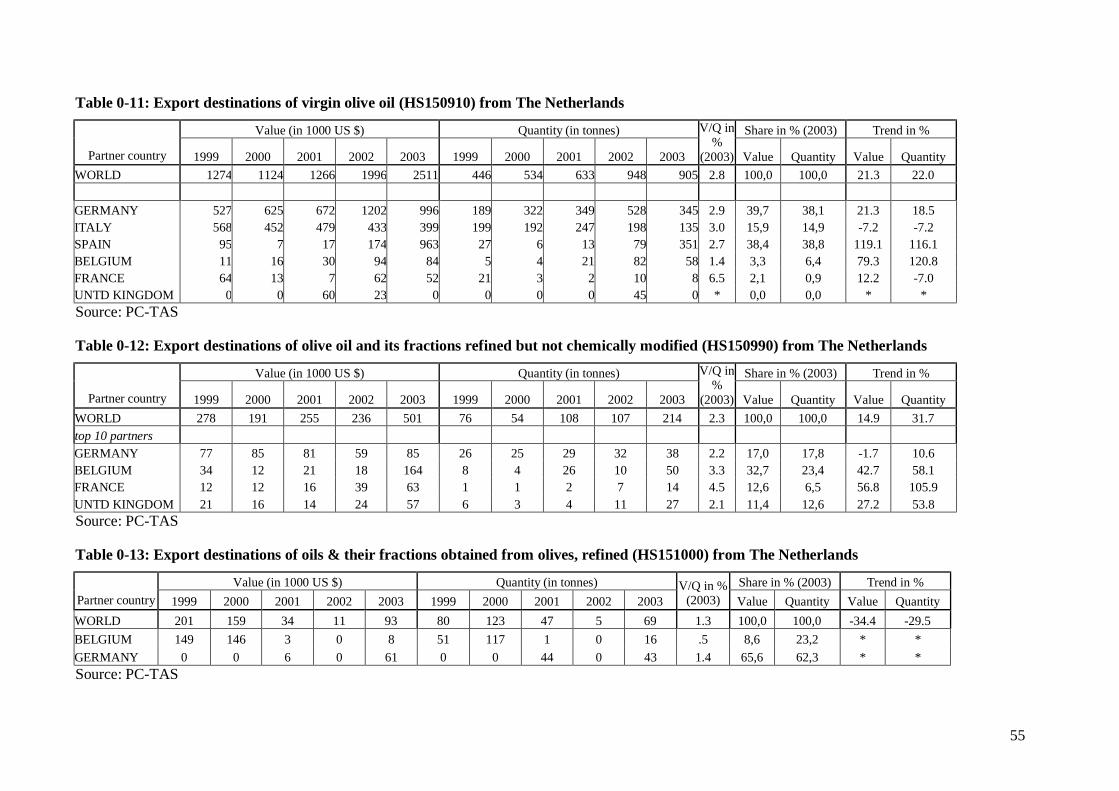
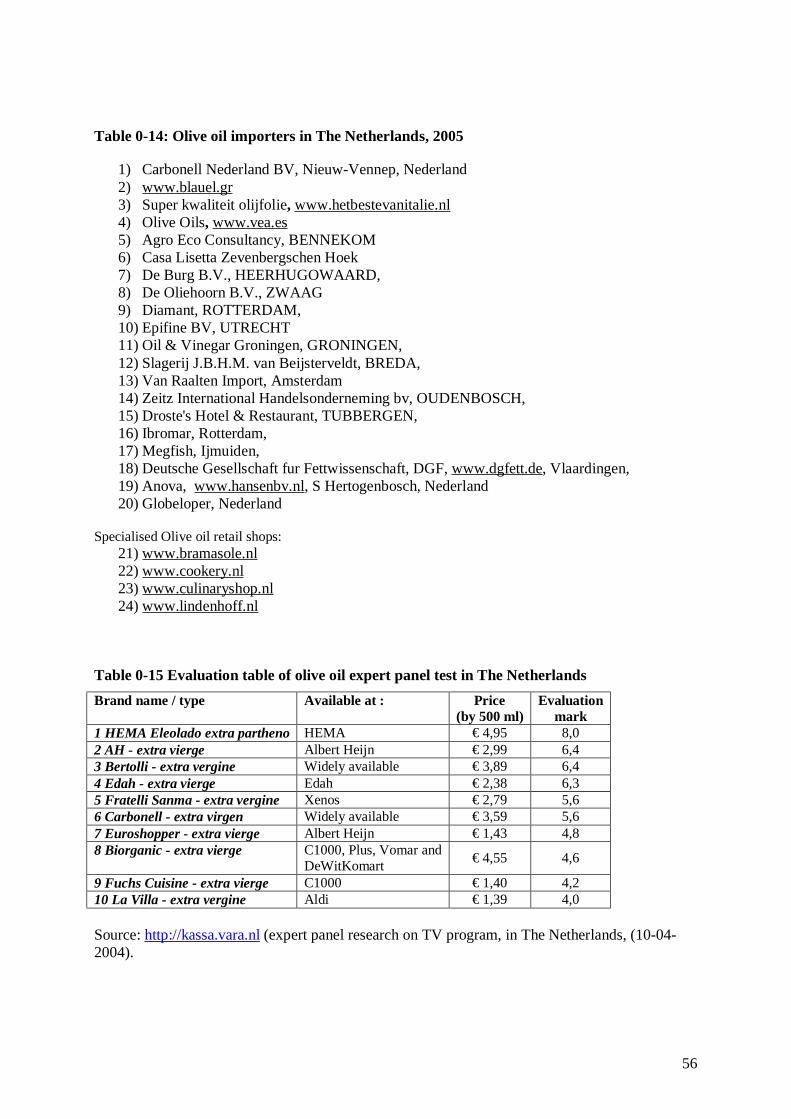
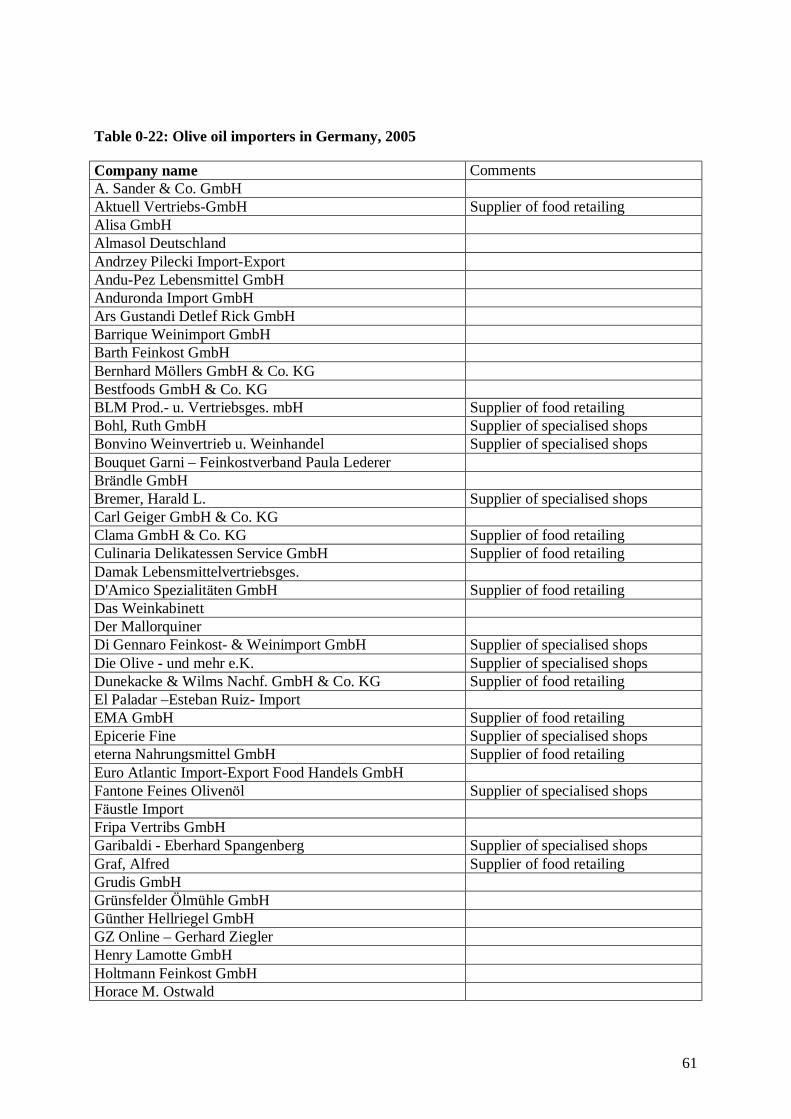
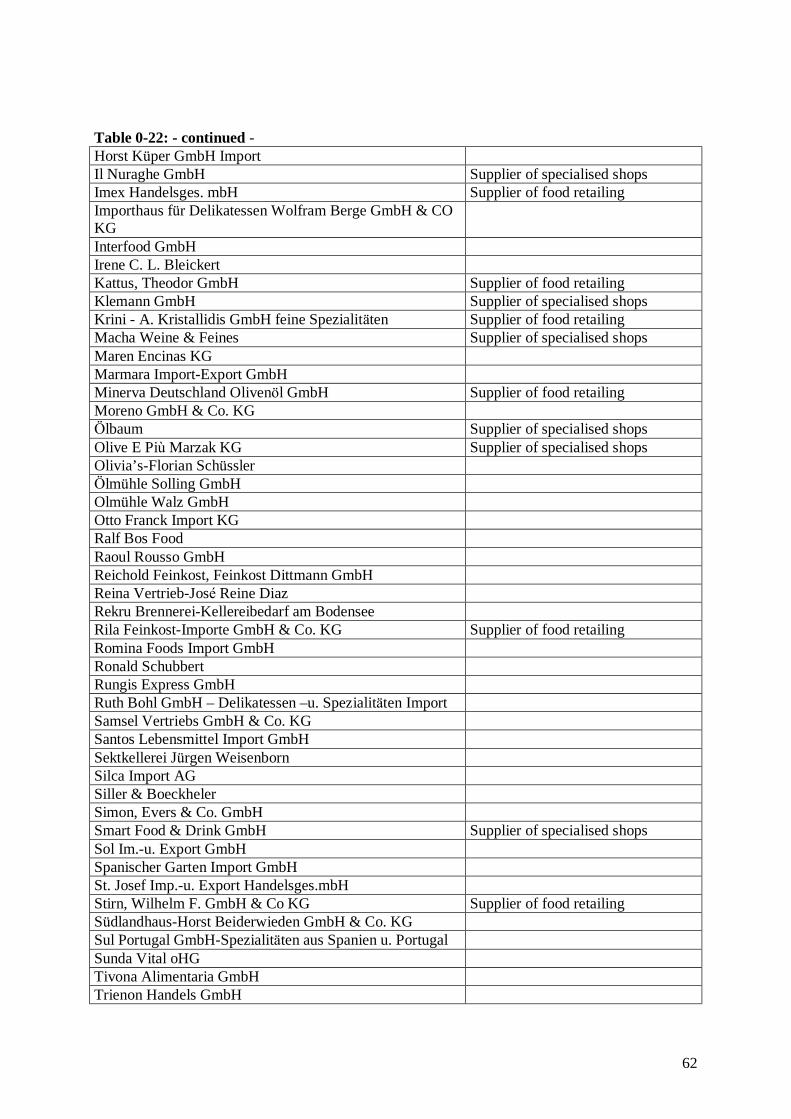
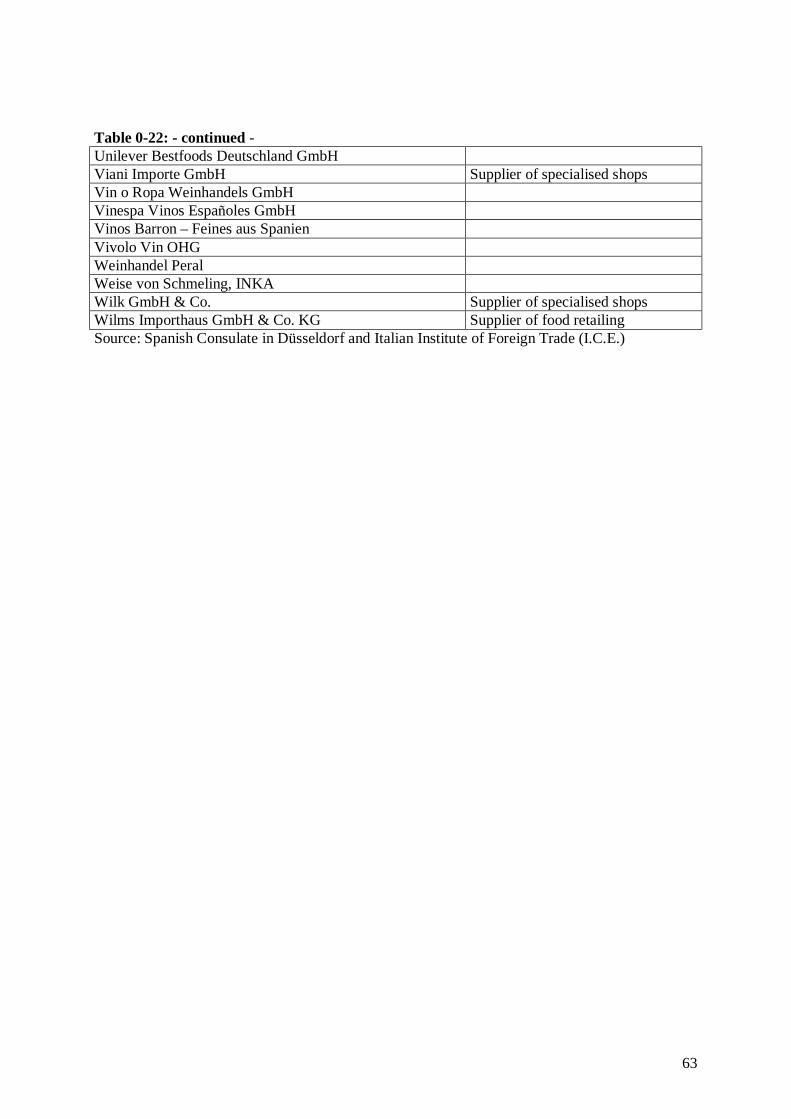
List of tables Table 1-1 Historical figures and future estimates for world production and consumption of Olive Oil, ............... 8 Table 2-1 Trends in animal fats (AF), butter (But.) and vegetables oils (VO), in 1000 tonnes in The Netherlands....................................................................................................................................................................... 16 Table 2-2 Composition of average per capita consumption of edible oils and fats in The Netherlands in 2002.. 17 Table 2-3 Trend of olive oil consumption in the Netherlands............................................................................ 18 Table 2-4 Trend of olive oil imports in The Netherlands .................................................................................. 18 Table 3-1: Market developments of all oils and fats (AF) and vegetable oils and fats (VO) in 1,000 tonnes in Germany......................................................................................................................................................... 32 Table 3-2: Consumption of olive oil in Germany.............................................................................................. 33 Table 0-1, Edible oils production, imports, exports and domestic supply in The Netherlands 1997-2002........... 46 Table 0-2 Domestic supply of olive oils in the Netherlands 1997-2002............................................................. 47 Table 0-3 Edible oils and fats imports in the Netherlands 1997 -2003.............................................................. 48 Table 0-4 Edible oils and fats exports from the Netherlands 1997 -2003 .......................................................... 48 Table 0-5 Olive oil domestic supply in EU-25 countries 1990 -2002 ................................................................ 49 Table 0-6 Edible oils and fats average per capita consumption in EU-25 countries in 2002 ............................. 50 Table 0-7 Trends in edible oils and fats average per capita consumption in EU-15 1990 -2002....................... 51 Table 0-8: Imports of virgin olive oil (HS150910) in The Netherlands from country of origin........................... 52 Table 0-9: Imports of olive oil and its fractions refined but not chemically modified (HS150990) in The Netherlands from county of origin................................................................................................................... 53 Table 0-10: Imports of oils & their fractions obtained from olives, refined (HS151000) in The Netherlands from country of origin............................................................................................................................................. 54 Table 0-11: Export destinations of virgin olive oil (HS150910) from The Netherlands...................................... 55 Table 0-12: Export destinations of olive oil and its fractions refined but not chemically modified (HS150990) from The Netherlands ..................................................................................................................................... 55 Table 0-13: Export destinations of oils & their fractions obtained from olives, refined from The Netherlands.. 55 Table 0-14: Olive oil importers in The Netherlands, 2005................................................................................ 56 Table 0-15 Evaluation table of olive oil expert panel test in The Netherlands................................................... 56 Table 0-16: Imports of virgin olive oil (HS150910) in Germany from country of origin.................................... 57 Table 0-17: Imports of olive oil and its fractions refined but not chemically modified (HS150990) in Germany from county of origin ...................................................................................................................................... 58 Table 0-18: Imports of oils & their fractions obtained from olives, refined in Germany from country of origin 59 Table 0-19: Export destinations of virgin olive oil (HS150910) from Germany................................................. 59 Table 0-20: Export destinations of olive oil and its fractions refined but not chemically modified (HS150990) from Germany ................................................................................................................................................ 60 Table 0-21: Export destinations of oils & their fractions obtained from olives, refined from Germany............. 60 Table 0-22: Olive oil importers in Germany, 2005........................................................................................... 61
4
1 A European outlook for the olive oil market 1.1 Edible oils and fats
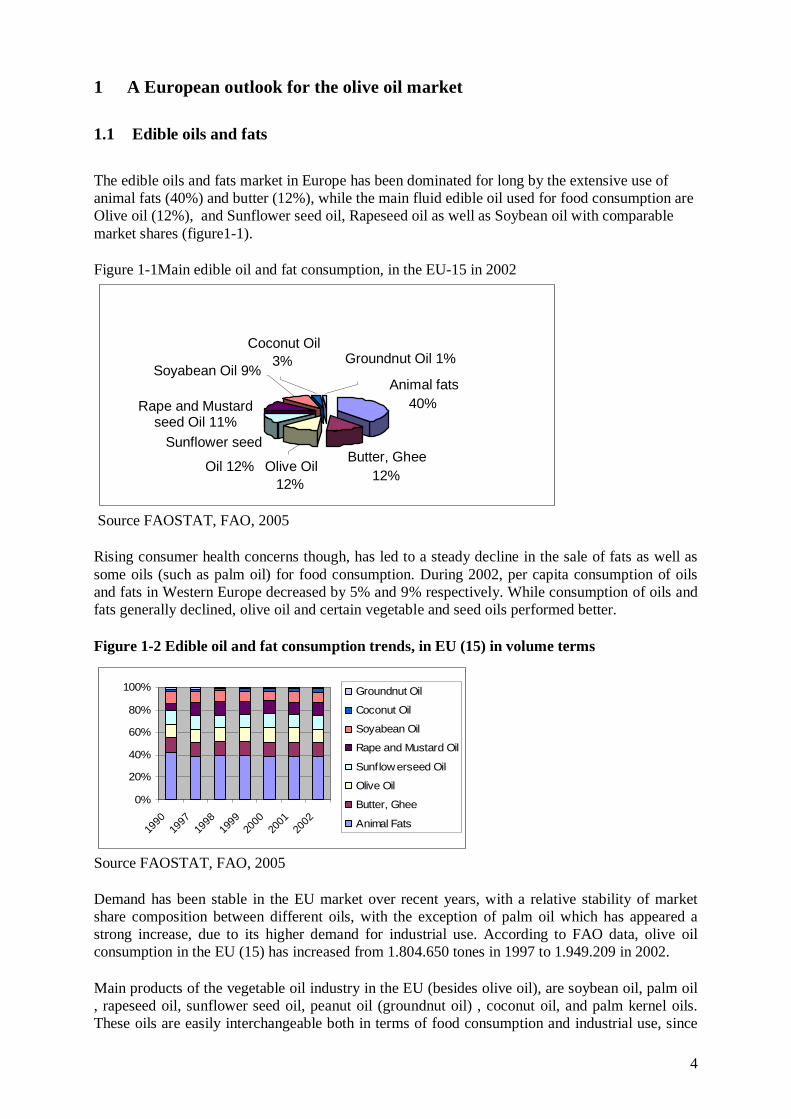
The edible oils and fats market in Europe has been dominated for long by the extensive use of animal fats (40%) and butter (12%), while the main fluid edible oil used for food consumption are Olive oil (12%), and Sunflower seed oil, Rapeseed oil as well as Soybean oil with comparable market shares (figure1-1).
Figure 1-1Main edible oil and fat consumption, in the EU-15 in 2002
Source FAOSTAT, FAO, 2005
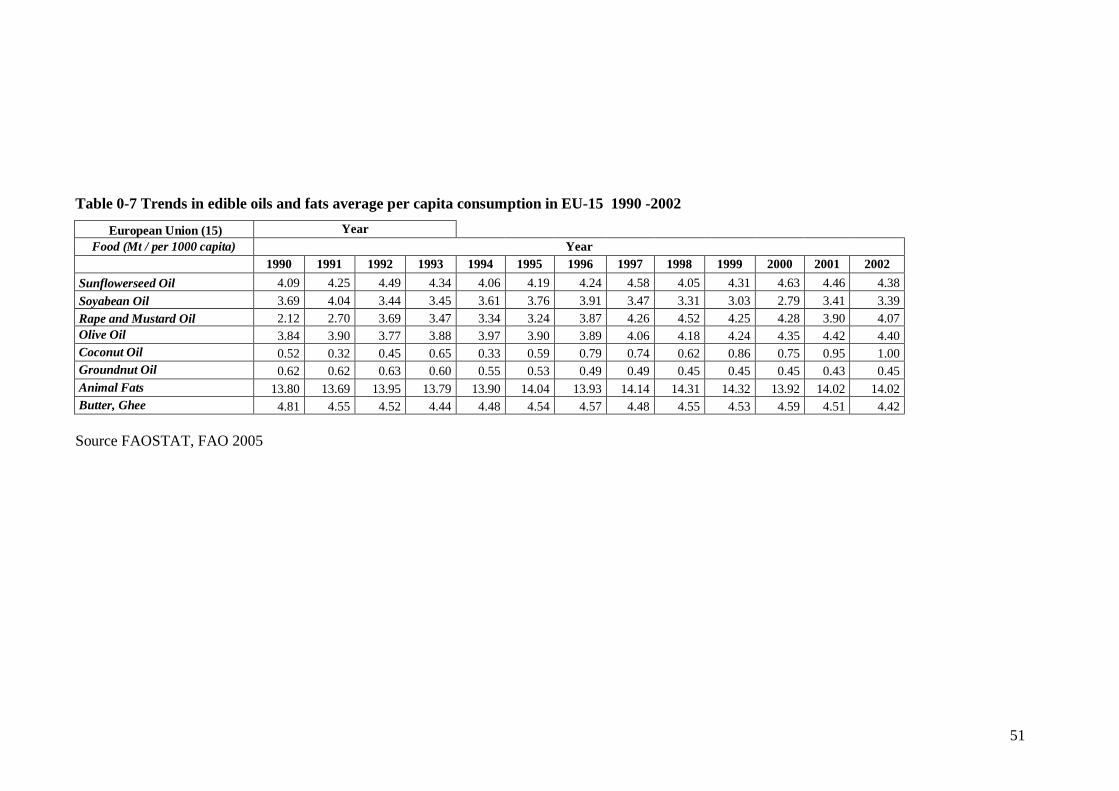
Rising consumer health concerns though, has led to a steady decline in the sale of fats as well as some oils (such as palm oil) for food consumption. During 2002, per capita consumption of oils and fats in Western Europe decreased by 5% and 9% respectively. While consumption of oils and fats generally declined, olive oil and certain vegetable and seed oils performed better.
Figure 1-2 Edible oil and fat consumption trends, in EU (15) in volume terms
0%
20%
40%
60%
80%
100%
1990
1997
1998
1999
2000
2001
2002
Groundnut Oil
Coconut Oil
Soyabean Oil
Rape and Mustard Oil
Sunflowerseed Oil
Olive Oil
Butter, Ghee
Animal Fats
Source FAOSTAT, FAO, 2005
Demand has been stable in the EU market over recent years, with a relative stability of market share composition between different oils, with the exception of palm oil which has appeared a strong increase, due to its higher demand for industrial use. According to FAO data, olive oil consumption in the EU (15) has increased from 1.804.650 tones in 1997 to 1.949.209 in 2002.
Main products of the vegetable oil industry in the EU (besides olive oil), are soybean oil, palm oil , rapeseed oil, sunflower seed oil, peanut oil (groundnut oil) , coconut oil, and palm kernel oils. These oils are easily interchangeable both in terms of food consumption and industrial use, since
Butter, Ghee 12%
Animal fats40%
Soyabean Oil 9%
Rape and Mustard seed Oil 11%
Sunflower seed Oil 12%
Olive Oil
12%
Coconut Oil 3% Groundnut Oil 1%
-
5
they have similar physical and chemical characteristics. Among these oils, soybean and palm oils constitute more than 40% of the world production and exports.
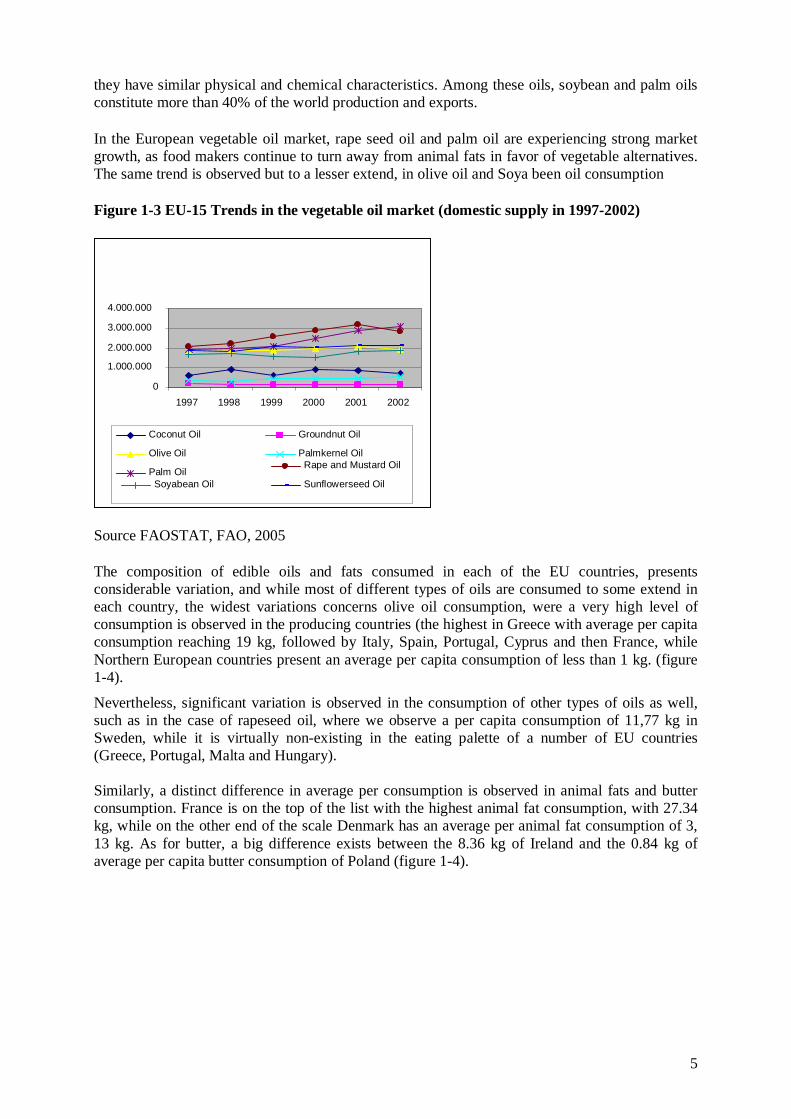
In the European vegetable oil market, rape seed oil and palm oil are experiencing strong market growth, as food makers continue to turn away from animal fats in favor of vegetable alternatives. The same trend is observed but to a lesser extend, in olive oil and Soya been oil consumption
Figure 1-3 EU-15 Trends in the vegetable oil market (domestic supply in 1997-2002)
Source FAOSTAT, FAO, 2005
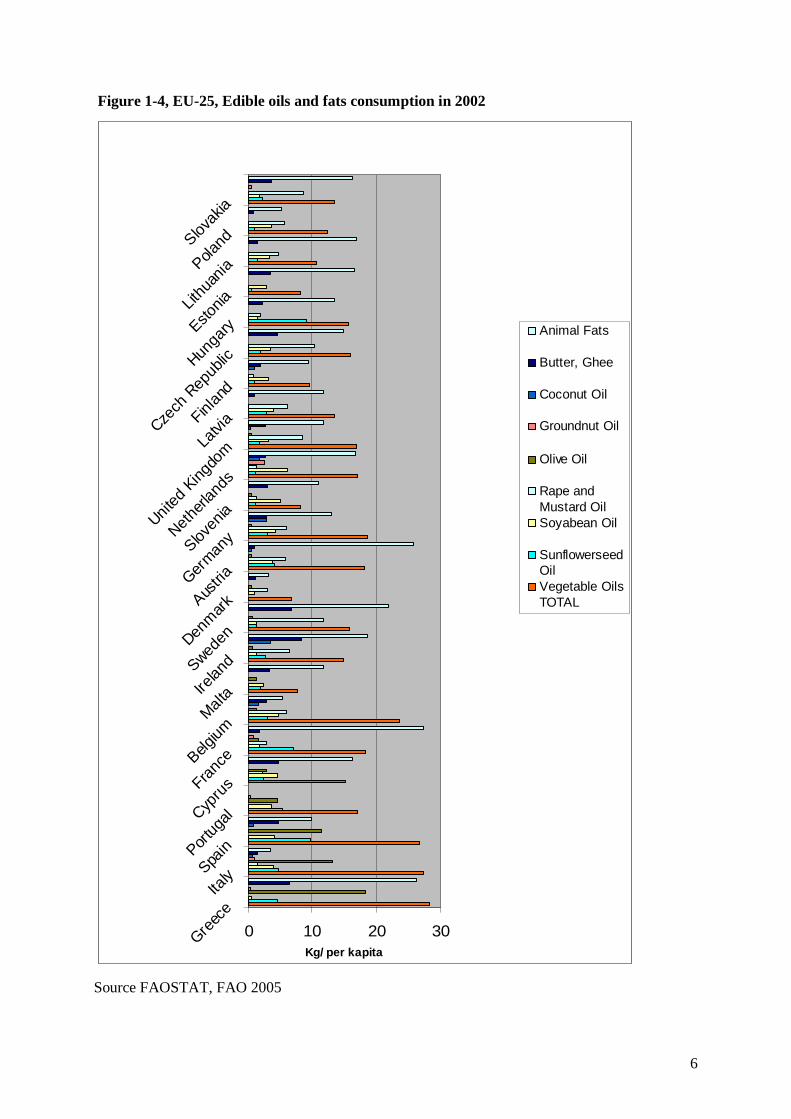
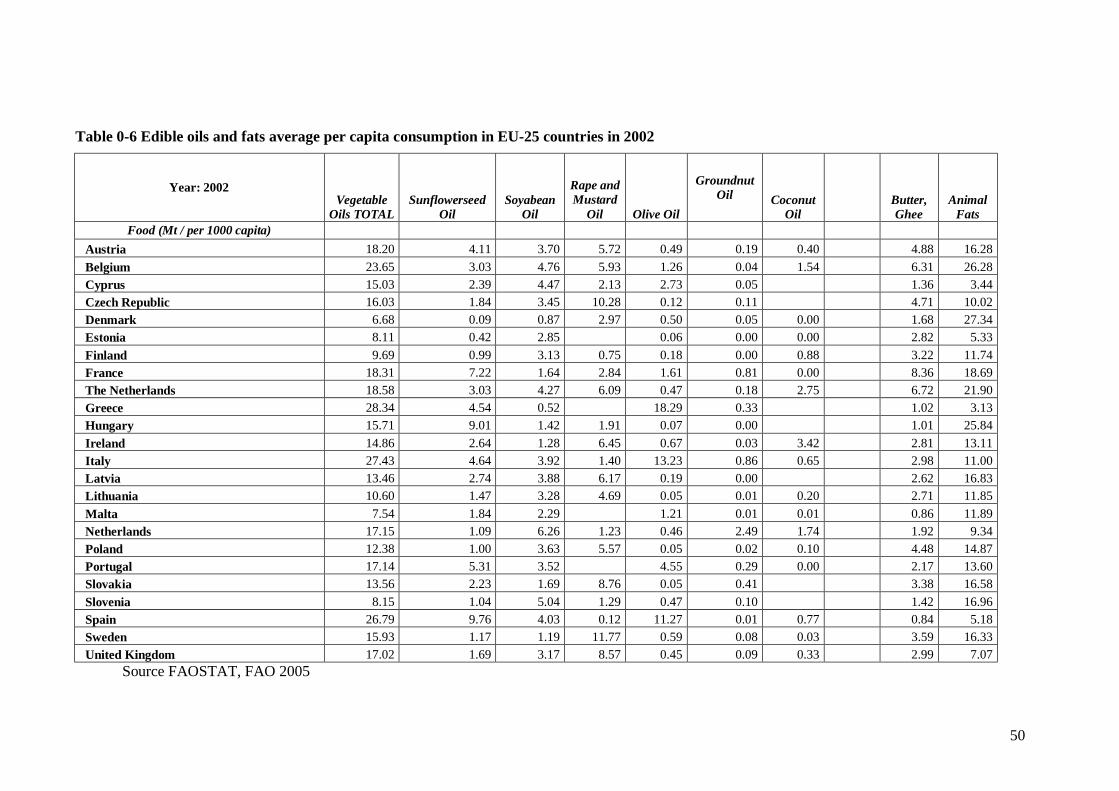
The composition of edible oils and fats consumed in each of the EU countries, presents considerable variation, and while most of different types of oils are consumed to some extend in each country, the widest variations concerns olive oil consumption, were a very high level of consumption is observed in the producing countries (the highest in Greece with average per capita consumption reaching 19 kg, followed by Italy, Spain, Portugal, Cyprus and then France, while Northern European countries present an average per capita consumption of less than 1 kg. (figure 1-4).
Nevertheless, significant variation is observed in the consumption of other types of oils as well, such as in the case of rapeseed oil, where we observe a per capita consumption of 11,77 kg in Sweden, while it is virtually non-existing in the eating palette of a number of EU countries (Greece, Portugal, Malta and Hungary). Similarly, a distinct difference in average per consumption is observed in animal fats and butter consumption. France is on the top of the list with the highest animal fat consumption, with 27.34 kg, while on the other end of the scale Denmark has an average per animal fat consumption of 3, 13 kg. As for butter, a big difference exists between the 8.36 kg of Ireland and the 0.84 kg of average per capita butter consumption of Poland (figure 1-4).
Figure 1-4, EU-25, Edible oils and fats consumption in 2002
0 10 20 30 G
reece
Italy S
pain P
ortug
al Cyp
rus Fran
ce Belg
ium M
alta Ir
eland S
weden D
enmark Aus
tria Germ
any
Slov
enia
Neth
erlan
ds
Unit
ed K
ingdo
m Latv
ia Finl
and
Cze
ch R
epub
lic Hun
gary E
stonia L
ithua
nia Pola
nd Slov
akia
Kg/ per kapita
Animal Fats
Butter, Ghee
Coconut Oil
Groundnut Oil
Olive Oil
Rape andMustard OilSoyabean Oil
SunflowerseedOilVegetable OilsTOTAL
Source FAOSTAT, FAO 2005
7
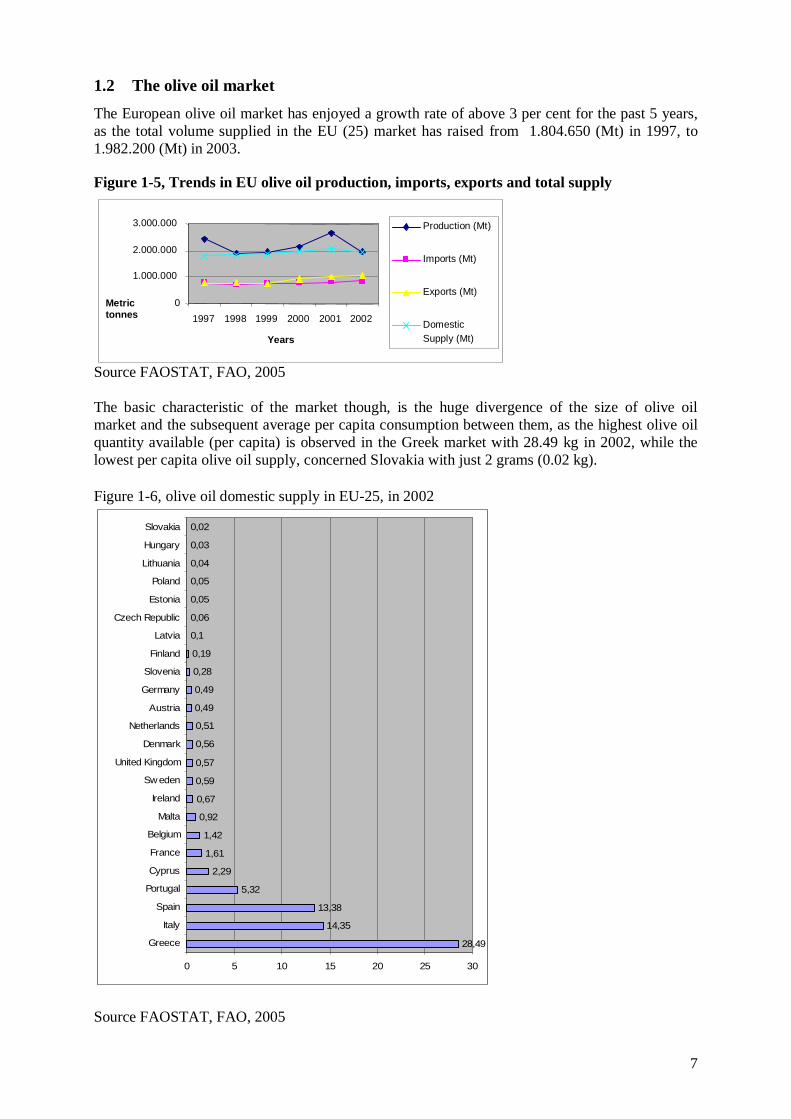
1.2 The olive oil market The European olive oil market has enjoyed a growth rate of above 3 per cent for the past 5 years, as the total volume supplied in the EU (25) market has raised from 1.804.650 (Mt) in 1997, to 1.982.200 (Mt) in 2003.
Figure 1-5, Trends in EU olive oil production, imports, exports and total supply
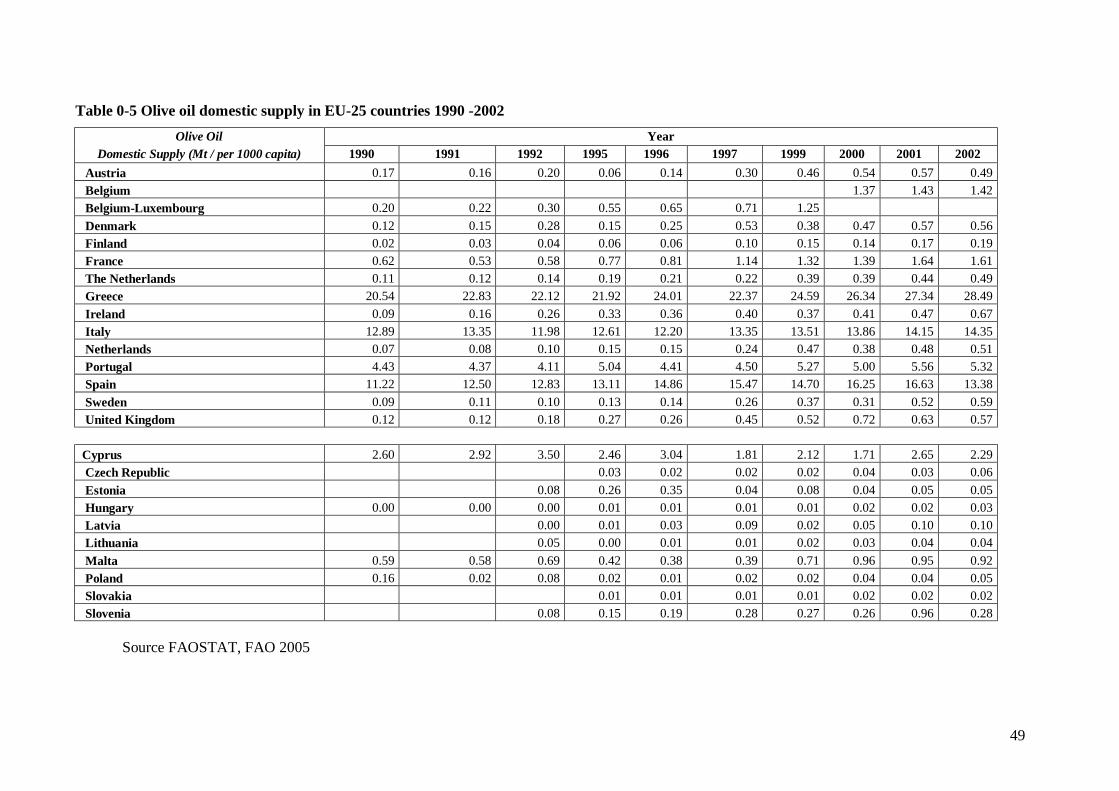
Source FAOSTAT, FAO, 2005 The basic characteristic of the market though, is the huge divergence of the size of olive oil market and the subsequent average per capita consumption between them, as the highest olive oil quantity available (per capita) is observed in the Greek market with 28.49 kg in 2002, while the lowest per capita olive oil supply, concerned Slovakia with just 2 grams (0.02 kg).
Figure 1-6, olive oil domestic supply in EU-25, in 2002
28,49
14,35
13,38
5,32
2,29
1,61
1,42
0,92
0,67
0,59
0,57
0,56
0,51
0,49
0,49
0,28
0,19
0,1
0,06
0,05
0,05
0,04
0,03
0,02
0 5 10 15 20 25 30
Greece
Italy
Spain
Portugal
Cyprus
France
Belgium
Malta
Ireland
Sw eden
United Kingdom
Denmark
Netherlands
Austria
Germany
Slovenia
Finland
Latvia
Czech Republic
Estonia
Poland
Lithuania
Hungary
Slovakia
Source FAOSTAT, FAO, 2005
0
1.000.000
2.000.000
3.000.000
1997 1998 1999 2000 2001 2002 Years
Metric tonnes
Production (Mt)
Imports (Mt)
Exports (Mt)
Domestic Supply (Mt)
8
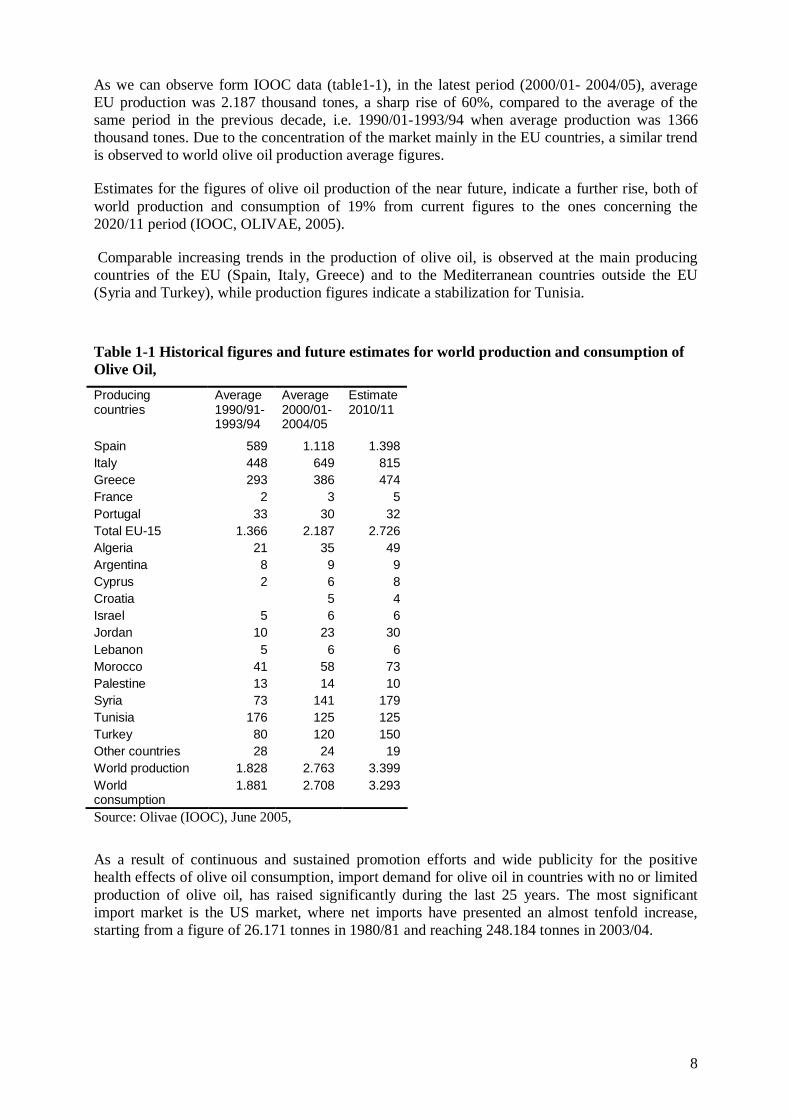
As we can observe form IOOC data (table1-1), in the latest period (2000/01- 2004/05), average EU production was 2.187 thousand tones, a sharp rise of 60%, compared to the average of the same period in the previous decade, i.e. 1990/01-1993/94 when average production was 1366 thousand tones. Due to the concentration of the market mainly in the EU countries, a similar trend is observed to world olive oil production average figures.
Estimates for the figures of olive oil production of the near future, indicate a further rise, both of world production and consumption of 19% from current figures to the ones concerning the 2020/11 period (IOOC, OLIVAE, 2005).
Comparable increasing trends in the production of olive oil, is observed at the main producing countries of the EU (Spain, Italy, Greece) and to the Mediterranean countries outside the EU (Syria and Turkey), while production figures indicate a stabilization for Tunisia.
Table 1-1 Historical figures and future estimates for world production and consumption of Olive Oil, Producing countries
Average 1990/91-1993/94
Average 2000/01-2004/05
Estimate 2010/11
Spain 589 1.118 1.398 Italy 448 649 815 Greece 293 386 474 France 2 3 5 Portugal 33 30 32 Total EU-15 1.366 2.187 2.726 Algeria 21 35 49 Argentina 8 9 9 Cyprus 2 6 8 Croatia 5 4 Israel 5 6 6 Jordan 10 23 30 Lebanon 5 6 6 Morocco 41 58 73 Palestine 13 14 10 Syria 73 141 179 Tunisia 176 125 125 Turkey 80 120 150 Other countries 28 24 19 World production 1.828 2.763 3.399 World consumption
1.881 2.708 3.293
Source: Olivae (IOOC), June 2005,
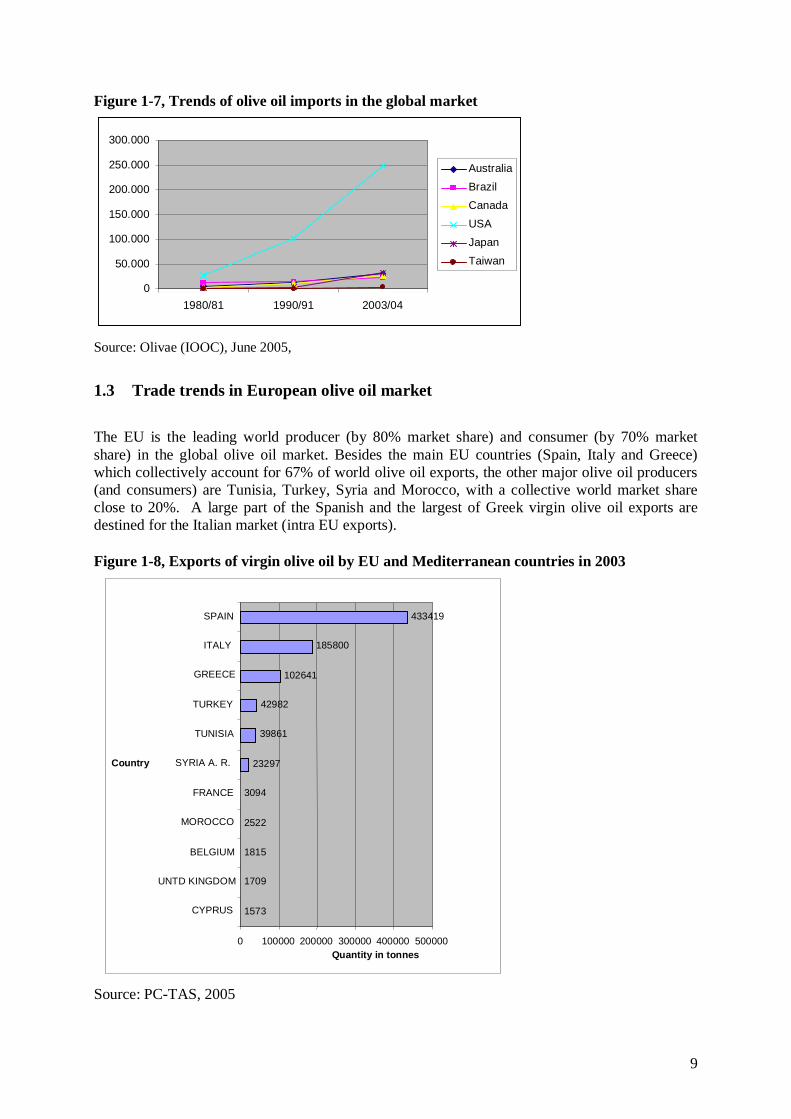
As a result of continuous and sustained promotion efforts and wide publicity for the positive health effects of olive oil consumption, import demand for olive oil in countries with no or limited production of olive oil, has raised significantly during the last 25 years. The most significant import market is the US market, where net imports have presented an almost tenfold increase, starting from a figure of 26.171 tonnes in 1980/81 and reaching 248.184 tonnes in 2003/04.
9
Figure 1-7, Trends of olive oil imports in the global market
Source: Olivae (IOOC), June 2005,
1.3 Trade trends in European olive oil market
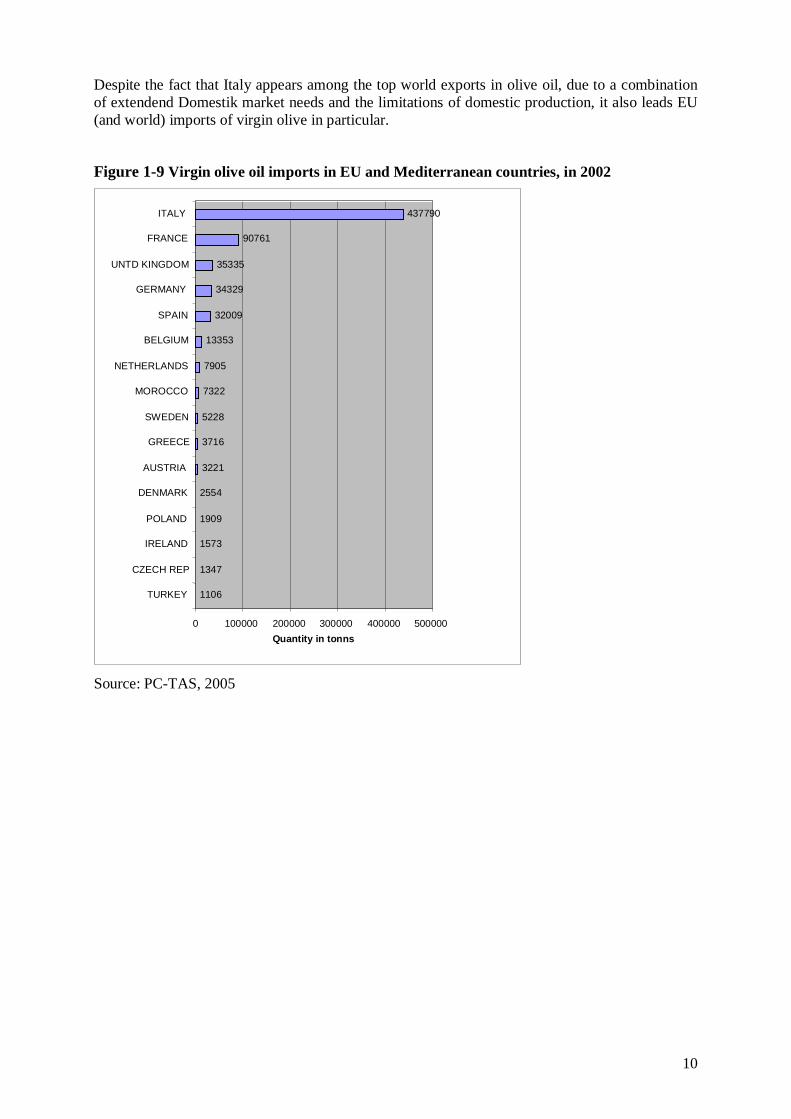
The EU is the leading world producer (by 80% market share) and consumer (by 70% market share) in the global olive oil market. Besides the main EU countries (Spain, Italy and Greece) which collectively account for 67% of world olive oil exports, the other major olive oil producers (and consumers) are Tunisia, Turkey, Syria and Morocco, with a collective world market share close to 20%. A large part of the Spanish and the largest of Greek virgin olive oil exports are destined for the Italian market (intra EU exports).
Figure 1-8, Exports of virgin olive oil by EU and Mediterranean countries in 2003
Source: PC-TAS, 2005
1573
1709
1815
2522
3094
23297
39861
42982
102641
185800
433419
0 100000 200000 300000 400000 500000
CYPRUS
UNTD KINGDOM
BELGIUM
MOROCCO
FRANCE
SYRIA A. R.
TUNISIA
TURKEY
GREECE
ITALY
SPAIN
Country
Quantity in tonnes
0 50.000
100.000 150.000 200.000 250.000 300.000
1980/81 1990/91 2003/04
Australia Brazil Canada USA Japan Taiwan
10
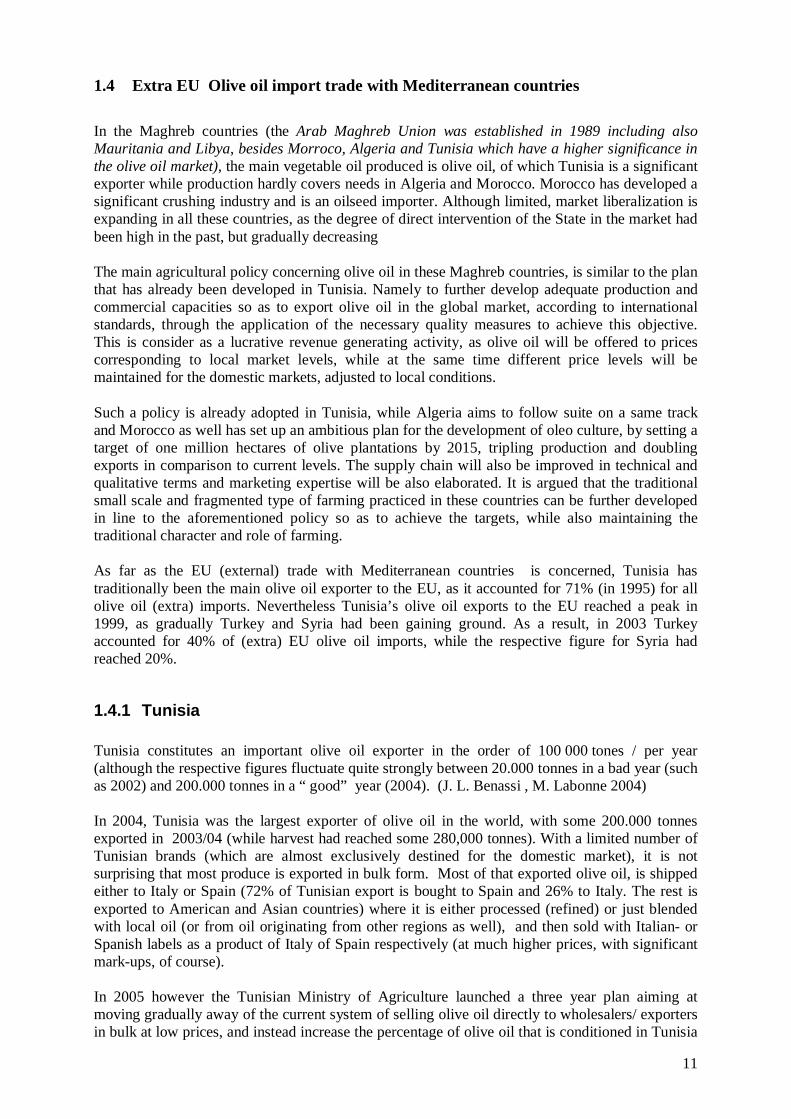
Despite the fact that Italy appears among the top world exports in olive oil, due to a combination of extendend Domestik market needs and the limitations of domestic production, it also leads EU (and world) imports of virgin olive in particular.
Figure 1-9 Virgin olive oil imports in EU and Mediterranean countries, in 2002
Source: PC-TAS, 2005
1106 1347
1573 1909
2554 3221
3716 5228
7322
7905
13353 32009
34329 35335
90761 437790
0 100000 200000 300000 400000 500000
TURKEY CZECH REP
IRELAND POLAND
DENMARK AUSTRIA
GREECE SWEDEN
MOROCCO
NETHERLANDS
BELGIUM SPAIN
GERMANY UNTD KINGDOM
FRANCE ITALY
Quantity in tonns
11
1.4 Extra EU Olive oil import trade with Mediterranean countries In the Maghreb countries (the Arab Maghreb Union was established in 1989 including also Mauritania and Libya, besides Morroco, Algeria and Tunisia which have a higher significance in the olive oil market), the main vegetable oil produced is olive oil, of which Tunisia is a significant exporter while production hardly covers needs in Algeria and Morocco. Morocco has developed a significant crushing industry and is an oilseed importer. Although limited, market liberalization is expanding in all these countries, as the degree of direct intervention of the State in the market had been high in the past, but gradually decreasing The main agricultural policy concerning olive oil in these Maghreb countries, is similar to the plan that has already been developed in Tunisia. Namely to further develop adequate production and commercial capacities so as to export olive oil in the global market, according to international standards, through the application of the necessary quality measures to achieve this objective. This is consider as a lucrative revenue generating activity, as olive oil will be offered to prices corresponding to local market levels, while at the same time different price levels will be maintained for the domestic markets, adjusted to local conditions. Such a policy is already adopted in Tunisia, while Algeria aims to follow suite on a same track and Morocco as well has set up an ambitious plan for the development of oleo culture, by setting a target of one million hectares of olive plantations by 2015, tripling production and doubling exports in comparison to current levels. The supply chain will also be improved in technical and qualitative terms and marketing expertise will be also elaborated. It is argued that the traditional small scale and fragmented type of farming practiced in these countries can be further developed in line to the aforementioned policy so as to achieve the targets, while also maintaining the traditional character and role of farming. As far as the EU (external) trade with Mediterranean countries is concerned, Tunisia has traditionally been the main olive oil exporter to the EU, as it accounted for 71% (in 1995) for all olive oil (extra) imports. Nevertheless Tunisia’s olive oil exports to the EU reached a peak in 1999, as gradually Turkey and Syria had been gaining ground. As a result, in 2003 Turkey accounted for 40% of (extra) EU olive oil imports, while the respective figure for Syria had reached 20%.
1.4.1 Tunisia Tunisia constitutes an important olive oil exporter in the order of 100 000 tones / per year (although the respective figures fluctuate quite strongly between 20.000 tonnes in a bad year (such as 2002) and 200.000 tonnes in a “ good” year (2004). (J. L. Benassi , M. Labonne 2004) In 2004, Tunisia was the largest exporter of olive oil in the world, with some 200.000 tonnes exported in 2003/04 (while harvest had reached some 280,000 tonnes). With a limited number of Tunisian brands (which are almost exclusively destined for the domestic market), it is not surprising that most produce is exported in bulk form. Most of that exported olive oil, is shipped either to Italy or Spain (72% of Tunisian export is bought to Spain and 26% to Italy. The rest is exported to American and Asian countries) where it is either processed (refined) or just blended with local oil (or from oil originating from other regions as well), and then sold with Italian- or Spanish labels as a product of Italy of Spain respectively (at much higher prices, with significant mark-ups, of course). In 2005 however the Tunisian Ministry of Agriculture launched a three year plan aiming at moving gradually away of the current system of selling olive oil directly to wholesalers/ exporters in bulk at low prices, and instead increase the percentage of olive oil that is conditioned in Tunisia
12
(with a Tunisian brand) and then sold to wholesalers from the current 2%, to a figure between 10% and 20% within three years. The project will be financed by a 5% export tax (levy) in order to undertake more marketing activities by integrating the Tunisian brand into higher value added market niches, through distribution international distribution chains. To undertake such a quality improvement strategy, the Tunisian Olive Oil sector will definitely need better organisation, given that olive production is small scale and fragmented. There are some 1700 oil presses in the country, with 44 downstream producers (packers, bottlers, intermediates) including the National Olive Oil office (“Office Nationale de l'Huile”), which guarantees minimum levels of export prices, aiming to protect farmers’ income. Besides the aforementioned objective, the State intervention is principal in the edible oils market, aiming also at maintaining price balances among the various types of edible oil, in such a way that less favoured groups of consumers have access to these products as well (Benassi J.L. et all 2005). Quality needs to be raised and the production process modernised. In 2004, only 100 (out of 1700 presses) had signed up to the so called “mise à niveau” quality upgrading programme, while experts view the harvesting and pressing methods applied in Tunisia as traditional and inefficient when compared to the EU standards at least.
1.4.2 Turkey
Turkey exported 85,000 tonnes of olive oil in 2001 ( IOOC/ED) which were comprised of 59% in bulk, 21% in barrels and 20% in boxes. Thus, more than half of exports were in bulk form, and Turkey's most important export markets are Italy, Spain and the USA.
Turkey is a producer as well as a consumer, as is the case of all countries producing the olive oil, and consumes about 60,000 tonnes of olive oil per year. Per capita, Greece consumes 21 kg of olive oil, Italy consumes 11 kg, Spain consumes 10 kg, Tunisia consumes 10 kg, Syria consumes 6.2 kg, Portugal consumes 5 kg and Turkey consumes 1 kg, by making it the smallest consumer of olive oil among producing countries.
In Turkey, like in Tunisia, olive cultivation methods (at least agricultural methods applied) remain rather traditional. Absence or disruption of irrigation, pruning and fertilization and combination of olive cultivation with animal husbandry (grazing sheep), as well as traditional harvesting methods (using long poles but absence of nets) are among the basic problems of olive cultivation in Turkey.
The world’s largest producer is Spain and it accounts for half of all world production. It can sell only 30% of its produce as branded, canned and in a small package. This figure is 8% for Greece. For Turkey, it is around 8-10%.
‘Taris’ (www.taris.com.tr, olive and olive oil union of co-operatives, in Izmir, the Aegean region of Western Turkey) is the largest olive oil producer (besides other activities in oilseed crushing, fig and other fruit and nut processing, and marketing), as it exports olive oil to 37 different countries. Due to difficulties faced with high taxation in EU, ‘Taris’ has focused on USA, Canada, Japan, Russia, and Australia. To achieve market penetration , ‘Taris’, doesn’t only rely on traditional exporting methods of bulk quantities to foreign importers but also, establishes and runs direct marketing networks, trough its own retail stores and franchise operations and direct sales to restaurant (600 Italian restaurants) in important markets such as the US and Japan.
There are 33 cooperatives and 27,000 producers who belong to Taris Olive and Olive Oil Agricultural Sales Coopertives Union. In addition, the 28 modern olive pressing facilities, 14 pickling works, independent olive producing facilities, an AR-GE department, an internationally
accredited laboratory serve for delivering most quality products and better customer services with the international quality licenses of ISO9000 and ISO9002. Another olive oil (similar, but more moderate scale) producer and exporter is the ‘Marmarabirlik’ union of co-operatives (consisting of 8 first degree co-operatives with 30.607 members producing olives and olive oil), in the Bursa, North-western region of Turkey (www.marmarabirlik.com.tr). Another smaller union of co-operatives is the “Gyneydogubirlik” with three co-operatives and 4,945 members, while another 6,292 producers process and market their olive oil through 37 small scale co-operatives. The Associations of co-operatives have a widespread organisational network in the olive cultivation regions, through which, they provide support by selling inputs (credit as well), while at the same time they have collection centres for olive oil. By 1992/93 the number of crushing mills was reported to 1005, but by 2005 only 290 mills were reported with five or more employees, with a total capacity of 343,000 tonns. The Turkish olive oil supply chain is also supported through 15 refining facilities, 18 facilities processing and producing olive pomace oil, and 100 olive oil bottling and canning facilities.
1.4.3 Syria: an abitious new project for “High Quality Olive Production and Processing”
Olive is a major crop in the agricultural sector in Syria, since it is the main source of income for a large number of small and medium farmers and the most important commodity in the economy of many (marginal) geographic areas. The olive sector contributes to foreign exchange earnings. "Syria ranks the world's 5th country in producing olive oil (after Spain, Italy, Greece and Tunisia) and exportation of olive oil increased recently to 35,000 tonnes in 2005 from 5,000 tonnes in 2002. Olive oil exports are expected to reach 100,000 tonnes in 2010, as part of a big scale integrated project that has been launched by the Syrian Government, with the contribution of FAO and a multidisciplinary team of experts, know-how and support from Italy, with objective to improve a sustainable, high quality olive and olive oil production and processing sector in Syria. For the time being the olive sector suffers from a series of constraints so much so during the cultivation phase, such as: unknown potential of local varieties, unstable yield due to alternate bearing, inadequate pruning and inadequate disease and pest management methods, as well as during and after harvest, namely: traditional harvesting method, lack of modern processing and packing techniques, combined with absence of quality control methods and equipment (laboratories). Olive oil quality is negatively affected by the small number of big centralized processing facilities, leading to harmful delays in processing. Syrian olive oil export structures are weak with a limited number of small scale exporters, wich are used to handle bulk quantities for olive oil exports, directed to importers in other countries. As result there is no central organisation to coordinate and support export marketing, thus foreign marketing skills are limited. 1.5 Trends in the European olive oil market Both long term historical figures for world olive oil production and consumption reveal a gradual expansion of the world market and expectations for the foreseeable future are similarly bright as well (Luchetti, 2002). Such favourable market conditions, create opportunities for the traditional producing countries of the EU, but also to the non-EU member countries of the Mediterranean region. Not all market conditions should be interpreted as opportunities though, as consumer needs and market requirements (in relation
to food safety and quality regulations), impose also grate restrictions to producers and marketers of olive oil (Mili et al, 2001). Many smaller producers and exporters, establish new export trade activities to export high quality olive oil under their own brands. Consumers want to know the origin of their products and demand more guarantees for the product quality. Currently the majority of the small and medium importers bring in the European market already packaged and labelled olive oil (at the export origin) and distribute it mainly to the food retail. A recently observed consumer trend, is the increasing demand for differentiated olive oil with different aroma (oregano, basilicum etc.) . A driving force for higher olive oil consumption, is its healthier profile (in association with the upsurge of the Mediterranean diet by European consumers), leading to increased (per capita) consumption of olive oil and the decreased consumption of other edible oils and fats (Grigg D., 2001). Major players in the food retailing are the discounters with a share of about 60 % , but specialty stores trough direct supply chains are also increasing their turnover. The largest share of olive oil is marketed under retailer brands (private labels) of either the discounters or the importers, but often of dubious quality (due to unknown origin and characteristics of the content). Although some private label olive oils are often tested and judged as of superior quality/ value ratios, at the same time it often happens that other private label olive oils are found at the lower end of the quality/ cost ratio. As a result, consumers often mistrust private label products and producers or marketers of those products should provide better information and a more clear communication of product attributes with the consumer base. Labelling has to be simplified in order to avoid “free-rider” problems and improve market information for consumers. Opportunities for producers from Mediterranean counties arise since consumers are increasingly more sensitive on olive oil origin and quality assurance issues. To take advantage of such market opportunities though, producers and their organisations in Turkey, Syria, Tunisia and Morocco, should further develop their quality management and international marketing skills, so as to meet the strict requirements of traders and retailers of international supply chains. Recently revised EU legislation on food products (regulation EC 178/2002, The General Food law), which among other stipulations also introduces obligatory provisions for traceability, might help small scale olive oil producers to promote their PDO or in any case single extract types of olive oil, against blended olive oil products that are market at a massive scale by multinationals. Since diverging market segments evolve as a result on the increasingly distinctive product attribute combinations of some consumer segments, we could see more small and medium olive oil producers with better marketing skills (and olive oil coming from protected denomination regions), focusing on the high-end segment, while producers from lower production cost based regions, focusing on cost leadership marketing strategies for the lower-end market segment.
15
Marketing and Consumer Behaviour Group, Dept. of Social Sciences,
Supply chain analysis of the olive oil Market in The Netherlands
By
Prodromos Kalaitzis and Gert van Dijk
16
2 The Netherlands olive oil supply chain 2.1 Introduction The Netherlands has played an important role historically in the development of the vegetable oils and fats industry and import trade, thanks to the formation of the Dutch Unilever (which later developed to a multinational firm that leads the sector up until nowadays), that was established in the country in the beggining of the 20th century oils and fats. It all began by (1817-1880), when the French chemist Hippolyte Mège Mouriès invented the ‘artificial butter’ (margarine) to be used for the troops of Napoleon III. This invention was further elaborated by engineers of the Dutch company Van den Bergh & Jurgens (which was established in Rotterdam in 1891 and drastically improved the production process), paving the way for the subsequent developement of the company to the multinational Unilever, though a merger with the ‘Lever Bros’ company that was producing soap. Since then, The Netherlands developed to a large scale importer of vegetable oils and fats. In relation to the edible oils market in The Netherlands nowadays, the major market trends refer to the decreasing bread consumption (or consumption of different type of bread), and consequently decreased use of margarine as a spread, but also decreased use of margarine for baking or frying when cooking at home. Although margarine replacement products have been introduced to the market aiming to balance the market, the total market for this group of products has significantly declined. In order to respond in these trends, most processing firms have introduced olive oil products in their assortment. As a result, on the one hand, the range of products that contain more olive oil (having replaced other types of oils and/or fats) has increased, while on the other hand olive oil penetration has increased considerably in recent years and all general food retailers continue to expand their olive oil assortment, with more branded and private label olive oils, while at the same time more olive oil is stocked by specialist stores as well. 2.2 The demand side Dutch domestic consumption of fats and oils, margarine and butter, has – after a steady decline since the early 1990’s – stabilised in the year 2000 at an average quantity of approximately 21.5 kg per capita (MVO, 2003).
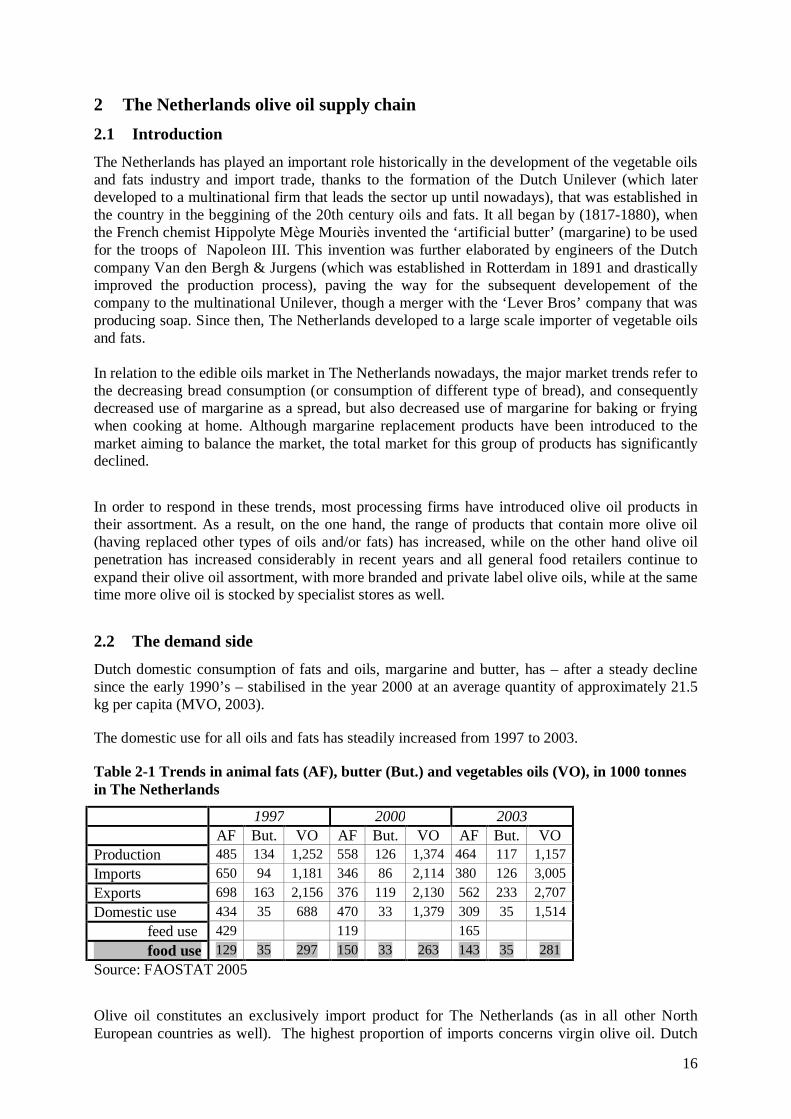
The domestic use for all oils and fats has steadily increased from 1997 to 2003.
Table 2-1 Trends in animal fats (AF), butter (But.) and vegetables oils (VO), in 1000 tonnes in The Netherlands
1997 2000 2003 AF But. VO AF But. VO AF But. VO Production 485 134 1,252 558 126 1,374 464 117 1,157 Imports 650 94 1,181 346 86 2,114 380 126 3,005 Exports 698 163 2,156 376 119 2,130 562 233 2,707 Domestic use 434 35 688 470 33 1,379 309 35 1,514 feed use 429 119 165 food use 129 35 297 150 33 263 143 35 281 Source: FAOSTAT 2005 Olive oil constitutes an exclusively import product for The Netherlands (as in all other North European countries as well). The highest proportion of imports concerns virgin olive oil. Dutch
17
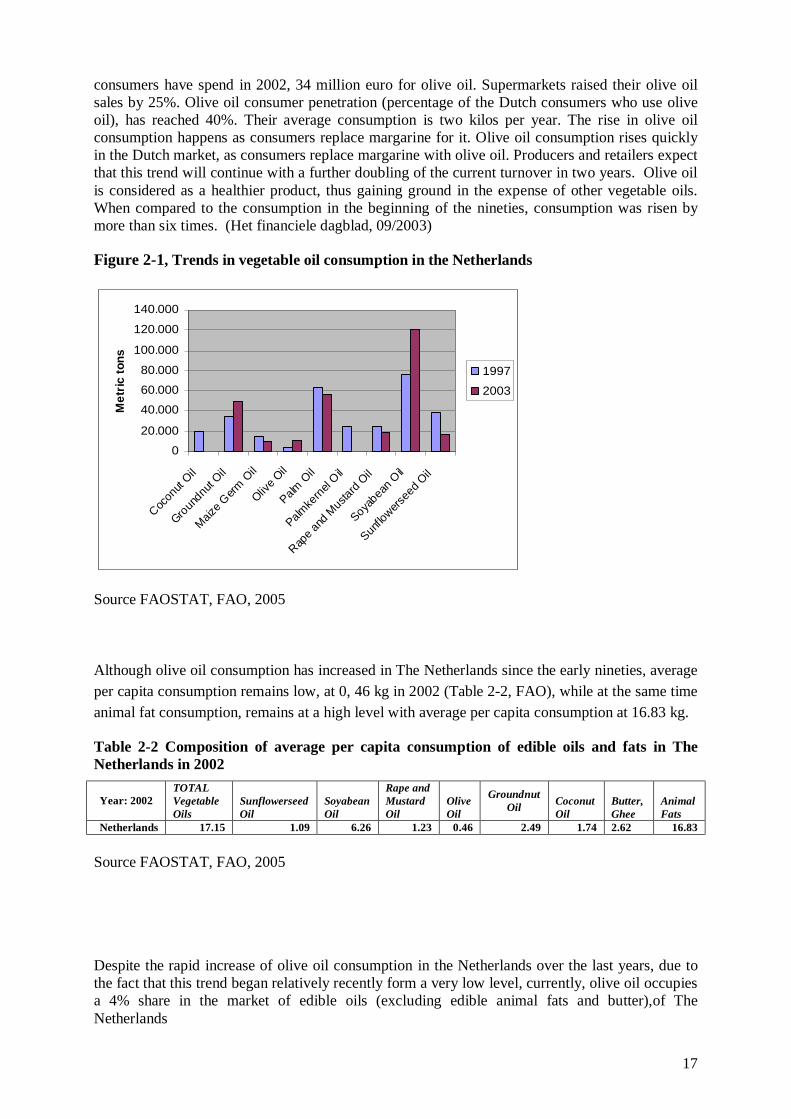
consumers have spend in 2002, 34 million euro for olive oil. Supermarkets raised their olive oil sales by 25%. Olive oil consumer penetration (percentage of the Dutch consumers who use olive oil), has reached 40%. Their average consumption is two kilos per year. The rise in olive oil consumption happens as consumers replace margarine for it. Olive oil consumption rises quickly in the Dutch market, as consumers replace margarine with olive oil. Producers and retailers expect that this trend will continue with a further doubling of the current turnover in two years. Olive oil is considered as a healthier product, thus gaining ground in the expense of other vegetable oils. When compared to the consumption in the beginning of the nineties, consumption was risen by more than six times. (Het financiele dagblad, 09/2003)
Figure 2-1, Trends in vegetable oil consumption in the Netherlands
0
20.000
40.000
60.000
80.000
100.000
120.000
140.000
Cocon
ut Oil
Groun
dnut O
il
Maize G
erm O
il
Olive O
il
Palm O
il
Palmke
rnel O
il
Rape a
nd M
ustar
d Oil
Soyabea
n Oil
Sunflo
wersee
d Oil
Met
ric to
ns
1997
2003
Source FAOSTAT, FAO, 2005
Although olive oil consumption has increased in The Netherlands since the early nineties, average per capita consumption remains low, at 0, 46 kg in 2002 (Table 2-2, FAO), while at the same time animal fat consumption, remains at a high level with average per capita consumption at 16.83 kg.
Table 2-2 Composition of average per capita consumption of edible oils and fats in The Netherlands in 2002
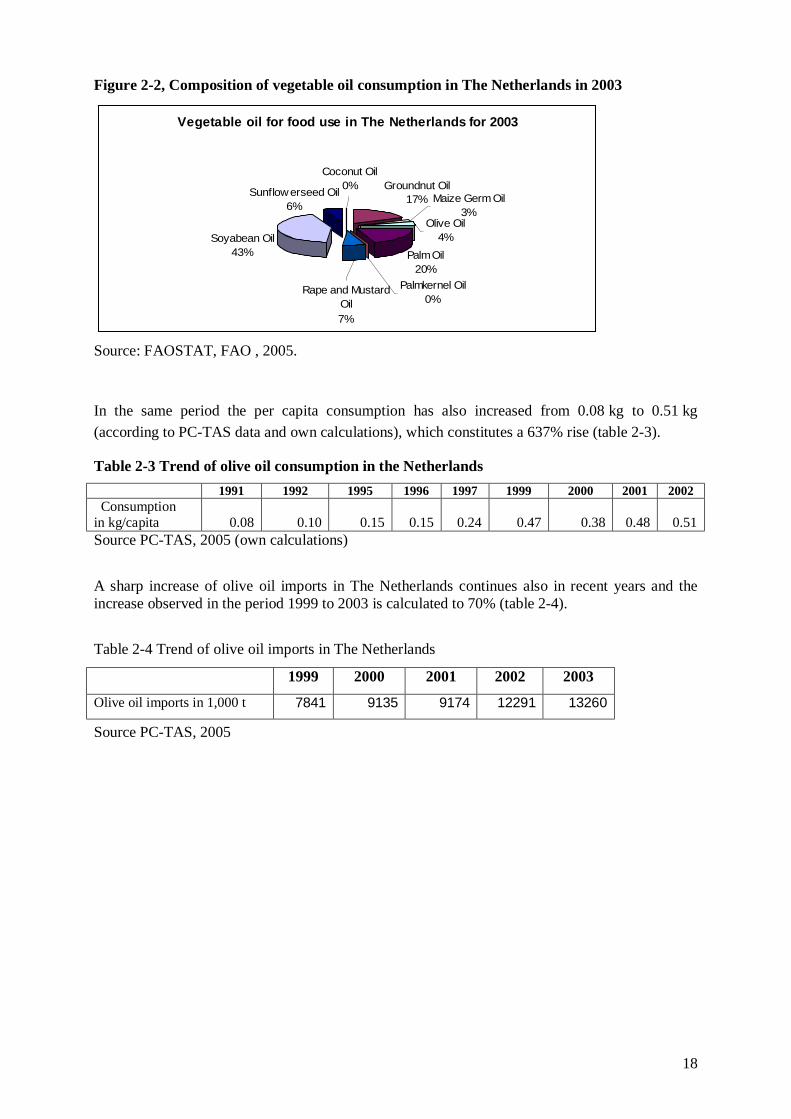
Despite the rapid increase of olive oil consumption in the Netherlands over the last years, due to the fact that this trend began relatively recently form a very low level, currently, olive oil occupies a 4% share in the market of edible oils (excluding edible animal fats and butter),of The Netherlands
18
Figure 2-2, Composition of vegetable oil consumption in The Netherlands in 2003
Vegetable oil for food use in The Netherlands for 2003
Groundnut Oil17%
Palm Oil20%
Soyabean Oil43%
Coconut Oil0%Sunflowerseed Oil
6%
Rape and Mustard Oil7%
Palmkernel Oil0%
Olive Oil4%
Maize Germ Oil3%
Source: FAOSTAT, FAO , 2005.
In the same period the per capita consumption has also increased from 0.08 kg to 0.51 kg (according to PC-TAS data and own calculations), which constitutes a 637% rise (table 2-3).
Table 2-3 Trend of olive oil consumption in the Netherlands 1991 1992 1995 1996 1997 1999 2000 2001 2002
Consumption in kg/capita 0.08 0.10 0.15 0.15 0.24 0.47 0.38 0.48 0.51 Source PC-TAS, 2005 (own calculations) A sharp increase of olive oil imports in The Netherlands continues also in recent years and the increase observed in the period 1999 to 2003 is calculated to 70% (table 2-4). Table 2-4 Trend of olive oil imports in The Netherlands
Source PC-TAS, 2005
1999 2000 2001 2002 2003
Olive oil imports in 1,000 t 7841 9135 9174 12291 13260
19
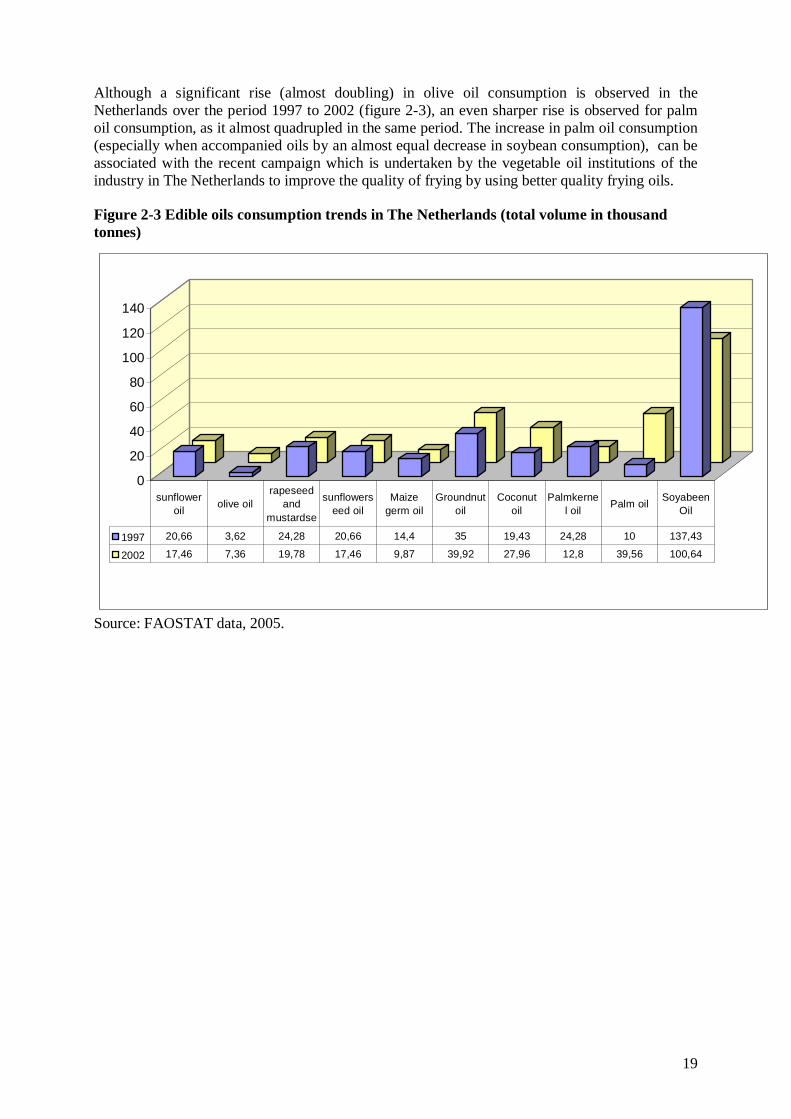
Although a significant rise (almost doubling) in olive oil consumption is observed in the Netherlands over the period 1997 to 2002 (figure 2-3), an even sharper rise is observed for palm oil consumption, as it almost quadrupled in the same period. The increase in palm oil consumption (especially when accompanied oils by an almost equal decrease in soybean consumption), can be associated with the recent campaign which is undertaken by the vegetable oil institutions of the industry in The Netherlands to improve the quality of frying by using better quality frying oils.
Figure 2-3 Edible oils consumption trends in The Netherlands (total volume in thousand tonnes)
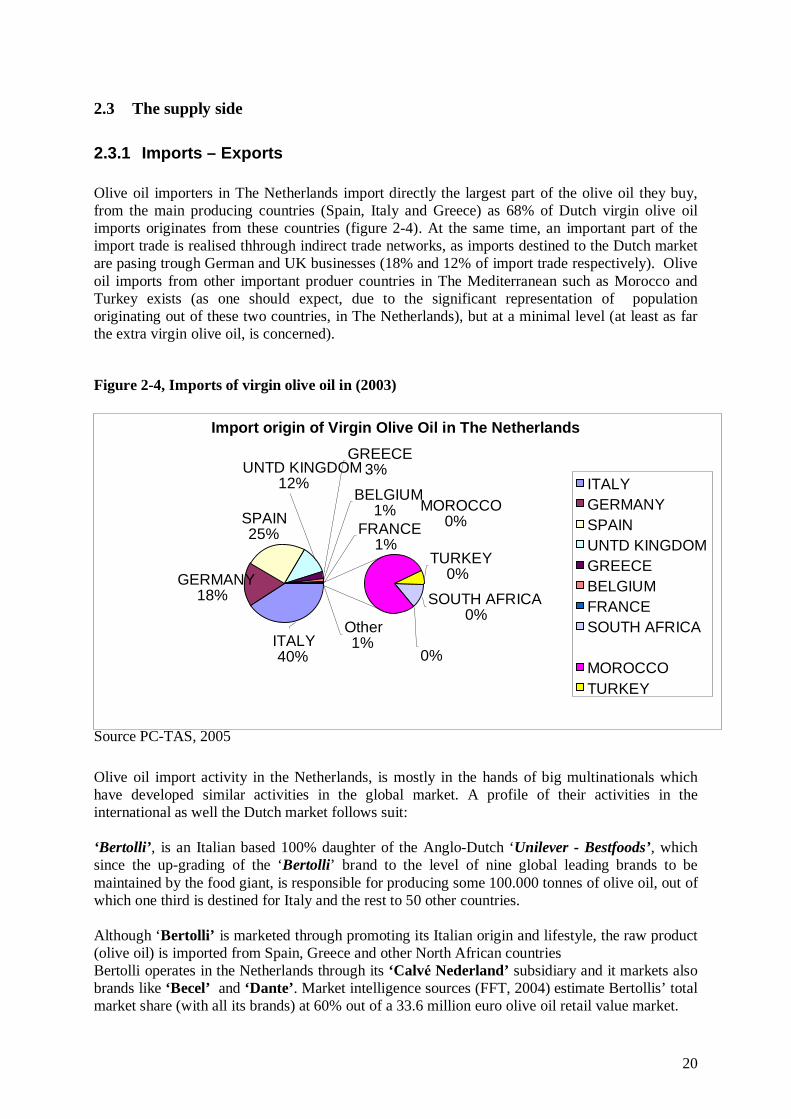
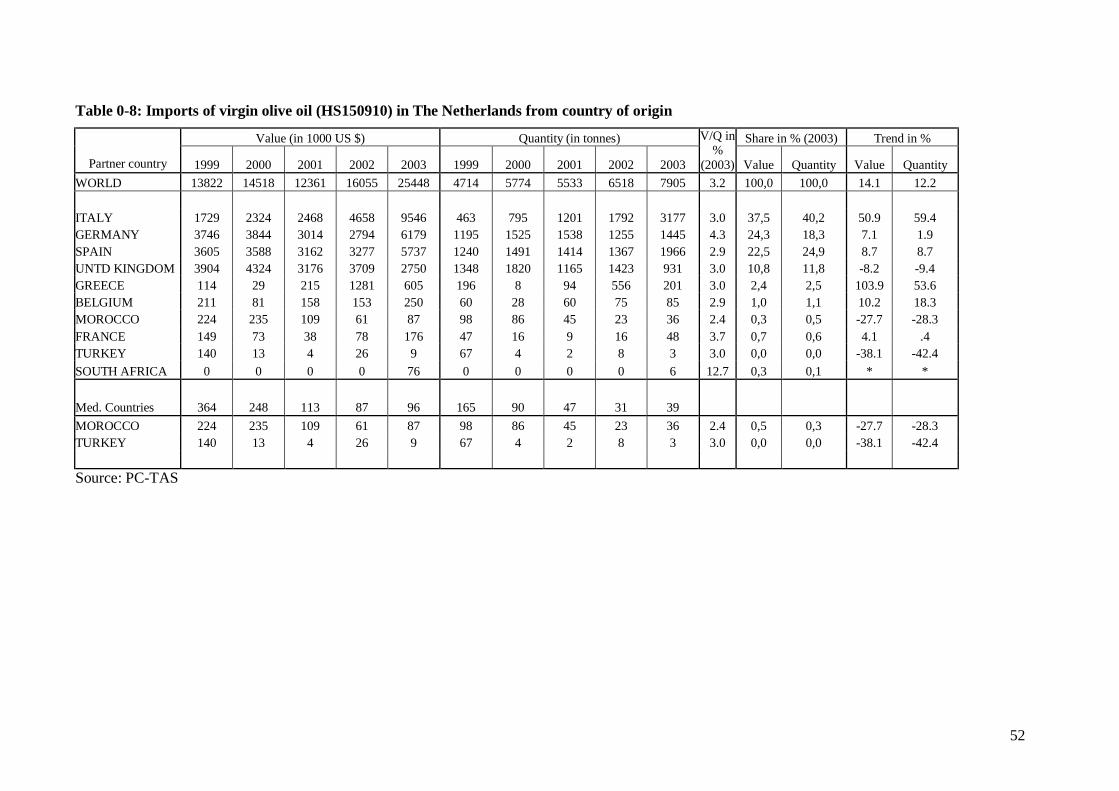
2.3.1 Imports – Exports Olive oil importers in The Netherlands import directly the largest part of the olive oil they buy, from the main producing countries (Spain, Italy and Greece) as 68% of Dutch virgin olive oil imports originates from these countries (figure 2-4). At the same time, an important part of the import trade is realised thhrough indirect trade networks, as imports destined to the Dutch market are pasing trough German and UK businesses (18% and 12% of import trade respectively). Olive oil imports from other important produer countries in The Mediterranean such as Morocco and Turkey exists (as one should expect, due to the significant representation of population originating out of these two countries, in The Netherlands), but at a minimal level (at least as far the extra virgin olive oil, is concerned).
Figure 2-4, Imports of virgin olive oil in (2003)
Source PC-TAS, 2005 Olive oil import activity in the Netherlands, is mostly in the hands of big multinationals which have developed similar activities in the global market. A profile of their activities in the international as well the Dutch market follows suit: ‘Bertolli’, is an Italian based 100% daughter of the Anglo-Dutch ‘Unilever - Bestfoods’, which since the up-grading of the ‘Bertolli’ brand to the level of nine global leading brands to be maintained by the food giant, is responsible for producing some 100.000 tonnes of olive oil, out of which one third is destined for Italy and the rest to 50 other countries. Although ‘Bertolli’ is marketed through promoting its Italian origin and lifestyle, the raw product (olive oil) is imported from Spain, Greece and other North African countries Bertolli operates in the Netherlands through its ‘Calvé Nederland’ subsidiary and it markets also brands like ‘Becel’ and ‘Dante’. Market intelligence sources (FFT, 2004) estimate Bertollis’ total market share (with all its brands) at 60% out of a 33.6 million euro olive oil retail value market.
Import origin of Virgin Olive Oil in The Netherlands
GERMANY 18%
SPAIN 25%
SOUTH AFRICA 0%
0%
TURKEY 0%
UNTD KINGDOM 12%
GREECE3%
BELGIUM 1%
FRANCE1%
Other 1%
MOROCCO 0%
ITALY 40%
ITALY GERMANY SPAIN UNTD KINGDOM GREECE BELGIUM FRANCESOUTH AFRICA
MOROCCO TURKEY
21
Other major competitors in the branded Olive oil market such Salov of Tuscany, also apply this blending practice with the brand “Filippo Berio” in the Dutch and other markets, while at the same time they also market some olive oil product of different composition and characteristics under “Traditionally Tuscany or Sicilian” brands for the Italian market. The Spanish ‘SOS Cuétara’ food group (owned by investment funds and financial bodies) has launched a very offensive business strategy aiming to become a leading international food company. It’s success is evident, since in the last four years, sales have increased fivefold with olive as a spearhead of expansion. To achieve that SOS quickly acquired various Spanish and Italian brands (the Spanish Carbonell and Koipe, and the Italian Carapelli and Minerva), along of course with their distribution networks and of course direct access to their clientele. Such a growth strategy though acquisitions (especially of the Italian firms) was deemed necessary since they exerted a significant market control in the olive oil sector. Similarly SOS acquired food firms in other sectors such as rice and cookies in order to boost distribution and strengthen its position. Under those brands SOS holds a 20 percent share of the US olive oil market and a leading position to the European market as well. In the Netherlands SOS is present through its Carbonell subsidiary (‘Carbonell Nederland BV), but also though the rice distribution section of Sara LEE that it acquired last year. (www.pwc.com/r&c Food for thought, Jan 2006, Special insert 56, retail & consumer words.). Carbonell is estimated to share a 20% of the Dutch olive oil market. ‘Mani® Olive Oil’ (organic), www.blauel.gr, is a vertically integrated firms that produces and bottles organic olive oil in own controlled olive groves in Greece and subsequently markets and distributes its products mainly in Germany, but also in other EU countries, as well as in The Netherlands. ‘Lerida’ and ‘Vea’, are trade names of high quality extra virgin oils, produced in the Spanish province of Leida, www.vea.es and distributed in the ‘De Burg B.V’., is a major European level producer (packer) and distributor of sunflower oil, soy been oil, corn oil, rapeseed oil, olive oil, peanut oil, rapeseed oil. It supplies retailers and caterers with packaging, from 0,75 to 200 liters. Firms active as food providers to wholesalers, retailers and foodservice: ‘De Oliehoorn B.V.’, “Dintel” Spanish olive oil in 5 liters PET bottle (also provides arachide oil, Soya, rapeseed and sunflower seed oil) ‘Diamant’ is a brand under which some frying types of olive oil are marketed in the Dutch market. This brand name was developed by the “van der Berg” a subsidiary of Unilever, but was recently acquired by the Dutch “Van Dijk foods” group, active in the Dutch food market with several other brands related to oils and fats products. ‘Epifine” is a brand name of ‘Unitall B.V’ which markets various specialty edible oil products within a wide range of other delicatessen products.. Another nine small (table )firms are registered as olive oil importers (along with other activities constituting the core of their business field in The Netherlands, but with a limited scale of activities (as regards olive oil import and distribution):
The market share of all the afforementioned brands (except the two leading ones Bertolli and Gruppo SOS is estimated to 20%.
2.3.2 Wholesale trade General Olive oil wholesale points of sale (Six of ‘Hanos’ and another 17 independent cash and carry shops, ‘Makro’ , ‘AH deli XL’ , ‘Sligro’) Such an importer wholesaler for specialist food stores (delicatessen): ‘Casa Lisetta’ imports and distributes Italian olive oil products along with other specialty food and artisan products from Italy
2.3.3 Food industry Established as a commodity trading operation Cargill B.V., based in The Netherlands is today one of Cargill's largest European operations and ranks in the top 20 largest companies in The Netherlands. The group is engaged in processing oilseeds (soybeans, sunflower seed and rapeseed) and in the production of food ingredients as well as in trading and distribution of various agricultural products. Its refineries (Refined Oils Europe) process these oils, as well as coconut, fish and palm oils into high quality refined oils and fats for use in margarine, salad dressing and other food products. In 2005 ‘Associated Oil Packers’ (‘aOP’, a Cargill subsidiary in the Benelux), increased its glass bottling capacity for Olive Oil, from 10 to 20 million litres a year as part of its strategy to strengthen its position in olive oil exports (currently the third largest olive oil exporter out of Spain). aOP has the availability of the most modern taste panels and laboratory equipment, guaranteeing the quality of its olive oils. The production is certified with ISO9002, BRC and Kosher certificates.
2.3.4 Food Retailing According to business intelligence sources (FFT, 2005), olive oil in the Netherlands is mostly distributed trough the retailing channel (92,8%), while the remaining small fraction (7,2%) is consumed trough the foodservice (Hotels, restaurants, catering). Major brands of the Unilever and SOS group (‘Bertolli’, ‘Becel’ and ‘Carbonell’ respectively), are available at most super markets in The Netherlands and represent the biggest share of sales, while more high-end brands like ‘Dante’ and ‘Carapelli’, are sold by delicatessen and other specialty stores, along with other olive oil products that are privately imported at a small scale directly by producers or traders in the producing countries (mostly from Italy, but also Spain and Greece as well).
Although detailed data are not available, private label olive oil products are also available by most super market chains, while some have developed multiple private label olive oil products, with different quality attributes ((UNCTAD, 2005). Blind taste test, by either experts or consumers (table A-15), have frequently assessed private label olive oils as of better quality/value ratio, against most of the A-brand products witch of course receive a much more intensive promotional support from the multinationals.
2.3.5 Specialised shops ‘Oil & Vinegar’ , Based in Oosterhout (Netherlands) Oil & Vinegar is a franchise formula shop, which has been expanded to consist now of 82 shops in 9 European countries and the US. According to a recent statement of the chain store, Oil & Vinegar aims at opening 135 new stores in the USA and South Africa within the next three years, which will eventually reach a number of 300. The chain store specializes on sales of various types of Oil, vinegar and other Mediterranean
23
food (pesto, hand made pasta) and kitchenware items (glass and clay). Most foods can be tested in the stores. It currently runs about one hundred stores in ten countries. This Dutch franchise organization was established in 1999 and it operates 40 stores in The Netherlands. In the Dutch market there also operate another 300 independent specialized butchery, winery, cheese, grocery and general delicatessen stores, which also sell various types of olive oil, which they mostly procure from either cash and carry or delivery wholesalers.
2.3.6 Business relationships between the different players in the supply chain
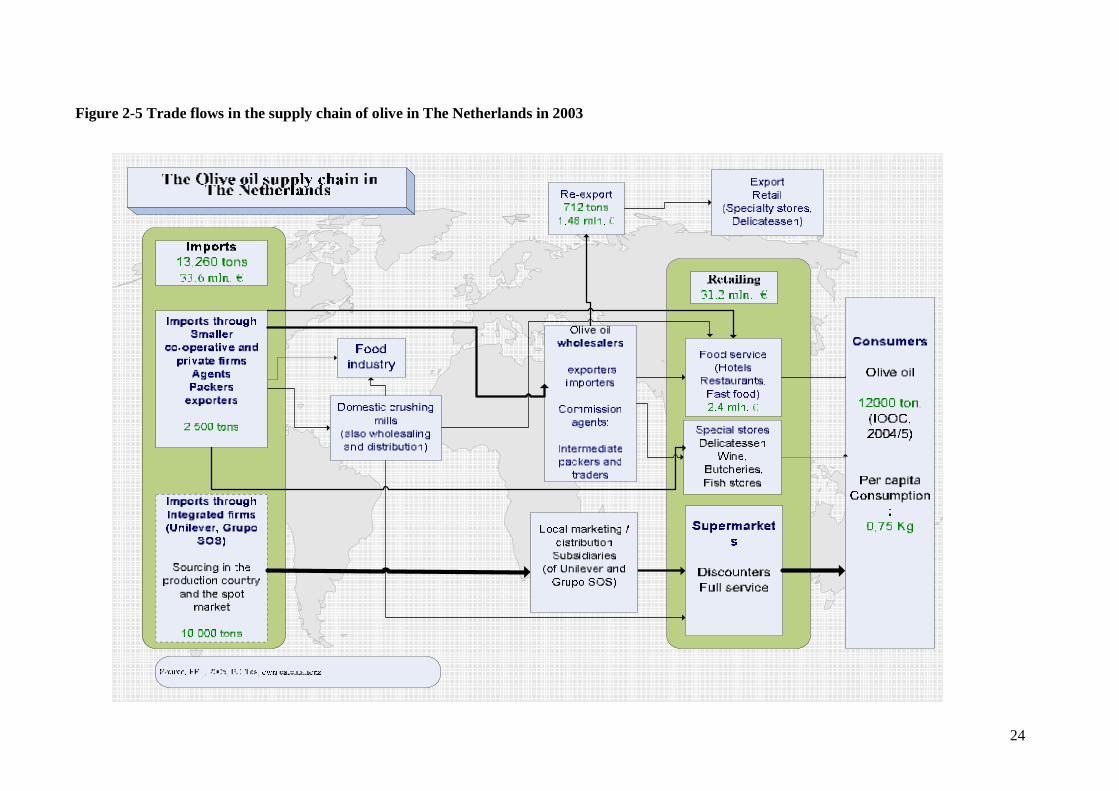
The Dutch oils and fats industry consists of 4 oilseed crushers, 9 animal fat producers, 11 refiners and hardeners, animal rest-products destructors, oleochemical industry, 10 margarine and vegetable oil producers, 48 sauce producers (using various oils and fats as a main ingredient), 8 oils and fats recyclers, 362 traders, and 6 storage and bottling facilities. Thus the Dutch oils and fats industry consisted in 2003, of 410 companies in total. The Dutch oils and fats industry is internationally oriented, as on the one hand it relies heavily on imports, in order to procure primary resources, while on the other hand, exports constitute a most sigficant part of their turnover. In 2003, the Dutch oilseeds, oils and fats industry imported an amount of 2,4 billion euro, while exports reached 1,6 billion euro (Jones and Duerbeck, CBI, 2004). Import and distribution of vegetable oils in the European market is handled by the following parties: Shippers of crude and refined products. Firms based in the producing countries who are active in production and export crude and refined products towards processing firms in the importing countries (EU), or to traders, brokers or other processors. Traders in crude and refined products. Traders buy and sell vegetable oils for their own account and re-sell or re-export these, to other firms in the supply chain. Brokers are intermediaries in the the process of buying and selling, acting on behalf of their customers, on the basis of a commission. Brokers are not involved in the physical trading process, neither do they take posesion of products, Brokers are operating based on their vast information resources, contacts network and experience over market situation, trends, prices and availability. Processors of crude and refined products who crush and refine oils, to make products suitable for use as ingredients for a wide variety of end products in the food and and animal feed industry. Besides processing, some big multinational companies like Cargill and ADM are also directly involved in trading. Nevertheless, as concentration and consolidation is incresing also in this sector, large European processing firms develop direct contacts with suppliers countries, thereby circumventing other middlemen like brokers and traders
24
Figure 2-5 Trade flows in the supply chain of olive in The Netherlands in 2003
25
2.3.7 Quality and labelling issues Grades and classification
The International Olive Oil Council (IOOC) is an international organisation (a multilateral agreement between olive oil producing coutries, created under the auspices of UN) whose main role is to improve olive culture in general by seeting the proper policies and common intrantional rules regarding olives and olive oil quality, grades and trading standards (www.internationaloliveoil.org) .
Industrial grades
The different types of oil extracted from the olive fruit are classified by IOOC as:
Virgin, indicating that the oil was produced by the use of physical means and without any chemical treatment.
Refined, which means that the oil has been chemically treated to neutralize strong unpleasant tastes (usually bitterness) and to decrease acid content. Refined oil is regarded as of lower quality compared to virgin oil and it is not allowed to mix it with virgin oils when at least labels refer to either extra virgin or virgin olive oil.
Pomace olive oil, which means that oil is extracted from the pomace, with the use of chemical solvents( mostly hexane) and through heating techniques.
Basic and essential methods to assert the type of each olive oil produced are
a) Quantitative analytical methods, where the acidity of each olive is determined (by measuring the weight of free oleic acid and expressing that as a percentage contained in this particular sample of olive oil), and
b) Subjective judjement of the taste and other organoleptic characteritics (odour). Expert professional panelists are blind testing the taste to judge for the organoleptic quality level of each olive oil.
Retail grades
The IOOC standards are complicated. The labels in stores, however, clearly show an oil's grade:
Extra-virgin olive oil is produced exclusively from the first pressing of the olives (doesn’t contain any refined olive oil), and it has a maximum acidity of 0.8%, while it has to have superior organoleptic characteristics (taste, aroma, colour).
Virgin olive oil with an acidity that might be reaching a 2%, while it should also be produced from first pressing (not refined), with acceptable (good) taste..
Olive oil is a blend of virgin oil and refined virgin oil, with an acidity of no more that 1% acidity. Many olive oils which are marketed as ‘light olive oils’, usually are officially classified in this category and they have milder taste, odour and colour as a result of the refining and blending processes that have been subject to.
Olive-pomace oil is a blend of refined pomace olive oil and virgin oil. It can be consumed but it should not be called olive oil. It is mostly used for cooking (baking or frying) in the food-service sector.
Lampante oil is olive oil not fit for food consumption (the name itself indicates its origin as it had been used as fuel in oil-burning lamps. It has nevertheless some applications in the industrial market.
Label wording
Olive oil exporters, traders wholesalers and other olive oil suppliers, use sometimes carefully selected wording to create a higher product image that in reality, so as to increase market value of that particular product, while if rules were kept stricter and terminology had been constrained to commonly accepted official terms (IOOC terminology), such misleading wording should have been avoided.
"Imported from Italy, or “bottled in Italy” or “ product of Italy” are terms frequently used by Italian olive oil exporters in order to imply that that the respective olive oil was produced by olives grown in Italy, although in fact (most frequently) that oil was only bottled there. Such labels sometimes do indicate (with small letter though) that the oil was packed in Italy with olives grown elsewhere in the Mediterranean region (Spain, Greece, Turkey, and Tunisia) as Italy imports large quantities of olive oil from these countries in bulk and then processes it (mixing with local olive oil, or produces differne types of blends).
"100% Pure Olive Oil" sounds like a superior product, but in practice it is often olive oil of the lowest quality (with high acidity, or bitter, or inferio organoleptic characteristics). Neverthelles altough this might not be the best choice for salad oil, it could be though perfectly suitable for baking and frying, since heat can destroy the rich flavor of extra-virgin oil, in any case.
"Made from refined olive oils" suggests that this is a fine product whereas in fact means that the final organoleptic charachteristics (color, taste and acidity) were achieved trough a chemical process.
"Light ( or lite), olive oil" suggests a low fat content, whereas in fact it refers to a lighter color. Fact is that all olive oil has the same has the amount of Calories (120) per tablespoon (33 kJ/ml).
"From hand-picked olives", suggests that extraordinary care was given for the production of this oil, whereas there is no proof of the superiority of manual harvesting methods over the most modern (widely applied) tree-shaking method.
“Cold pressed, or first press” is another term which is used to associate this particular olive oil with traditional (thus pure and superior) oil extraction methods, whereas almost all olive oil currently processed by olive mills goes under more modern methods (mostly centrifuge) which imply some degree of higher temperature treatment and certainly doesn’t rely on the old fashioned mechanical presses.
2.3.8 Institutional structure The International Olive Oil Council was created in 1956 (trough the proclamation of the “International Olive Oil Agreement” as multilateral agreement between olive oil producing
27
countries international olive and olive oil market is The creation of the, as a consequence of the entry into force of the, was a true act of faith. sets standards of quality used by the major olive oil producing countries. It officially governs 95 percent of and holds great influence over the rest. IOOC terminology is precise, but it can lead to confusion between the words that describe production and the words used on retail labels. Olive oil is classified by the method applied ofr its production, by its chemical characteristics and by its flavor. Apart from the obvious trade concerns and the need to organise the international olive oil market, this move highlighted the common desire of the members to set up and develop a united framework to defend and safeguard the olive tree and olive oil. For most of the parties to the Agreement, olive farming must necessarily be taken into acount in any detailed consideration of agriculture, employment, rural depopulation, trade in agrifoodstuffs,soil and environmental conservation and many other subjects of fundamental socio-economic importance. As the intergovernmental organisation in charge of administering the International Olive Oil Agreement, the International Olive Oil Council has become over the years a unique multilateral tool working for world olive farming. The Product Board for Margarine, Fats and Oils is a private institution created under public law in order to promote the oils and fats industry's interests in the national and international law creating and policymaking process and to inform the oils and fats enterprises on law and policy issues as well as market developments and opportunities that are or may be significant to the enterprises' commercial decisions, investment planning and day-to-day activities.
2.3.9 Dutch oils and fats industry The Dutch oils and fats industry consists of oilseed crushers, animal fat producers, refiners and hardeners, animal rest-products destructors, oleochemical industry, margarine and vegetable oil producers, sauce producers, oils and fats recyclers, traders, and storage and bottling facilities. Refining The Netherlands have 11 companies in 2003 that refine and/or harden vegetable oils and animal fats (including fish oils). End-products are refined unhardened and hardened oils and fats, and other products such as lecithin, for the food, feed and oleochemical industries. By-products are fatty acids and residuals from distillation. These latter products, which may be vegetable or animal, are sold to the oleochemical industry and the feed industry. Crushers, refiners and hardeners have their own branch organization, the Dutch Edible Oils and Fats Producers Association (Vernof). Margarine and oil production In The Netherlands there are 8 companies either producing margarine products (margarines, light margarines, low-fat products) or cooking oils (baking and frying oils and fats, oil mixes and related products). These companies have a branch organization, the Dutch Margarine Producers Association (BNMF). Refined oils and fats are the resources for this industry's products.
28
The companies involved sell both final products to consumers and other companies (restaurants, institutions, bars and so on) and products to other food industries, such as the bakery branch. Oils and fats blending This branch - involving 9 companies - collects, melts and purifies vegetable oils and fats and fatty acids, and mixes them to attain a fatty acid composition as desired by the customers. Some fat recyclers also collect fatty rest-products from food industries. Storage and bottling In the Netherlands 6 companies are involved in storing vegetable oils, usually oils that fulfil a stock buffer function for importing and exporting companies that buy and sell in large quantities. In 2003 there are 5 companies which bottle and market - sometimes imported - vegetable oils. 2.4 Conclusions
Based on the inceasing consumer concerns over the health effects of various food items and the respective value of ther eating habits, olive oil consumption in the Netherlands, has increased with very high rates in recent years, and continues to gain market share against other edible oils and fats, along with the expansion of the Mediterranean eating styles and expansion of the uses of ingredients for such a diet.
The largest market share for olive oil is in the hands of the big retail chains which are using either A-brands whci are heavily supported from myltinationals and other big companies, or rely on direct procurement of private label olive oils, which they can offer at competitive price levels in order to compete with A-brands. Alternative marketing channels for small scale olive oil producers and exporters can be found in the specialty stores (delicatessen, wine stores, butchery and cheese stores). The sales volume for olive oil through this channel gradually increases, at least for as long as olive oil products are offerect with competitive terms of price and marketing support. Olive olive is imported in the Netherlands, no tonly directly form the producing countries but also through other neiboring countries (mostly Germany and UK), as olive oil traders which operate mainly in those countries and have developed a clientelle network in other countries and also re-export olive oil. Despite the fact that no olive oil is produced in The Netherlands, a certain volume of olive oil, is also exported (re-exported), due to the commerical activity of trading and speciall retailing firms which operate nopt only in the Netherlands but in a number of other countries as well.
29
References Benassi J. L., Labonne M.2004, ‘Perspectives pour les oleaginaux dans les pays du Maghreb:
Algerie, Maroc et Tunisie 2000 -2015’, Oléagineux, Corps Gras, Lipides. Volume 11, Number 2,
92-6, MARS/AVRIL 2004, Économie
European Commission, Directorate-General for Agriculture, ‘The olive oil sector in the European
Supply Chain Analysis of the olive oil market in Germany
by
Volker Hart, Aikaterini Kavallari, P. Michael Schmitz and Tobias C. Wronka
31
3 The Olive oil supply chain in Germany 3.1 Introduction
Olive oil is a typical product of the Mediterranean basin, where almost all of the world production takes place. Due to campaigns for a healthier way of living, consumption of olive oil has also increased in non Mediterranean countries in recent years. As a result of the expanded demand the different participants in the supply chain of olive oil strengthen their efforts to obtain a higher market share in these non-traditional markets.
Germany with 82.5 million inhabitants is of special interest for olive oil producing countries as it serves as an attractive export destination. Although during the period 1997/98 Germany imported only about 2.6 % of the world’s imports of olive oil and consumed about 0.9 % of the world consumption, it is considered to be a very dynamic market (Ward et al., 2002). Olive oil becomes more and more popular in Germany not only through the “for a healthier life” campaigns but also through immigrants coming from the Mediterranean basin. Another reason for the growing popularity of olive oil is the increasing convergence of the consumption habits of the European people as a consequence of the expanded tourism to southern countries. The Germans are integrating the Mediterranean diet into their own habits and thus changing gradually their way of cooking in using more and more olive oil in their dishes.
Against this background this report aims to analyse the supply chain of olive oil in Germany. For this purpose the report is organised in five chapters. Following the introduction, the second chapter deals with the demand and the third one with the supply of olive oil in Germany. Quality and labelling issues related with the consumption of olive oil are discussed in the fourth chapter. In the fifth chapter the institutions and organisations in Germany occupied with olive oil are briefly presented. After the conclusions follows the annex including detailed tables.
3.2 The demand side
Olive oil as a vegetables oil belongs to the food category “fats for food uses”. In order to assess accurately the increasing importance of olive oil within this category, firstly, it is necessary to give a brief overview about the developments of fats for food uses as a whole.
The domestic use for all oils and fats has steadily increased from 1997 to 2003 (Table 3.2). Whereas the consumption for food uses has declined over the considered period, the use for feed and manufacture purposes has noticeably raised. The developments for the domestic use of vegetable oils and fats are similar to those of all oils and fats, i.e. the share of food consumption on domestic use has decreased, while feed and manufacture uses have become more important over time. The food consumption of vegetable oils and fats account for about 50 % of the total food consumption of all oils and fats.
32
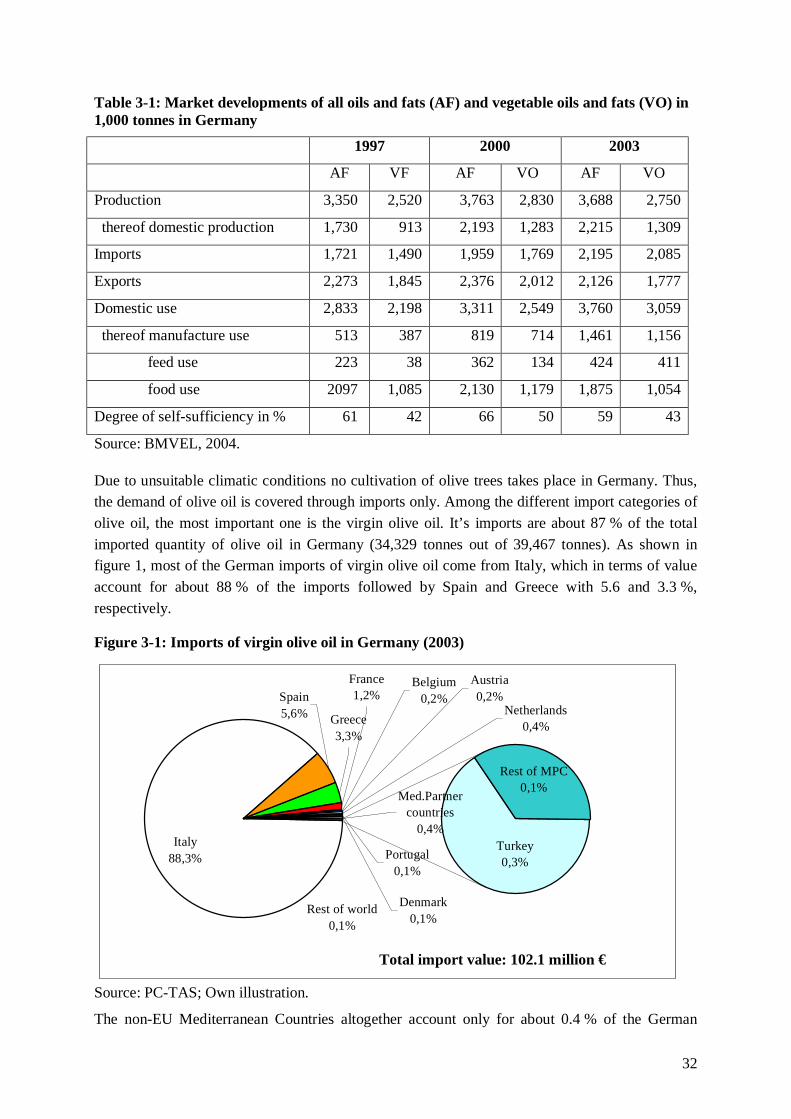
Table 3-1: Market developments of all oils and fats (AF) and vegetable oils and fats (VO) in 1,000 tonnes in Germany
1997 2000 2003
AF VF AF VO AF VO
Production 3,350 2,520 3,763 2,830 3,688 2,750
thereof domestic production 1,730 913 2,193 1,283 2,215 1,309
Imports 1,721 1,490 1,959 1,769 2,195 2,085
Exports 2,273 1,845 2,376 2,012 2,126 1,777
Domestic use 2,833 2,198 3,311 2,549 3,760 3,059
thereof manufacture use 513 387 819 714 1,461 1,156
feed use 223 38 362 134 424 411
food use 2097 1,085 2,130 1,179 1,875 1,054
Degree of self-sufficiency in % 61 42 66 50 59 43
Source: BMVEL, 2004.
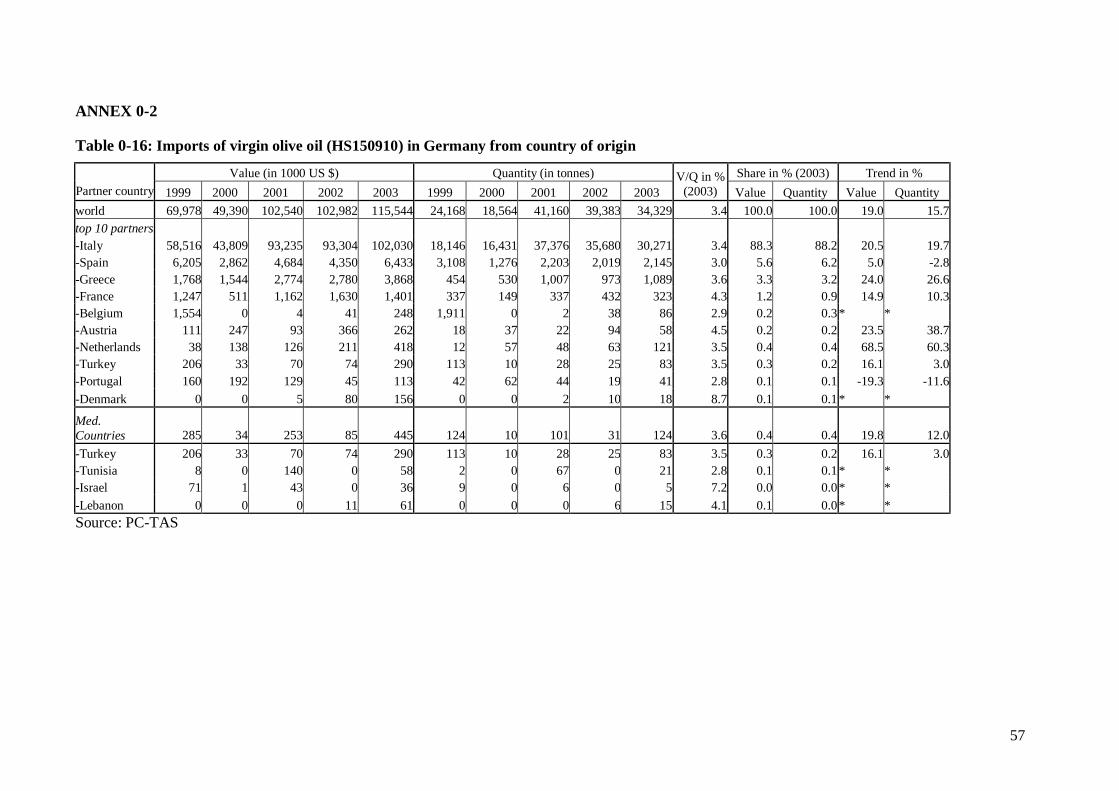
Due to unsuitable climatic conditions no cultivation of olive trees takes place in Germany. Thus, the demand of olive oil is covered through imports only. Among the different import categories of olive oil, the most important one is the virgin olive oil. It’s imports are about 87 % of the total imported quantity of olive oil in Germany (34,329 tonnes out of 39,467 tonnes). As shown in figure 1, most of the German imports of virgin olive oil come from Italy, which in terms of value account for about 88 % of the imports followed by Spain and Greece with 5.6 and 3.3 %, respectively.
Figure 3-1: Imports of virgin olive oil in Germany (2003)
Spain5,6% Greece
3,3%
Med.Partner countries
0,4%Turkey0,3%
Rest of MPC0,1%
Netherlands0,4%
Rest of world0,1%
Denmark0,1%
France1,2%
Belgium0,2%
Portugal0,1%
Italy88,3%
Austria0,2%
Source: PC-TAS; Own illustration.
The non-EU Mediterranean Countries altogether account only for about 0.4 % of the German
Total import value: 102.1 million €
33
imports with Turkey as the distinguishing country. However, the trend1 of their imports in terms of quantity and value is positive with 20 and 12 % respectively, indicating positive developments of Mediterranean exports to Germany. (see Annex: Σφάλμα! Λανθασμένη αναφορά σελιδοδείκτη στον εαυτό του.).
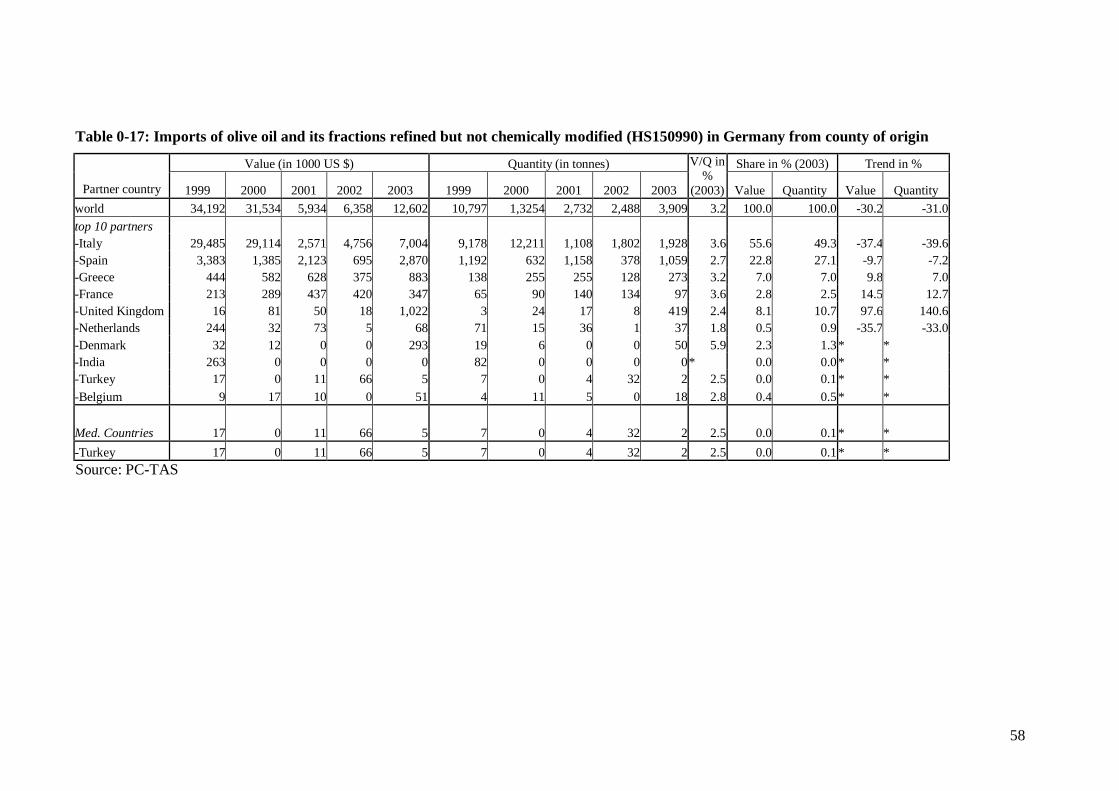
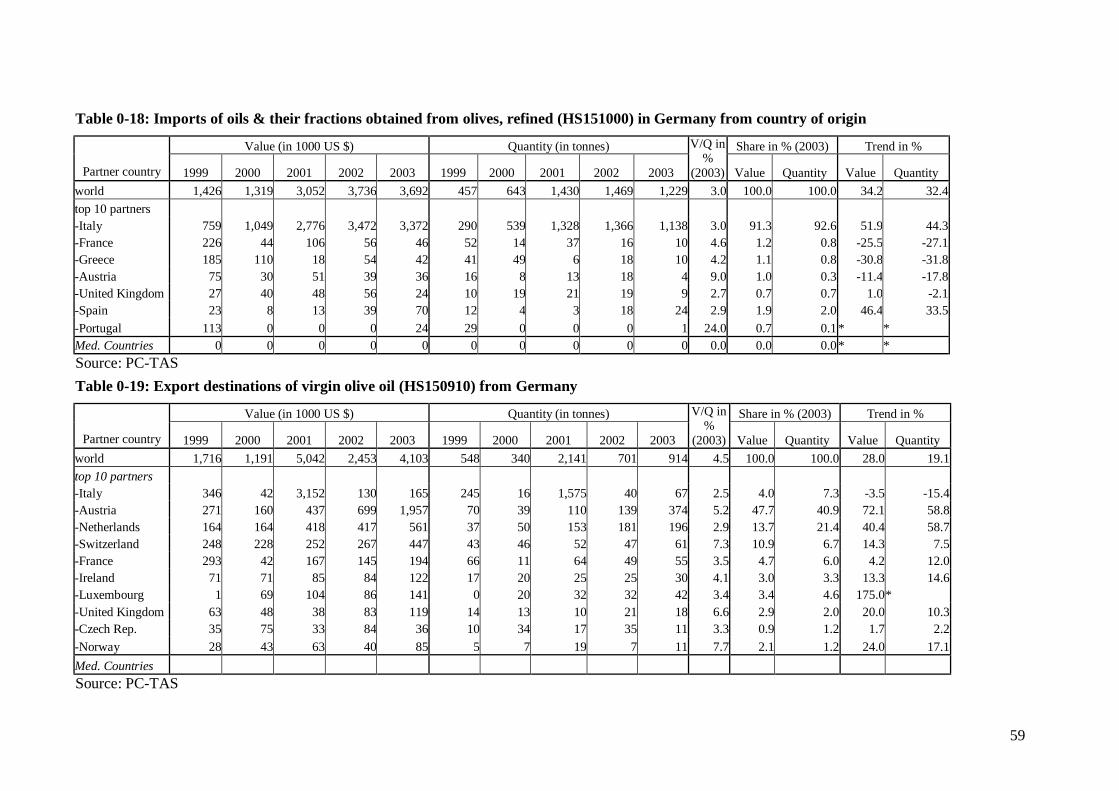
As already mentioned above, much less important are other olive oil categories, such as olive oil refined but not chemically modified and refined olive oil. However, again most of the German imports originate from Italy. Interesting though is the fact that the trend of the imports of olive oil refined but not chemically modified from all countries of origin as a whole is negative. Apparently, this category of olive oil is of lower and of decreasing significance for the German market. As far as refined olive oil is concerned, Italy and Spain have increased their shares in the last five years, whereas the trend in percentage for all other major suppliers is negative (see Annex: Table 0-9).
Using the data from Tables 1 and 3 the import share for olive oil of the total imports of vegetable oils and fats could be calculated. Although olive oil accounts in terms of volume only for approximately 1.7 % in the year 2003, its consumption has continuously increased in the considered period. According to the International Olive Oil Council (IOOC), the consumption of olive oil has increased from 22,300 tonnes in the farm year 1997/98 to 37,400 tonnes in 2002/03.
Table 3-2: Consumption of olive oil in Germany
1997/98 1998/99 1999/00 2000/01 2001/02 2002/03
Consumption in 1,000 t 22,3 23,4 26,6 35,0 36,5 37,4
Consumption in kg/capita
0,27 0,29 0,32 0,43 0,44 0,45
Source: IOOC, 2005; Own calculations.
In the same period the per capita consumption has also increased from 0.27 kg to 0.45 kg2 (). The significant rise in per capita consumption of olive oil has been confirmed by a consumer panel study carried out by the Gesellschaft für Konsumforschung (GfK). Its results show an increase from 0.19 kg in 1997 to 0.48 kg per capita in 1999 (ASOLIVA, 2003).
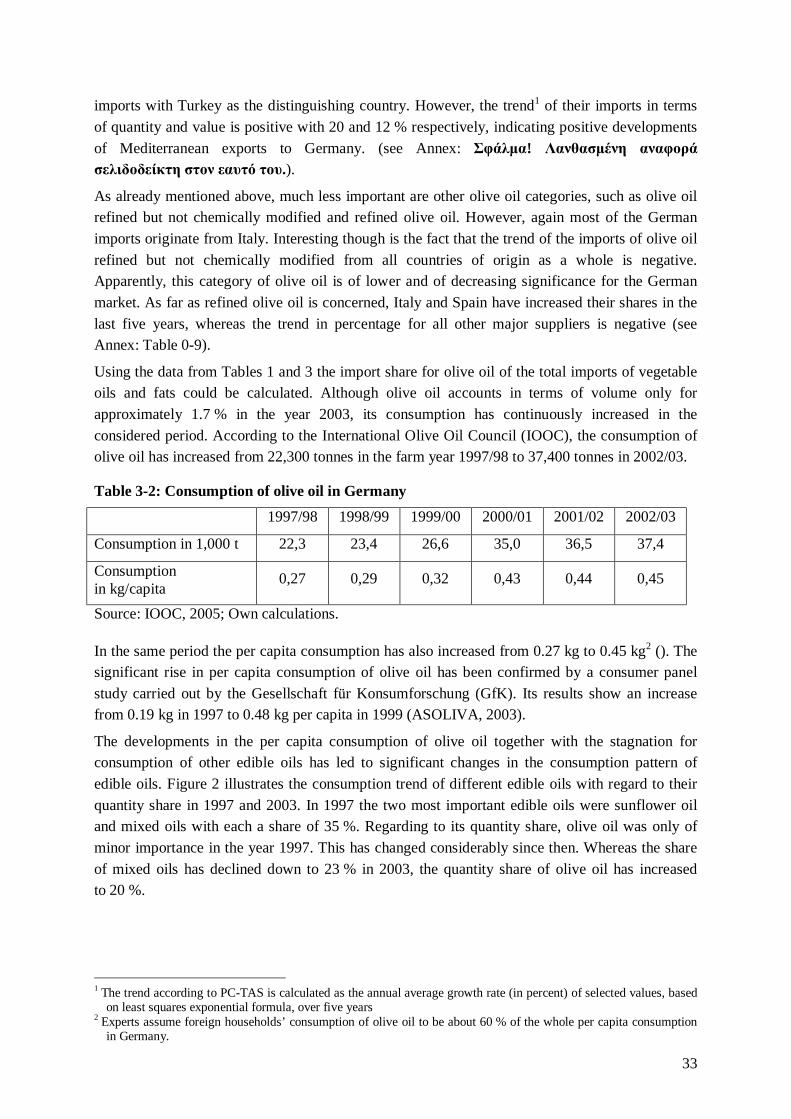
The developments in the per capita consumption of olive oil together with the stagnation for consumption of other edible oils has led to significant changes in the consumption pattern of edible oils. Figure 2 illustrates the consumption trend of different edible oils with regard to their quantity share in 1997 and 2003. In 1997 the two most important edible oils were sunflower oil and mixed oils with each a share of 35 %. Regarding to its quantity share, olive oil was only of minor importance in the year 1997. This has changed considerably since then. Whereas the share of mixed oils has declined down to 23 % in 2003, the quantity share of olive oil has increased to 20 %.
1 The trend according to PC-TAS is calculated as the annual average growth rate (in percent) of selected values, based
on least squares exponential formula, over five years 2 Experts assume foreign households’ consumption of olive oil to be about 60 % of the whole per capita consumption
in Germany.
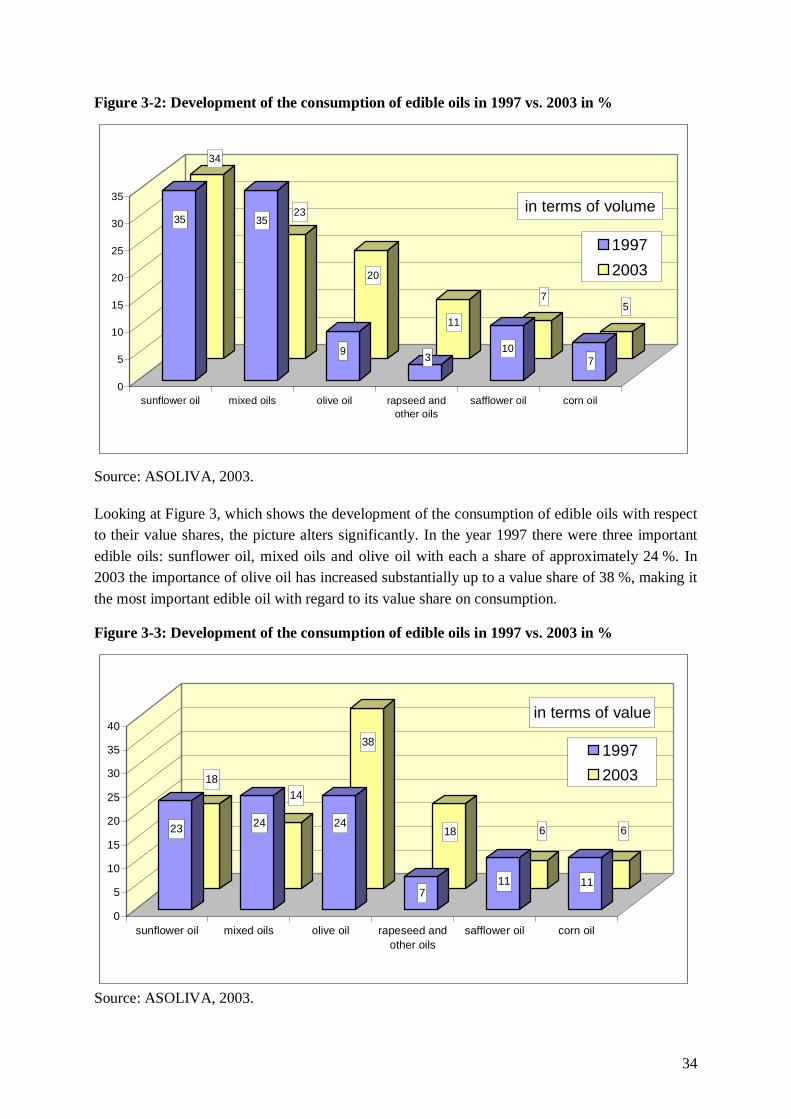
34
Figure 3-2: Development of the consumption of edible oils in 1997 vs. 2003 in %
Looking at Figure 3, which shows the development of the consumption of edible oils with respect to their value shares, the picture alters significantly. In the year 1997 there were three important edible oils: sunflower oil, mixed oils and olive oil with each a share of approximately 24 %. In 2003 the importance of olive oil has increased substantially up to a value share of 38 %, making it the most important edible oil with regard to its value share on consumption.
Figure 3-3: Development of the consumption of edible oils in 1997 vs. 2003 in %
The supply chain of olive oil in Germany is characterised by a limited number of participants and thus rather straightforward linkages between the different distribution channels.
It should be noted though that there are several difficulties in obtaining reliable data for the German supply chain of olive oil. The official statistics provide data only for the imports and exports of olive oil, but no further information is given about its distribution in the German market. Through an intensive literature research only two studies have been detected with useable content about the German market of olive oil, namely a Spanish study by the Spanish Consulate General based in Düsseldorf and a study prepared by “Food for Thought”. Especially the information given by the latter study should be treated with caution as the study appears quite unserious, an anticipation which has been confirmed by later expert interviews. The difficulties regarding reliable data availability, made it necessary to resort to expert interviews3 and to conduct a survey among the importers of olive oil in Germany4. A total of 101 importers have been contacted, of which 19 importers have sent back their questionnaire so far. Although the response rate of 19 % does not allow representative conclusions, along with the expert interviews and in combination with the official statistical data, they are valuable and the sole information source for the analysis of the supply chain of olive oil in Germany.
In the following a detailed view of the different agents of the supply chain is given, which is structured according to the position of each agent within the chain, as shown in Figure 3-7.The description starts with the importers, continues with the wholesale trade, the food industry, the retail trade, the specialised shops and ends with the big consumers.
3.3.1 Imports – Exports According to the trade database PC-TAS in the year 2003 39,467 tonnes were imported by Germany which were equal to a value of 116.4 million €. As mentioned above, the majority of olive oil in the German market is imported from Italy, followed by Spain and Greece. This corresponds favourably with our survey results, where on a non-weighted average 56.21 % of the imported olive oil is of Italian origin, 28.26 % of Spanish, 8.89 % of Greek and 6.63 % of other origin5. More specifically, out of 19 importers 14 stated they import from Italy while 5 told to import their entire olive oil from Italy. In the case of Spain and Greece as the country of origin, 8 and 7 out of 19 interviewed importers mentioned to import from these countries, respectively. Half of the Spanish olive oil importers purchase their whole oil from Spain only, whereas 1 importer imports only from Portugal. Although the discovered figures from the survey are not representative due to the relative low response rate, they indeed confirm each countries’ importance, i.e. Italy is the most important source of supply. The main part of the imported olive oil is intended to cover the domestic demand. With 1,372 tonnes or 3.5 % of the imported volume, exports are of minor importance and concern only re-exports of some firms to neighbouring European countries (i.e. the Netherlands and Austria) (see Annex:
3 The authors are indebted to Mr Fissenewert of the Italian Institute of Foreign Trade (I.C.E.), who provided his expert
view of the German market of olive oil in several telephone talks. Furthermore, the authors are grateful to Mr Oberg, who also supported this study with valuable information.
4 The authors are obliged to Mr Uzcanga of the Spanish Consulate General in Düsseldorf and again to Mr Fissenewert of the I.C.E. for providing lists of importers of olive oil in Germany. The full consolidated list can be found in the Annex, Table 0-14.
5 These figures have been calculated as an average of the respondents’ statements given in percentage shares.
36
Table 0-11).
According to the survey results, most of the imported olive oil in terms of volume is acquired directly from producers (66 %), followed by producer organisations (16 %), other sources (i.e. bottler) (11 %) and wholesale trade (7 %) (Figure 3-4). In absolute terms, 9 importers receive the entire quantity of their olive oil directly from producers, 2 solely from producer organisations, 1 from the gastronomy and the rest from a combination of the above mentioned suppliers. However, according to the survey results the most important source of supply are the single producers and producer organisation, as 15 and 6 out of 19 importers have chosen these categories, respectively.
Figure 3-4: Suppliers of olive oil to the importers in terms of volume , in %.
16%
7%
11%
66%
single producers
producer organisations
wholesale trade
others
Source: Own survey.
The majority of the imported olive oil is already labelled and packaged when it enters the German market, a fact also supported by the survey results, with one single exception of an oil mill. The indicated package sizes range from very small ones like 0.08 lt., 0.1 lt. and 0.25 lt., over 0.5 lt., 0.75 lt. and 1lt. up to 5lt., 10lt. and 174 lt. Whereas the 10lt. package is distributed only to big consumers (hotels, restaurants etc.) and the 174 lt. are imported by an oil mill for the food industry, all other package sizes are distributed through the different possible channels in the supply chain, except for the food industry.
However, olive oil in particular from countries with limited marketing channels in Germany like Spain and Greece, is either directly exported in bulks to big consumers in Germany (i.e. Spanish and Greek restaurants) or redirected over Italy, blended there with other olive oils and finally entering the German market under an Italian brand name. In recent years though, those producing countries are increasing their efforts to market their olive oil as standardised and already bottled in packages less than 5 litres, so as to promote it with their own brand names.
This is for example the case of the Spanish association of producers and exporters of olive oil ASOLIVA (ASOLIVA, 2003). In the year 2001 ASOLIVA exported approximately 1.62 million tonnes in loose bulks, that is non standardised and in containers bigger than five litre and 0.65 million tonnes standardised and in packages less than five litre to Germany. The share of standardised olive oil has significantly increased over the years, indicating the growing efforts of Spanish olive oil producers to create own brands for their olive oil and thus to market it directly to
37
the food retailing or specialised shops in Germany (ASOLIVA, 2005). Another similar example is the case of the oil of the Greek producer company “Gaia”, imported and distributed by the “Importhaus Wilms” (Gaea, 2005) and the oil of the agricultural cooperative of Sitia “Kloster Toplou”, imported and distributed by the “Lukullus GmbH” (Kloster Toplou, 2005).
According to the survey and the PC-TAC database, the quality of the imported olive oil is mainly the highest one i.e. extra virgin. Only one importer reported imports of native olive oil for the wholesale trade, the retail and big consumers and another one imports pomace olive oil for the gastronomy.
One of the biggest importers of olive oil from Italy is the “BLM Produktions- und Vertriebsgesellschaft mbH & Co.KG”, one of the key importers for the discount market Aldi. BLM based in Buchholz belongs to the Betz Holding and calls itself the specialist for Italian products. This enterprise has an own logistic business called “PMB”, which is responsible for the whole logistic assignment and thus is in charge of importing food products from Italy, the storage and the final distribution (BLM, 2005). There are no intermediate storages in Germany, as BLM directly supplies the appropriate platforms of the Aldi supermarkets. Two other importers for Aldi are the Alfred Graf GmbH & Co.KG and the Clama GmbH belonging to the KM Mahnke Group (Fissenewert, 2005).
In the case of the discount market Lidl, it imports directly through Lidl International and does not use intermediate importers. The bottler RM Oleificio in Lucca delivers the olive oil to the loading platform in Verona and consigns it there to Lidl (Fissenewert, 2005).
Figure 3-5: Recipients of olive oil in terms of value, in %.
13%
16%
23%
1%
18%
29%
wholesale trade
specialised shops
food retailing
food industry
big consumers
others
Source: Own survey.
As Figure 3-5 shows, on a non-weighted average 23 % of the imported olive oil in terms of value is delivered to the wholesale trade, 29 % to specialised shops, 18 % to the food retailing, 13 % to big consumers, 16 % directly to the consumers (others) and 1 % to the food industry6. Apart from
6 Again, these figures have been calculated as an average of the respondents’ statements given as a percentage share.
38
the food industry and direct selling to consumers, the other distribution channels are of similar importance to the interviewed importers7. For each of the rest categories 9-12 out of 19 importers stated to distribute their olive oil to the respective recipient. Furthermore, it should be noted that only 1 importer delivers its entire olive oil exclusively to specialised shops, 1 importer solely to the food retailing and 1 to big consumers.
3.3.2 Wholesale trade The sole information source about the wholesale trade are the results of the conducted survey among the importers of olive oil. Both the sample size of the survey as well as the response rate of 19 % do not allow for representative conclusions regarding the activities and the real importance of the wholesale trade within the supply chain of olive oil. Thus, only qualitative conclusions can be drawn, namely that indeed wholesalers can act as middlemen between the importers and the food retailing, big consumers and the specialised shops (see Figure 3-5).
3.3.3 Food industry The food industry is supplied with olive oil both by the importers and most probably also by wholesalers, whereas equal possible is that it imports directly olive oil. Here again the only information are the results of the survey. One oil mill, which imports mainly from Italy in bulks extra native olive oil, distributes it to the food industry in bulks (174 lt. package).
3.3.4 Food Retailing The food retailing (supermarkets, warehouses, discount markets) is the major recipient of olive oil in Germany. According to Fissenewert (2005) about 77 %8 of the imported volume of olive oil goes into the food retailing, which equals 30,476 tonnes.
Although no information about the value share is available, in order to classify the significance of the retail trade within the supply chain, an auxiliary calculation was done. Therefore an average price of 3 €9 per 750ml was assumed and resulted a total value of 133.1 million € 10 by multiplying the price with the respective quantity.
About 60 % of the flowing quantity in the food retailing is marketed by discounters like Aldi, Lidl and Penny and the remaining 40 % by other supermarket chains and warehouses. Among the discounters, Aldi is the predominant with a market share of about 50 % on the total discounter share and thus a respective total market share of about 30 % (Fissenewert, 2005).
Oberg (2005) and Fissenewert (2005) agree that about 75 – 80 % of the olive oil is marketed under retailer brands, like “Villa da Badia” (Rewe), “Bancetto” (Edeka), “Cantinelle” (Aldi Süd) and about 25 – 20 % under manufacture brands. Under the brand “Bertolli”, Unilever Bestfood 7 As it will be described later, the importance of the food retailing seems to be underestimated by the survey. 8 As share on the remaining olive oil in the German market after deducting the exports from the whole imports. 9 The assumed price is based on personal observations of the authors in the German market and it serves therefore only
as an approximate price. 10This figure is similar to the finding of a study conducted by the market research institute A.C. Nielson. According to
their study results in 2003 olive oil was predominant in the edible oil sector with a turnover of 107.49 million € (whole food retailing excluding Aldi) (UFOP, 2005).
39
GmbH markets its olive oil and claims to have a market share of 12 % in terms of value and 6 % in terms of volume (Unilever Deutschland Holding GmbH, 2005). Other well known manufacture brand names of olive oil are “Mazola” and “La Espanola”, “Minerva Sasso”, “Kloster Toplou”.
3.3.5 Specialised shops Specialised shops such as delicatessen shops are another important recipient of olive oil. Although through these shops only 3,048 tonnes or about 8 % of the volume of olive oil in Germany is marketed, its significance in terms of value is considerably higher (Fissenewert, 2005). Again, in order to give an estimation about the value, an auxiliary calculation as previously follows. In this case an average price of 11 € per 750 ml bottle was assumed, which results in a total value for this distribution channel of 48.8 million €. The prices of these olive oils are significantly higher compared to oils in other distribution channels. This is mostly due to the higher quality and often higher production costs. Specialised shops usually market olive oil with brand names of producers, which are often of protected geographical origin or protected designation of origin. One major trend for specialised shops are the increasing demand for very small packages of olive oil with different aroma. Among specialised shops there are a growing number of those which offer the consumer the possibility to bottle the different oils himself in small aesthetic bottles as a gift. Furthermore there are great deal of online-shops selling high quality olive oil.
3.3.6 Big consumers Big consumers like hotels, restaurants and other institutions are being attributed a share of 11.6 % of the total market volume of olive oil equal to 4,571 tonnes (Fissenewert, 2005). Assuming an average price of 3 € per 750 ml bottle, a value of 19.9 million € was calculated.
Regarding the quality of olive oil supplied to big consumers, the survey and the expert interviews indicate that it is not the highest one. As mentioned above one importer delivers native olive oil in 10lt. package to the gastronomy.
3.3.7 Business relationships between the different players in the supply chain
Until now the report concentrated on the trade flow of olive oil between the different actors in the supply chain. In this part it is tried to be explained how the supply flows are arranged and what kind of business relationships exist among the different actors of the chain. Sole source of information is the special conducted survey for the needs of this report.
The results of the survey are depicted in Figure 3-6. Almost half of the imported olive oil is acquired through written contracts between the importers and their suppliers (44.33 % or 9 importers of the 18). Equally important are other order mechanisms as per fax or telephone with a percentage of 36.78 % (or 8 importers out of 18), whereas 18.89 % is handled via listings (4 importers out of 18). It should be noted that 3 importers use a combination of these instruments for buying olive oil, whereas one importer did not answer the question.
40
Figure 3-6: Acquisition and selling mechanisms of the importers (in %)
19
37
44
19
50
31
0
10
20
30
40
50
60
written contracts listings others
auqisition (n=18)
selling (n=16)
Source: Own survey
The main selling mechanisms from the 16 observations are instruments under the category “others” such as commissioned transactions or orders made per telephone or fax depending on the demand (50.38 %), operations typical for brokers. Other selling mechanisms are through written contracts (30.88 %) and listings (18.75 %). In particular 7 importers sell 100 % of the quantity of olive oil through instruments of the category “other”, 4 through written contracts, 2 through listings, whereas the rest 3 use a combination of the mechanisms.
41
Figure 3-7: Trade flows in the supply chain of olive oil in Germany, 2003
Source: PC-TAS; Fissenewert, 2005; Oberg, 2005a; own calculations
42
3.3.8 Quality and labelling issues The EU has recognised quality as a key factor to increase consumer confidence and consumption of olive oil in both member countries and third countries. Efforts initiated by the EU to improve the product quality, in accordance with the standards of the IOOC are reflected in the new framework for olive oil marketing in the Community (EU Regulation 796/2002 and 1019/2002). The various quality categories have been redefined and more technologically advanced organoleptic methods have been introduced for a more proper categorisation of olive oil.
The label of each package comprises of several mandatory information, i.e. the category of the oil (e.g. extra virgin), the filling quantity, the expiry date, the address of either the producer, bottler or trader, the regional origin in case of oil from protected designation of origin or protected geographical origin and a declaration of the nutrient content in case of advertising with positive attributes such as cholesterol free, rich in Vitamin E or rich in linoleic acid (Oberg, 2005b). Additionally, there are numerous facultative declarations possible, such as the variety of the olives from which the oil was extracted, the harvest period and the harvest method, the date of bottling and indications for storage. Since most of the German olive oil is labelled as extra virgin, those voluntary information are often the only measure for producers of more expensive olive oil to distinguish their high quality oils from the cheaper ones of discount markets.
However, the labelling “extra virgin” even on bottles of discounter olive oils suggests the German consumer the best quality. Since consumers generally are not able to distinguish between the different qualities within the category of “extra virgin olive oil” most of them are not willing to pay more for the same perceived quality and thus buy their olive oil in discount markets instead of in specialised shops.
Nevertheless, as it has been lately reported to the wider German public and as experts in every occasion indicated, the labelling of olive oil with the category of extra virgin is not always justified, especially in the case of discounters’ olive oil. The magazine “Der Feinschmecker” recently tested eight different extra virgin olive oils. Four of them belonged to the group of cheaper retailer brands and the other four belonged to the group of rather expensive producer brands. Using a lately developed analytical method11 it was proven that in the case of the four retailer brands the labelling “extra virgin” was misused. Two different assigned labs found out a heat treatment of the four cheaper olive oils, which should therefore not be marketed as extra virgin, but as refined olive oils. It should be noted that using the traditional analytical methods all eight olive oils have been legitimately classified as extra virgin olive oil (Der Feinschmecker, 2005).
This recent study confirms the argument that there is some ambiguity concerning the proper labelling of the different classification of olive oil within the EU and the IOOC standards. The traditional methods used for the categorisation of olive oil are not adequate to identify for example heat treatments and thus, leave space to the food retailing to market lower quality olive oil as higher ones. Such activities not only harm the uninformed and unaware German consumers, but mostly the producers of a better quality and thus more expensive olive oil, since it is a typical example of unfair competition.
11It is called after Serani, who developed this method together with two other Italian researchers in 2001. This method
is already applied in Italy and Greece.
43
3.3.9 Institutional structure The main official body in Germany dealing with questions regarding olive oil is the information agency of olive oil (Informationsgemeinschaft Olivenöl). It is the first and until now the only official agency for olive oil, which is active in the branch for 15 years and is supported by the EU. Its main objective is the promotion of olive oil consumption in Germany. It mostly addresses issues related with quality and nutrition. It undertakes seminars, presentations and consulting services with the aim to make the special characteristics of olive oil, the different qualities and the factors that influence it, well known to the consumers. Together with the German olive oil panel (Deutsches Olivenöl Panel) it organises sensory test groups for the examination of the quality of olive oil (www.olivenoel-info.net).
Supported by the IOOC the panel was voluntary founded in 1998. It is responsible for carrying out the so-called panel tests for the categorisation of native olive oil and currently comprises of 12 members and a panel supervisor. The parameters taken into consideration for the sensory tests are the ones set by the IOOC and the EU Regulations for the distinction of olive oil in the different categories. The background of the panel’s initiation was the fact that olive oils labelled as “extra virgin” have consistently been flawed products, which could not necessarily been correctly detected in non producing countries, such as Germany. On the basis of voluntary self-controls the panel decided to focus on the examination of native olive oil. Therefore at least 10 times per year 8 – 12 samples of native olive oil are sent to the members and are analysed. If required they contact the producers or traders in order to protect the German consumers. The Panel is certified according to the guidelines of the IOOC (www.olivenoel-info.net).
Through a specialised fair for olive oil (“OLIO”) olive oil producers and importers have the possibility to make their products and activities known to the German public. The “OLIO” has been organised by the magazine “Der Feinschmecker” in the last three years once per year and aims at the promotion of olive oil in the German market. Apart from the exhibition of the products it includes seminars related with gastronomy and the Mediterranean kitchen and with tasting and testing olive oil. The highlight of the fair is the award of the best olive oil for the year.
It should be also noted that there is no association of olive oil importers or suppliers in Germany. Contacting points though especially for small producers and exporters interested in the German market are the embassies and consulates of their countries. The departments of foreign trade of the embassies conduct market studies and have an important role in the information flows between the producers and the German consumers. They are trying to be up-dated regarding the demand in Germany so develop the proper marketing strategies for their countries.
With 82.5 million inhabitants, Germany is of special interest for olive oil producing countries. Due to natural production limitations, the supply of the German market is covered only through imports mostly originating from the Mediterranean basin. Until now Italy is the main source for olive oil in Germany followed by Spain and Greece. It is worth noting though that the positive annual growth of imports originating from non-EU Mediterranean countries along with the gradual liberalisation between the EU and these states under the framework of the Barcelona Agreement leaves open space for further growth of their exports of olive oil to Germany. This combined with their lower production costs in comparison to the EU-Mediterranean member states, provides them with comparative advantages and gives additional possibilities for positive developments of their exports.
Nevertheless, lately interesting for the supply side seem to be efforts of smaller producers and exporters, to export high quality olive oil in Germany under their own brands. This trend combined with the labelling problems could possibly change the scenery of the supply chain in the future splitting it up to more agents with less market dominance and should be definitely taken into account from exporters into the German market. This combined with the general trend observed in the markets of primary commodities that consumers want to know the origin of their products and demand more guarantees for the product quality, is another chance the Mediterranean countries should seize upon. They could raise their profits by exporting directly their own olive oil and thus by-passing big suppliers, which import olive oil in bulks and are then selling it under their own brand names.
Currently the majority of the importers bring in the country already packaged and labelled olive oil and distribute it mainly to the food retail. Major players in the food retailing are the discounters with a share of about 60 % and thus could be characterised as one of the biggest power of the German market of olive oil.
A driving force for the consumption of olive oil is its healthier profile compared to other edible oils. The increasing health conscience along with the adoption of the Mediterranean diet by German consumers is already reflected in the increased consumption of olive oil and the decreased consumption of other edible oils. Another lately observed trend is the increasing demand of olive oil with different aroma.
The majority of olive oil is marketed under retailer brands of either the discounters or the importers, but often of dubious quality. As a study recently indicated there are misuses of the labelling “extra virgin olive oil” opening the discussion for the quality of lower cost olive oils. Obviously the standards of the IOOC and the EU leave space to such mislabelling incidents and need to be reconsidered so as to avoid similar cases in the future and to reassure the food safety for consumers.
Table 0-15 Evaluation table of olive oil expert panel test in The Netherlands Brand name / type Available at : Price
(by 500 ml) Evaluation
mark 1 HEMA Eleolado extra partheno HEMA € 4,95 8,0 2 AH - extra vierge Albert Heijn € 2,99 6,4 3 Bertolli - extra vergine Widely available € 3,89 6,4 4 Edah - extra vierge Edah € 2,38 6,3 5 Fratelli Sanma - extra vergine Xenos € 2,79 5,6 6 Carbonell - extra virgen Widely available € 3,59 5,6 7 Euroshopper - extra vierge Albert Heijn € 1,43 4,8 8 Biorganic - extra vierge C1000, Plus, Vomar and
DeWitKomart € 4,55 4,6
9 Fuchs Cuisine - extra vierge C1000 € 1,40 4,2 10 La Villa - extra vergine Aldi € 1,39 4,0 Source: http://kassa.vara.nl (expert panel research on TV program, in The Netherlands, (10-04-2004).
Table 0-21: Export destinations of oils & their fractions obtained from olives, refined (HS151000) from Germany
Value (in 1000 US $) Quantity (in tonnes) Share in % (2003) Trend in % Partner country 1999 2000 2001 2002 2003 1999 2000 2001 2002 2003
V/Q in % (2003) Value Quantity Value Quantity
world 46 82 75 70 110 23 38 63 35 40 2.8 100.0 100.0 17.2 10.8 Med. Countries Source: PC-TAS
61
Table 0-22: Olive oil importers in Germany, 2005
Company name Comments A. Sander & Co. GmbH Aktuell Vertriebs-GmbH Supplier of food retailing Alisa GmbH Almasol Deutschland Andrzey Pilecki Import-Export Andu-Pez Lebensmittel GmbH Anduronda Import GmbH Ars Gustandi Detlef Rick GmbH Barrique Weinimport GmbH Barth Feinkost GmbH Bernhard Möllers GmbH & Co. KG Bestfoods GmbH & Co. KG BLM Prod.- u. Vertriebsges. mbH Supplier of food retailing Bohl, Ruth GmbH Supplier of specialised shops Bonvino Weinvertrieb u. Weinhandel Supplier of specialised shops Bouquet Garni – Feinkostverband Paula Lederer Brändle GmbH Bremer, Harald L. Supplier of specialised shops Carl Geiger GmbH & Co. KG Clama GmbH & Co. KG Supplier of food retailing Culinaria Delikatessen Service GmbH Supplier of food retailing Damak Lebensmittelvertriebsges. D'Amico Spezialitäten GmbH Supplier of food retailing Das Weinkabinett Der Mallorquiner Di Gennaro Feinkost- & Weinimport GmbH Supplier of specialised shops Die Olive - und mehr e.K. Supplier of specialised shops Dunekacke & Wilms Nachf. GmbH & Co. KG Supplier of food retailing El Paladar –Esteban Ruiz- Import EMA GmbH Supplier of food retailing Epicerie Fine Supplier of specialised shops eterna Nahrungsmittel GmbH Supplier of food retailing Euro Atlantic Import-Export Food Handels GmbH Fantone Feines Olivenöl Supplier of specialised shops Fäustle Import Fripa Vertribs GmbH Garibaldi - Eberhard Spangenberg Supplier of specialised shops Graf, Alfred Supplier of food retailing Grudis GmbH Grünsfelder Ölmühle GmbH Günther Hellriegel GmbH GZ Online – Gerhard Ziegler Henry Lamotte GmbH Holtmann Feinkost GmbH Horace M. Ostwald
62
Table 0-22: - continued - Horst Küper GmbH Import Il Nuraghe GmbH Supplier of specialised shops Imex Handelsges. mbH Supplier of food retailing Importhaus für Delikatessen Wolfram Berge GmbH & CO KG
Interfood GmbH Irene C. L. Bleickert Kattus, Theodor GmbH Supplier of food retailing Klemann GmbH Supplier of specialised shops Krini - A. Kristallidis GmbH feine Spezialitäten Supplier of food retailing Macha Weine & Feines Supplier of specialised shops Maren Encinas KG Marmara Import-Export GmbH Minerva Deutschland Olivenöl GmbH Supplier of food retailing Moreno GmbH & Co. KG Ölbaum Supplier of specialised shops Olive E Più Marzak KG Supplier of specialised shops Olivia’s-Florian Schüssler Ölmühle Solling GmbH Olmühle Walz GmbH Otto Franck Import KG Ralf Bos Food Raoul Rousso GmbH Reichold Feinkost, Feinkost Dittmann GmbH Reina Vertrieb-José Reine Diaz Rekru Brennerei-Kellereibedarf am Bodensee Rila Feinkost-Importe GmbH & Co. KG Supplier of food retailing Romina Foods Import GmbH Ronald Schubbert Rungis Express GmbH Ruth Bohl GmbH – Delikatessen –u. Spezialitäten Import Samsel Vertriebs GmbH & Co. KG Santos Lebensmittel Import GmbH Sektkellerei Jürgen Weisenborn Silca Import AG Siller & Boeckheler Simon, Evers & Co. GmbH Smart Food & Drink GmbH Supplier of specialised shops Sol Im.-u. Export GmbH Spanischer Garten Import GmbH St. Josef Imp.-u. Export Handelsges.mbH Stirn, Wilhelm F. GmbH & Co KG Supplier of food retailing Südlandhaus-Horst Beiderwieden GmbH & Co. KG Sul Portugal GmbH-Spezialitäten aus Spanien u. Portugal Sunda Vital oHG Tivona Alimentaria GmbH Trienon Handels GmbH
63
Table 0-22: - continued - Unilever Bestfoods Deutschland GmbH Viani Importe GmbH Supplier of specialised shops Vin o Ropa Weinhandels GmbH Vinespa Vinos Españoles GmbH Vinos Barron – Feines aus Spanien Vivolo Vin OHG Weinhandel Peral Weise von Schmeling, INKA Wilk GmbH & Co. Supplier of specialised shops Wilms Importhaus GmbH & Co. KG Supplier of food retailing Source: Spanish Consulate in Düsseldorf and Italian Institute of Foreign Trade (I.C.E.)