114
2 February 2018 | ESMA70-151-1154 Report EU-wide CCP Stress Test 2017
| Date post: | 16-May-2018 |
| Category: |
Documents |
| Upload: | nguyenphuc |
| View: | 222 times |
| Download: | 1 times |

2 February 2018 | ESMA70-151-1154
Report EU-wide CCP Stress Test 2017

1
Table of Contents
1 Executive Summary ....................................................................................................... 6
2 Introduction .................................................................................................................... 9
2.1 Background ............................................................................................................. 9
2.2 Objectives ............................................................................................................... 9
2.3 Scope of the Exercise ............................................................................................10
2.4 Overview of the Process ........................................................................................11
3 Methodological overview ...............................................................................................13
3.1 Key aspects and components ................................................................................13
3.2 Market Stress Scenarios ........................................................................................13
3.3 Credit Stress Test ..................................................................................................16
Calculation of Credit Exposures using Market Stress scenarios ......................16
Member Default Scenarios for Credit Stress Test ............................................19
Residual Limitation of Credit Stress Test .........................................................21
3.4 Liquidity Stress Test ...............................................................................................21
Liquidity modelling overview ............................................................................22
Evaluating the liquidity position of a CCP ........................................................23
Entity selection procedure ...............................................................................26
4 Stress Test Results .......................................................................................................28
4.1 Background Analysis ..............................................................................................28
CCPs ..............................................................................................................28
Clearing Members ...........................................................................................30
Prefunded Resources ......................................................................................32
Required / Excess Collateral ...........................................................................34
Prefunded vs non-prefunded resources...........................................................35
Resources per currency and Asset Type .........................................................37
4.2 Interconnectedness and Concentration ..................................................................41
Concentration ..................................................................................................41
Interconnectedness .........................................................................................45
4.3 Credit Stress Test Results ......................................................................................53
Cover 2 groups per CCP results ......................................................................54
MD-A, Cover the Top-2 clearing members per CCP ........................................59
MD-B, Cover the Top-2 groups EU-wide .........................................................63
2
4.4 Clearing Member Knock-on Analysis ......................................................................65
4.5 Reverse Credit Stress Test Results ........................................................................67
4.6 Liquidity Stress Test Results ..................................................................................70
Presentation of the results ...............................................................................70
Cover 2 results ................................................................................................72
LDB results .....................................................................................................79
Liquidity tools review .......................................................................................84
5 Conclusions ...................................................................................................................86
6 Annexes ........................................................................................................................90
6.1 List of CCPs in the scope of the exercise ...............................................................90
6.2 Credit Stress Test Results ......................................................................................91
Credit Stress Test Results, cover-2 groups per CCP .......................................91
Credit Stress Test Results, MD-A ....................................................................95
Credit Stress Test Results, MD-B ....................................................................99
6.3 Reverse Credit Stress Test Results ...................................................................... 103
6.4 Interconnectedness Networks .............................................................................. 107
Interconnectedness through custodians of Cash per Currency ...................... 107
Interconnectedness through custodians of Cash & Securities per Currency .. 108
Interconnectedness through Liquidity providers (committed credit and repo lines
only) per Currency ....................................................................................................... 110
Interconnectedness through Liquidity providers (committed credit and committed
& uncommitted repo lines) per Currency ..................................................................... 111
6.5 Intraday liquidity ................................................................................................... 112

3
List of Figures
Figure 1: Overview of the Process ........................................................................................11
Figure 2: Components of the Stress Test Exercise ...............................................................13
Figure 3: Credit Stress Test Components .............................................................................16
Figure 4: CCP Default Waterfall ...........................................................................................18
Figure 5: Liquidity Stress Test Components .........................................................................22
Figure 6: CCPs by Total size of Default Funds .....................................................................29
Figure 7: CCPs by Total Required Margin ............................................................................29
Figure 8: Total Required Margin vs Default Fund Contributions ............................................30
Figure 9: Clearing Members according to their aggregate DF contributions ..........................31
Figure 10: Clearing Members according to their aggregate Margin Requirement .................31
Figure 11: Clearing Member Groups according to their aggregate DF contributions .............32
Figure 12: Clearing Member Groups according to their aggregate Margin Requirement .......32
Figure 13: Default Waterfall Amounts – All CCPs .................................................................33
Figure 14: Default Waterfall % per CCP ...............................................................................34
Figure 15: Required vs Excess Collateral – All CCPs ...........................................................35
Figure 16: Required vs Excess Collateral per CCP ..............................................................35
Figure 17: Prefunded vs non-Prefunded resources ..............................................................36
Figure 18: Powers of Assessment based on the number of defaulting members ..................37
Figure 19: Currencies of Margin Collateral and Default Fund contributions ..........................38
Figure 20: Breakdown of collateral and Default Fund contributions by Type – All CCPs .......39
Figure 21: Breakdown of collateral and Default Fund contributions by Type per CCP ..........40
Figure 22: Network of top-10 clearing member groups by DF contributions and margins .....46
Figure 23: Network of top-10 clearing member groups by total loss over required resources –
stress scenario 1 ..................................................................................................................47
Figure 24: Network of top-10 clearing member groups by total loss over required resources –
stress scenario 2 ..................................................................................................................47
Figure 25: Network of top-10 clearing member groups by total loss over required resources –
stress scenario 3 ..................................................................................................................48
Figure 26: Network of top-10 custodians – cash only – all currencies ...................................49
Figure 27: Network of top-10 custodians – cash and securities – all currencies....................50
Figure 28: Network of top-10 custodians – cash only – usd ..................................................51
Figure 29: Network of top-10 custodians – cash and securities – usd ...................................51
Figure 30: Network of top-10 committed liquidity lines – all currencies .................................52
Figure 31: Network of top-10 committed liquidity lines – eur .................................................52
Figure 32: Network of top-10 committed credit lines and all repos (Committed and
uncommitted) providers – All currencies ...............................................................................53
Figure 33: Cover-2 Groups per CCP - Market Scenario 1 – No Excess Margin ...................56
Figure 34: Cover-2 Groups per CCP - Market Scenario 1 – With Excess Margin .................57
Figure 35: Cover-2 Groups per CCP - Market Scenario 2 – No Excess Margin ...................58
Figure 36: Cover-2 Groups per CCP - Market Scenario 3 – No Excess Margin ...................59
Figure 37: MD-A - Market Scenario 1 – No Excess Margin ..................................................61
Figure 38: MD-A - Market Scenario 1 – With Excess Margin ...............................................63
Figure 39: MD-B - Market Scenario 1 – No Excess Margin ..................................................64

4
Figure 40: Losses of non-defaulting Clearing Members as % of Capital ...............................66
Figure 41: Reverse Credit Stress test ...................................................................................67
Figure 42: Total Losses (billion EUR) over prefunded resources, No Excess Margin............68
Figure 43: Total Losses (billion EUR) over Non-prefunded resources, No Excess Margin ....70
Figure 44: Example of a step by step analysis ......................................................................72
Figure 45: Cover 2, Step D, Scenario 1, EUR equivalent ......................................................74
Figure 46: Cover2, Step E, overall liquidity position ..............................................................75
Figure 47: Cover2, EUR only liquidity position .....................................................................76
Figure 48: Cover 2, USD only liquidity position .....................................................................77
Figure 49: Cover2, GBP only, liquidity position .....................................................................78
Figure 50: LDB, overall liquidity position ...............................................................................80
Figure 51: LDB, EUR only, sc2, liquidity position ..................................................................81
Figure 52: LDB, USD only, liquidity position .........................................................................82
Figure 53: LDB, GBP only, liquidity position .........................................................................83
Figure 54: Cover 2, GBP only. CCP 8, scenario 2 ................................................................84
Figure 55: Cover 2, overall position. CCP 8, scenario 2 ........................................................84
Figure 56: Cover 2, overall position. CCP 12, scenario 1 ......................................................85
Figure 57: Cover 2, example of intraday impact.................................................................. 113
List of Tables
Table 1: Concentration of Credit Exposures to Clearing Members per CCP .........................44
Table 2: Concentration of Credit Exposures to Clearing Members EU-Wide ........................44
Table 3: Concentration of Liquidity Exposures ......................................................................45
Table 4: Liquidity tools ..........................................................................................................71
Table 5: Capacities of entities selected in cover 2 ................................................................73
Table 6: Cover 2, overall liquidity position, FX markets allowed ...........................................75
Table 7: Cover 2, EUR only liquidity position ........................................................................76
Table 8: Cover 2, USD only liquidity position ........................................................................77
Table 9: Cover 2, GBP only, liquidity position .......................................................................78
Table 10: LDB remaining liquidity needs (over 1 million) ......................................................79
Table 11: LDB, overall position, FX markets allowed ............................................................80
Table 12: LDB, EUR only, liquidity position ...........................................................................81
Table 13: LDB, USD only, liquidity position ...........................................................................82
Table 14: LDB, GBP only, liquidity position ...........................................................................83

5
Acronyms used
EMIR European Market Infrastructures Regulation – Regulation (EU) 648/2012 of the European Parliament and Council on OTC derivatives, central counterparties and trade repositories
ESMA European Securities and Markets Authority
ESRB European Systemic Risk Board
ETD Exchange Traded Derivatives
FX Foreign Exchange
LEI Legal Entity Identifier
NCA National Competent Authority
OTC Over-the-counter
RTS Regulatory Technical Standards
RTS on CCP Commission Delegated Regulation (EU) No 153/2013 on requirements for central counterparties (OJ L 52, 23.2.2013, p.41)
bps Basis points
EU European Union
P&L Profit and Loss
pp Percentage points
SITG/SIG Dedicated CCP Resources (“Skin in the game”)
MD-A Credit Member default scenario assuming that the top-2 clearing members per CCP will default simultaneously
MD-B Credit Member default scenario assuming that the top-2 groups of clearing members EU-wide in terms of exposure will default simultaneously
MD-C Credit Member default scenario assuming that the top-2 groups of clearing members EU-wide in terms of exposure weighted by their probability of default will default simultaneously
PD Probability of default
LGD Loss given default
PoA Powers of Assessment, i.e. not-prefunded additional resources that can be called by CCPs from non-defaulting members
HHI Herfindahl-Hirschmann index used for the assessment of concentration
DvP Delivery versus Payment

6
1 Executive Summary
Introduction
This report presents the results of the second EU-wide stress test exercise for Central
Counterparties (CCPs). In line with the methodology published in February 2017, compared
to the first stress test exercise, ESMA has extended the scope to include liquidity risk and
improved the framework for the definition of the scenarios and validation of the results.
As with all stress test exercises of this scale and type, there are some limitations. To a
significant extent, the results rely on the data provided by CCPs and on a set of validation
checks performed by the individual National Competent Authorities (NCAs). Especially when
it comes to the liquidity stress scenarios, the exercise tests and assumptions were tested for
the first time leading to some residual uncertainties. Therefore, the granularity of published
results is limited for the liquidity stress test part. ESMA remains committed to further improve
and evolve the methodology and scope of the CCP stress tests and address residual
limitations in future exercises.
Concentration and Interconnectedness
The stress test results are presented in Section 4. The CCPs provided for the purpose of
this exercise detailed data on their exposures and financial resources for one reference date.
This data was not only used to run the credit and liquidity stress tests, but also to provide an
overview of the size of the industry and identify common practices and divergences with
potential risk implications.
The background analysis and discussion of the findings is followed by the concentration
analysis. The level of concentration to individual clearing participants has been assessed
using the Herfindahl - Hirschmann Index (HHI) methodology and thresholds. The results
presented in 4.2.1 have not evidenced any systemically critical concentration to single
clearing members or groups at EU-wide level. We also studied the interconnectedness
between CCPs through common clearing members, custodians and liquidity providers and
the results are set out in 4.2.2. As expected, the top clearing member groups have
simultaneous exposures to multiple CCPs. Keeping in mind the limitations of the exercise,
the interconnectedness analysis has indicated that these exposures would generally not hit
simultaneously the default fund waterfall of all these CCPs under one of the common,
internally consistent stress scenarios considered. Concerning the identification of top
common custodians, the analysis has indicated that multiple CCPs may rely on a small
number of cash and securities custodians, including mainly ICSDs and for one particular
currency one commercial bank. Regarding top common liquidity providers, not many CCPs
have reported committed repo lines from commercial entities. Moreover, there is no
convincing evidence suggesting single financial groups committing to providing liquidity to
many CCPs at the same time.

7
Credit Stress Test
The results of the credit stress test are presented in 4.3, for different combinations of
member default scenarios and market stress scenarios. The scenario simulating the default
of the EU-wide top-2 groups of clearing members (MD-B) combined with the common market
stress scenarios indicate that, under the assumptions and limitations of the exercise, the
losses could be absorbed by the available prefunded resources, leaving no uncovered
losses.
As part of a separate scenario, and in order to assess the resilience of each individual CCP
to the default of its most relevant clearing participants under harmonised price shocks, we
also assumed the default of the top-2 groups of clearing members selected for each
individual CCP. The defaulting members could be different for each CCP under this
particular scenario, but still using the common market stress scenarios. The default fund
amounts would also in this case be sufficient to cover the simulated losses, with the
exception of one CCP where we would have a marginal shortfall with no systemic
implications. In particular, for one CCP (BME Clearing), this scenario would result in a need
to call for a very small amount (less than 1 million EUR) of additional non-prefunded
resources, since the mutualised prefunded resources for one of the default funds would be
depleted. The shortfall is only marginal and with no systemic impact, considering also that
the CCP had access to surplus collateral of the defaulting members in other default funds
and excess margin that could in this case be used to cover this very small shortfall. For
another CCP (ICE Clear Europe), the prefunded resources would be enough, but these
would only marginally cover the simulated losses (97% consumption of the default fund).
The excess margin held on top of the minimum required, could also significantly reduce the
consumption of prefunded resources.
The MD-A member default scenario, where we selected the default of the top-2 entities at
each CCP and then considered these entities to be in default at all CCPs lead to a very large
number of members defaulting, due to the cross-default condition. Also here, for the same
two CCPs there would be a need to call for additional non-prefunded resources. Overall,
although not possible to calculate exactly, the combined probability of such a large number
of entities defaulting simultaneously is expected to be very low, implying that this scenario
goes beyond what can be reasonably considered as plausible.
Finally, the knock-on analysis presented in 4.4 was employed to assess the impact of CCPs
using the mutualised resources (default fund contributions and power of assessments) on
non-defaulting clearing members. Under the considered scenarios, assumptions and
limitations there was no evidence of systemic implications via the risk-sharing mechanism
of CCPs.
The reverse stress analysis discussed in 4.5 is meant to capture the sensitivity of the credit
stress results to small changes of the underlying assumptions. For that purpose, we
increased the number of defaulting entities and the severity of the market shocks, beyond
what was considered as plausible, for the purpose of this exercise. Overall, the analysis
showed a high sensitivity at one CCP (ICE Clear Europe) to relatively small increases of

8
either the number of defaulting groups (to 3) or the shocks (to 120% of the baseline stress
shocks), that could lead to material breaches of its prefunded resources.
Liquidity Stress Test
The results of the liquidity stress tests are presented in section 4.6. They demonstrate that
under all market scenarios, EU CCPs could achieve sufficient capacity to meet their liquidity
needs assuming the default of 2 relevant entities (Cover 2) or the default of 2 groups of
entities EU-wide using a variety of tools. According to the rules of the exercise, one of the
CCP requires undisrupted access to markets and the ability to settle immediately. Some
large CCPs require access to the short-term FX markets to cover requirements in some
major currencies. Some CCPs make use of their access to central bank repo lines.
Overall Results
This year’s exercise confirms the results of last year, i.e. that EU CCPs are overall resilient
to common shocks and multiple defaults. However, for the credit tests the use of harmonised
shocks permitted to highlight differences in resilience between CCPs. This allowed the
identification of either minor failures of no systemic relevance or higher sensitivity to marginal
increases of price shocks or number of defaults that might have systemic relevance. Also
for the liquidity stress tests, the exercise did not reveal any systemic risk. CCPs use different
tools to cover their liquidity needs, some are highly reliable as central bank repos, others
less, but no particular deficiency was found in the management of liquidity risks by EU CCPs.
Next Steps
In line with the EMIR mandate, where the assessments expose shortcomings in the
resilience of one or more CCPs, ESMA will issue as a next step the necessary
recommendations. ESMA is currently considering whether any recommendation is needed
and what form it should take.

9
2 Introduction
2.1 Background
1. Central Counterparties (CCPs) can be systemically important and ensuring their
resilience is critical to achieve the stability of the financial system. They were setup to
reduce systemic risk stemming from bilateral relationships. They are still however,
counterparties to all their clearing members, and thus any shortcomings leading to a
failure to mitigate risks could potentially lead to spill-over effects and exacerbate
systemic risk.
2. CCPs run daily stress tests based on stringent prudential requirements that focus on their
own environment (participants, cleared products, activity). The individual stress tests
run by CCPs are necessary but cannot always reveal implications from system-wide
events because of their limited scope. As shown in the first EU-wide stress exercise
conducted by ESMA, CCPs are interconnected through common participants.
Therefore, the EU-wide picture is necessary to identify potential emerging systemic
risks.
3. One of the objectives of Regulation (EU) No 648/2012 of the European Parliament and
of the Council of 4 July 2012 on OTC derivatives, central counterparties and trade
repositories (EMIR) is to promote central clearing and ensure safe and resilient CCPs.
Therefore, ESMA shall, in cooperation with the ESRB, initiate and coordinate Union-
wide assessments of the resilience of CCPs to adverse market developments. Where
the assessment exposes shortcomings in the resilience of one or more CCPs, ESMA
shall issue the necessary recommendations.
4. The present report sets out the results of the 2017 EU-wide stress test exercise in Section
4, following a description of the employed methodology in Section 3. The objectives,
scope and overview of the different tests performed are presented in the following
paragraphs of this section.
2.2 Objectives
5. The objectives of the 2017 EU-wide stress test exercise result directly from the legal
mandate given to ESMA under EMIR. The objectives are to:
assess the resilience of CCPs to adverse market developments,
identify any potential shortcomings in the CCPs’ resilience, and
issue recommendations as appropriate.
6. The overall design of the stress test framework was also guided by a number of
overarching principles. ESMA has assessed the resilience of all scoped CCPs,
individually and as a system. This was done on the basis of, as much as possible,
common methodologies and criteria. The market shocks and stress assumptions were
combined with the simultaneous default of market participants, while the scenario

10
design considers the EMIR prudential requirements. The EU-wide CCP stress testing
exercise is not aimed at assessing the compliance of the CCPs with regulatory
requirements nor at identifying any potential deficiency of the stress testing methodology
of individual CCPs. It may however expose such individual shortcomings, in which case
ESMA will issue the necessary recommendations.
2.3 Scope of the Exercise
7. The stress test exercise covers all EU CCPs that were authorised on the date of the
publication of the present report. This includes 16 CCPs1 and a complete list is provided
in 6.1. All services and products, for which CCPs operate clearing services, fall within
the scope of the EU-wide CCP stress test. We considered all positions for all clearing
members and accounts, including proprietary and client accounts.
8. Concerning the types of risk considered in the stress test exercise, the first exercise
conducted by ESMA in 2016 was focused on the counterparty credit risk that EU CCPs
would face as a result of potential clearing member defaults and simultaneous market
price shocks. The scope of this year’s exercise is extended to cover liquidity risk. The
liquidity stress test is a separate component of the stress test framework and its design
is discussed in detail in section 3.4.
9. Counterparty credit risk due to member defaults and liquidity risk are the core types of
risks faced by CCPs. However, CCPs are also subject to other types of risks that are
either not covered or are partially covered by this exercise and could in isolation or in
combination with credit and liquidity risks challenge their resilience. In particular, risks
stemming from price shocks to collateral that go beyond the applicable CCPs’ haircuts
were not assessed, in an effort to limit the data request and the required effort for all
participants. Moreover, risks linked to the investment policy of CCPs, including wrong
way risk2, are only assessed in the context of potential liquidity implications in the
liquidity component. Finally, operational, legal and any type of business risks are again
left outside the scope of the exercise, because of their largely idiosyncratic nature and
may be considered in future exercises.
10. As mentioned above, assessing the compliance of the CCPs with EMIR is not part of
the exercise and it is actually assumed and taken as one of the starting points of this
exercise, as it is expected to be ensured through the supervisory process involving the
NCAs and the Colleges. The stress test does not review, and is not able to conclude
whether individual CCPs meet the minimum regulatory requirements. Also potential
shortcomings in policies and practices of individual CCPs, such as for example in the
operationalisation of default handling procedures, can challenge their resilience but are
beyond what will be considered in the course of this exercise.
1 The stress test exercise covers 16 CCPs, instead of the initially planned 17, since one CCP has closed its operations since the launch of the exercise. 2 for example the risk linked to a correlation between the default of a participant and the value of the collateral.

11
2.4 Overview of the Process
11. The methodology and the scope of the EU-wide CCP stress exercise have significantly
evolved from the first exercise finalised in April 2016, with the objective to strengthen its
robustness. The key improvements are the extension of the scope to include liquidity
risk, the improvement of the stress scenario design and implementation (by employing
common, internally consistent market stress scenarios) and the enhancement of the
validation process. The key steps needed for the implementation of the exercise are
summarised in the following figure and discussed in the following paragraphs.
FIGURE 1: OVERVIEW OF THE PROCESS
12. ESMA published in February 2017, the framework for the 2017 CCP Stress Test
Exercise3, setting out the scope, an overview of the methodology and the expected
deliverables. The ESRB provided the set of market stress scenarios that were
specifically developed for the purpose of this exercise. ESMA defined the data request
templates and provided the CCPs with detailed instructions on how they were expected
to calculate and report the required data, especially concerning how they were expected
to translate the market stress scenarios to P&L calculations for their own portfolios. In
order to ensure close cooperation with all the relevant authorities in the design phase,
a Stress Test Task Force4 (STTF) was setup and involved in the development of the
framework, including the scenarios, the data request and the assessment of the results.
We also organised two workshops, where the CCPs were consulted on the design of
the data request templates and the instructions.
13. The data request was launched immediately after the definition of the Stress Test
Framework, and the CCPs were requested to deliver the completed data templates to
the NCAs. This step was followed by the first data validation phase, where the NCAs
validated the submitted data against the instructions and according to a common set of
validation rules that detailed the checkpoints and set the allocation of work across the
participating authorities (i.e. NCAs and ESMA). Each NCA appointed one officer that
was the single point of communication. Where needed, the appointed officers were in
contact with ESMA staff and fellow officers from other NCAs in order to facilitate the
consistent implementation of the framework across all CCPs. Moreover, in order to
facilitate the convergence of the validation practices across different authorities, ESMA
staff compiled and shared with the authorities a list of frequently asked questions,
together with the respective answers. The first validation phase was concluded with the
delivery of the data templates to ESMA that acted as a second line of defence in terms
of data quality assurance. Following the NCAs’ validation, ESMA checked at least on a
3 https://www.esma.europa.eu/file/21270/download?token=EmSs2Ank 4 Participants of the Task Force included experts from National Competent Authorities (NCAs), representatives from other Competent Authorities in the Member States, one representative from ESRB and one representative from ECB. The ESRB participation facilitated the coordination of the input from the ESRB on the price shock definition, while the ECB involvement was particularly relevant for the design of the liquidity stress test.
Definition of the ST
Framework
Data Request
Data Validation
Data Analysis
Reconciliation
Final Publication

12
sample basis, that the reported data are consistent, reasonable and conform to the
requirements included in the instructions. It finally assessed the overall plausibility of
results, including a comparison between CCP results, to detect any outliers.
14. Following the data validation process, ESMA calculated and analysed the results by
applying the member/entity default scenarios. ESMA discussed the results with the Task
Force, where the relevant risk experts from almost all the NCAs in the scope of the
exercised were present. As a final step, ESMA reconciled part of the results with each
individual CCP via the relevant NCA, in an effort to reconfirm their robustness. ESMA
could not reconcile with NCAs / CCPs all results, as for example the EU-wide scenarios
contain indications about specific clearing members’ exposures in other CCPs.
Therefore, the set of results that could be shared with each NCA/CCP for reconciliation
are only the ones that are CCP-specific and refer to results produced using this specific
CCP’s exposures. The reconciliation process had to be done within a very short
timeframe. The purpose of this process was to reconfirm the correctness of the
interpretation of the sourced data and the absorption of losses through the CCP’s
resources.
15. Overall, although not directly comparable due to the different approach employed, the
level of data quality assurance for the credit stress data is much higher than what was
achieved during the first exercise. This allows for a higher degree of transparency when
it comes to the publication of data. The introduction of an enhanced framework, the two-
step validation process and a reconciliation phase has provided additional comfort
concerning the quality of the sourced data and the results. One caveat, that has to be
emphasised though, is that ESMA staff lacked the resources, detailed knowledge of
specificities of products cleared, and direct access to the CCPs in order to redo all the
validation checks that have been performed by the NCAs. This also applies regarding
checking the details of the modelling procedures employed by each CCP for product-
level valuations or conservative propagation of shocks in the forward curve. Therefore,
to a significant extent, the quality of the data and results still rely on the primary checks
performed by the NCAs.
16. Concerning the level of granularity of published results, the different approach for the
liquidity results is justified by the fact that this was the first EU-wide CCP liquidity stress
test. Thus, the liquidity stress instructions were lagging in detail, leading to some
residual uncertainties concerning the interpretation of the underlying data. Moreover,
the liquidity stress tests are generally more complex than the credit stress test, while
the approaches used by the different CCPs in their own stress frameworks are also less
harmonised and focus more on the individual liquidity needs and sources. Since a multi-
CCP exercise cannot acknowledge fully the individual processes at each CCPs, several
modelling assumptions needed to be made, which are sensitive to the interpretation of
the underlying data and therefore susceptible to potential misleading interpretations.
17. Overall, we believe that the introduced methodological and procedural changes have
greatly contributed to the robustness of the exercise. It should however be noted that
the changes have at the same time significantly increased the complexity of the exercise
and therefore the effort required for all participants involved. Moreover, as with all stress
test exercises of this scale and type, not all limitations can and will be addressed in this

13
exercise. We are however committed to further improve and evolve the methodology in
future stress tests.
3 Methodological overview
3.1 Key aspects and components
18. The stress test exercise has the following components:
Credit Stress: Assess the sufficiency of CCPs’ resources to absorb losses under
a combination of market price shocks and member default scenarios.
Liquidity Stress: Assess the sufficiency of CCPs’ liquid resources under a
combination of market price shocks, member/liquidity provider default scenarios
and additional liquidity stress assumptions.
Reverse Credit Stress: Increase the number of defaulting entities and level of
shocks to identify at which point resources are exhausted.
Additional Analysis
Concentration analysis: Assess the degree of concentration of CCPs
exposures.
Inter-connectedness: Assess the degree of inter-connectedness of CCPs
through common clearing members / service providers groups.
CM knock on analysis: Assess the impact of the loss sharing mechanism
of CCPs (default fund contributions and powers of assessments) on the
capital of non-defaulting clearing members.
3.2 Market Stress Scenarios
19. One of the key methodological changes of the new exercise has to do with the design
and use of the market stress scenarios. In particular, the stress results are not based
FIGURE 2: COMPONENTS OF THE STRESS TEST EXERCISE

14
on the CCPs’ own scenarios subject to a list of minimum price shocks, or on modelled
hypothetical scenarios5. The stress results in the new exercise are based on a set of
pre-defined and internally consistent market stress scenarios that have been provided
by the ESRB6 and are common across all CCPs. The same market stress scenarios are
used for credit and liquidity stress tests.
20. The financial shock scenarios stem from an assumed, abrupt (instantaneous)
materialisation of one or multiple risks to the EU financial system (as identified by the
ESRB).
Box 1: Narrative of the CCP stress test scenario provided by ESRB6
The scenarios for the CCP stress test take as a starting point the materialisation of
any of the key risks to the EU financial system identified by the ESRB. This could
happen in the event that new information or data is released that hints at a likely or
actual materialisation of one or more of these risks. This, in turn, may result in a
surge in risk premia, leading to major shifts in market prices across a broad range
of asset classes. In such an event, market price movements would be coupled with
increased volatility. The dependence between asset prices observed during normal
times would likely change materially during a short period of time, with no clear
direction of safe-haven flows across countries and markets. While such
unprecedented asset price movements may be short-lived and global financial
markets may stabilise swiftly, it is assumed that markets would undergo pronounced
stress lasting for at least five days.
21. The ESRB has developed the methodology and calibrated the common adverse
financial scenarios that were used for the current exercise. The ESMA Stress Test Task
Force actively provided input and feedback during the design phase in order to ensure
that the provided shocks would have the expected level of granularity and severity. The
shocks were calibrated for a large number of high-level risk factors and the CCPs were
asked to provide stress results for these specific market stress scenarios. This way the
results across CCPs will be based on the same scenario and not on different scenarios
meeting minimum risk factor shocks.
22. The scenarios are also internally consistent and were calibrated to take into account
historical dependencies reflecting realistic assumptions of co-movements of risk factor
prices, also in times of stress. In order to respect that condition, it was not possible to
simply combine the maximum shocks for different asset classes. For that reason, in
order to ensure that all CCPs clearing a wide range of financial products are subject to
sufficient stress, it was needed to use multiple (three) scenarios. They differ from each
other with respect to the market segment (Rates, CDS or FX) from which a shock is
assumed to originate. Each shock scenario is consistent in that dependencies of all risk
5 HypA / HypB scenarios used in the first exercise were calibrated by scaling up margin requirements. 6 link to Stress Scenarios

15
factors vis-à-vis the shock origin are accounted for. For example, the first scenario
(“CDS”) reflects severe shocks for many asset classes, including Equities, Bonds and
CDS. Since it could be misleading to associate the scenarios and severity of relevant
results to individual asset classes, we used for the identification of the market stress
scenarios the codes 1, 2 and 3 instead of the original names.
23. EMIR mandates that for each identified market the CCP shall specify extreme but
plausible conditions based at least on a range of historical scenarios, including periods
of extreme market movements observed over the past 30 years, or as long as reliable
data have been available, that would have exposed the CCP to the greatest possible
financial risk. The initially proposed methodology with a 2-day simulation period did not
produce high enough stress levels to match the observed historical worst cases for most
risk factors. This could be in part linked to some basket averaging effect coming from
the choice of a set of driving risk factors and from the technical limits arising from the
confidence level that can be chosen. In order to achieve a higher severity while keeping
the same co-dependency between the returns, the CDS and Rates scenarios have been
scaled by a common factor. The choice of the scaling according to the 5-day rule yields
reasonable numbers across asset classes consistent with the observed historical worst
cases.
Box 2: Simulation methodology employed by ESRB
The simulation methodology is based on a nonparametric conditional expected
shortfall approach. In each of the scenarios, the shock originates in a market
segment to which CCPs are exposed. The dependencies of all risk factors vis-à-vis
the shock origin are captured in a nonparametric manner, i.e. without pre-imposing
any parametric functional form on either the marginal distributions or the copula that,
together, constitute a joint distribution of all factors. Many of the factors involved in
the scenarios are characterised by highly non-normal features; therefore, a
nonparametric approach is warranted in order to avoid parametric misspecification
that might otherwise result in an underestimation of tail risk responses.
The scenarios are designed under the assumption of a predefined shock probability
of 0.1%, along with a forward horizon of two or five business days 7 . First, a
nonparametric conditional expected shortfall shock simulation is conducted using a
rolling window of 60 business days over the whole sample period and the conditional
responses of all risk factors are recorded. Then, in a second step, the 60-day
window which, on average, implies the maximum conditional responses to the shock
is selected to generate the shock responses.
7 Under the plain bootstrap approach, used in these simulations, it was not possible to achieve higher severity over a two-day horizon, as reducing the probability to below 0.1% did not add to the severity for statistical reasons. Therefore, the shock response profiles were initially simulated at the two-day horizon with a 0.1% probability and then scaled up to a five-day horizon for CDS and RATES
scenarios in order to achieve higher severity.
16
3.3 Credit Stress Test
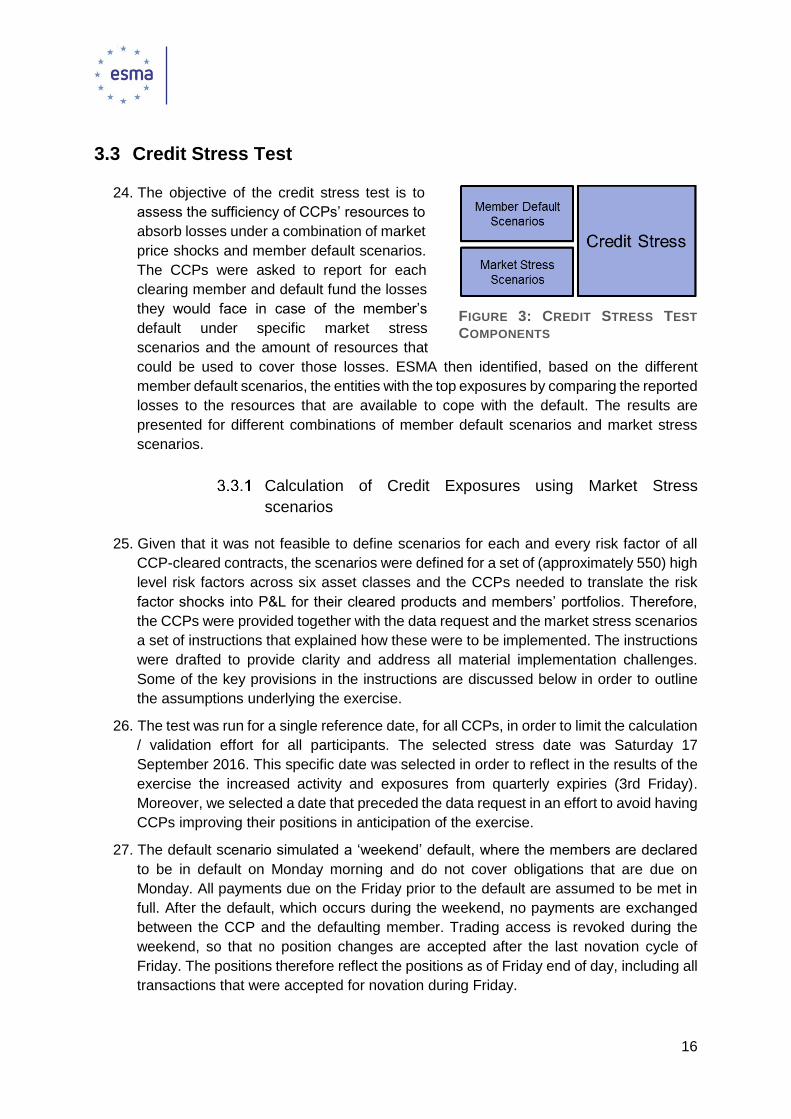
24. The objective of the credit stress test is to
assess the sufficiency of CCPs’ resources to
absorb losses under a combination of market
price shocks and member default scenarios.
The CCPs were asked to report for each
clearing member and default fund the losses
they would face in case of the member’s
default under specific market stress
scenarios and the amount of resources that
could be used to cover those losses. ESMA then identified, based on the different
member default scenarios, the entities with the top exposures by comparing the reported
losses to the resources that are available to cope with the default. The results are
presented for different combinations of member default scenarios and market stress
scenarios.
Calculation of Credit Exposures using Market Stress
scenarios
25. Given that it was not feasible to define scenarios for each and every risk factor of all
CCP-cleared contracts, the scenarios were defined for a set of (approximately 550) high
level risk factors across six asset classes and the CCPs needed to translate the risk
factor shocks into P&L for their cleared products and members’ portfolios. Therefore,
the CCPs were provided together with the data request and the market stress scenarios
a set of instructions that explained how these were to be implemented. The instructions
were drafted to provide clarity and address all material implementation challenges.
Some of the key provisions in the instructions are discussed below in order to outline
the assumptions underlying the exercise.
26. The test was run for a single reference date, for all CCPs, in order to limit the calculation
/ validation effort for all participants. The selected stress date was Saturday 17
September 2016. This specific date was selected in order to reflect in the results of the
exercise the increased activity and exposures from quarterly expiries (3rd Friday).
Moreover, we selected a date that preceded the data request in an effort to avoid having
CCPs improving their positions in anticipation of the exercise.
27. The default scenario simulated a ‘weekend’ default, where the members are declared
to be in default on Monday morning and do not cover obligations that are due on
Monday. All payments due on the Friday prior to the default are assumed to be met in
full. After the default, which occurs during the weekend, no payments are exchanged
between the CCP and the defaulting member. Trading access is revoked during the
weekend, so that no position changes are accepted after the last novation cycle of
Friday. The positions therefore reflect the positions as of Friday end of day, including all
transactions that were accepted for novation during Friday.
FIGURE 3: CREDIT STRESS TEST
COMPONENTS

17
28. In the determination of losses, no hedging strategy is to be acknowledged or modelled.
In other words, the CCP is assumed to not having performed any risk mitigating
transactions in order to limit the risk of the defaulting member’s positions, but liquidate
all defaulting member’s position at the stressed price. All price movements are
supposed to be happening instantaneously at the time the defaults are announced and
no further price action after Monday was modelled.
29. All positions are assumed to be closed, for each individual account, at the prices implied
by the stress market shocks. The CCPs were asked to report the requested data, for
each default fund, at clearing member (and not account) level in order to constraint the
amount of data to be managed. The CCPs still needed to reflect all applicable
segregation rules, e.g. that client’s resources cannot be used to cover losses from house
positions. It was assumed that no porting of clients would occur, hence all client’s
account are not assumed to be ported and are assumed to be liquidated at the same
stressed prices.
30. The CCPs are asked to report both the minimum required collateral, i.e. not including
any excess amounts, and separately the total available collateral. The minimum
required margins were defined as the sum of the following amounts:
the margins required on Friday morning,
any payment issued and paid during Friday as a result of margin calls,
any of the collateral previously held as excess but consumed by the member’s activity
or intra-day valuations during Friday and offset against the computation by the CCP of
margin requirements during Friday, the absence of which would have led to a margin
call according to the CCP’s existing rules and procedures.
31. The minimum required collateral is meant to reflect a scenario where defaulting
members would have withdrawn under stressed conditions any collateral exceeding the
minimum required. In fact, any member experiencing financial difficulties would most
probably post only the minimum required collateral. Nevertheless, the CCPs have been
asked to report also the actually held (total available) collateral, including excess
amounts. Therefore, although the base stress results will only consider the required
collateral, for completeness reasons we will also present the stress test results using
the excess collateral, where this would make a difference. In order to make the two sets
of results (with / without excess) directly comparable, the same defaulting entities will
be considered and in particular, the defaulting entities will always be selected using the
minimum required collateral without the excess.
32. Beyond the margin collateral that cannot be used to cover losses stemming from other
member(s)8, the CCPs were also asked to report additional prefunded resources that
correspond to the different layers of their default waterfall, i.e. the resources that can be
used in case of a clearing member default. These included the default fund contributions
of clearing members, the additional dedicated CCP resources (“skin-in-the-game” or
8 Additional restrictions apply, such as for example, that client collateral can only be used to cover losses from the same account. The CCPs were asked to reflect these restrictions in the stress losses reported.

18
SITG) as required by EMIR and other additional resources that can be used in case of
a default of a clearing member, where applicable.
33. A typical default waterfall is presented below, only for illustration purposes. The actual
default waterfall of each individual CCP, as this was reflected in the data reported, has
been considered to calculate the absorption of losses in the EU-wide CCP stress tests.
34. The default fund amounts considered in the stress exercise reflect the minimum default
fund contributions actually paid on the Friday evening before the default. Pending
default fund contributions that were not met until that time were not taken into account.
Concerning the own dedicated resources, (“skin-in-the-game”), the CCPs were asked
to report the full actual dedicated resources as of the reference date, even if higher than
the minimum requirement9.
35. CCPs were also asked to report additional committed and prefunded resources, where
available to cover losses within the given default fund (other DF-level resources) or
across Default Funds (other CCP-level resources). According to the instructions, these
resources should be committed and prefunded, reflected in the rules of the CCP setting
the applicable default waterfall and invested in accordance with the investment policy
requirements of EMIR. This type of resources cannot include any type of (parental10)
guarantees.
36. Beyond the prefunded resources, the CCPs were also asked to report separately the
amount of Powers of Assessment11 that can be called from each member and default
fund. Since the amount that can be called may depend on the number of defaulting
members, the CCPs were asked to report the maximum amount subject to different
number of members defaulting, in line with the provisions of their own Rulebooks as of
the reference date.
9 As set in EMIR RTS Article 35. 10 e.g. non-prefunded guarantees provided by affiliates. 11 Powers of Assessment refer to additional not-prefunded resources that can be called from non-defaulting clearing members following a default.
Other Default Fund-level or CCP-level Resources
Default Fund Contribution of non-defaulting member
Dedicated own resources ("Skin-in-the-game")
Default Fund Contribution of defaulting member
Margin of defaulting member
FIGURE 4: CCP DEFAULT WATERFALL
19
37. The amounts were reported in one currency (EUR) also accounting for the provided FX
shocks. In particular, the conversion of results from other currencies to EUR, was
performed using the ECB exchange rate as of Friday before the default, and the shocks
provided for the stress of FX markets. In other words, all currency conversions reflected
the stressed exchange rates.
38. CCPs were also instructed on how to identify or adjust when needed the shocks to be
applied to their own products using the defined risk factor shocks. Instructions were
provided, where relevant, also per asset class. For example, this included the
methodology used for calibrating shock multipliers for underlyings with high volatility or
low liquidity, the treatment of products with no directly applicable shocks12, and the
methodology to be used for modelling shocks along the different point in the curves. As
a general rule, CCPs needed to operate a full repricing on the basis of the provided risk
factor shocks using the pricing models they normally use for the daily valuations of
positions, as opposed to any approximate pricing model or sensitivity-based estimation
of losses. Wherever available, CCPs were instructed to use actual market prices for the
base price, i.e. the price to which the shocks are to be applied. Model-implied prices
were only to be accepted where market prices are not available or not reliable.
39. Overall, the level of the granularity of the instructions was driven by the need to balance
between very detailed instructions that would not cater for the different characteristics
of products cleared at different CCPs and very high-level instructions that would leave
large room to the CCPs for interpretation. The instructions were drafted with a view to
provide clarity and address all material implementation challenges. Considering the very
large number of products cleared at the different CCPs, it was not possible for ESMA to
verify the prudent interpretation of the instructions across all CCPs, since it would
require the knowledge of the characteristics of the different products. The NCAs, having
direct access to the CCPs and better knowledge of the individual products cleared at
each CCP, were in a better position to check during the validation process and verify
the prudent implementation of the provided instructions.
Member Default Scenarios for Credit Stress Test
40. The credit stress test targets to assess the sufficiency of CCPs’ resources subject to a
number of clearing members defaulting under stressed market conditions. Therefore,
the results are always presented for a combination of one of the three market stress
scenarios with a member default scenario. The member default scenarios define the
conditions that are used to select the entities that are considered to be in default. The
following member default scenarios were tested.
41. MD-A: For each CCP, we identify the two (2) Clearing Members with the highest
exposure under a particular market scenario. These members are considered to be in
default across all CCPs. This means that a CCP can face multiple members (more than
2) defaulting at the same time. This member default scenario may lead to an extremely
12 This is only the case for a few products with an assumed marginal impact on the end-results. The CCPs were instructed to use their own stress scenarios, making also sure that these are consistent with the provided narrative.

20
large number of clearing members defaulting, because of the cross-default condition.
However, it has the merit of ensuring that members will default in all CCPs and thus all
CCPs will be stressed at the same time.
42. MD-B: Across all CCPs (EU-wide), we identify the two (2) corporate groups with the
highest aggregate exposure under a particular market scenario. All clearing members
that belong to an identified corporate group are assumed to default across all CCPs.
Also in this case, this may count for more than 2 members per CCP but the number of
members defaulting at each CCP is expected to be smaller when compared to the MD-
A scenarios. The reason for that is that the initial condition requires the default of 2
groups across all CCPs as opposed to 2 members per CCP.
43. Cover-2 groups per CCP: For this scenario, we select the defaulting clearing members
as the members belonging to the top-2 groups of clearing members for each CCP. The
defaulting clearing members will be different for each CCP and are not considered to be
in default in other CCPs. This scenario includes the rather unrealistic assumption that
an entity would default in only one CCP, but will help assess the resilience of individual
CCPs and interpret the results. In particular, the MD-A scenario, where we select the
top-2 clearing members per CCP and then consider these entities to be in default in all
other CCPs, leads to an extremely large number of entities defaulting at EU-wide and
at CCP level. The assessment of the resilience of individual CCPs cannot be solely
based on a scenario involving this rather unrealistic number of defaults. Moreover, the
MD-B scenarios, where we select the top-2 groups EU-wide, cannot be used to assess
the resilience of individual CCPs, as the selection algorithm will always focus on the two
most systemically important groups and may fail to highlight shortfalls for individual
CCPs. Therefore, the inclusion of this member default scenario is important in order to
allow the assessment of the resilience of individual CCPs.
44. We also explored the use of an additional member default scenario (MD-C), which is in
practice only a variation of MD-B. Across all CCPs (EU-wide), we would identify the two
(2) corporate groups with the highest aggregate exposure weighted by the probability of
default under a particular market scenario. The weighting was based on the
multiplication of exposures with default probabilities (which is not contemplated in MD-
B), while the probabilities of default (PDs) were provided by ESRB13. The methodology
used to calculate the market-implied PDs, is detailed in the scenarios provided by
ESRB. One should note, that the PDs would be used to weight the exposures only when
selecting the top groups, while the unweighted exposures would be used to assess the
sufficiency of the resources of CCPs. MD-C could represent a more likely scenario to
materialise, as it takes into account the probability of the default of an entity. It was
identified that the results from this scenario would be very similar to the results of the
MD-B scenario, leading to broadly the same defaulting members and therefore impact
on CCPs. Therefore, it was decided not to present these results, as also by construction
the MD-B scenario will always generate more losses than MD-C.
13 The ESRB provided the CDS-implied PDs for a list of entity groups that was selected by ESMA as the most relevant in terms of exposure. If one group consisted of more than one entity, the average CDS price of the group was computed by averaging over the average CDS price of each entity. Where the PD was not available, a default value was used.

21
Residual Limitation of Credit Stress Test
45. As with all similar exercises, not all limitations can be addressed within a single and at
the same time practicable design. The methodology has significantly evolved to address
important limitations that were experienced in the first EU-wide stress test. The following
limitations will not be addressed in the context of credit stress analysis in this year’s
exercise. As already stated, we are committed to further improve and evolve the
methodology in future exercises.
46. Any risks stemming from CCPs policies/decisions to invest the available resources
including the provided collateral will not be covered in the context of the credit stress
test, as the CCPs were asked to report the cash equivalent amounts. For example, any
potential losses linked to the selection of the custodian or counterparty of CCPs
investments are not explored in the course of the credit stress exercise. Potential
adverse implications on the liquidity risk profile are further explored in the context of the
liquidity stress test. Similarly, any residual market risks in case of collateral prices falling
more than what is reflected in the CCPs haircuts are not considered.
47. Wrong way risks linked to the default of the issuer of instruments that are cleared or
used as collateral / investment can also not be considered, as the defaulting entities will
be identified after the data delivery. For example, wrong way risk would materialise if
part of the collateral posted to the CCP by one defaulting member was issued by another
defaulting member. This limitation is due to the fact that the selection of which members
are supposed to default needs to be performed ex-ante by selecting the largest
exposures to a member or to its group.
48. Potential second round effects to prices following the default of entities will not be
modelled. The price shocks are the ones provided by the ESRB and the number of
defaults are the ones described above, but the two are taken exogenously. Also, the
default of additional entities due to losses accumulated from non-cleared exposures are
not considered because the scope of the exercise is limited to CCPs exposures. The
potential of second round effects to non-defaulting members via the risk-sharing
mechanism of CCPs (e.g. default fund and powers of assessment) will be assessed as
part of the additional analysis (CM knock on analysis), but only the defaults implied by
the member default scenarios will be considered when testing the sufficiency of the
resources.
3.4 Liquidity Stress Test
49. For the purpose of the ESMA Union-wide stress test, liquidity risk can be defined as the
risk that the CCP has insufficient liquid funds to meet its payment obligations in a timely
manner when they become due over the relevant time horizon. It can arise due to
unexpected generation of liquidity needs and/or absence of sufficient liquidity resources.
50. The liquidity stress test assesses the resilience of EU CCPs to market wide and
idiosyncratic liquidity stress events. It captures the systemic dimension of liquidity risk
22
in addition to the analysis of resilience of individual CCPs and enables ESMA to identify
potential shortcomings and issue recommendations to address those.
51. Under Article 51(2) of the RTS (Commission Delegated Regulation EU No 153/2013),
CCPs are required to conduct stress tests considering inter alia their liquidity risk
management frameworks. Under Article 54(3) of the RTS, scenarios used in the stress
testing of liquid financial resources must consider the design and operation of the CCP,
and include all entities that might pose material liquidity risk to it.
52. Article 32(4 and 5) of the RTS prescribe the framework to be designed and implemented
by individual CCPs in order to accurately address the liquidity risk dimension of the CCP
stress tests, taking into account any interdependencies across the entities and multiple
relationships it might have to those entities in its liquidity risk management framework.
53. ESMA incorporated the above regulatory requirements in the design of this exercise.
Liquidity modelling overview
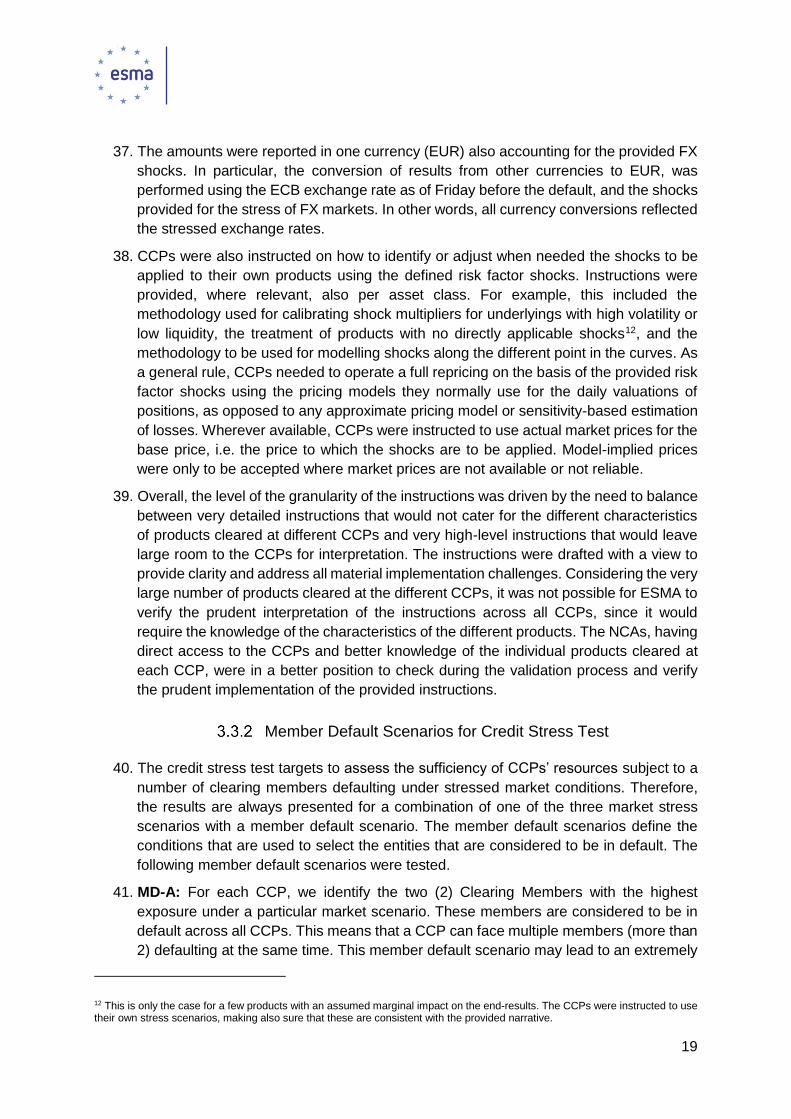
54. The objective of the liquidity stress test is to assess the adequacy of CCPs’ liquid
resources under a combination of market price shocks, member and/or liquidity provider
default scenarios and additional liquidity stress assumptions.
55. A liquidity scenario involves the
combination of market shocks with the
simultaneous default of market
participants. The shocks are the ones
applied in the context of counterparty
credit risk. The default of market
participants is the actual or technical
insolvency of Clearing Members and/or
providers of liquidity and services with
impact on the liquidity profile of an individual CCP.
56. Given the market shocks, cash inflows and outflows were calculated and reported by
the CCPs for the whole duration of the liquidity horizon. The liquidity horizon is set at 7
days, as some CCPs use a 7 days MPOR on OTC products. A final bucket aggregates
any cash flows that come strictly after the maximum horizon.
57. A liquidity mismatch analysis of individual CCPs is then run under the different
scenarios; all projected cash in- and outflows, linked to clearing, facilitating settlements
and payments and investment activities as well as other cash flows relevant to the
operational activities of the CCPs for the predefined time horizon are aggregated per
time bucket and the counterbalancing capacity is assessed.
58. Liquidity risk is generated by the following channels:
59. Variation Margin due by the defaulted CMs: CCPs need to post cash VM to non-
defaulting CMs for positions held by defaulted CMs.
FIGURE 5: LIQUIDITY STRESS TEST
COMPONENTS

23
60. Reduction of initial margin of non-defaulting CMs: changes in initial margin
requirements of non-defaulting CMs are accounted for.
61. Settlement of obligations of defaulted CMs: cash flows are linked to the fulfilment of
the settlement of physical obligations of the defaulted CM. Cash outflows are generated
when a CCP has to step in on behalf of the defaulted CMs to post cash to non-defaulting
CMs or when a CCP needs to execute buy-in transactions for failed deliveries on behalf
of the defaulting member.
62. Non-performance of liquidity provider, which would imply a reduction of the
counterbalancing capacity (e.g. investment counterparties, credit line provider,
investment agent for funds received temporarily into its accounts, repo counterparties).
63. Non-performance of service provider: the CCP cannot get access to the funds
accumulated on its accounts with the payment / settlement / concentration bank due to
its failure.
64. Failure of custodian, which would incur in delayed/impaired access to assets held with
that custodian (including non-cash collateral and investments). We will assume no
access at all for the liquidity horizon.
65. The implementation of the methodology to compute exposures and resources was
implemented through an in-house program. Therefore, there is no discretion in how the
method is applied across CCPs.
66. The methodology was run on data provided by the CCPs and validated by the NCAs.
ESMA staff performed different levels of checks, ensuring for example a minimum level
of consistency between credit and liquidity. However, given the nature of the exercise
and its sensitivity to some of its inputs, the results could be affected by errors in the data
provided or assumptions used by CCPs to extract these data. The two levels of
validations (by NCAs and ESMA staff) aimed at limiting the risk of wrong computations
by CCPs, but this risk cannot be completely eliminated with ex-post desk-based
verifications.
Evaluating the liquidity position of a CCP
67. As required by the framework, ESMA staff assessed the liquidity position of each CCP
in each of the currencies that it clears in, assuming that there is no access to the short-
term FX markets. We will only report the results for the main currencies: EUR, USD and
GBP.
68. In addition, the overall liquidity position of that CCP is assessed by relaxing the
assumption of FX market closure at the CCP level.
69. Given a set of liquidity assumptions, the algorithm identifies: the liquid resources,
liquidity requirements and other counterbalancing capacities.

24
70. The algorithm then computes the liquidity position, performing the aggregation
according to the right of use of collateral rules14.
3.4.2.1 Liquidity assumptions
71. Before assessing the liquidity position of a CCP, a selection of the defaulting entities
and of the modelling assumptions is performed.
72. The entities considered to be in default under the different scenarios are selected from
an initial list of all entities having one of the following capacities: clearing members,
issuers, custodians, payments banks or repo counterparties.
73. CSDs, Central Banks or issuers of government fixed income securities are never
defaulted in the exercise. The interoperability between CCPs is not taken into account.
74. The payment bank capacity is tested by assuming that any net positive inflow going
through a defaulting payment bank will be lost if it occurs at T+0 (Monday). This is done
for each clearing member in each relevant currency.
75. Based on the framework, various liquidity assumptions are made, covering both the
market conditions and the tools available to the CCPs. In the presentation of the results,
we varied some of the assumptions to assess their impact.
76. In particular, we analysed the impact of: a market access delay of one day when
attempting to sell liquid resources, of a settlement lag of 2 days for sell-offs of liquid
resources and securities, and of including excess collateral in the liquid resources.
77. Therefore, the exercise tests different tools used to fulfil liquidity needs, i.e.is based on
a set of very conservative, but realistic end of day assumptions to compute the liquidity
needs of the different CCPs. These assumptions are:
a. No access to short-term FX markets.
b. Market access delay of one day for liquid resources.
c. A settlement lag of 2 days for asset sell-offs.
d. No use of excess collateral.
e. No use of uncommitted repo lines.
78. As explain in section 4.6, some of those assumptions are relaxed to identify the tools
on which CCPs rely on to fulfil their liquidity needs.
79. In addition, when CCPs have access to central bank liquidity and although this liquidity
resource is highly reliable, we have quantified the reliance on this tool by testing the
liquidity need that would result in the implausible event of absence to central bank repo.
This by no means puts into question the availability of this tool, but it is the only way to
test the degree of reliance on it, which was one of the objectives of the exercise.
14 For example: a security posted as collateral by a member may or may not be usable by the CCP for liquidity purposes for the management of a default

25
3.4.2.2 Identifying the liquid resources
80. Within the chosen default fund and the chosen currency, we selected all the liquid
resources (defined in Article 47(1) of EMIR and Annex II of the RTS) that are not in the
custody of or issued by the defaulting entities. Uncommitted credit lines are not taken
into account.
81. Liquid resources must be of one of the following types: Cash - Central Bank, Cash -
Commercial Bank Secured (Reverse Repo), Cash - Commercial Bank Unsecured
(Deposit), Government Fixed Income Securities, Other Fixed Income Securities,
Equities or Committed Line. Banks guarantees are not considered.
82. The liquid resources considered are the ones allocated to CCP own funds, committed
lines, default fund contributions, required collateral / IM or SIG (skin in the game).
3.4.2.3 Identifying the liquidity requirements
83. In each relevant currency, the CCPs have reported the schedule of flows arising from
Variation Margin, Premium Settlements, IM change, Settlement. ESMA staff checked
the reporting convention for flows to achieve consistency between credit and liquidity.
84. The algorithm selects the relevant liquidity requirements given the defaulting entities
and the assumptions, assuming that the CCP will have to make / receive payments to /
from non-defaulting clearing members.
85. The close of business schedule will add cumulative relevant cash flows per clearing
member.
86. Any flows from liquidity provisions are added at this stage.
3.4.2.4 Liquidity exposure profile
87. The schedule of liquid resources is modified to reflect the assumptions made on market
access delay, on settlement lag and on the nature of the repo lines
(committed/uncommitted).
88. It takes into account the list of repo counterparties and their respective capacities per
currency. It is assumed that repos are entered up to the maximum capacity per currency
given the available collateral for the maximum duration.
89. Likewise, the schedule of liquidity requirements is modified to reflect liquidity provisions
and intraday assumptions.
90. The intraday modelling depends on the number of settlement cycles. The purchase of
securities that should have been delivered by the defaulting clearing members need to
be done before starting the settlement cycle. This extra liquidity need is added on the
day of the purchase only. The number of securities to be bought is inversely proportional
to the number of settlement cycles. The more settlement cycles the less significant the
intraday impact will be.

26
91. Under the chosen working assumptions, the schedule of liquidity exposures is
generated by aggregating the different resources and requirements.
92. Having looked at the resources available in each default fund, we then look at the
resources available from the defaulting members that were not already taken into
account. This could include resources not used in one default fund, and that could be
used in another one.
93. The CCPs were able to define the largest usage possible for each resource (i.e. clearing
member, default fund or CCP level). Some resources are restricted to clearing member
or default fund level.
94. For each non-defaulting clearing member that has the usage of its collateral restricted
to itself, we take out from the liquidity position both its restricted liquid resources and
the liquidity requirements for “IM change” and “Premium Settlements”. The “Variation
Margin” and “Settlement” flows are unaffected as they are passed through.
95. We assume that all resources of defaulting CMs can be used at CCP level. We make
the simplifying and lenient assumption here that even client margin of a defaulting
member can be used for liquidity purposes only at CCP level.
96. We then perform the aggregation and get the final position per currency. The worst
position over the schedule is taken as the liquidity position.
97. Finally, to get the overall liquidity position, assuming access to the short term FX
markets, we aggregate all the currencies, converting them to EUR using stressed FX
Rates.
Entity selection procedure
98. For each market stress scenario, ESMA staff performed the selection of entities using
the most conservative end of day liquidity assumptions. No selection was performed
using any other set of assumptions.
99. When performing further analysis by varying the liquidity assumptions, we will assume
that the entities defaulting are unchanged. This helps the analysis and reduces the
computational requirements. This means however that the entities selected are not
necessarily the worst ones in terms of liquidity outside of the most conservative
assumptions.
100. The selection is based on the worst liquidity position aggregated over all currencies
given the defaulting entities. In order not to select an entity based on a marginal gap in
a marginal currency, any excess from one default fund is not restricted to that default
fund. Therefore, the entities selected are not necessarily the worst ones in terms of
liquidity for each currency.
101. As restricting the defaults to 2 entities or groups per CCP generates interesting results
already, we are not reporting results assuming that all those entities default across
CCPs, which would generate unrealistic liquidity requirements on the CCPs.

27
102. However, we are reporting the results from a scenario called LDB where we select the
top-2 groups EU-wide.

28
4 Stress Test Results
4.1 Background Analysis
103. The 16 CCPs included in the scope of the exercise provided detailed data on their
exposures and resources. This data was used to run the credit and liquidity stress tests
presented in the following sections. The background analysis presented in this section
is used to set the scene for the core stress test analysis, provide a useful overview of
the size of the industry, the breakdown of activity by individual CCPs or participants and
also to help identifying convergent or divergent practices.
104. It should be noted, that the resources required from CCPs may vary significantly from
one day to another and the presented results correspond to one particular date, i.e. the
reference date of the stress test. It cannot therefore provide any information on the
height of the resources held at any other time, including the time of publication of this
report. Although one can identify different practices and risk management techniques,
the purpose of presenting this data is not to benchmark CCPs. Different CCPs clear
different products with distinct characteristics. The size of resources or exposures alone
cannot indicate the effectiveness or efficiency of the CCP’s risk mitigation
arrangements. The resilience of CCPs to adverse market developments is assessed
using the credit and liquidity stress results presented in the following sections.
CCPs
105. The total amount of default fund contributions at each CCP is presented in the following
chart. For CCPs that have more than one default funds, this corresponds to the sum
across all default funds. The CCPs are ranked by the total amount of default fund
contributions and it can be seen that the top-5 CCPs are significantly larger than the
remaining CCPs. The total amount of default fund contributions across all CCPs
corresponds to 21.7bn EUR, with the top-5 CCPs collecting 93% of these contributions.

29
FIGURE 6: CCPS BY TOTAL SIZE OF DEFAULT FUNDS
106. The total amount of margin required by each one of the 16 CCPs across all their
clearing services is presented in the following figure. The illustrated amounts include all
required margin, such as initial margin and the different margin add-ons, but exclude
any excess margin held on top of the minimum required. The conditions used to define
the required versus the total (i.e. including excess) margin are set out in 3.3.1.
FIGURE 7: CCPS BY TOTAL REQUIRED MARGIN
107. The same CCPs are top-5 in terms of total required margin and total default fund
contributions and, similar to what is observed in the default fund case, they account for
approximately 92% of the total margin required from all CCPs. However, the margin
requirement for one CCP is significantly higher than the margin requirement of all the
remaining CCPs, while also the rank of the top 5 CCPs is not the same in the two charts.
These indicate that the allocation of resources between margin and default fund
contributions is not always proportional. This can also be observed in Figure 8, where
for each CCP we plot, using a logarithmic scale, the required margin versus the default
fund contributions.

30
FIGURE 8: TOTAL REQUIRED MARGIN VS DEFAULT FUND CONTRIBUTIONS
108. The size of the default fund contributions compared to the margin requirements
depends on several other factors, such as the number of clearing members, the
concentration of the exposures to the top clearing members, the minimum default fund
contributions and the ratio between adverse and stressed market conditions. Therefore,
it should again be highlighted that this alone can in no way be used as an indication of
the effectiveness or the efficiency of a CCP’s risk management arrangements.
Clearing Members
109. Close to 900 individual entities being clearing members to one or more CCPs have
been identified, while approximately 40 entities were members at 5 or more CCPs. The
number of clearing members and cumulative share (percentage), in terms of their
aggregate contribution to the Default Fund of all CCPs (Figure 9) and in terms of the
aggregate margin required again from all CCPs (Figure 10) are presented below.

31
FIGURE 9: CLEARING MEMBERS ACCORDING TO THEIR AGGREGATE DF contributions
FIGURE 10: CLEARING MEMBERS ACCORDING TO THEIR AGGREGATE MARGIN
REQUIREMENT
110. It can be seen that one single entity has an aggregate default fund contribution of more
than 1bn EUR. In terms of margin requirement, the top 14 entities have each provided
margins that were higher than 5bn EUR. In both cases, the top-10 entities account for
approximately 30% of the resources provided and overall there is no strong evidence of
significant concentration of resources.
111. As expected, when the same analysis is run at the corporate group level, after adding
the resources provided by affiliates within a single group, the level of concentration
increases (Figure 11 and Figure 12). In total, we have identified approximately 65
clearing member groups having more than one entity active as a clearing member at
EU-CCPs. The top-10 groups account for approximately 50% of the provided resources,
while there are 5 groups with a default fund contribution of more than 1bn EUR and 10
groups with a margin requirement of more than 10bn EUR.

32
FIGURE 11: CLEARING MEMBER GROUPS ACCORDING TO THEIR AGGREGATE DF
CONTRIBUTIONS
FIGURE 12: CLEARING MEMBER GROUPS ACCORDING TO THEIR AGGREGATE MARGIN
REQUIREMENT
Prefunded Resources
112. The total amount (and % share) of resources allocated to each tranche of the default
waterfall across all CCPs can be seen in the following picture. The aggregate margin
requirement from all CCPs is approximately 250bn EUR with the total default fund
contributions reaching 21.7bn EUR (8% of all resources). The dedicated own resources
(“skin-in-the-game”) account for a very small part of the default waterfall (0.2%), while
this is also the case for other additional prefunded resources provided by the CCPs.
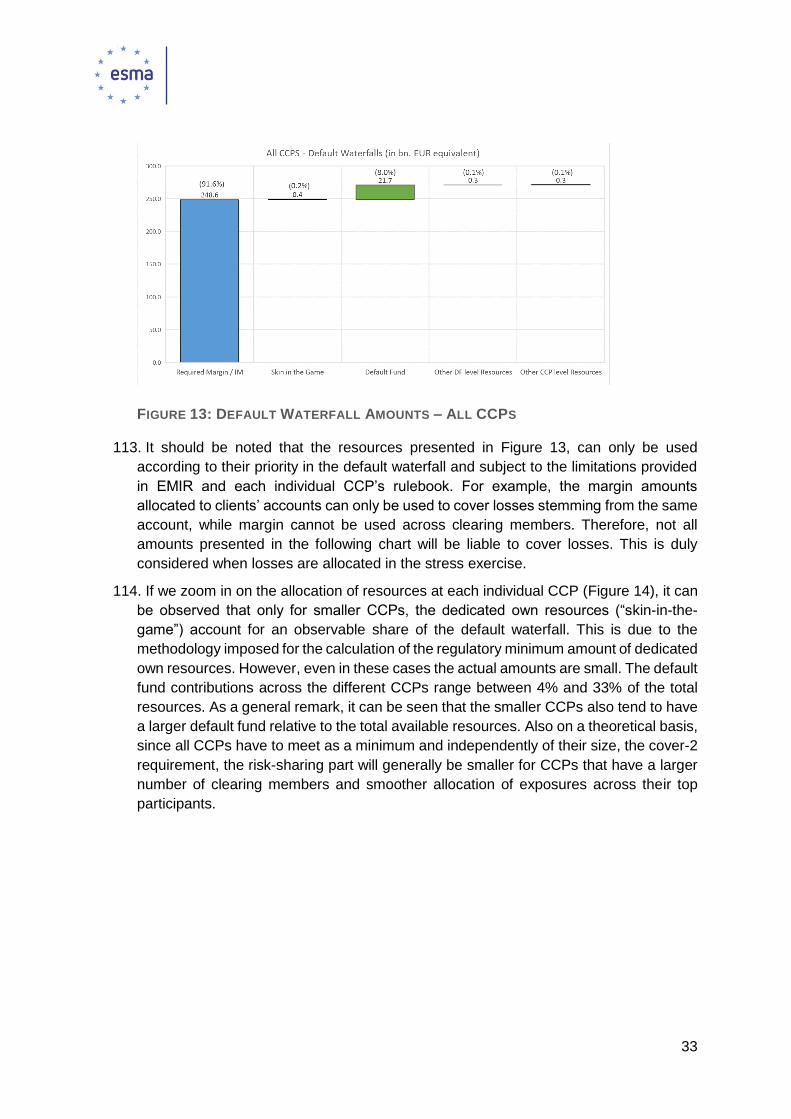
33
FIGURE 13: DEFAULT WATERFALL AMOUNTS – ALL CCPS
113. It should be noted that the resources presented in Figure 13, can only be used
according to their priority in the default waterfall and subject to the limitations provided
in EMIR and each individual CCP’s rulebook. For example, the margin amounts
allocated to clients’ accounts can only be used to cover losses stemming from the same
account, while margin cannot be used across clearing members. Therefore, not all
amounts presented in the following chart will be liable to cover losses. This is duly
considered when losses are allocated in the stress exercise.
114. If we zoom in on the allocation of resources at each individual CCP (Figure 14), it can
be observed that only for smaller CCPs, the dedicated own resources (“skin-in-the-
game”) account for an observable share of the default waterfall. This is due to the
methodology imposed for the calculation of the regulatory minimum amount of dedicated
own resources. However, even in these cases the actual amounts are small. The default
fund contributions across the different CCPs range between 4% and 33% of the total
resources. As a general remark, it can be seen that the smaller CCPs also tend to have
a larger default fund relative to the total available resources. Also on a theoretical basis,
since all CCPs have to meet as a minimum and independently of their size, the cover-2
requirement, the risk-sharing part will generally be smaller for CCPs that have a larger
number of clearing members and smoother allocation of exposures across their top
participants.

34
FIGURE 14: DEFAULT WATERFALL % PER CCP
Required / Excess Collateral
115. CCPs were asked to report both the required and the total available margin collateral.
The assessment of the resilience of the CCPs will be primarily based on the minimum
required collateral. Overall, the excess collateral accounted for approximately 40bn
EUR and a relatively small percentage (13%) of the total provided margin collateral.
116. However, this is not the case for all CCPs. In particular, as it can be seen in Figure 16,
for 5 CCPs the excess collateral is higher than the minimum required collateral.
Although not always the case, one can observe that the share of the excess margin
tends to be higher for smaller CCPs and in particular CCPs that clear cash securities.
One of the key differences between cash- and derivative- clearing services is that for
the derivative clearing services the exposure is mainly driven by the stock of the existing
positions, while for the cash- clearing services the daily trading activity can account for
a large share of the end-of-day exposure. Because of the short settlement cycle of
securities, the exposure can change significantly from one day to another. Therefore,
clearing members tend to generally over collateralise their end-of-day exposures in
order to avoid potential intraday margin calls during the next trading session.

35
FIGURE 15: REQUIRED VS EXCESS COLLATERAL – ALL CCPS
FIGURE 16: REQUIRED VS EXCESS COLLATERAL PER CCP
Prefunded vs non-prefunded resources
117. According to EMIR, the CCPs shall maintain sufficient prefunded financial resources
to cover potential losses that exceed the losses to be covered by margin requirements
and the default fund. These shall enable the CCP to withstand the default of at least the
two clearing members to which it has the largest exposures under extreme but plausible
market conditions.
118. The CCP may also require non-defaulting members to provide additional funds in the
event of a default of another clearing member (Powers of Assessment). We have asked
the CCPs to report the maximum powers of assessment that can be called from each
clearing member and default fund in accordance with their own Rulebook. In many
cases, the CCPs link the maximum amount to be called from a single clearing member

36
to the number of defaulting entities, also expressed as a multiplier of its default fund
contribution at the time of the default. Therefore, the CCPs were asked to report the
maximum powers of assessment for a different number of defaults. These are
recognised and used consistently when running the stress test15.
119. Overall, the total amount that can be called by all CCPs in case of default of 2 clearing
members at each default fund of each CCP is 40bn EUR (Figure 17). As expected, this
is approximately equal to two times (number of defaults assumed) the prefunded default
fund contributions. Not all CCPs reported having provisions to call for powers of
assessments. These are not to be confused with the additional funds that should be
called by all CCPs to replenish a default fund after a default and in order to prepare for
potential future defaults. The powers of assessments are generally meant to cover
residual losses (over the prefunded resources) stemming from already experienced
defaults.
FIGURE 17: PREFUNDED VS NON-PREFUNDED RESOURCES
120. In Figure 18, one can observe how the total amount evolves as the number of defaults
assumed at each default fund of each CCP increases. As expected, the increase is not
proportional, as many CCPs have set a cap of the amounts that can be called at a
certain number of clearing members defaulting16. This is meant to implement the EMIR
requirement that the clearing members shall have limited exposures towards the CCP.
However, this is not a common practice for all CCPs. It seems that this provision is in
some cases interpreted as a requirement to have limited exposure per default of clearing
member. Therefore, the total amount is not capped even after assuming the theoretical
default of 10 clearing members. Nevertheless, the impact on non-defaulting clearing
members through the risk-sharing mechanism of CCPs, including the potential
additional non-prefunded calls, is assessed in the knock-on analysis.
121. Of course, one should note that each CCP uses different definitions, assumptions and
conditions, when setting the maximum amounts. These may include for example
specific cool-off periods, distinction between simultaneous and sequential defaults and
15 For example, if under a particular scenario, three (3) clearing members are considered to be in default, only the maximum amounts (subject to 3 defaults) that can be called from the remaining non-defaulting clearing members are considered in the stress test as part of the non-prefunded resources. 16 e.g. a CCP may call up to 3 times the original default fund contribution, even if more than 3 clearing members default.

37
different priorities amongst clearing members depending on the source of the default
event. Therefore, any effort to use a harmonised modelling approach in order to analyse
the impact across CCPs and clearing members can only serve as an approximation.
FIGURE 18: POWERS OF ASSESSMENT BASED ON THE NUMBER OF DEFAULTING
MEMBERS
Resources per currency and Asset Type
122. The CCPs were asked to report all liquid resources, including the margin collateral and
default fund contributions also broken down per currency and asset type. This data is
used here also to provide an overview of the allocation of resources in an effort to
identify outliers or increased concentration in particular currencies or asset types.
123. As the purpose of collecting this data was to run the liquidity stress test, the resources
and their allocation correspond to the actually available resources, as of the reference
date, considering the fact that the CCPs may re-invest the received collateral, subject
to specific requirements, thus changing the original currency or asset type. Due to the
re-investment of received collateral, there is not always a direct (one-to-one) link
between specific available assets and the origin of the provided collateral (i.e. which
member provided the resources, in what form and for what purpose). Therefore, where
provided resources were reinvested, the CCPs were asked to allocate the available
assets proportionally 17. The same rule was also used to allocated assets between
required and excess margin, subject also to concentration limits as these were
applicable to different CCPs. The total available collateral (i.e. including required and
excess) is used for the background analysis, while the impact from the non-availability
of excess collateral is further assessed in the stress tests. It should be noted, that the
data presented in this section correspond to a snapshot of the resources that were
available on one single day in the past and do not provide any information on the
resources held at any other time including the time of publishing the report.
124. In terms of currencies (Figure 19), approximately half of the margin collateral and
default fund contributions are available in cash or assets denominated in EUR. The top
17 for example, a clearing member that has contributed 10% of the reinvested cash could be allocated 10% of the amount invested in each asset type.

38
5 currencies (EUR, USD, GBP, CHF, JPY) account for 97% of these resources and
overall (at EU-wide level) there is no concern on increased concentration on smaller
currencies. Of course, individual CCPs that clear products in smaller currencies, do
accept collateral denominated in the relevant currencies.
FIGURE 19: CURRENCIES OF MARGIN COLLATERAL AND DEFAULT FUND
CONTRIBUTIONS
125. The aggregate breakdown of all CCPs’ resources in terms of different asset types is
presented in the following Figure. Overall, 59% of the resources correspond to Bonds
and Equities, 39% to cash and only 1% are provided in the form of bank guarantees,
including central bank and commercial bank guarantees. Category “Other”, accounting
in total for less than 1% has been used by CCPs to report other type of resources,
including for example interoperable collateral, asset backed securities and gold.
126. The vast majority (92%) of Bonds & Equities are Government Fixed Income Securities,
while 7% are Other Fixed Income Securities and only 1% Equities. For the purpose of
this exercise, fixed income securities are classified as Government Fixed Income
Securities when they are issued or explicitly guaranteed by a government, a central
bank, a multilateral development bank, the European Financial Stability Facility or the
European Stability Mechanism. They are classified as Other Fixed Income Securities
otherwise. Concerning cash, 42% is kept at a central bank and 57% at a commercial
bank under arrangements that secure the collateralisation of the cash18, leaving only 1%
kept in the form of deposits (unsecured) at commercial banks.
18 Arrangements that ensure the collateralisation of the cash with highly liquid financial instruments, e.g. reverse repo.

39
FIGURE 20: BREAKDOWN OF COLLATERAL AND DEFAULT FUND CONTRIBUTIONS BY TYPE –
ALL CCPS
127. The overall, EU-wide picture looks rather reassuring and no specific concern needs to
be raised concerning the different type of resources. In order to assess whether there
could be cases of over-reliance on specific types of collateral at particular CCPs, a
similar analysis is presented for each CCP in Figure 21.

40
FIGURE 21: BREAKDOWN OF COLLATERAL AND DEFAULT FUND CONTRIBUTIONS BY
TYPE PER CCP
128. Overall, it is difficult to identify across CCPs any prevailing convergent practices when
it comes to setting the eligible collateral types or investing the available collateral in
different asset types. The shares of the different asset types differ significantly between
the different CCPs. This was expected, as each CCP has to consider its own
environment and participants, subject also the strict regulatory requirements setting the
eligible asset types and additional conditions, including for example the
creditworthiness, marketability or wrong way risk of individual assets.
129. A number of high-level conclusions can still be drawn based on the presented data.
Almost all CCPs have government fixed income securities with the exception of two (2),
for which the majority of the resources are kept in the form of cash. Concerning access
to central bank deposits, ten (10) CCPs keep at least a share of the margin collateral
and default fund contributions at a central bank, but only for three (3) of them, this
accounts for more than half of the available resources.
130. Equities have been accepted as collateral by six (6) CCPs, but only for two (2) of them
this accounts for a material share of their resources, with the maximum share of equities
at a single CCP being 10%. For 2 CCPs, a significant share of the aforementioned
resources corresponds to fixed income securities, other than government bonds. These
are mainly corporate and covered bonds.
131. For two (2) CCPs, the share of cash that is kept in the form of deposits at commercial
institutions without ensuring its collateralisation through reverse repo arrangements is
significant. In both CCPs, only one commercial institution is used, which is not the same
for the two CCPs.
132. In terms of over-reliance to individual asset types, one (1) CCP reported investing all
collateral received in government fixed income securities. Moreover, although only a

41
few CCPs reported having accepted bank guarantees, for one (1) of them this accounts
for more than 90% of the margin collateral and default fund contributions. These are
guarantees issued by a central bank. For the remaining CCPs that reported having
accepted bank guarantees, only for one (1) CCP these included bank guaranties issued
by commercial banks.
4.2 Interconnectedness and Concentration
Concentration
133. The degree of concentration of CCP resources aims to identify the concentration of
default fund contributions (credit risk analysis) or liquidity provided (liquidity risk
analysis) at CCP and at the EU-wide level. The analysis focuses on individual legal
entity level and at group level, for clearing members (credit risk) or liquidity providers
(liquidity risk) respectively.
134. The degree of concentration of the CCP resources is calculated using the Herfindahl-
Hirschmann index (HHI), a measure developed and used in industrial economics to
assess the extent of concentration/competition in a particular industry. HHI is defined
as the sum of the squares of market share(s) of the i firms within an industry:
𝐻𝐻𝐼 =∑𝑠𝑖2
𝑁
𝑖=1
135. The index ranges from 0 to 10,000 points. Increases (decreases) in the HHI indicate a
decrease (increase) in competition. Competition and antitrust laws usually have the HHI
as a reference concentration measure as the HHI has the property of assigning
additional weight to firms with larger size (market shares are squared before being
summed up).
136. In the present analysis, the HHI methodology is applied to investigate the degree of
concentration of available resources within a CCP and across CCPs as part of the stress
test exercise (default fund contributions for credit and amount of liquid resources
provided for liquidity).
137. The rationale is that higher concentration could entail higher risk, as default fund
contributions/liquidity are provided by a reduced number of clearing members/liquidity
providers. The more concentrated available resources are, the higher is the probability
that stress in one institution will impact one or more CCPs, potentially having systemic
consequences. As an example, if there were only one clearing member/liquidity provider
allocating resources in a CCP, the concentration would be 100% and the HHI would
equal 10,000. If there were thousands of clearing members/liquidity providers in a CCP,
the allocated resources would have nearly 0% concentration and the HHI would be close
to zero.

42
138. Concentration thresholds refer to the European Commission Guidelines on the
assessment of horizontal mergers under the Council Regulation on the control of
concentrations between undertakings (Section III). 19 The following levels are identified:
0– 1000 no significant concentration
1000 – 2000 small concentration observed
> 2000 significant concentration
139. Within the CCP framework, we define the HHI at CCP level and EU-wide level for both
the credit and liquidity analysis. Details of the analyses and results for credit and liquidity
risks are reported below.
4.2.1.1 Concentration of Credit Exposures
140. HHI is defined as the sum of squares of the share of default fund contributions by
default fund within a CCP. The share is calculated as the sum of default fund
contributions allocated by each clearing member for a particular default fund over the
total held by a CCP for the same default fund.
141. The CCP level concentration is calculated following two methods:
- As the weighted sum of the HHI calculated at default fund level per CCP (HHI Weighted
Average across DFs). Weights are calculated from the default fund size ratio over the
total for the CCP;
- Taking the maximum value of the default fund-level HHI, as this was calculated per
default fund. This will correspond to the default fund-level HHI for those CCPs reporting
only one default fund. In those cases in which a CCP has several default funds the
highest HHI value across the different types is considered.
142. For this analysis, the default fund contributions are used as a proxy for the credit
counterparty risk assumed by the CCP towards its clearing members, as according to
EMIR, 20 the contributions shall be proportional to the exposures of each clearing
member. Across the 16 CCP considered in the analysis there are only few for which
(according to the HHI methodology and the thresholds used) the default fund
contributions can be considered to be highly concentrated on a limited number of
clearing members (Table 1).
143. When the weighted average is considered, there are only two CCPs showing high
levels of concentration (red), one more than last year, with five being moderately
concentrated, same number as last year, of which three with a level very close to the
lower bound of the threshold as given in the European Commission Guidelines defined
above. The rest of the CCPs results show no concentration (green). When the maximum
value is considered, the level of concentration increases: six CCP show high
19 Council Regulation (EC) No 139/2004 of 20 January 2004 on the control of concentrations between undertakings. Art 19 and art.20 of the EC Guidelines refer both to levels and changes in the HHI following a merger. In this analysis, we consider only levels as changes would not be applicable in the specific case. 20 EMIR Article 42
43
concentration (3 more than last year), yet again in three cases values are close to the
lower bound (2,000). Between the two CCPs showing high concentration, in the
weighted average case, according to the data received, the CCP with the highest
concentration (7,661) reports contributions from only three clearing members with the
share of the top member being approximately 85%. Therefore, one single member gives
a contribution for almost the total of the market. This is different from the results of the
2015 EU-wide stress test as the top member accounted for a share that was close to
50%. In the case of the other CCP showing levels beyond the threshold, fourteen
clearing members are reported, with two of them having together more than 60% of the
share in terms of default fund contributions.
144. Compared to last year exercise, data are more granular. This is related to the validation
process and also to the type of data the CCP themselves submitted. Also, data
composition is slightly different. Moreover to be noted is the difference in the positions
held by the clearing members on the specific date when data where reported by the
CCP, that has an impact on the computation of the index and therefore on the values
compared to last year results. In terms of the difference between the HHI based on the
weighted average of CCP default funds and the HHI based on the maximum value of
the default fund-level HHI, this is linked to the fact that there are smaller default funds
that are structurally more concentrated given the nature of the cleared market and
clearing activity. It is worth noting, that resources cannot be moved across Default
Funds.
145. Finally, overall concentration levels of credit exposures to clearing members at an EU-
wide level are analysed with the EU-Wide HHI at single clearing member level and the
EU-Wide HHI based on groups, (Table 2). The HHI by clearing member/group is defined
as the sum of the squares of the default fund share by clearing member/group across
the 16 CCPs considered in the analysis. Results show that, at the EU-level,
concentration levels are low.
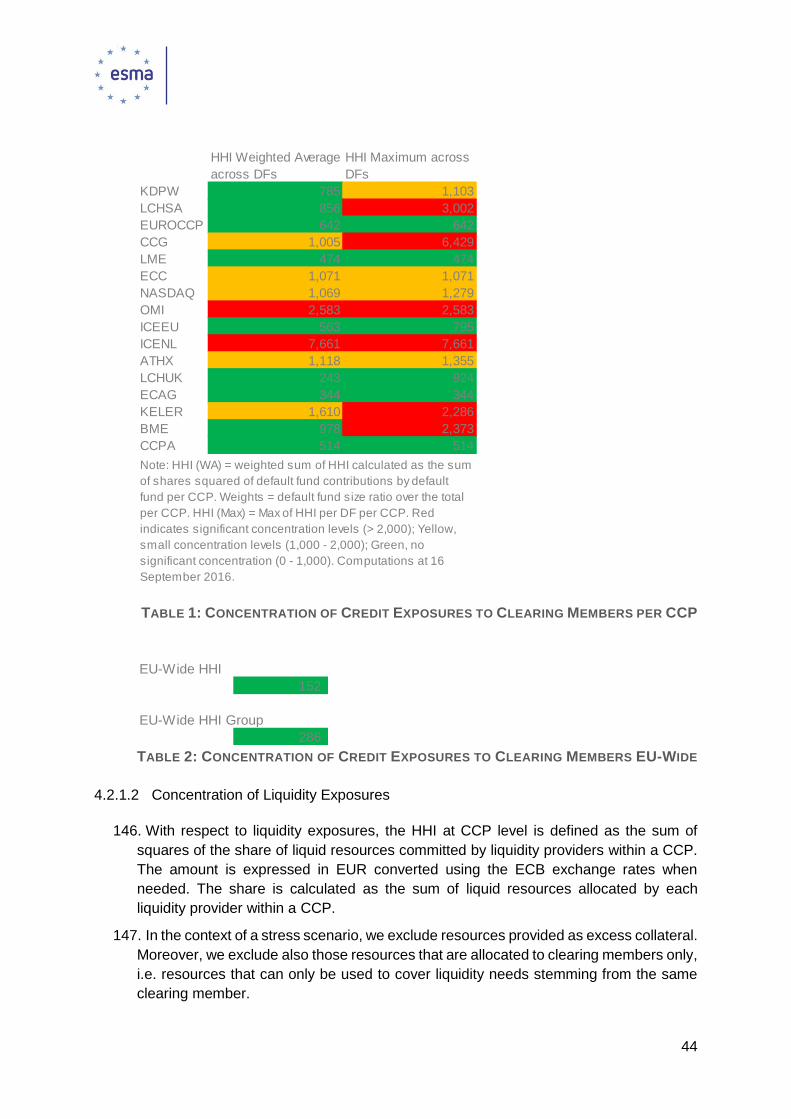
44
TABLE 1: CONCENTRATION OF CREDIT EXPOSURES TO CLEARING MEMBERS PER CCP
TABLE 2: CONCENTRATION OF CREDIT EXPOSURES TO CLEARING MEMBERS EU-WIDE
4.2.1.2 Concentration of Liquidity Exposures
146. With respect to liquidity exposures, the HHI at CCP level is defined as the sum of
squares of the share of liquid resources committed by liquidity providers within a CCP.
The amount is expressed in EUR converted using the ECB exchange rates when
needed. The share is calculated as the sum of liquid resources allocated by each
liquidity provider within a CCP.
147. In the context of a stress scenario, we exclude resources provided as excess collateral.
Moreover, we exclude also those resources that are allocated to clearing members only,
i.e. resources that can only be used to cover liquidity needs stemming from the same
clearing member.
HHI Weighted Average
across DFs
HHI Maximum across
DFs
KDPW 785 1,103
LCHSA 856 3,002
EUROCCP 642 642
CCG 1,005 6,429
LME 474 474
ECC 1,071 1,071
NASDAQ 1,069 1,279
OMI 2,583 2,583
ICEEU 563 795
ICENL 7,661 7,661
ATHX 1,118 1,355
LCHUK 243 924
ECAG 344 344
KELER 1,610 2,286
BME 978 2,373
CCPA 514 514
Note: HHI (WA) = weighted sum of HHI calculated as the sum
of shares squared of default fund contributions by default
fund per CCP. Weights = default fund size ratio over the total
per CCP. HHI (Max) = Max of HHI per DF per CCP. Red
indicates significant concentration levels (> 2,000); Yellow,
small concentration levels (1,000 - 2,000); Green, no
significant concentration (0 - 1,000). Computations at 16
September 2016.
152
286
EU-Wide HHI
EU-Wide HHI Group
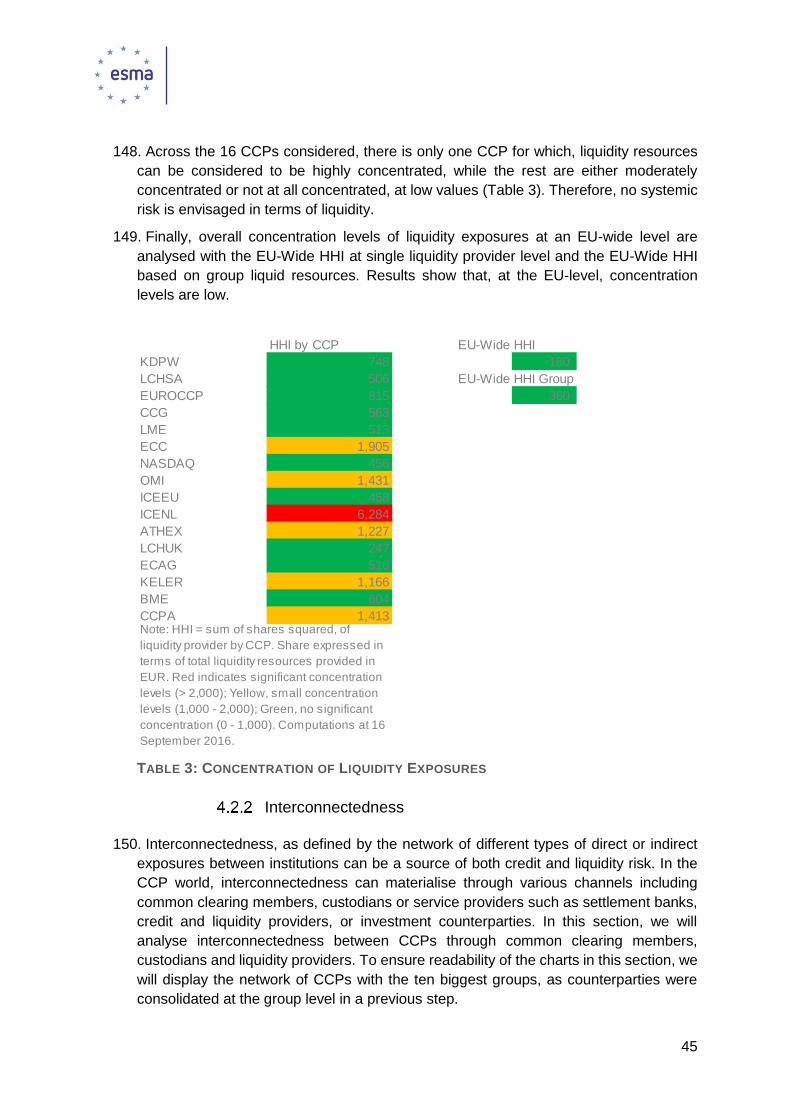
45
148. Across the 16 CCPs considered, there is only one CCP for which, liquidity resources
can be considered to be highly concentrated, while the rest are either moderately
concentrated or not at all concentrated, at low values (Table 3). Therefore, no systemic
risk is envisaged in terms of liquidity.
149. Finally, overall concentration levels of liquidity exposures at an EU-wide level are
analysed with the EU-Wide HHI at single liquidity provider level and the EU-Wide HHI
based on group liquid resources. Results show that, at the EU-level, concentration
levels are low.
TABLE 3: CONCENTRATION OF LIQUIDITY EXPOSURES
Interconnectedness
150. Interconnectedness, as defined by the network of different types of direct or indirect
exposures between institutions can be a source of both credit and liquidity risk. In the
CCP world, interconnectedness can materialise through various channels including
common clearing members, custodians or service providers such as settlement banks,
credit and liquidity providers, or investment counterparties. In this section, we will
analyse interconnectedness between CCPs through common clearing members,
custodians and liquidity providers. To ensure readability of the charts in this section, we
will display the network of CCPs with the ten biggest groups, as counterparties were
consolidated at the group level in a previous step.
HHI by CCP
KDPW 748 180
LCHSA 506
EUROCCP 815 360
CCG 563
LME 513
ECC 1,905
NASDAQ 456
OMI 1,431
ICEEU 458
ICENL 6,284
ATHEX 1,227
LCHUK 247
ECAG 510
KELER 1,166
BME 604
CCPA 1,413
EU-Wide HHI
Note: HHI = sum of shares squared, of
liquidity provider by CCP. Share expressed in
terms of total liquidity resources provided in
EUR. Red indicates significant concentration
levels (> 2,000); Yellow, small concentration
levels (1,000 - 2,000); Green, no significant
concentration (0 - 1,000). Computations at 16
September 2016.
EU-Wide HHI Group

46
4.2.2.1 Interconnectedness of CCPs through clearing member groups
151. For clearing membership, we first looked at interconnectedness in terms of collateral
posted. More precisely, the size of the red bubbles21 representing CCPs is proportional
to the total default fund (DF) and the total margins posted at each CCP, while the size
of the blue bubbles representing the clearing member’s groups is proportional to the
sum of all DF contributions and margins posted by the given clearing member’s group.
The width of the edge is then proportional to each clearing member’s DF and margins
posted to each individual CCPs. Only the top-10 groups of clearing members are
considered, therefore the size of the CCPs does not correspond to the total default fund
contributions and margins collected by each CCP, but the amounts collected from the
EU-wide top-10 clearing member groups. Figure 22 shows that most European CCPs
are very interconnected via common clearing membership of the ten biggest clearing
member’s groups.
FIGURE 22: NETWORK OF TOP-10 CLEARING MEMBER GROUPS BY DF CONTRIBUTIONS AND
MARGINS
152. When looking at exposures in times of market stress using the Stress Loss over own
Resources (clearing members’ own Default Fund contributions and required margins),
CCPs are less interconnected. This indicates, that although the top groups have
exposures to multiple CCPs (high interconnectedness when considering DF
contributions and margins), these exposures would generally not arise simultaneously
under one of the common, internally consistent scenarios considered in this exercise.
153. However, the degree of interconnectedness changes also depending on the scenario,
showing small but a relatively higher dependency in the most severe scenario (scenario
1, shown in Figure 23) and basically no interconnectedness in the two others.
21 A minimum size applies for the bubbles in all network charts for illustration purposes.
CCPs Clearing Member Groups Largest Bubble 70bn EUR

47
FIGURE 23: NETWORK OF TOP-10 CLEARING MEMBER GROUPS BY TOTAL LOSS OVER
REQUIRED RESOURCES – STRESS SCENARIO 1
FIGURE 24: NETWORK OF TOP-10 CLEARING MEMBER GROUPS BY TOTAL LOSS OVER
REQUIRED RESOURCES – STRESS SCENARIO 2
CCPs Clearing Member Groups Largest Bubble 2bn EUR
CCPs Clearing Member Groups Largest Bubble 0.7bn EUR

48
FIGURE 25: NETWORK OF TOP-10 CLEARING MEMBER GROUPS BY TOTAL LOSS OVER
REQUIRED RESOURCES – STRESS SCENARIO 3
4.2.2.2 Interconnectedness of CCPs through custodians
154. In this part, we show the interlinkages between CCPs via their common custodians.
We looked, in a first step, at the exposure of CCPs to custodians in terms of cash
amounts under custody. Cash here consists of commercial bank cash, reverse repos
and deposits22. We then looked at total amounts under custody including cash and
securities, first for all currencies of denomination, and then looking at individual currency
separately (EUR, USD, GBP). Figures 26 and 27 show the network for all currencies,
with cash under custody (Figure 26) and then adding securities under custody (Figure
27). Here a few big CCPs, are linked via three institutions, including ICSDs but not only.
22 Cash kept at Central banks is excluded from the scope of this analysis
CCPs Clearing Member Groups Largest Bubble 0.7bn EUR

49
FIGURE 26: NETWORK OF TOP-10 CUSTODIANS – CASH ONLY – ALL CURRENCIES
155. Concerning cash custodians (Figure 26), it can be observed, that at EU-wide level and
considering all currencies, the majority of the cash kept by commercial entities, is kept
by two (2) groups, including one ICSD and one commercial bank that act as cash
custodians for four (4) CCPs. In all these cases, almost all cash is kept under
arrangements that ensure its collateralisation.
156. When cash and securities are considered, in Figure 27 we see again one (1) large
group having a large part of the overall cash/assets under custody, but then more
groups taking the remaining share, while in many cases the exposures are mainly driven
by the securities custodians. The pictures are further discussed concerning individual
currencies below.
CCPs Cash Custodian Groups Largest Bubble 40bn EUR

50
FIGURE 27: NETWORK OF TOP-10 CUSTODIANS – CASH AND SECURITIES – ALL CURRENCIES
157. Looking at individual currencies, the patterns of interconnectedness appear even
stronger. For collateral denominated in USD, the EU CCPs do not have access to a
central bank acting as a custodian and one can observe a high dependence on
commercial entities, including not only ICSDs but also one commercial bank. The charts
for cash only (Figure 28) and cash & securities (Figure 29) denominated in USD are
presented below, while the ones for EUR and GBP can be found in the Annex. Overall,
a high degree of CCPs’ dependence on one or a few commercial entities may give rise
to potential concerns, including increased credit risk towards specific counterparties or
risk of wide-spread disruptions in case of technical difficulties.
CCPs Cash & Securities Custodian Groups Largest Bubble 130bn EUR

51
FIGURE 28: NETWORK OF TOP-10 CUSTODIANS – CASH ONLY – USD
FIGURE 29: NETWORK OF TOP-10 CUSTODIANS – CASH AND SECURITIES – USD
4.2.2.3 Interconnectedness of CCPs through liquidity providers
158. Here we looked at liquidity providers in the form of committed credit lines, committed
repos and uncommitted repos, looking in a first step at committed liquidity lines only
CCPs USD Cash Custodian Groups Largest Bubble 22bn EUR
CCPs USD Cash & Securities Custodian Groups Largest Bubble 43bn EUR
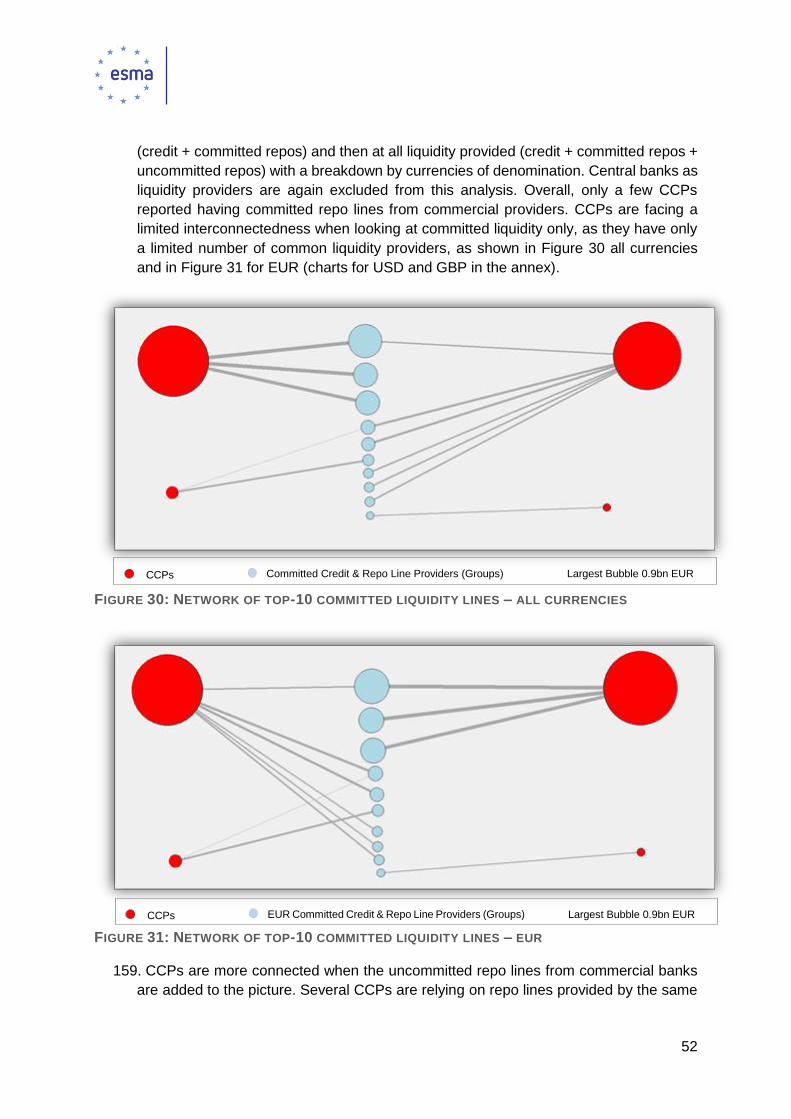
52
(credit + committed repos) and then at all liquidity provided (credit + committed repos +
uncommitted repos) with a breakdown by currencies of denomination. Central banks as
liquidity providers are again excluded from this analysis. Overall, only a few CCPs
reported having committed repo lines from commercial providers. CCPs are facing a
limited interconnectedness when looking at committed liquidity only, as they have only
a limited number of common liquidity providers, as shown in Figure 30 all currencies
and in Figure 31 for EUR (charts for USD and GBP in the annex).
FIGURE 30: NETWORK OF TOP-10 COMMITTED LIQUIDITY LINES – ALL CURRENCIES
FIGURE 31: NETWORK OF TOP-10 COMMITTED LIQUIDITY LINES – EUR
159. CCPs are more connected when the uncommitted repo lines from commercial banks
are added to the picture. Several CCPs are relying on repo lines provided by the same
CCPs EUR Committed Credit & Repo Line Providers (Groups) Largest Bubble 0.9bn EUR
CCPs Committed Credit & Repo Line Providers (Groups) Largest Bubble 0.9bn EUR
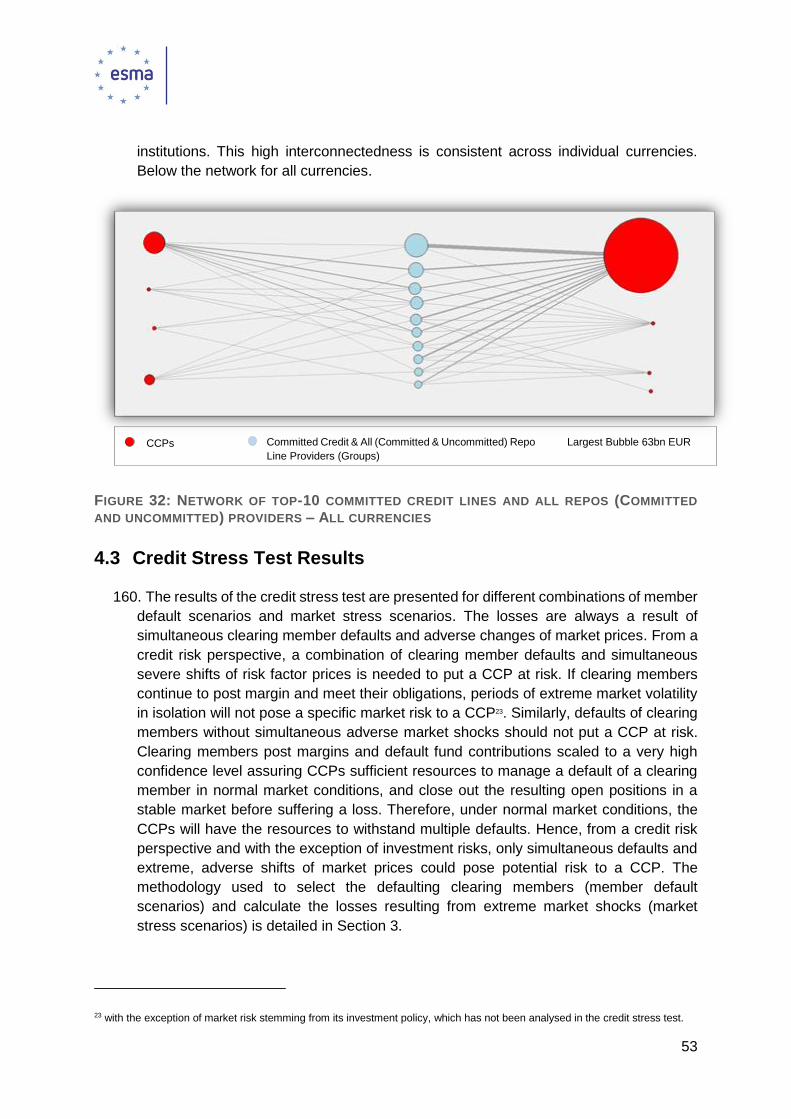
53
institutions. This high interconnectedness is consistent across individual currencies.
Below the network for all currencies.
FIGURE 32: NETWORK OF TOP-10 COMMITTED CREDIT LINES AND ALL REPOS (COMMITTED
AND UNCOMMITTED) PROVIDERS – ALL CURRENCIES
4.3 Credit Stress Test Results
160. The results of the credit stress test are presented for different combinations of member
default scenarios and market stress scenarios. The losses are always a result of
simultaneous clearing member defaults and adverse changes of market prices. From a
credit risk perspective, a combination of clearing member defaults and simultaneous
severe shifts of risk factor prices is needed to put a CCP at risk. If clearing members
continue to post margin and meet their obligations, periods of extreme market volatility
in isolation will not pose a specific market risk to a CCP23. Similarly, defaults of clearing
members without simultaneous adverse market shocks should not put a CCP at risk.
Clearing members post margins and default fund contributions scaled to a very high
confidence level assuring CCPs sufficient resources to manage a default of a clearing
member in normal market conditions, and close out the resulting open positions in a
stable market before suffering a loss. Therefore, under normal market conditions, the
CCPs will have the resources to withstand multiple defaults. Hence, from a credit risk
perspective and with the exception of investment risks, only simultaneous defaults and
extreme, adverse shifts of market prices could pose potential risk to a CCP. The
methodology used to select the defaulting clearing members (member default
scenarios) and calculate the losses resulting from extreme market shocks (market
stress scenarios) is detailed in Section 3.
23 with the exception of market risk stemming from its investment policy, which has not been analysed in the credit stress test.
CCPs Committed Credit & All (Committed & Uncommitted) Repo
Line Providers (Groups)
Largest Bubble 63bn EUR
54
Cover 2 groups per CCP results
161. The first member default scenario explored is the “Cover-2 groups per CCP”. In
particular, we select for each CCP individually two (2) corporate groups and assume all
the clearing members belonging to those 2 groups as defaulting in that particular CCP.
The selected clearing member groups and defaulting entities will be different for each
CCP and are not considered to be in default in other CCPs. Thus, this scenario includes
the rather unrealistic assumption that an entity would default in only one CCP, but is
used to allow the assessment of the resilience of individual CCPs under common market
stress scenarios. The groups selected for each CCP are the ones that lead to the highest
resource consumption beyond required margin collateral and above the total prefunded
mutualised resources, including the total default fund and the dedicated resources
(“skin-in-the-game”). Thus, the selection process will select the groups that could lead
to a depletion of the prefunded resources and if such pairs of groups are not to be found,
will select the two groups that would lead to the highest consumption.
162. This selection procedure is run for each market stress scenario individually, as the
clearing members leading to the largest losses will be different under different market
conditions. At each CCP, we select the top-2 groups considering all clearing members
belonging to the same group. Hence, we can have more than two clearing members
defaulting at each CCP. Moreover, for CCPs that have more than one default funds, the
clearing members belonging to those groups, may or may not be active in more than
one default funds. CCPs were asked to report separately stress losses over the required
margin collateral and stress losses over the total available (including excess) margin
collateral. The selection of top groups and defaulting entities is always performed using
only the required collateral and the same defaulting entities are considered when testing
with total (i.e. including excess) collateral.
163. For each market stress scenario (i.e. 1, 2 and 3) the credit stress test results are
presented in the form of a Panel, showing for each CCP the following (from bottom to
top):
Number of defaulting members
Number of clearing members defaulting at each CCP
Number of clearing members defaulting at each CCP having (non-zero) losses
under the stress scenario, before applying any margins
Amounts of default waterfall consumption (in mil. EUR)
Amount (in million EUR) of stress loss covered with the mutualised part of the
Default Fund (i.e. non-defaulting members’ contributions) and dedicated CCP
resources (“skin-in-the-game”)
Amount (in million EUR) of stress loss covered with other Default Fund -level
resources, where applicable.
Amount (in million EUR) of stress loss that would need to be covered with non-
prefunded resources (powers of assessment).

55
Amount (in million EUR) of stress loss covered with other CCP- level resources,
where applicable.
% Consumption of Resources
% Consumption of the Default Fund (including the defaulters’ contributions). For
CCPs that have more than one default funds, the maximum % consumption is
presented.
% Consumption of Powers of Assessments (called only from non-defaulting
members). For CCPs that have more than one default funds, the maximum %
consumption is presented
Two flags
A flag indicating whether there would be uncovered losses after using also non-
prefunded resources.
A flag (top of the panel) indicating whether non-prefunded resources would
have to be used.
164. The stress test results for the first market stress scenario, without considering excess
margin are presented in the following figure. For example, for the first CCP, four (4)
clearing members defaulted, all with non-zero losses, while after using the defaulting
clearing members’ margin and default fund contributions, an additional amount equal to
1.26bn EUR was consumed from the non-defaulting clearing members’ prefunded
resources (default fund contributions) and the CCPs dedicated resources (“skin-in-the-
game”). These lead to a 42% consumption of the default fund (including the defaulters’
contributions), while there was no need to call for additional non-prefunded resources
(0% consumption of Assessment Powers).
Cover-2 Groups per CCP (no cross defaulting) Market Scenario 1 – No Excess Margin

56
FIGURE 33: COVER-2 GROUPS PER CCP - MARKET SCENARIO 1 – NO EXCESS MARGIN
165. Overall, no shortfall of resources with systemic impact is to be identified, but the
results across CCPs are mixed. Not all CCPs have experienced the same level of stress
based on this common market scenario. The combination of the default of the top-2
groups per CCP with the shocks defined under Market Stress Scenario 1, would result
for one CCP (BME Clearing) to a need to call for additional non-prefunded resources,
since the mutualised prefunded resources (default fund and “skin-in-the-game”) for one
of the default funds would be depleted. It should be underlined that this is only the case
for a very small amount (less than 1 million EUR) and for one of the smaller default
funds. Therefore, the shortfall is only marginal with no systemic impact. Moreover, it
would also not have any practical impact on this particular CCP, as it had access to
surplus collateral of the defaulting members in other default funds and excess margin
that could in this case, be used to cover this very small shortfall.
166. For some CCPs, the losses can be covered using only the defaulters’ collateral (margin
and default fund contributions), with no need to resort to mutualised resources. At the
same time, other CCPs would need to use a significant part of the default funds
contributions. In particular, for one CCP (ICE Clear Europe), although the prefunded
resources would be enough, the default of the top-2 groups would lead to a 97%

57
consumption of the largest of its default funds. Therefore, approximately 1.1bn EUR of
mutualised prefunded resources would need to be used and would only marginally be
enough to cover the losses. This is the result of the default of five (5) clearing members,
belonging to the top-2 groups, with only three (3) out of those recording actually losses
from the stress scenario, thus affecting the CCP. The excess margin held in this case,
could also be used to significantly reduce the consumption of prefunded resources.
167. If one considers the total available margin collateral (i.e. including excess margin), the
stress test results for the same defaulting entities and market stress scenario, change
significantly. These are presented in the following figure (Figure 34).
Cover-2 Groups per CCP (no cross defaulting) Market Scenario 1 – With Excess Margin
FIGURE 34: COVER-2 GROUPS PER CCP - MARKET SCENARIO 1 – WITH EXCESS MARGIN
168. After considering also the excess collateral, the default fund amounts were in all cases
enough to cover the residual losses. It should however be highlighted once more, that
any member experiencing financial difficulties would most probably post only the
minimum required collateral. Therefore, the results using only the required margin
represent a more realistic scenario and the results considering the excess margin are
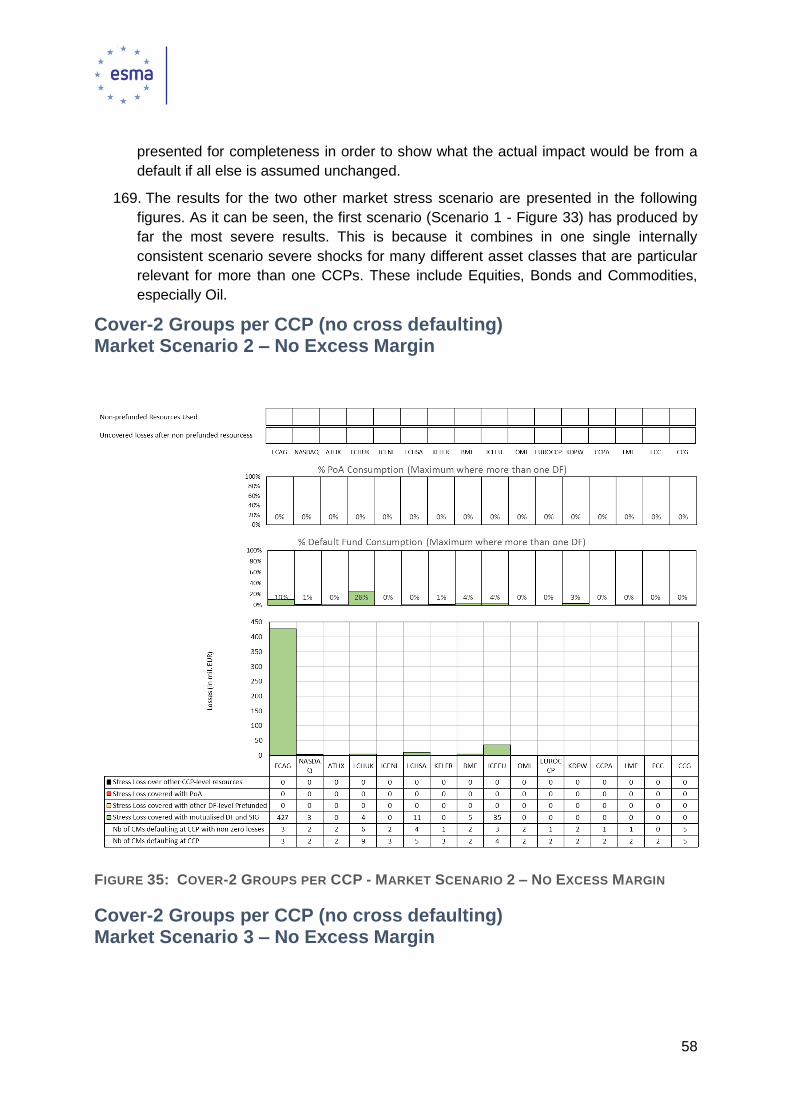
58
presented for completeness in order to show what the actual impact would be from a
default if all else is assumed unchanged.
169. The results for the two other market stress scenario are presented in the following
figures. As it can be seen, the first scenario (Scenario 1 - Figure 33) has produced by
far the most severe results. This is because it combines in one single internally
consistent scenario severe shocks for many different asset classes that are particular
relevant for more than one CCPs. These include Equities, Bonds and Commodities,
especially Oil.
Cover-2 Groups per CCP (no cross defaulting) Market Scenario 2 – No Excess Margin
FIGURE 35: COVER-2 GROUPS PER CCP - MARKET SCENARIO 2 – NO EXCESS MARGIN
Cover-2 Groups per CCP (no cross defaulting) Market Scenario 3 – No Excess Margin

59
FIGURE 36: COVER-2 GROUPS PER CCP - MARKET SCENARIO 3 – NO EXCESS MARGIN
170. The CCPs, both individually and as a system, experienced no significant stress from
Scenarios 2 (Figure 35) and 3 (Figure 36). In many cases, the CCPs would not even
have to use the default funds in order to manage the calculated losses and the losses
could have been covered with the margin collateral. This can partly be accounted to the
fact that these scenarios were calibrated to ensure severe shocks to specific asset
classes that may not be relevant for some CCPs. Also in other cases, the products
experiencing the most severe shocks may be cleared within a single default waterfall
(default fund), with asset classes that were not shocked sufficiently within one of these
two internally consistent scenarios. To conclude, even CCPs that do clear products for
these asset classes showed resilience to the provided shocks.
MD-A, Cover the Top-2 clearing members per CCP
171. The MD-A member default scenarios involve the default of the top-2 clearing members
(individual entities and not groups) per CCP. Each defaulting entity is considered to be
in default in all CCPs. Therefore, the number of defaulting entities at each CCP is always
greater or equal to two, as this is the initial condition. In practice, the number of
defaulting entities is much higher, because of the cross-default condition.

60
172. The top-2 clearing members selected at each CCP are the ones having the highest
losses over margin collateral and own default fund contributions. In other words, we
select at each CCP the two entities that would lead to the largest amount to be covered
by mutualised resources. For CCPs that have more than one default fund we first
calculate the losses over own resources at each default fund and then add across all
default funds in order to select the most relevant members. Again, the entities are
selected per market stress scenario and using the required margin (excluding excess).
173. A limitation of this selection condition is that it will not always identify pairs of members
that could cause a breach of mutualised resources, as it considers only the losses
exceeding the defaulters’ margin and default fund contributions and not the amount of
mutualised resources that is available to cover those24. The primary focus of the MD-A
scenarios is to explore the systemic implications from extending the regulatory cover-2
condition to all CCPs, through the cross default condition. The “cover-2 groups per CCP”
member default scenario has been added to identify pairs of groups that could breach
the prefunded resources and assess the resilience of individual CCPs. For that reason,
under the MD-A scenarios we try to select entities that have significant exposures
across multiple default funds within one CCP.
174. The results of the MD-A member default scenarios for the first market stress scenario
(Scenario 1) with and without considering excess collateral are presented below (Figure
37 and Figure 38). The results for the remaining two market scenarios (Scenario 2 and
3) are again by far less severe, raised no concerns and are only presented in the Annex
for completeness.
24 For example, it will not select two clearing members creating a small breach at a small default fund, but focus on two larger clearing members, potentially from different default funds, that would in aggregate create larger losses over own resources.
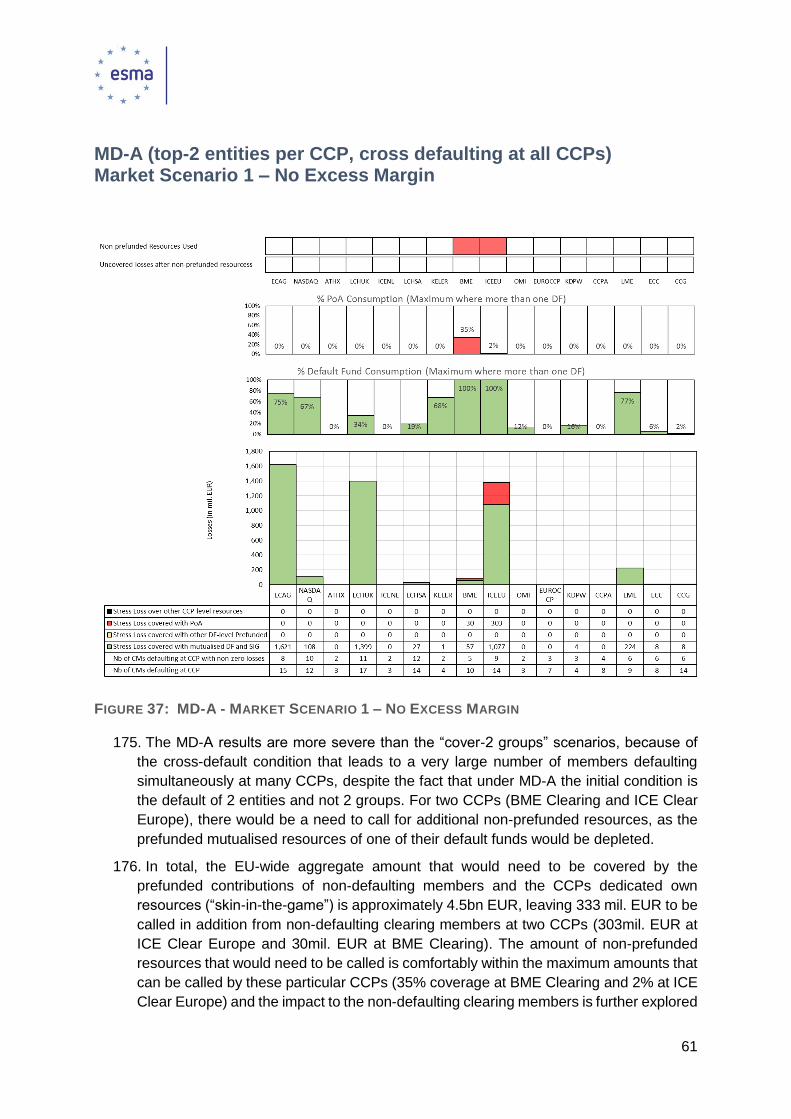
61
MD-A (top-2 entities per CCP, cross defaulting at all CCPs) Market Scenario 1 – No Excess Margin
FIGURE 37: MD-A - MARKET SCENARIO 1 – NO EXCESS MARGIN
175. The MD-A results are more severe than the “cover-2 groups” scenarios, because of
the cross-default condition that leads to a very large number of members defaulting
simultaneously at many CCPs, despite the fact that under MD-A the initial condition is
the default of 2 entities and not 2 groups. For two CCPs (BME Clearing and ICE Clear
Europe), there would be a need to call for additional non-prefunded resources, as the
prefunded mutualised resources of one of their default funds would be depleted.
176. In total, the EU-wide aggregate amount that would need to be covered by the
prefunded contributions of non-defaulting members and the CCPs dedicated own
resources (“skin-in-the-game”) is approximately 4.5bn EUR, leaving 333 mil. EUR to be
called in addition from non-defaulting clearing members at two CCPs (303mil. EUR at
ICE Clear Europe and 30mil. EUR at BME Clearing). The amount of non-prefunded
resources that would need to be called is comfortably within the maximum amounts that
can be called by these particular CCPs (35% coverage at BME Clearing and 2% at ICE
Clear Europe) and the impact to the non-defaulting clearing members is further explored

62
in the knock-on analysis presented in the present report. No systemic implications from
second round effects via the risk-sharing mechanism of CCPs to non-defaulting
members is identified.
177. Moreover, subject to the reservations already discussed, if one considers also the
excess collateral, the results presented in Figure 38 show a significant improvement. In
particular, only one CCP (BME Clearing) would still need to call for approximately 30
million EUR of additional non-prefunded resources.
178. Overall, the maximum number of members defaulting at a single CCP is between three
(3) and seventeen (17) entities, depending on the degree of interconnectedness of
individual CCPs. However, it should be noted that, the members that are cross-defaulted
from other CCPs do not always expose a CCP to risk or contribute significantly to the
losses it may face. It can be that the cross-defaulted members do not have any clearing
activity at this CCP or even when they are active, they would not cause any losses under
the common scenario. Therefore, the number of members defaulting with non-zero
losses is a more appropriate indicator of the severity of the member default scenarios
at individual CCPs. Still, the number of entities with losses is in most cases, especially
for CCPs that experience significant impact, very high. Although not possible to
calculate, the combined probability of such a number of entities defaulting
simultaneously is expected to be very low, implying that this scenario goes beyond what
can be reasonably considered as plausible.
MD-A (top-2 entities per CCP, cross defaulting at all CCPs) Market Scenario 1 – With Excess Margin

63
FIGURE 38: MD-A - MARKET SCENARIO 1 – WITH EXCESS MARGIN
MD-B, Cover the Top-2 groups EU-wide
179. The simultaneous default of two (2) groups of clearing members that would cause at
an aggregate EU-wide level the largest losses above the defaulting members’ collateral
is also considered in combination with all the market stress scenarios. In order to select
the most relevant groups of clearing members on an EU-wide level, we consider for
each clearing member of each group, the aggregate loss over own resources (i.e.
required margin collateral and default fund contribution). The two groups selected are
the ones that have the highest loss over own resources across all CCPs considering all
clearing members belonging to each group. This selection algorithm focuses on the two
(2) groups of clearing members showing the highest losses over own resources at EU-
wide level. It does not focus on the resilience of individual CCPs, which is assessed
using the cover-2 groups per CCP member default scenario.
180. We explored the use of different selection algorithms, including for example selecting
the top-2 groups that would cause the largest aggregate breaches of prefunded
resources across all CCPs. It was concluded that this would just be a restricted (more
lenient) variant of the” top-2 groups per CCP” member default scenario. In particular,
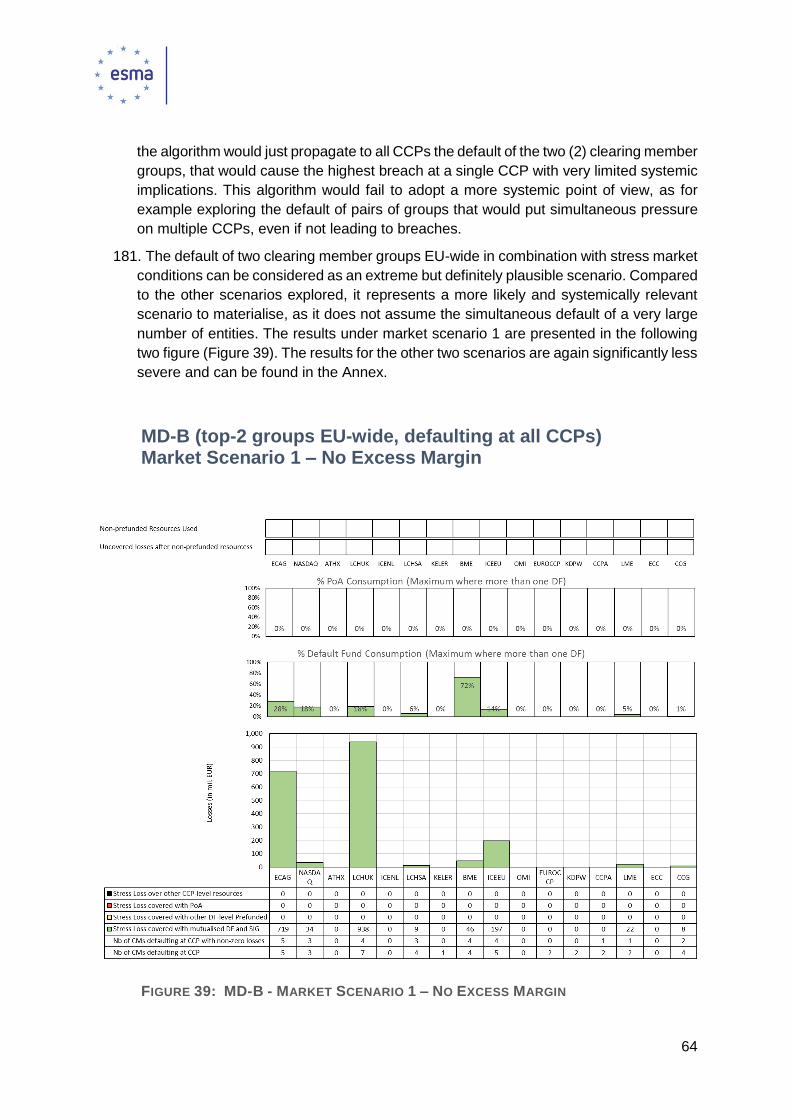
64
the algorithm would just propagate to all CCPs the default of the two (2) clearing member
groups, that would cause the highest breach at a single CCP with very limited systemic
implications. This algorithm would fail to adopt a more systemic point of view, as for
example exploring the default of pairs of groups that would put simultaneous pressure
on multiple CCPs, even if not leading to breaches.
181. The default of two clearing member groups EU-wide in combination with stress market
conditions can be considered as an extreme but definitely plausible scenario. Compared
to the other scenarios explored, it represents a more likely and systemically relevant
scenario to materialise, as it does not assume the simultaneous default of a very large
number of entities. The results under market scenario 1 are presented in the following
two figure (Figure 39). The results for the other two scenarios are again significantly less
severe and can be found in the Annex.
MD-B (top-2 groups EU-wide, defaulting at all CCPs) Market Scenario 1 – No Excess Margin
FIGURE 39: MD-B - MARKET SCENARIO 1 – NO EXCESS MARGIN

65
182. All CCPs could cover the calculated losses with the already provided prefunded
resources. It can be seen that we have CCPs where no clearing members are
defaulting. This is because the entities belonging to the selected top groups are not
members at those particular CCPs. In three (3) other CCPs, there are defaulting clearing
members, but these would not have any losses under the considered scenarios.
183. Overall, the EU-wide aggregate losses exceeding the defaulting clearing members’
resources, that would need to be covered by the mutualised resources at all CCPs, are
approximately 2bn EUR. These would be absorbed without problems, by the available
prefunded resources, as the maximum percentage consumption of a single default fund
would be 72% and that only for a relatively small amount. The results indicate that, under
the assumptions and limitations of the exercise, there would be no systemic impact from
such an event, even if combined with the considered market stress scenarios.
4.4 Clearing Member Knock-on Analysis
184. The clearing member knock-on analysis is an assessment of the impact of CCPs using
the mutualised resources (default fund contributions and power of assessments). The
aim of this analysis is to assess whether there are potential systemic risk implications
from non-defaulting clearing members losing part of their resources because of the loss
sharing mechanism of CCPs.
185. ESMA calculated for all clearing members the amount of prefunded and non-prefunded
resources that would be lost under different combinations of member default scenarios
and market stress scenarios. We then identified the non-defaulting members for which
the aggregate loss would exceed a certain absolute amount (20 mil. EUR) and a certain
percentage of the clearing member’s capital, set at 10%. Taking also into account the
limitations described below, these conditions were calibrated in order to focus only on
cases with potentially material and systemic implications. As this is an analysis of the
impact to individual non-defaulting clearing members across all CCPs, it will be
presented using only the two member default scenarios (MD-A and MD-B), where the
cross defaulting condition of individual entities is activated. The analysis is again based
on the required collateral (excluding excess). The exercise is not performed at the group
level, as (a) group capital figures are not available, (b) we would need to incorporate the
structure and absorb capital at different entity levels, and (c) we would need to assume
that mother companies would always be ready to absorb losses.
186. CCPs were asked via the data request to report the capital figures for their clearing
members. Where a CCP was not in a position to report CET1, it was requested to report
Tier 1 and if Tier 1 is not available either, the Total Regulatory Capital. The quality of
data received was not satisfactory. In several cases, we had inconsistent numbers
reported by different CCPs for the same entity, capital type and reference date.
Therefore, since for the analysis we needed one amount per entity, where CET1 was
not reported or was not reliable (e.g. large deviations between amounts reported by

66
different CCPs), we used the Tier1 and if that was also not available / reliable, we used
the Total Regulatory capital.
187. We identified three (3) non-defaulting clearing members meeting the above mentioned
conditions in at least one combination of scenarios. For all combinations of market
stress scenarios (Scenario 1, 2 & 3) and member default scenarios (MD-A and MD-B),
we present a chart (Figure 40), showing for each one of these members:
The aggregate amount of prefunded resources (default fund contributions) lost by
the clearing member at all CCPs in million EUR and the same amount expressed in
% of its reported capital.
The aggregate amount of prefunded and non-prefunded resources (powers of
assessment called) lost by the clearing member at all CCPs in million EUR and the
same amount expressed in % of its capital.
FIGURE 40: LOSSES OF NON-DEFAULTING CLEARING MEMBERS AS % OF CAPITAL
188. Overall, no evidence of systemic implications from second round effects to non-
defaulting members via the risk-sharing mechanism of CCPs under the considered
stress scenarios was identified. This analysis considers only the non-defaulting
members that meet both aforementioned conditions, i.e. loss over capital > 10% and
loss > 20mil. EUR. Therefore, it has not been assessed if there are clearing members
with smaller losses that can however account for a large part of their capital. In that
context, the largest loss as % of capital at one member was 18%, with the largest
absolute amount of losses, including prefunded and non-prefunded resources, at
another member being approximately 80 mil. EUR.
189. It should be highlighted, that the second round effects due to bilateral relationships
between clearing members is generally expected to be far more important, than any
adverse effects via the loss-sharing mechanism of CCPs explored here. The bilateral
relationships are however beyond the scope of this exercise. The purpose of this
analysis was to explore if the risk sharing mechanism can create significant additional

67
pressure to non-defaulting clearing members and the results of this analysis should be
assessed considering that limitation.
4.5 Reverse Credit Stress Test Results
190. For the reverse stress tests, we perform a
two-dimensional analysis of the absorption
capacity of the system of CCPs by stepwise
increasing the number of defaulting entities and
the severity of the market shocks in order to
identify at which point resources are exhausted.
While exploring the different combinations, we
go intentionally beyond what is considered as
plausible for the purpose of this exercise. We try
to capture the sensitivity of the results to the considered stress scenarios and
understand how the results are affected by changing the underlying assumptions.
191. After all, although the baseline stress scenarios are carefully modelled to simulate
extreme market conditions, they are still subject to uncertainties and limitations, as is
the case with all modelling procedures. For example, a steep increase of the uncovered
losses following a relatively small change in the shocks could indicate a high sensitivity
and raise concerns on the robustness, considering the limitations and uncertainties.
192. The focus of this analysis is to identify combinations of market stress scenarios and
member default scenarios with systemic risk implications. Results of individual CCPs
were only analysed where needed to explore the source of events that may have
systemic relevance. The reverse stress analysis is limited to the credit stress component
and will not cover the liquidity risk, as it can be very complex and demanding in terms
of data. The extension of the scope to liquidity risk can be considered for future
exercises.
193. The first EU-wide stress test exercise included a reverse stress test analysis by further
increasing the number of defaulting entities under the member default scenarios. A
similar approach on the increase of the number of clearing member defaults is
maintained. For the reverse credit stress test scenarios, we are considering the default
of the EU-wide top-n clearing member groups, where n ranges from one (1) to five (5)
groups. All entities belonging to these groups are considered to be in default across all
CCPs25. We have explored the use of the following selection conditions:
- select the EU-wide top-n groups leading to the highest total consumption of prefunded
resources;
25 We have not considered the “cover-2 group per CCP” default scenarios, as omitting the cross defaulting condition does not serve the purpose of the reverse analysis. The objective is not to assess the resilience of individual CCPs, but rather look for combinations of scenarios with significant systemic implications. Moreover, the MD-A scenarios (top entities selected per CCP and then cross-defaulted across all CCPs) are not used as these lead to a very large, rather unrealistic, number of defaulting members even when only considering the default of 2 members / CCP.
FIGURE 41: REVERSE CREDIT
STRESS TEST

68
- select the EU-wide top-n groups leading to the highest loss over own resources
(margin and default fund contributions of defaulting members);
194. However, since the starting point of the reverse analysis is the breaking point, i.e. the
point where CCPs’ resources are exhausted, the first is more adequate and is discussed
in the report. The reverse stress test results following the second condition, being an
extension of the core MD-B scenarios, are presented in the Annex for completeness.
195. In addition, the analysis is complemented by also increasing the market stress shocks.
The CCPs were asked to calculate and report the losses also after scaling up the shocks
in the provided market scenarios for a number of steps (i.e. x1.2, x1.5, x2)26.
196. The reverse stress test results are presented in the form of the following two tables,
each having 2 dimensions, horizontal: 4 market scenario steps (baseline, x1.2, x1.5, x2)
and vertical: 5 member default scenario steps (1…5 groups defaulting)27.
- Table showing the aggregate amount of losses (billion EUR) over prefunded resources
for all CCPs (Figure 42).
- Table showing the aggregate amount of losses (billion EUR) over non-prefunded
resources for all CCPs28 (Figure 43).
FIGURE 42: TOTAL LOSSES (BILLION EUR) OVER PREFUNDED RESOURCES, NO EXCESS
MARGIN
26 The CCPs recalculated the losses using the scaled-up shocks and did not scale up directly the P&L as this would not be correct, especially for products with non-linear pay-offs (e.g. options) 27 When it comes to the member default scenarios, we increase the initial number of groups defaulting and not the final number of clearing members considered to be in default. For example this means that the 4th step will consider the default of the top 4 groups EU-wide and all members belonging to these groups at all CCPs. 28 The other CCP-level resources have not been considered in the reverse stress test in order to simplify the calculation, but the impact from this assumption is assessed as immaterial in the context of the reverse stress test.
1 x1.2 x1.5 x2
1 - - 0.6 2.1
2 0.0 0.7 2.0 4.4
3 0.4 1.3 3.0 7.1
4 0.7 1.9 4.3 10.6
5 0.8 2.2 5.6 14.3
1 - - - 0.0
2 - - 0.0 0.0
3 - - 0.0 0.1
4 - - - 0.1
5 - - - 0.1
1 - - 0.0 0.1
2 - - 0.0 0.9
3 - - 0.1 1.6
4 - - 0.4 2.1
5 - - 0.5 3.6
Scenario 1
Scenario 2
Scenario 3
Nu
mb
er o
f M
emb
er G
rou
ps
def
ault
ing
at E
U-
wid
e le
vel.
All
Gro
up
en
titi
es d
efau
lt in
all
CC
Ps.

69
197. It can be seen that under the first market stress scenario (Scenario 1), there is already
a very small shortfall of prefunded resources after the default of 2 groups EU-wide under
the baseline stress shocks (first column, second row, = 0.0bn EUR). It is the same
shortfall of prefunded resources (< 1mil. EUR) identified for one CCP (BME Clearing)
under the “cover-2 groups per CCP” member default scenario propagating the same
defaulting members across CCPs.
198. However, when the baseline shocks are increased by 20% (x1.2), the shortfall of
prefunded resources following the default of 2 groups increases steeply to 0.7bn EUR
and becomes significant (second column, second row, = 0.7bn EUR). This shortfall is
due to another CCP (ICE Clear Europe). That is a different CCP than the one identified
in the previous paragraph. The shortfall would increase further to approximately 2.0bn
EUR (third column, second row), if one would use shocks equal to 150% of the baseline
stress shocks, leaving the number of defaulting groups unchanged. Again, the majority
of these shortfalls of prefunded resources originate from the same CCP, while also the
prefunded resources of a second one would be depleted leading to smaller, but still
material, shortfalls.
199. If we explore the other dimension, i.e. the number of groups defaulting, shocks equal
to 150% of the baseline stress shocks are needed to breach the prefunded resources
following the default of only one (1) group EU-wide. The shortfall of prefunded resources
would be equal to 0.6bn EUR (third column, first row) and stems from two CCPs, similar
to what was observed in the previous paragraph, i.e. the majority from the one CCP, but
also a significant amount from the second one.
200. If one uses the baseline stress shocks, but increases the number of defaulting groups
to three (3) (first column, third row) the shortfall would be approximately 0.4bn EUR,
originating exclusively from the same CCP (ICE Clear Europe), that has shown the
highest sensitivity in the reverse analysis.
201. If one considers also the non-prefunded resources (Figure 43) that could have been
called from the non-defaulting members, these would be enough under the scenarios
discussed above to cover the calculated losses.
202. The results for the two additional market stress scenarios (Scenario 2 and Scenario3),
are by far more robust and clearly indicate that a small change in the underlying stress
assumption would not lead to a depletion of prefunded resources.
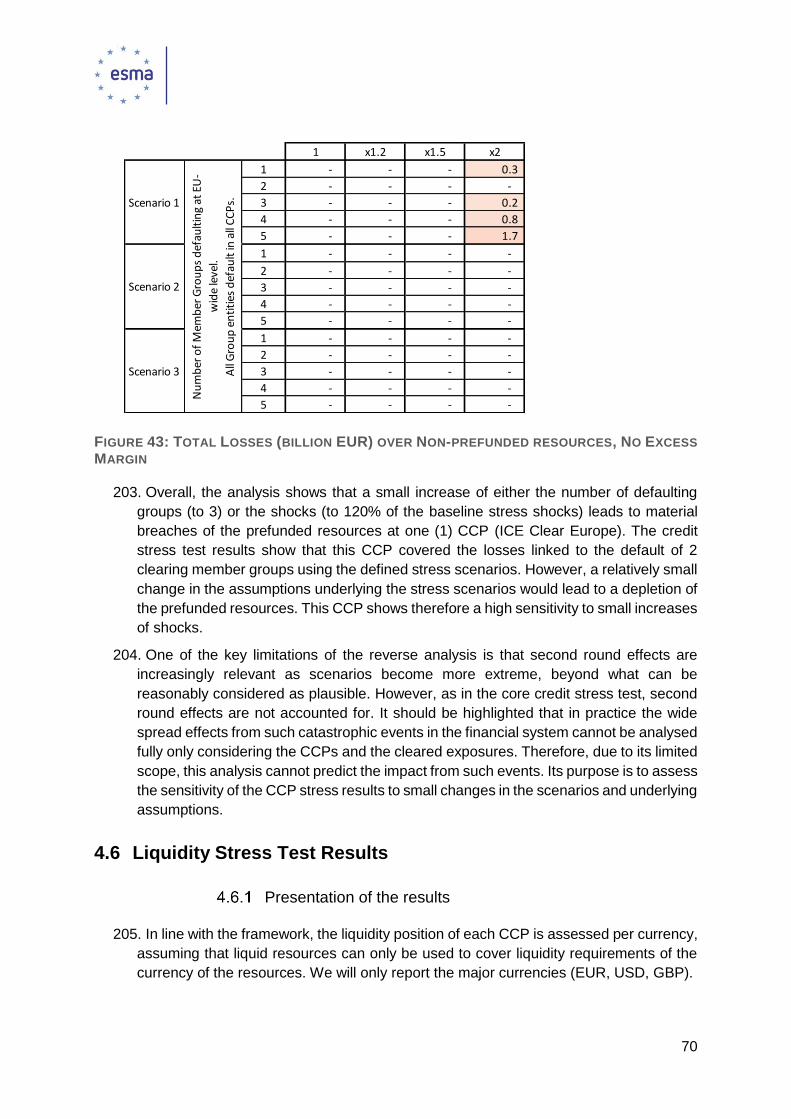
70
FIGURE 43: TOTAL LOSSES (BILLION EUR) OVER NON-PREFUNDED RESOURCES, NO EXCESS
MARGIN
203. Overall, the analysis shows that a small increase of either the number of defaulting
groups (to 3) or the shocks (to 120% of the baseline stress shocks) leads to material
breaches of the prefunded resources at one (1) CCP (ICE Clear Europe). The credit
stress test results show that this CCP covered the losses linked to the default of 2
clearing member groups using the defined stress scenarios. However, a relatively small
change in the assumptions underlying the stress scenarios would lead to a depletion of
the prefunded resources. This CCP shows therefore a high sensitivity to small increases
of shocks.
204. One of the key limitations of the reverse analysis is that second round effects are
increasingly relevant as scenarios become more extreme, beyond what can be
reasonably considered as plausible. However, as in the core credit stress test, second
round effects are not accounted for. It should be highlighted that in practice the wide
spread effects from such catastrophic events in the financial system cannot be analysed
fully only considering the CCPs and the cleared exposures. Therefore, due to its limited
scope, this analysis cannot predict the impact from such events. Its purpose is to assess
the sensitivity of the CCP stress results to small changes in the scenarios and underlying
assumptions.
4.6 Liquidity Stress Test Results
Presentation of the results
205. In line with the framework, the liquidity position of each CCP is assessed per currency,
assuming that liquid resources can only be used to cover liquidity requirements of the
currency of the resources. We will only report the major currencies (EUR, USD, GBP).
1 x1.2 x1.5 x2
1 - - - 0.3
2 - - - -
3 - - - 0.2
4 - - - 0.8
5 - - - 1.7
1 - - - -
2 - - - -
3 - - - -
4 - - - -
5 - - - -
1 - - - -
2 - - - -
3 - - - -
4 - - - -
5 - - - -
Scenario 1
Scenario 2
Scenario 3
Nu
mb
er o
f M
emb
er G
rou
ps
def
ault
ing
at E
U-
wid
e le
vel.
All
Gro
up
en
titi
es d
efau
lt in
all
CC
Ps.

71
206. The overall liquidity position of each CCP is, however also assessed assuming that FX
spot conversions are freely available at the CCP level. A CCP may have a shortfall in
one currency, but still be able to cover that shortfall by converting resources held in
another currency.
207. Given the large number of variables and currencies to test, providing the results for all
combinations of the parameters would not give a clear picture.
208. In order to provide a narrative and intelligibility to the results, we will present them in a
cumulative manner by considering different steps or tools.
Tools Narrative Comments
A Including Excess Margins Most lenient
B Excluding Excess Margins
C Sell off settlement lag of 2 days
D Market access delay for liquid resources
Most conservative
End of day
E Central Bank Repo Impact
Assessing reliance
on central bank
repo lines
TABLE 4: LIQUIDITY TOOLS
209. We start with the most lenient set of assumptions (in A), where we assume full market
access, immediate settlement (i.e. settlement on the same day), access to all committed
lines and possible usage of excess margins given the reported right of use.
210. We then restrict progressively the options available to the CCP to get to the most
conservative end of day assumptions. We finish by assessing the reliance of CCPs on
central bank repo lines.
211. As for commercial bank repo lines, it should be noted that uncommitted repo lines are
always excluded. Only few CCPs have reported committed repo lines from commercial
banks. Committed repo lines are only taken into account when the liquidity provider
providing them is not considered in default. Therefore assessing the unavailability of
commercial bank repo provided by non-defaulting liquidity providers would have had
very limited relevance for the analysis.
212. To illustrate the steps, we analyse the cover 2 overall liquidity position of a CCP under
scenario 1.

72
FIGURE 44: EXAMPLE OF A STEP BY STEP ANALYSIS
213. In the example, we can see
214. The impact on the liquidity profile of the removal of excess collateral (step A to B).
215. The impact of introducing a settlement lag of 2 days (step B to C). The liquidity profiles
of step B and step C only coincide after T.2. This impact comes from the liquidation of
securities that cannot be delivered to a defaulting clearing member or from the
liquidation of collateral that cannot put in a repo.
216. The impact of introducing a market access delay of 1 day (step C to D) which together
with the settlement lag 2 has an effect up to T.3. The market access delay is only
assumed for the collateral that is not used in a repo.
217. Finally, the analysis step E shows that the CCP relies on its central bank repo line. The
CCP has a liquidity buffer of 6.9 bn EUR with the repo line, but without it, would have
had an outstanding liquidity requirement for an amount of 1.7 bn EUR on T.1.
218. Further analysis on intraday liquidity can be found in Annex 6.5.
Cover 2 results
219. For each CCP and in each of the 3 market scenarios, the 2 entities which together
create the worst liquidity position are selected.
4.6.2.1 Capacities of entities selected in Cover 2 analysis
220. For most CCPs, the 2 most important entities for liquidity act as a resource provider
(i.e. a clearing member and/or liquidity provider). However, in some cases, no resource

73
provider is selected. The payment bank capacity alone can be sufficient to get selected.
In 2 cases, no resource provider was selected.
TABLE 5: CAPACITIES OF ENTITIES SELECTED IN COVER 2
221. For the soundness of the exercise, we have therefore not only covered the double
default of clearing members in all their capacities ('Cover 2'), but also included the
default of other relevant entities which are not clearing members.
222. The same group has entities relevant for 4 CCPs as resource provider. All the other
groups would impact significantly 2 CCPs at most.
4.6.2.2 Results
223. In all graphs provided, we only display the CCPs for which there is a remaining liquidity
requirement at any point over the liquidity horizon. In other words, CCPs that have their
liquidity requirements fully covered are not displayed in the graphs. All CCPs are
reported in the tables.
224. The graphs show the remaining available liquidity at CCP level. A CCP that
comfortably covers its liquidity requirements in each of its default fund but restricts most
of its resources to those default funds will not have a big excess reported at CCP level.
In extreme cases, an excess of 0 at CCP level could be reported without it being cause
for concern. A negative number however means that a shortfall in at least one default
fund could not be covered by default fund and CCP level resources.
225. The tables provide the liquidity position of the CCP before any further tools at its
disposal are used, such as use of central bank repo lines, immediate settlements, full
market access or use of excess collateral. Of those analysed tools, the use of central
CCP.CODE # RESOURCE PROVIDER # PAYMENT BANK # CUSTODIAN # ISSUER
CCP 1 2 2 2 2
CCP 2 2 1 1 2
CCP 3 2 2 0 1
CCP 4 2 0 2 2
CCP 5 2 0 1 1
CCP 6 2 0 0 0
CCP 7 2 1 0 0
CCP 8 1 0 1 0
CCP 9 2 0 0 0
CCP 10 2 2 2 1
CCP 11 2 2 1 0
CCP 12 2 0 0 0
CCP 13 2 0 0 0
CCP 14 0 2 2 0
CCP 15 2 1 2 0
CCP 16 0 1 0 2

74
bank repo lines can be considered as highly reliable. The remaining resources overall
column reports the liquidity position but assuming that any excess at default level can
be used at CCP level.
Overall Cover 2 with access to FX markets
226. In this analysis, we are interested in the overall liquidity position of CCPs, allowing for
full FX market access at CCP level. Hence, we report the liquidity position in EUR
equivalent after having converted the liquidity positions from the original currency to
EUR at the stressed FX rate.
227. CCP 9 requires access to the market with immediate settlement to cover its liqudity
needs. This CCP explained that in practice it would apply a fall-back procedure to delay
some settlements to prevent overnight liquidity shortages. The CCP stated it has a legal
basis for this measure based upon a general provision in its rulebook. However, the
instructions of the ESMA stress test require a specific provision to allow delayed
settlements in the exercise, which was not found in the rulebook.
FIGURE 45: COVER 2, STEP D, SCENARIO 1, EUR EQUIVALENT
228. 2 other CCPs cover their liquidity needs by using their existing central bank repo line
or standing lending facility. This is the case in all 3 market scenarios. For CCP 3, the
remaining liquidity needs would be marginally reduced by relaxing the modelling
assumption that excess liquidity generated by inflows are restricted to the default fund
level.
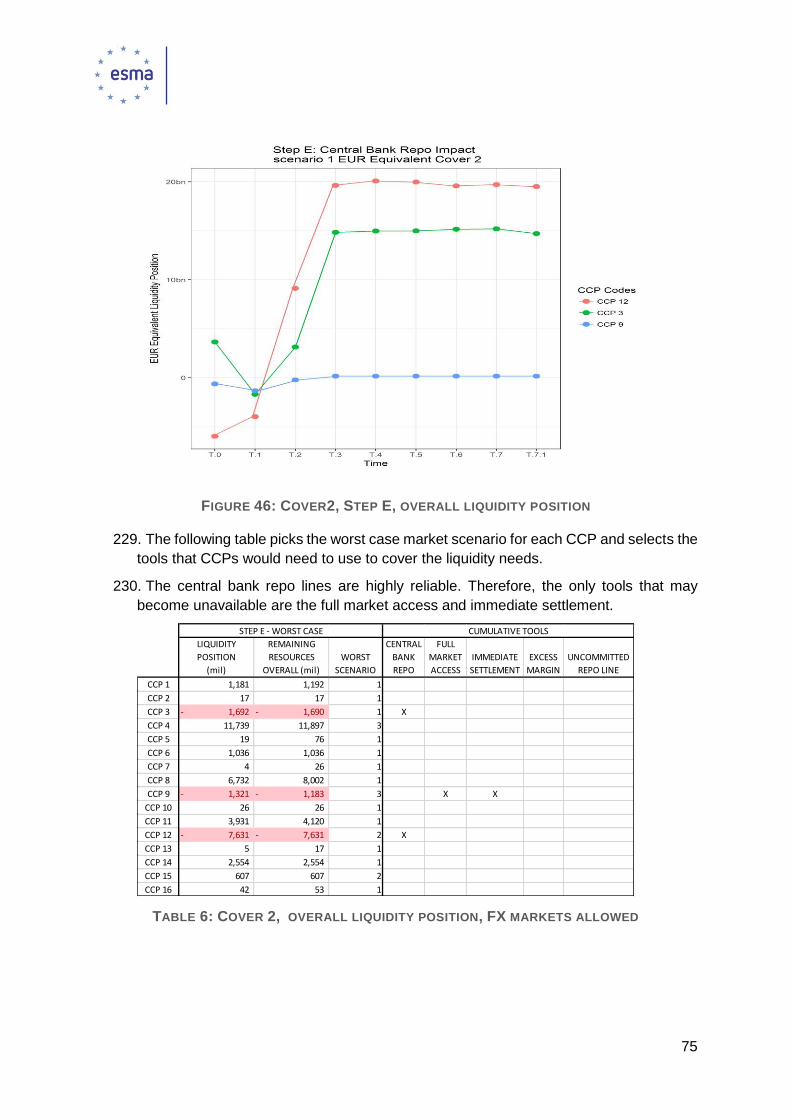
75
FIGURE 46: COVER2, STEP E, OVERALL LIQUIDITY POSITION
229. The following table picks the worst case market scenario for each CCP and selects the
tools that CCPs would need to use to cover the liquidity needs.
230. The central bank repo lines are highly reliable. Therefore, the only tools that may
become unavailable are the full market access and immediate settlement.
TABLE 6: COVER 2, OVERALL LIQUIDITY POSITION, FX MARKETS ALLOWED
LIQUIDITY
POSITION
(mil)
REMAINING
RESOURCES
OVERALL (mil)
WORST
SCENARIO
CENTRAL
BANK
REPO
FULL
MARKET
ACCESS
IMMEDIATE
SETTLEMENT
EXCESS
MARGIN
UNCOMMITTED
REPO LINE
CCP 1 1,181 1,192 1
CCP 2 17 17 1
CCP 3 1,692- 1,690- 1 X
CCP 4 11,739 11,897 3
CCP 5 19 76 1
CCP 6 1,036 1,036 1
CCP 7 4 26 1
CCP 8 6,732 8,002 1
CCP 9 1,321- 1,183- 3 X X
CCP 10 26 26 1
CCP 11 3,931 4,120 1
CCP 12 7,631- 7,631- 2 X
CCP 13 5 17 1
CCP 14 2,554 2,554 1
CCP 15 607 607 2
CCP 16 42 53 1
STEP E - WORST CASE CUMULATIVE TOOLS

76
EUR Cover 2
231. Assuming no access to the FX market, for different CCPs, the liquidity needs in EUR
are not fully covered by the liquidity resources in EUR under the most conservative
scenario.
232. Considering EUR only, the liquidity cushion is reduced for some CCPs compared with
the overall position. The same 3 CCPs have remaining liquidity needs in step E under
both EUR only and overall analysis. Their needs have the same order of magnitude.
FIGURE 47: COVER2, EUR ONLY LIQUIDITY POSITION
TABLE 7: COVER 2, EUR ONLY LIQUIDITY POSITION
233. The central bank repo lines are highly reliable. Therefore, the only tools that may
become unavailable are the full market access and immediate settlement.
LIQUIDITY
POSITION
(mil)
REMAINING
RESOURCES
OVERALL (mil)
WORST
SCENARIO
CENTRAL
BANK REPO
FULL
MARKET
ACCESS
IMMEDIATE
SETTLEMENT
EXCESS
MARGIN
UNCOMMITTED
REPO LINE
CCP 1 1,181 1,192 1
CCP 2 17 17 1
CCP 3 1,762- 1,762- 1 x
CCP 4 996 996 1
CCP 5 19 76 1
CCP 6 1,037 1,037 1
CCP 7 4 26 1
CCP 8 6,502 6,570 2
CCP 9 1,210- 1,210- 1 x x
CCP 11 281 281 1
CCP 12 7,631- 7,631- 2 x
CCP 14 293 293 1
CCP 15 1,078 1,078 1
CCP 16 42 53 1
STEP E WORST CASE CUMULATIVE TOOLS
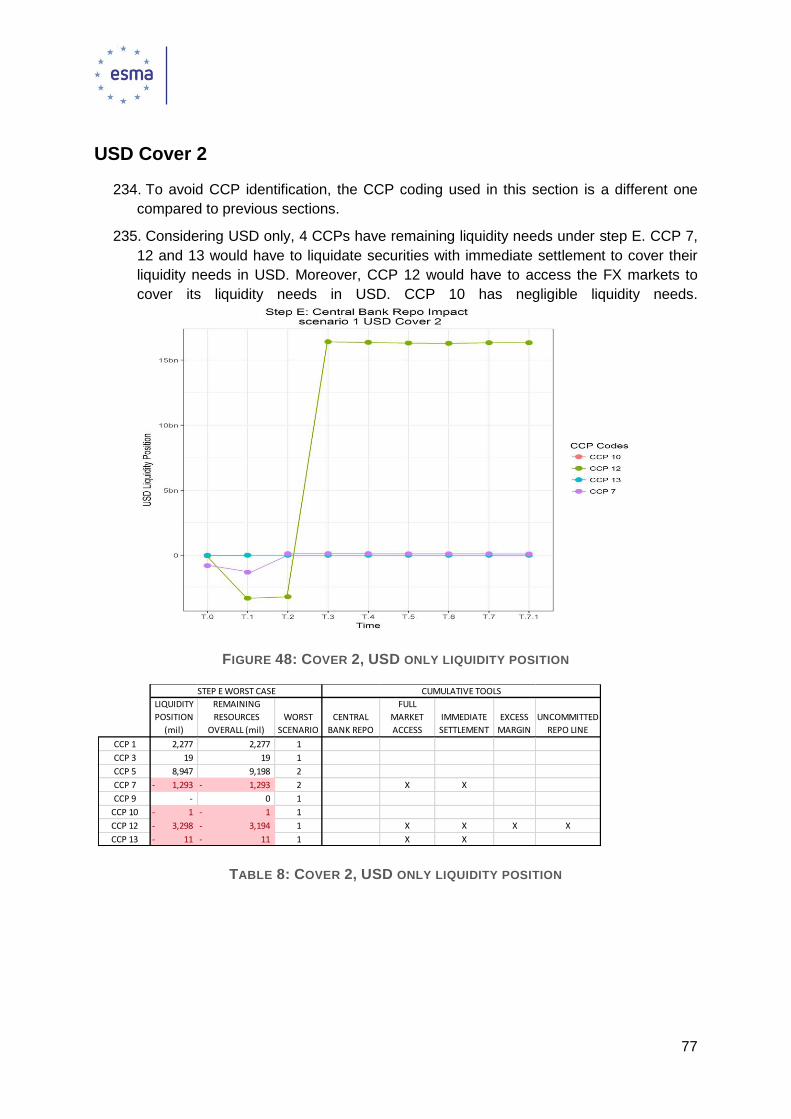
77
USD Cover 2
234. To avoid CCP identification, the CCP coding used in this section is a different one
compared to previous sections.
235. Considering USD only, 4 CCPs have remaining liquidity needs under step E. CCP 7,
12 and 13 would have to liquidate securities with immediate settlement to cover their
liquidity needs in USD. Moreover, CCP 12 would have to access the FX markets to
cover its liquidity needs in USD. CCP 10 has negligible liquidity needs.
FIGURE 48: COVER 2, USD ONLY LIQUIDITY POSITION
TABLE 8: COVER 2, USD ONLY LIQUIDITY POSITION
LIQUIDITY
POSITION
(mil)
REMAINING
RESOURCES
OVERALL (mil)
WORST
SCENARIO
CENTRAL
BANK REPO
FULL
MARKET
ACCESS
IMMEDIATE
SETTLEMENT
EXCESS
MARGIN
UNCOMMITTED
REPO LINE
CCP 1 2,277 2,277 1
CCP 3 19 19 1
CCP 5 8,947 9,198 2
CCP 7 1,293- 1,293- 2 X X
CCP 9 - 0 1
CCP 10 1- 1- 1
CCP 12 3,298- 3,194- 1 X X X X
CCP 13 11- 11- 1 X X
STEP E WORST CASE CUMULATIVE TOOLS

78
GBP Cover 2
236. To avoid CCP identification, the CCP coding used in this section has been changed.
237. Considering GBP only, 3 CCPs would need to liquidate securities with immediate
settlement to cover their GBP needs with GBP resources. CCP 8 would cover 4.8 bn
GBP doing so. There would be no need for access to the FX markets to cover the
liquidity requirements in GBP.
FIGURE 49: COVER2, GBP ONLY, LIQUIDITY POSITION
TABLE 9: COVER 2, GBP ONLY, LIQUIDITY POSITION
LIQUIDITY
POSITION
(mil)
REMAINING
RESOURCES
OVERALL
(mil)
WORST
SCENARIO
CENTRAL
BANK REPO
FULL
MARKET
ACCESS
IMMEDIATE
SETTLEMENT
EXCESS
MARGIN
UNCOMMITTED
REPO LINE
CCP 1 91- 91- 1 X X
CCP 3 2,638 2,638 2
CCP 7 84 84 1
CCP 8 4,780- 2,945- 2 X X
CCP 10 0 0 1
CCP 16 499- 499- 2 X X X
STEP E WORST CASE CUMULATIVE TOOLS

79
LDB results
238. The LDB scenario assumes the default of the 2 groups that would impact the most the
EU-wide liquidity position of CCPs EU-wide. The Cover 2 analysis was based on only 2
entities defaulting.
239. CCP 9 has moderate remaining liquidity needs remaining in EUR and overall, as soon
as we assume delayed settlement.
240. CCP 12 uses its highly reliable central bank repo line to cover its remaining liquidity
requirements of 2.4 bn EUR in scenario 2 and 1.1 bn EUR in scenario 3. This is the
case even allowing for FX spot market access.
241. Under all market scenarios, CCP 11 has remaining needs between 2.0 and 3.5 bn
GBP, which can be covered by immediate liquidation of collateral or access to the FX
spot market.
242. CCP 8 has a USD liquidity need in all scenarios, with a maximum of 2.3 bn USD in
scenario 1, which can be covered by accessing the FX spot market.
243. The table below provides the sizes of the remaining liquidity needs under step E. The
number of defaulting entities relevant for the CCP under the scenario is also provided.
TABLE 10: LDB REMAINING LIQUIDITY NEEDS (OVER 1 MILLION)
Code SCENARIO.ID CURRENCY
LIQUIDITY
POSITION
(mil)
REMAINING RESOURCES
OVERALL (mil)
NB
DEFAULTING
ENTITIES
CCP 8 1 USD -2,294 -2,172 4
CCP 8 2 USD -941 -899 5
CCP 8 3 USD -720 -633 5
CCP 9 1 EUR -19 -19 1
CCP 9 1 EUR Equivalent -19 100 1
CCP 9 2 EUR Equivalent -10 160 2
CCP 9 2 USD -2 -2 2
CCP 9 3 EUR Equivalent -10 154 2
CCP 9 3 USD -2 -2 2
CCP 11 1 GBP -2,042 -1,903 6
CCP 11 2 GBP -3,455 -1,100 7
CCP 11 3 GBP -3,342 -813 7
CCP 12 2 EUR -2,408 -2,408 5
CCP 12 2 EUR Equivalent -2,408 -2,408 5
CCP 12 3 EUR -1,141 -1,141 5
CCP 12 3 EUR Equivalent -1,141 -1,141 5

80
EUR Equivalent
FIGURE 50: LDB, OVERALL LIQUIDITY POSITION
TABLE 11: LDB, OVERALL POSITION, FX MARKETS ALLOWED
244. The central bank repo lines are highly reliable. Therefore the only tools that may
become unavailable are the full market access and immediate settlement. Only CCP 9
would have a remaining liquidity need requirement under the most conservative
assumptions.
LIQUIDITY
POSITION
(mil)
REMAINING
RESOURCES
OVERALL (mil)
WORST
SCENARIO
CENTRAL
BANK
REPO
FULL
MARKET
ACCESS
IMMEDIATE
SETTLEMENT
EXCESS
MARGIN
UNCOMMITTED
REPO LINE
CCP 1 2,335 2,344 3
CCP 2 68 70 1
CCP 3 4,059 4,075 3
CCP 4 23,034 23,226 3
CCP 5 19 80 3
CCP 6 1,289 1,308 1
CCP 7 4 29 1
CCP 8 6,766 8,470 1
CCP 9 19- 100 1 X X
CCP 10 58 58 1
CCP 11 5,971 6,203 1
CCP 12 2,408- 2,408- 2 X
CCP 13 6 19 1
CCP 14 2,995 2,995 1
CCP 15 1,298 1,300 1
CCP 16 80 83 1
STEP E WORST CASE CUMULATIVE TOOLS
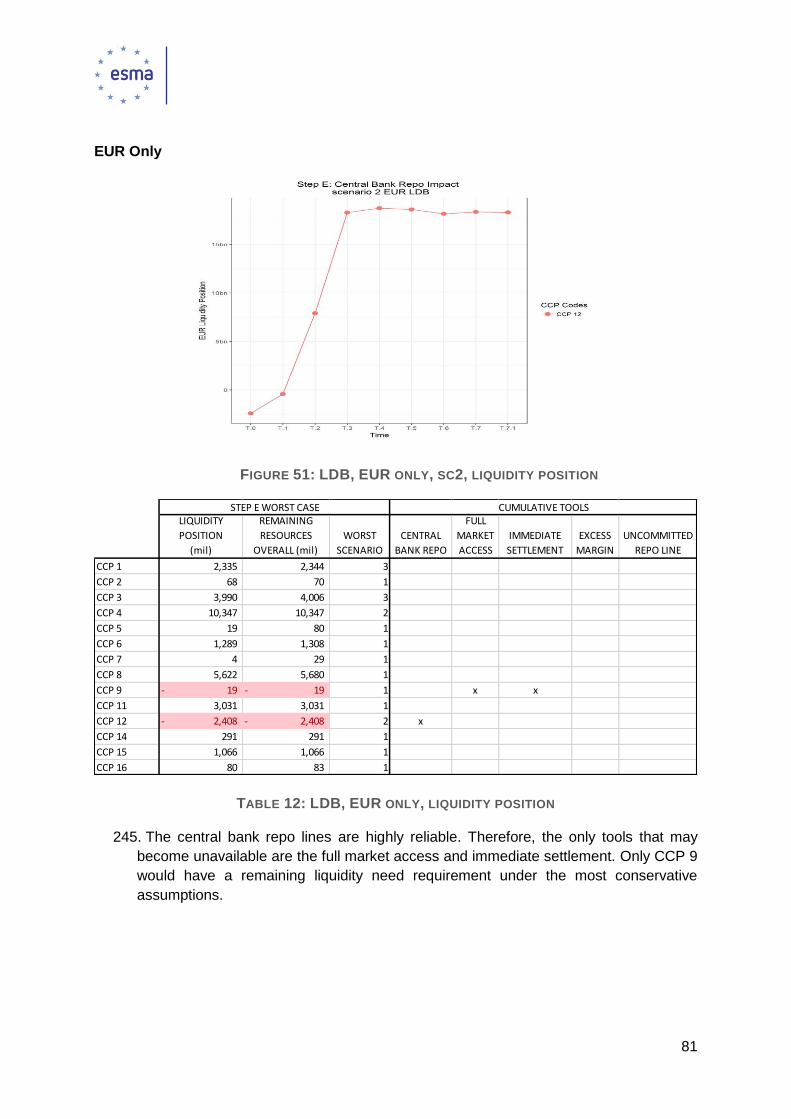
81
EUR Only
FIGURE 51: LDB, EUR ONLY, SC2, LIQUIDITY POSITION
TABLE 12: LDB, EUR ONLY, LIQUIDITY POSITION
245. The central bank repo lines are highly reliable. Therefore, the only tools that may
become unavailable are the full market access and immediate settlement. Only CCP 9
would have a remaining liquidity need requirement under the most conservative
assumptions.
LIQUIDITY
POSITION
(mil)
REMAINING
RESOURCES
OVERALL (mil)
WORST
SCENARIO
CENTRAL
BANK REPO
FULL
MARKET
ACCESS
IMMEDIATE
SETTLEMENT
EXCESS
MARGIN
UNCOMMITTED
REPO LINE
CCP 1 2,335 2,344 3
CCP 2 68 70 1
CCP 3 3,990 4,006 3
CCP 4 10,347 10,347 2
CCP 5 19 80 1
CCP 6 1,289 1,308 1
CCP 7 4 29 1
CCP 8 5,622 5,680 1
CCP 9 19- 19- 1 x x
CCP 11 3,031 3,031 1
CCP 12 2,408- 2,408- 2 x
CCP 14 291 291 1
CCP 15 1,066 1,066 1
CCP 16 80 83 1
STEP E WORST CASE CUMULATIVE TOOLS

82
USD Only
FIGURE 52: LDB, USD only, liquidity position
Table 13: LDB, USD only, liquidity position
246. CCP 8 would need to have access to the FX markets to fulfil its liquidity requirements
in USD under the most conservative assumptions of the exercise.
LIQUIDITY
POSITION
(mil)
REMAINING
RESOURCES
OVERALL (mil)
WORST
SCENARI
O
CENTRAL
BANK REPO
FULL
MARKET
ACCESS
IMMEDIATE
SETTLEMENT
EXCESS
MARGIN
UNCOMMITTED
REPO LINE
CCP 3 1- 1- 2
CCP 4 120 120 1
CCP 6 0- 0- 1
CCP 8 2,294- 2,172- 1 X X X X
CCP 9 2- 2- 2
CCP 11 6,745 6,911 1
CCP 14 2,777 2,777 1
CCP 15 18 18 2
STEP E WORST CASE CUMULATIVE TOOLS
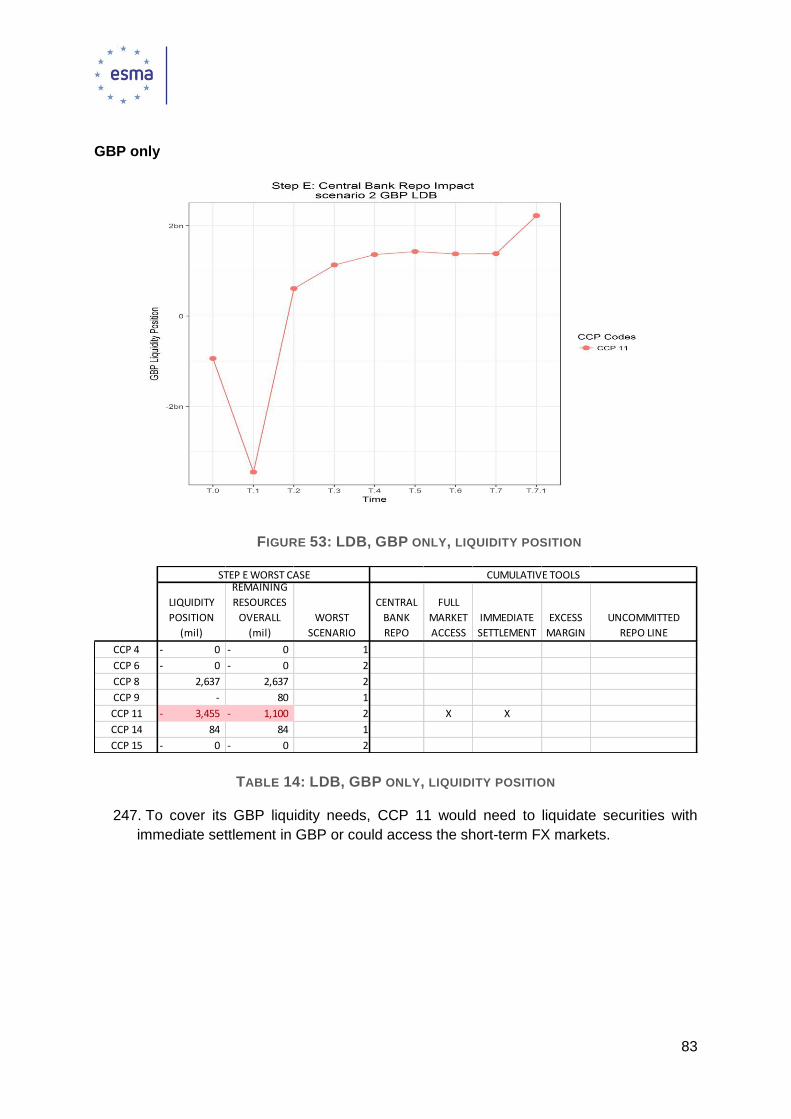
83
GBP only
FIGURE 53: LDB, GBP ONLY, LIQUIDITY POSITION
TABLE 14: LDB, GBP ONLY, LIQUIDITY POSITION
247. To cover its GBP liquidity needs, CCP 11 would need to liquidate securities with
immediate settlement in GBP or could access the short-term FX markets.
LIQUIDITY
POSITION
(mil)
REMAINING
RESOURCES
OVERALL
(mil)
WORST
SCENARIO
CENTRAL
BANK
REPO
FULL
MARKET
ACCESS
IMMEDIATE
SETTLEMENT
EXCESS
MARGIN
UNCOMMITTED
REPO LINE
CCP 4 0- 0- 1
CCP 6 0- 0- 2
CCP 8 2,637 2,637 2
CCP 9 - 80 1
CCP 11 3,455- 1,100- 2 X X
CCP 14 84 84 1
CCP 15 0- 0- 2
STEP E WORST CASE CUMULATIVE TOOLS

84
Liquidity tools review
In this section, we look in more details at two of the tools used by CCPs to cover their liquidity
needs.
4.6.4.1 Access to FX market
248. As explained in 3.4.2.4, the liquidity position is assessed for each currency. For
example, CCP 8 has 4.8 bn GBP remaining liquidity needs in GBP under scenario 2.
FIGURE 54: COVER 2, GBP ONLY. CCP 8, SCENARIO 2
249. However, if the CCP keeps access to the FX markets, it can cover its liquidity
requirement by converting some excess currencies in GBP. Its overall excess liquidity
would be almost 8 bn EUR.
FIGURE 55: COVER 2, OVERALL POSITION. CCP 8, SCENARIO 2

85
4.6.4.2 Immediate settlement / Central bank repo
250. Some CCP have remaining liquidity requirements as soon as we introduce a
settlement lag, as can seen in 4.6.2.2 for CCP 9.
251. When a committed central bank repo line is present, the impact of the settlement lag
is only being felt in full when not taking into account the central bank repo line. This
impact can be seen below between Step D and Step E.
FIGURE 56: COVER 2, OVERALL POSITION. CCP 12, SCENARIO 1

86
5 Conclusions
252. The methodology and scope of the EU-wide Central Counterparty (CCP) stress test
have significantly evolved from the first exercise published in 2016. The key
improvements are the extension of the scope to include liquidity risk, the improvement
of the stress scenario design, based on common, internally consistent scenarios
delivered by the ESRB, and the enhancement of the validation process. The exercise
covered all 16 authorised EU CCPs and all cleared products. The enhanced framework
has improved the robustness of the exercise, but has at the same time increased the
technical complexity and effort required from all participants. The exercise has benefited
from a closer involvement of the NCA), whose role was critical to check how the
individual CCPs calculated the data based on the common scenarios and instructions.
253. Of course, as with all exercises of this scale and type, not all limitations can be
addressed within a single and at the same time practicable design. Counterparty credit
risk due to member defaults and liquidity risk are the core types of risks faced by CCPs
and are now included in the scope of the exercise. However, CCPs may also be subject
to other types of risks that are either not covered or are partially covered and could in
isolation or in combination with credit and liquidity risks challenge their resilience. ESMA
remains committed to further improve and evolve the methodology and scope of the
future CCP stress tests.
254. EU CCPs provided for the purpose of this exercise detailed data on their exposures
and financial resources for one reference date. The aggregate amount of resources
required and collected by CCPs from clearing members in the form of margin and default
fund contributions combined was approximately 270bn EUR. Additional prefunded
resources, including CCPs’ dedicated own funds (“skin-in-the-game”), accounted
overall for a very small share of the default waterfall. On top of the collateral provided to
meet CCPs’ requirements, some CCPs have also reported significant amounts of
excess collateral. These have not been considered in the main stress results, reflecting
the assumption that defaulting members would have withdrawn under stressed
conditions any collateral exceeding the minimum required. Although only prefunded
resources have been considered in the stress results, it has been observed that the total
amount of non-prefunded resources (powers of assessment) that can be called is not
always capped, even after assuming the theoretical default of a large number clearing
members. This could count as a potential source of second-round effects to non-
defaulting clearing members, but under the knock-on analysis performed, there was no
evidence of systemic implications via the risk-sharing mechanism of CCPs under the
considered stress scenarios and member default assumptions. Concerning the
allocation of clearing members’ collateral, the overall EU-wide picture looks rather
reassuring, with close to 93% of the collateral being held in the form of cash or
government fixed income securities. The cases that could signal divergent practices or
over-reliance to specific types of resources or investing arrangements for individual
CCPs will need to be assessed on a case-by-case basis, taking into account the risk
profile of the relevant practices, subject of course to the regulatory requirements setting
the eligible asset types and additional conditions.

87
255. Close to 900 individual entities that are clearing members to one or more CCPs have
been identified. The analysis of concentration to individual clearing participants, as
assessed using the Herfindahl - Hirschmann Index (HHI) methodology, has not
evidenced any systemically critical concentration to single clearing members or groups
at EU-wide level. The analysis of the network of CCPs and clearing participants has
confirmed that, as already highlighted in the first EU-wide stress test exercise, CCPs
can be highly interconnected through common clearing members. In particular, the
biggest clearing member groups are top members at multiple CCPs. The enhanced
interconnectedness analysis has however indicated, that although the top clearing
member groups have exposures to multiple CCPs, these exposures would generally not
hit simultaneously the default fund waterfall of all these CCPs under one of the common,
internally consistent stress scenarios considered in this exercise. It should however be
noted that the clearing members’ positions and thus the structure and severity of the
exposures across CCPs may change significantly even from one day to another.
Therefore, this indication cannot be used to draw any conclusions on a forward-looking
basis.
256. When looking at interconnectedness via custodians, and subject to the limitations of
the exercise, it can be observed that multiple CCPs rely on a small number of cash and
securities custodians, including mainly ICSDs and for one particular currency one
commercial bank. It should however be noted that, especially concerning the cash
deposited at these institutions, the overwhelming majority of the cash was reported as
being kept through arrangements that allow its collateralisation with financial
instruments. The over-reliance on specific custodians does imply, however, some
residual risks including for example operational risks. Concerning common liquidity
providers, not many CCPs have reported committed repo lines from commercial entities.
Moreover, no strong evidence of single financial groups committing to providing liquidity
to many CCPs at the same time has been identified.
257. The results of the credit stress test indicate that, under the simultaneous default of the
two groups of clearing members (MD-B) that would cause at an aggregate EU-wide
level the largest losses above the defaulting members’ collateral, all CCPs could cover
the calculated losses with the already provided prefunded resources. Under the most
severe of the three considered market stress scenarios, the EU-wide aggregate losses
exceeding the defaulting clearing members’ resources, that would need to be covered
by the mutualised resources at all CCPs, were approximately 2bn EUR. These would
be absorbed without problems, by the available prefunded resources. The results
indicate that, under the assumptions and limitations of the exercise, there would be no
systemic impact from such an event, if combined with the considered market stress
scenarios.
258. Under a different member default scenario (Cover-2 groups per CCP), we selected
individually for each CCP two corporate groups and assumed all clearing members
belonging to those groups as defaulting only in that particular CCP. Overall, no shortfall
of prefunded resources with systemic implications was to be found. The results indicate
that for one CCP (BME Clearing) the need to call for a limited amount (less than 1 million
EUR) additional non-prefunded resources. For another CCP (ICE Clear Europe), the

88
prefunded resources would be enough, but only marginally enough to cover losses of
more systemic relevance. Although the results using only the required margin represent
a more realistic scenario, it can be noted for completeness that if one would also
consider the excess available collateral, the default fund amounts would in all cases be
enough to cover the residual losses.
259. The reverse stress tests analysis assessed the sensitivity of the CCP stress results to
small changes in the scenarios and underlying assumptions. Overall, the analysis
showed that a relatively small increase of either the number of defaulting groups (to 3)
or the shocks (to 120% of the baseline stress shocks) could lead to breaches of the
prefunded resources at one CCP (ICE Clear Europe), equal to 0.4bn EUR and 0.7bn
EUR respectively. This CCP shows therefore a high sensitivity to small increases of
shocks.
260. The liquidity stress testing exercise contributes to a better understanding of the liquidity
challenges faced by EU CCPs. It provides an estimate of the liquidity requirements in
different currencies and assesses the effectiveness of the tools available to the CCPs
under a combination of market price shocks, member and/or liquidity provider default
scenarios.
261. The entities considered to be in default under the different scenarios have at least one
of the following capacities: clearing members, issuers, custodians, payments banks or
repo counterparties. The entities selected as the most relevant for liquidity are not
necessarily clearing members.
262. The results of this exercise demonstrates that under all market scenarios, EU CCPs
could achieve sufficient liquidity to meet their liquidity needs assuming the default of 2
relevant entities (Cover 2) using a variety of tools. Some large CCPs require access to
the short-term FX markets to cover requirements in some major currencies. Some CCPs
make use of their access to central bank repo lines.
263. Assuming the default of 2 groups of entities EU-wide, one of the CCPs has moderate
liquidity needs if we assume delayed settlement. As in Cover 2, some CCPs would need
to access the short-term FX markets or rely on their reported central bank repo line to
cover their liquidity needs.
264. As for last year’s EU-wide CCP stress test exercise, EU CCPs are overall resilient to
common shocks and multiple defaults. However, the exercise revealed in the credit
stress test: 1) one minor failure of no systemic relevance and 2) for another CCP, high
sensitivity to marginal increases of price shocks or number of defaults that might have
systemic relevance. Under the liquidity stress test analysis the exercise revealed that
CCPs use different tools to cover their liquidity needs, some are highly reliable as central
bank repos, other less, but no particular deficiency was found in the management of
liquidity risks by EU CCPs.

89
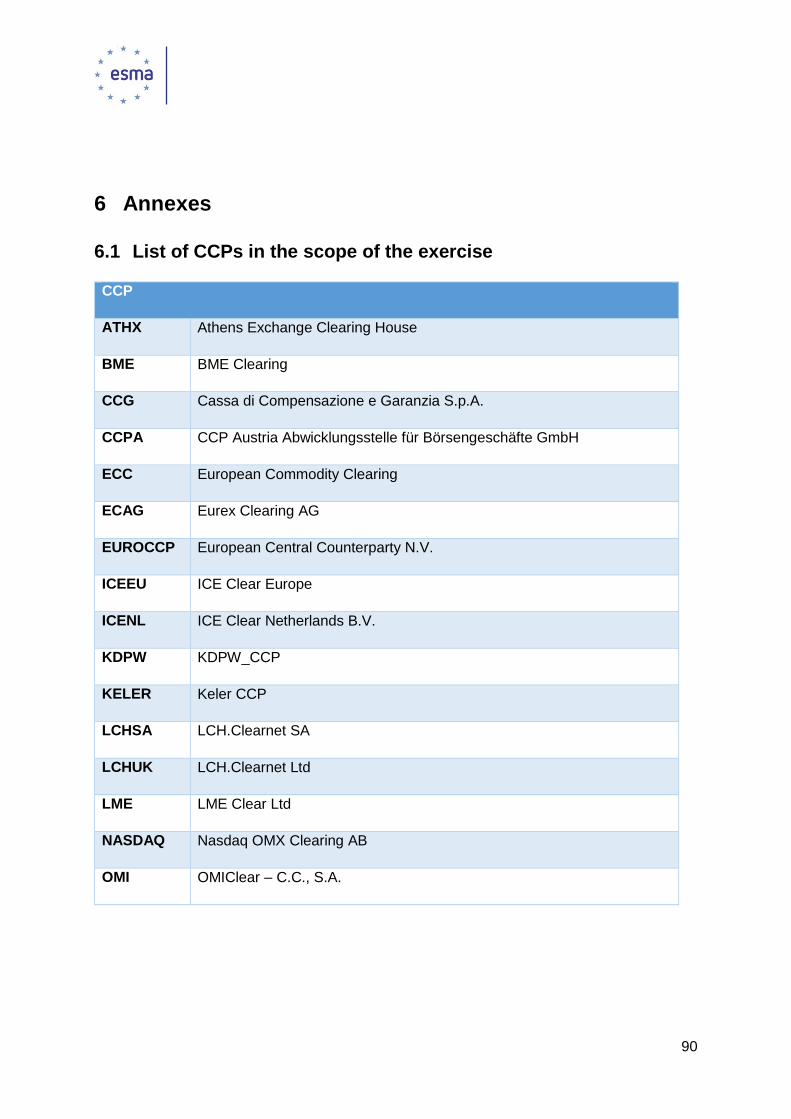
90
6 Annexes
6.1 List of CCPs in the scope of the exercise
CCP
ATHX Athens Exchange Clearing House
BME BME Clearing
CCG Cassa di Compensazione e Garanzia S.p.A.
CCPA CCP Austria Abwicklungsstelle für Börsengeschäfte GmbH
ECC European Commodity Clearing
ECAG Eurex Clearing AG
EUROCCP European Central Counterparty N.V.
ICEEU ICE Clear Europe
ICENL ICE Clear Netherlands B.V.
KDPW KDPW_CCP
KELER Keler CCP
LCHSA LCH.Clearnet SA
LCHUK LCH.Clearnet Ltd
LME LME Clear Ltd
NASDAQ Nasdaq OMX Clearing AB
OMI OMIClear – C.C., S.A.
91
6.2 Credit Stress Test Results
The full set of credit stress test results, including those that are not discussed exhaustively in
the main sections of the report are presented here for reference, per member default scenario,
market stress scenario and with/without excess margin collateral.
Credit Stress Test Results, cover-2 groups per CCP

92
Cover-2 Groups per CCP (no cross defaulting), Market Scenario 1 No Excess Margin
With Excess Margin

93
Cover-2 Groups per CCP (no cross defaulting), Market Scenario 2 No Excess Margin
With Excess Margin

94
Cover-2 Groups per CCP (no cross defaulting), Market Scenario 3 No Excess Margin
With Excess Margin

95
Credit Stress Test Results, MD-A
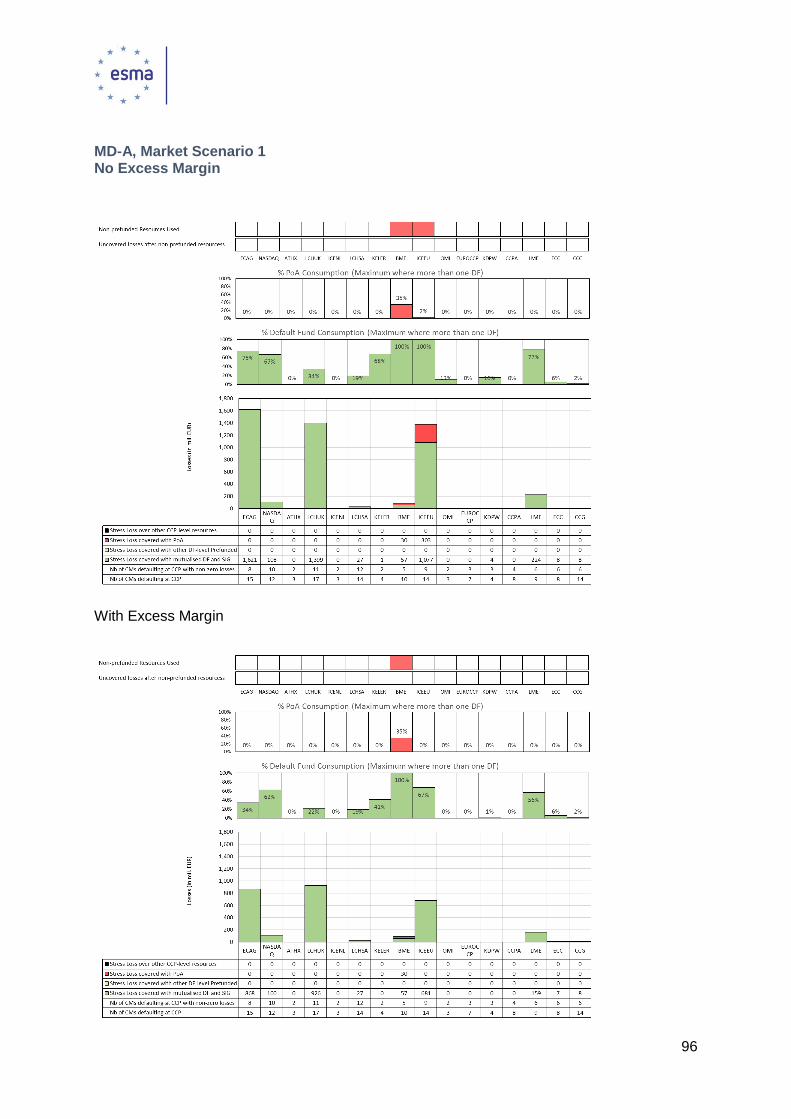
96
MD-A, Market Scenario 1 No Excess Margin
With Excess Margin

97
MD-A, Market Scenario 2 No Excess Margin
With Excess Margin

98
MD-A, Market Scenario 3 No Excess Margin
With Excess Margin

99
Credit Stress Test Results, MD-B
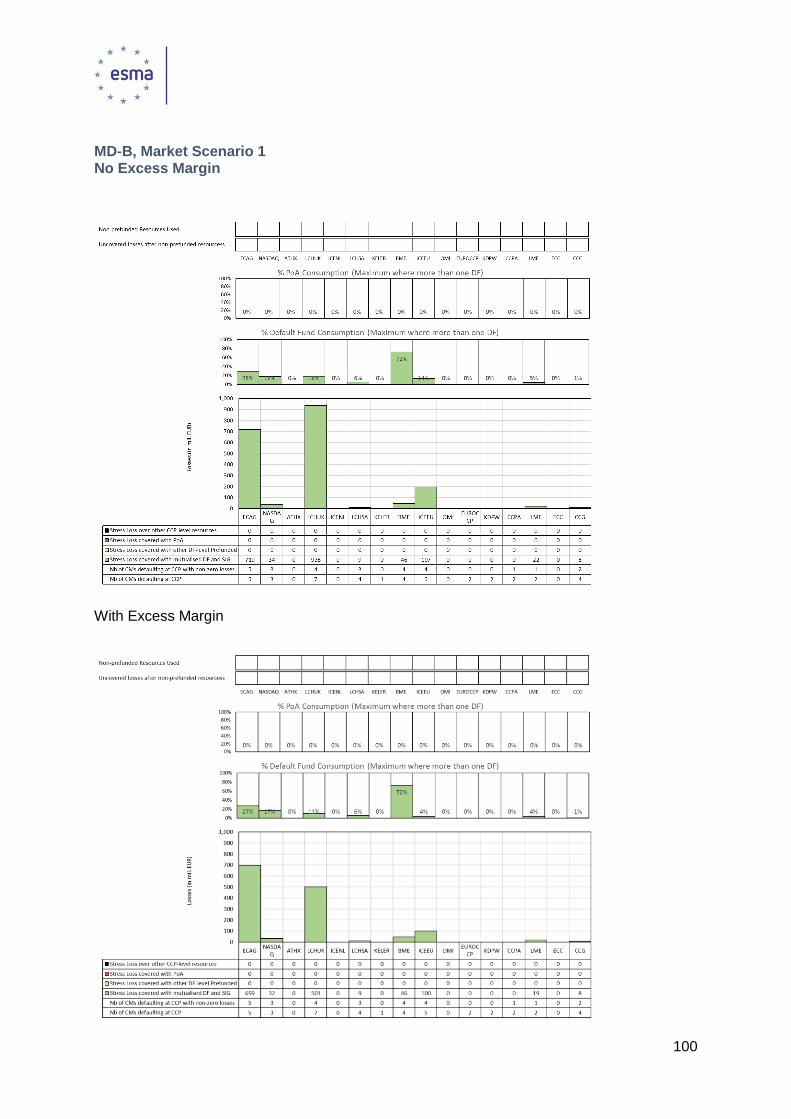
100
MD-B, Market Scenario 1 No Excess Margin
With Excess Margin

101
MD-B, Market Scenario 2 No Excess Margin
With Excess Margin

102
MD-B, Market Scenario 3 No Excess Margin
With Excess Margin
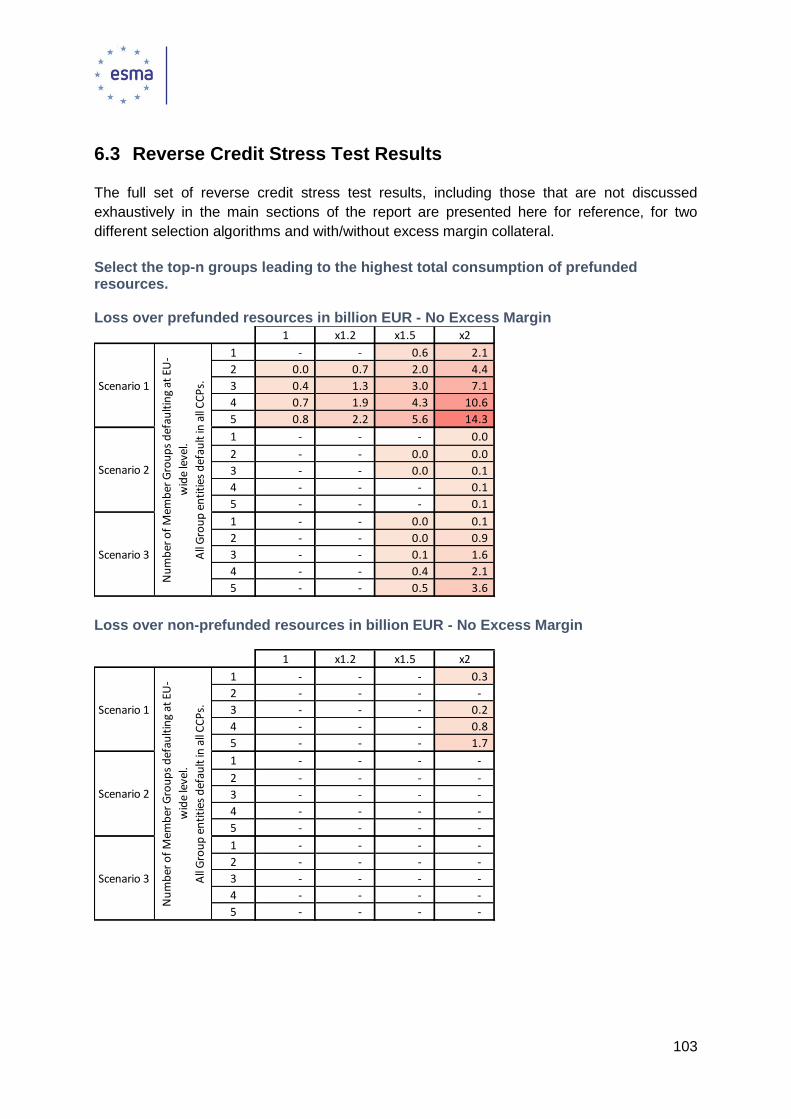
103
6.3 Reverse Credit Stress Test Results
The full set of reverse credit stress test results, including those that are not discussed
exhaustively in the main sections of the report are presented here for reference, for two
different selection algorithms and with/without excess margin collateral.
Select the top-n groups leading to the highest total consumption of prefunded resources. Loss over prefunded resources in billion EUR - No Excess Margin
Loss over non-prefunded resources in billion EUR - No Excess Margin
1 x1.2 x1.5 x2
1 - - 0.6 2.1
2 0.0 0.7 2.0 4.4
3 0.4 1.3 3.0 7.1
4 0.7 1.9 4.3 10.6
5 0.8 2.2 5.6 14.3
1 - - - 0.0
2 - - 0.0 0.0
3 - - 0.0 0.1
4 - - - 0.1
5 - - - 0.1
1 - - 0.0 0.1
2 - - 0.0 0.9
3 - - 0.1 1.6
4 - - 0.4 2.1
5 - - 0.5 3.6
Scenario 1
Scenario 2
Scenario 3
Nu
mb
er o
f M
emb
er G
rou
ps
def
ault
ing
at E
U-
wid
e le
vel.
All
Gro
up
en
titi
es d
efau
lt in
all
CC
Ps.
1 x1.2 x1.5 x2
1 - - - 0.3
2 - - - -
3 - - - 0.2
4 - - - 0.8
5 - - - 1.7
1 - - - -
2 - - - -
3 - - - -
4 - - - -
5 - - - -
1 - - - -
2 - - - -
3 - - - -
4 - - - -
5 - - - -
Scenario 1
Scenario 2
Scenario 3
Nu
mb
er o
f M
emb
er G
rou
ps
def
ault
ing
at E
U-
wid
e le
vel.
All
Gro
up
en
titi
es d
efau
lt in
all
CC
Ps.

104
Select the top-n groups leading to the highest total consumption of prefunded resources. Loss over prefunded resources in billion EUR - With Excess Margin
Loss over non-prefunded resources in billion EUR - With Excess Margin
1 x1.2 x1.5 x2
1 - - 0.3 1.8
2 - 0.1 1.3 3.4
3 - 0.6 2.2 4.8
4 - 1.0 2.7 7.8
5 - 1.3 3.1 10.3
1 - - - 0.0
2 - - - 0.0
3 - - - 0.1
4 - - - 0.1
5 - - - 0.0
1 - - 0.0 0.0
2 - - 0.0 0.3
3 - - - 0.8
4 - - - 1.2
5 - - - 2.1
Scenario 1
Scenario 2
Scenario 3
Nu
mb
er o
f M
emb
er G
rou
ps
def
ault
ing
at E
U-
wid
e le
vel.
All
Gro
up
en
titi
es d
efau
lt in
all
CC
Ps.
1 x1.2 x1.5 x2
1 - - - 0.3
2 - - - -
3 - - - -
4 - - - 0.4
5 - - - 0.6
1 - - - -
2 - - - -
3 - - - -
4 - - - -
5 - - - -
1 - - - -
2 - - - -
3 - - - -
4 - - - -
5 - - - -
Scenario 1
Scenario 2
Scenario 3
Nu
mb
er o
f M
emb
er G
rou
ps
def
ault
ing
at E
U-
wid
e le
vel.
All
Gro
up
en
titi
es d
efau
lt in
all
CC
Ps.

105
Select the EU-wide top-n groups leading to the highest loss over own resources (margin and default fund contributions of defaulting members). Loss over prefunded resources in billion EUR - No Excess Margin
Loss over non-prefunded resources in billion EUR - No Excess Margin
1 x1.2 x1.5 x2
1 - - - 0.0
2 - - - 1.1
3 - 0.0 2.1 6.2
4 - 0.8 3.3 10.4
5 0.5 1.8 5.6 14.0
1 - - - -
2 - - - -
3 - - - -
4 - - - -
5 - - - -
1 - - - -
2 - - - -
3 - - - -
4 - - - 0.9
5 - - - 2.8
Scenario 1
Scenario 2
Scenario 3
Nu
mb
er o
f M
emb
er G
rou
ps
def
ault
ing
at E
U-
wid
e le
vel.
All
Gro
up
en
titi
es d
efau
lt in
all
CC
Ps.
1 x1.2 x1.5 x2
1 - - - -
2 - - - -
3 - - - 0.2
4 - - - 0.5
5 - - - 1.1
1 - - - -
2 - - - -
3 - - - -
4 - - - -
5 - - - -
1 - - - -
2 - - - -
3 - - - -
4 - - - -
5 - - - -
Scenario 1
Scenario 2
Scenario 3
Nu
mb
er o
f M
emb
er G
rou
ps
def
ault
ing
at E
U-
wid
e le
vel.
All
Gro
up
en
titi
es d
efau
lt in
all
CC
Ps.

106
Select the EU-wide top-n groups leading to the highest loss over own resources (margin and default fund contributions of defaulting members). Loss over prefunded resources in billion EUR - With Excess Margin
Loss over non-prefunded resources in billion EUR - With Excess Margin
1 x1.2 x1.5 x2
1 - - - 0.0
2 - - - 0.6
3 - 0.0 1.5 4.2
4 - 0.3 2.1 7.6
5 - 0.9 3.1 10.6
1 - - - -
2 - - - -
3 - - - -
4 - - - -
5 - - - -
1 - - - -
2 - - - -
3 - - - -
4 - - - -
5 - - - 1.2
Scenario 1
Scenario 2
Scenario 3
Nu
mb
er o
f M
emb
er G
rou
ps
def
ault
ing
at E
U-
wid
e le
vel.
All
Gro
up
en
titi
es d
efau
lt in
all
CC
Ps.
1 x1.2 x1.5 x2
1 - - - -
2 - - - -
3 - - - 0.2
4 - - - 0.5
5 - - - 0.9
1 - - - -
2 - - - -
3 - - - -
4 - - - -
5 - - - -
1 - - - -
2 - - - -
3 - - - -
4 - - - -
5 - - - -
Scenario 1
Scenario 2
Scenario 3
Nu
mb
er o
f M
emb
er G
rou
ps
def
ault
ing
at E
U-
wid
e le
vel.
All
Gro
up
en
titi
es d
efau
lt in
all
CC
Ps.

107
6.4 Interconnectedness Networks
Interconnectedness through custodians of Cash per Currency
6.4.1.1 Interconnectedness through custodians of Cash per Currency - EUR
6.4.1.2 Interconnectedness through custodians of Cash per Currency - USD
CCPs EUR Cash Custodian Groups Largest Bubble 10bn EUR
CCPs USD Cash Custodian Groups Largest Bubble 22bn EUR
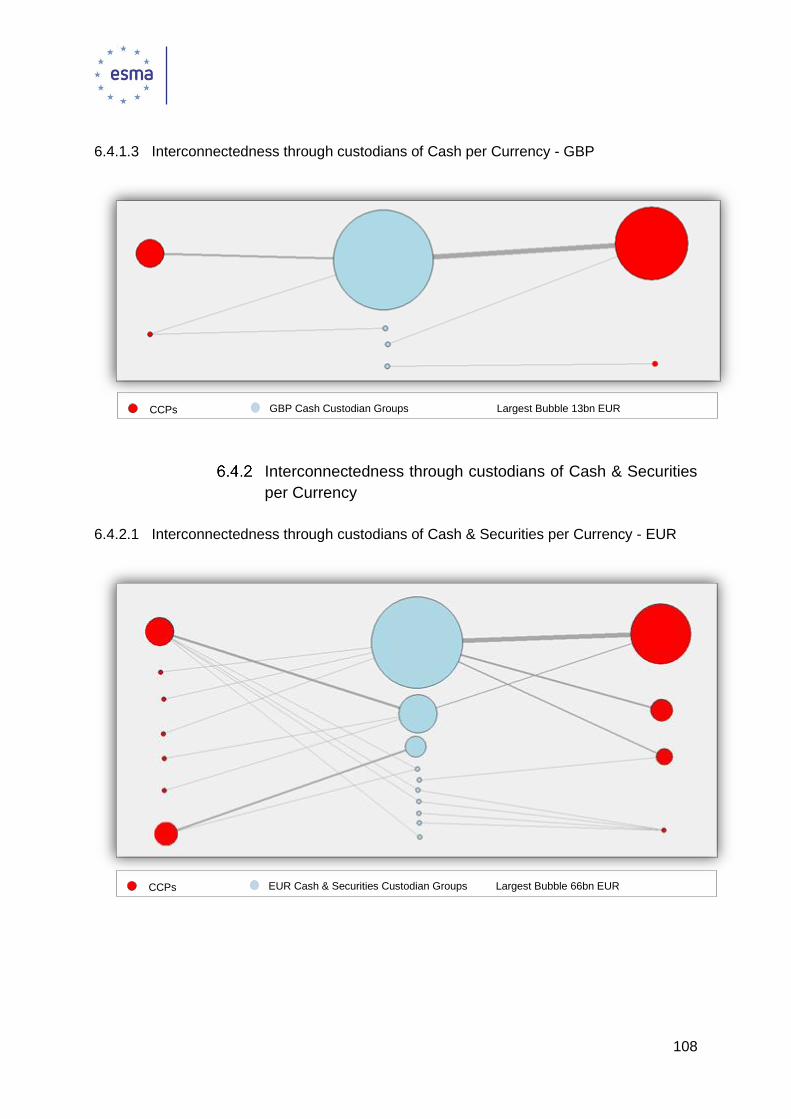
108
6.4.1.3 Interconnectedness through custodians of Cash per Currency - GBP
Interconnectedness through custodians of Cash & Securities
per Currency
6.4.2.1 Interconnectedness through custodians of Cash & Securities per Currency - EUR
CCPs GBP Cash Custodian Groups Largest Bubble 13bn EUR
CCPs EUR Cash & Securities Custodian Groups Largest Bubble 66bn EUR

109
6.4.2.2 Interconnectedness through custodians of Cash & Securities per Currency - USD
6.4.2.3 Interconnectedness through custodians of Cash & Securities per Currency - GBP
CCPs USD Cash & Securities Custodian Groups Largest Bubble 43bn EUR
CCPs GBP Cash & Securities Custodian Groups Largest Bubble 32bn EUR

110
Interconnectedness through Liquidity providers (committed
credit and repo lines only) per Currency
6.4.3.1 Interconnectedness through Liquidity providers (committed credit and repo lines only)
per Currency – EUR
6.4.3.2 Interconnectedness through Liquidity providers (committed credit and repo lines only)
per Currency – USD
CCPs EUR Committed Credit & Repo Line Providers (Groups) Largest Bubble 0.9bn EUR
CCPs USD Committed Credit & Repo Line Providers (Groups) Largest Bubble 0.9bn EUR
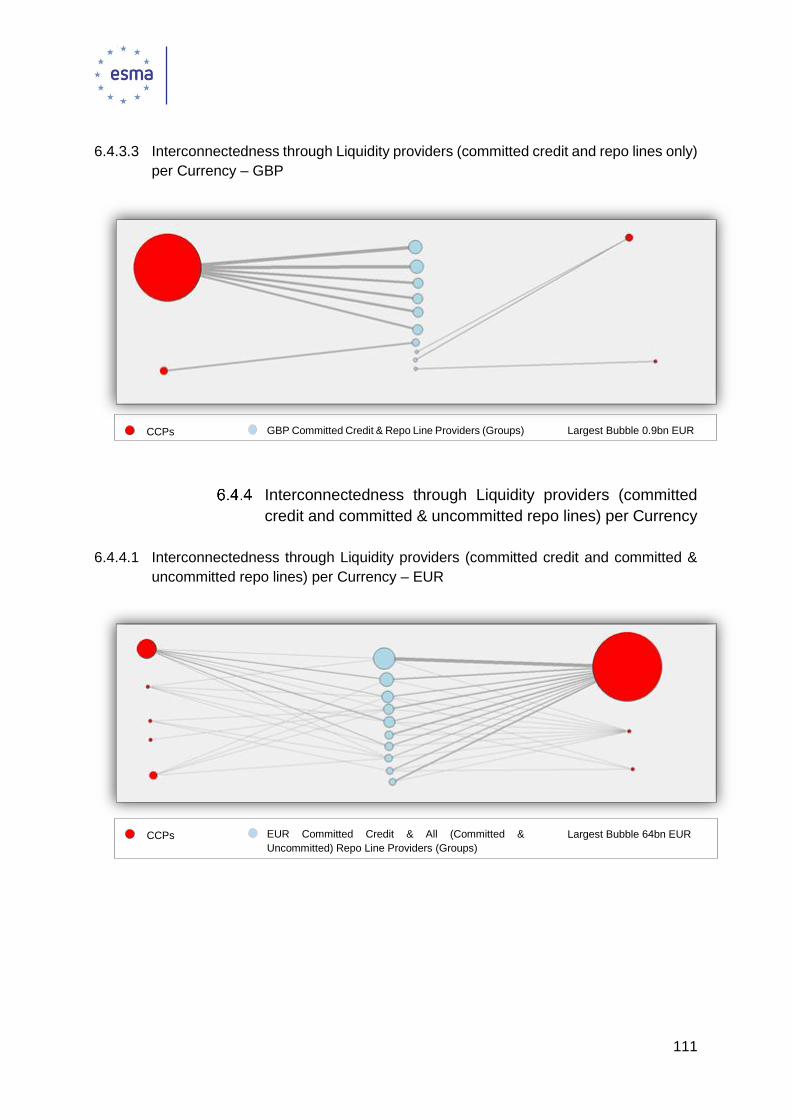
111
6.4.3.3 Interconnectedness through Liquidity providers (committed credit and repo lines only)
per Currency – GBP
Interconnectedness through Liquidity providers (committed
credit and committed & uncommitted repo lines) per Currency
6.4.4.1 Interconnectedness through Liquidity providers (committed credit and committed &
uncommitted repo lines) per Currency – EUR
CCPs GBP Committed Credit & Repo Line Providers (Groups) Largest Bubble 0.9bn EUR
CCPs EUR Committed Credit & All (Committed &
Uncommitted) Repo Line Providers (Groups)
Largest Bubble 64bn EUR

112
6.4.4.2 Interconnectedness through Liquidity providers (committed credit and committed &
uncommitted repo lines) per Currency – USD
6.4.4.3 Interconnectedness through Liquidity providers (committed credit and committed &
uncommitted repo lines) per Currency – GBP
6.5 Intraday liquidity
265. In this exercise, we model the intraday liquidity assuming that there is no further
intraday liquidity provided by the liquidity providers beyond what is available overnight.
266. In order to assess the additional impact of intraday liquidity, we assume that the
securities that were to be delivered by a defaulting clearing member are going to be
settled in a given number of settlement cycles.
CCPs USD Committed Credit & All (Committed &
Uncommitted) Repo Line Providers (Groups)
Largest Bubble 62bn EUR
CCPs GBP Committed Credit & All (Committed &
Uncommitted) Repo Line Providers (Groups)
Largest Bubble 61bn EUR

113
267. Before entering a settlement cycle, we assume that the CCP would need to have
acquired and settled the securities to be delivered. The more settlement cycles, the
fewer securities are to be bought.
268. The number of securities to be bought is inversely proportional to the number of
assumed settlement cycles. The more settlement cycles the less significant the intraday
impact will be.
269. The value of the securities to be bought during one cycle are added to the end of day
position.
270. We can see in the example below that the results are very sensitive to the
assumptions, with an impact of 272 m EUR for 10 cycles and 544 m EUR for 5 cycles.
271. At the limit, assuming an infinite number of settlement cycles, there no intraday liquidity
needs beyond the end of day needs.
FIGURE 57: COVER 2, EXAMPLE OF INTRADAY IMPACT
272. This intraday modelling only affects CCPs that deal with non-cash settled instruments.
The effect can be sizeable.
273. This topic could be explored further in future exercises.


![The Aztecs - PARKFIELDS SCHOOL429610]Who_were… · Ancient Romans 410 - 1066 Vikings and Anglo-Saxons 1066 - 1154 Norman Britain 1154 - 1485 Middle Ages 1485 - 1603 Tudors 1603 -](https://static.documents.pub/doc/80x56/60d58681106b076a4e0df625/the-aztecs-parkfields-school-429610whowere-ancient-romans-410-1066-vikings.jpg)


