214
BULLETIN 2013/2 1 2013 | 2 EURATEX BULLETIN

8/13/2019 Euratex nr 2
http://slidepdf.com/reader/full/euratex-nr-2 1/214
BULLETIN 2013/2
12013 | 2
EURATEX BULLETIN

8/13/2019 Euratex nr 2
http://slidepdf.com/reader/full/euratex-nr-2 2/214

8/13/2019 Euratex nr 2
http://slidepdf.com/reader/full/euratex-nr-2 3/214
24 rue Montoyer - Box 10
B-1000 Brussels✆ : + 32.2.285.48.87 – : +32.2.230.60.54 : [email protected] : www.euratex.eu
AN IN-DEPTH ANALYSIS OF THE EUTEXTILE AND CLOTHING
EXTERNAL TRADE 2011-2012
2013 2
EURATEX BULLETIN
3

8/13/2019 Euratex nr 2
http://slidepdf.com/reader/full/euratex-nr-2 4/214
BULLETIN 2013/2
4
› SUMMARY
TRENDS IN TEXTILE & CLOTHING EXPORTS IN 2012 5
Textile exports ............................................................................................................................................................................................6Clothing exports ........................................................................................................................................................................................7
TRENDS IN TEXTILE & CLOTHING IMPORTS IN 2012 9
Textiles imports .........................................................................................................................................................................................9Clothing imports ..................................................................................................................................................................................... 12
EU EXPORTS & IMPORTS BY SECTOR : GRAPHS & TABLES 14
EU EXTERNAL TRADE - TABLES 42
EU EXTERNAL TRADE BY PARTNER COUNTRIES 51
› FRENCH TRANSLATION OF PAGES 5-9
EVOLUTION DES EXPORTATIONSTEXTILE-HABILLEMENT EN 2012 205
Exportations textiles ............................................................................................................................................................................ 206Exportations de produits d’habillement .............................................................................................................................................207
EVOLUTIONS DES IMPORTATIONSTEXTILE-HABILLEMENT EN 2012 210
Importations textiles ............................................................................................................................................................................210Importations de produits d’habillement .............................................................................................................................................212

8/13/2019 Euratex nr 2
http://slidepdf.com/reader/full/euratex-nr-2 5/214
BULLETIN 2013/2
5
› TRENDS IN TEXTILE & CLOTHING
EXPORTS IN 2012In 2011, the +13.3% increase in value of EU exports of textiles& clothing outside the Community could in part be explainedby rising textile raw materials. Indeed, the change in exportsby volume turned out to be practically zero (-0.3%).
In 2012, runaway raw material prices came back to near nor-mal rates, restoring a climate no longer distorted by thisturbulence. Thereafter, the global economic climate deterio-rated seriously, especially in the European Union.
Analysis of the statistical data for 2012 reveals that exportsoutside the Community enabled the EU textile & clothing in-dustry to ‘survive’ in the face of a tremendously challengingenvironment within the Community. This meant that textileexports to countries where finished articles are processed be-gan to suffer the consequences of lighter retail order booksand stagnant consumer demand, even though the weatherconditions in 2012 were considered excellent. This situationresulted in the following changes: › EU-27 textile & clothing exports outside the Community in
value: +6.2% › EU-27 textile & clothing exports outside the Community in
volume: +5.6%
Compared to the previous year, it is clear that bullish raw ma-terials prices were having less of an impact and that the situa-tion had returned to normality. However, we were faced with aglobal economic environment which some compared to 2008-09. Only just back on its feet, the EU textile & clothing indus-try had to deal with yet another bout of global recession, andabove all this was concentrated in its favoured area, althoughby good fortune this came along at the same time as risingconsumption in as yet unaffected emerging nations.
The Textile & Clothing industry in Europe performed well interms of exports outside the Community, in the face of a vari-able and sometimes unfavourable dollar/euro exchange rate,as well as continuing high crude oil prices. In spite of eve-rything, the average unit price for textile & clothing exportsincreased very slightly, up +0.7% compared to 2011.
In the early days of this gloomy economic climate, consump-tion of manufactured items originating in the EU by somedeveloping countries was on the increase, which gave thefollowing results: › A 3% increase in textile exports with €21.77 bn in value (up
6% in volume) › A 10% increase in clothing exports with €20.26 bn in value(up 1.8% in volume).
During 2012, the adjustment of demand for products in thetextiles industry was slow. Businesses just had to adjust asthey went along given the sluggishness of the intra-commu-nity market, related to household budgeting that was keep-ing an eye on the gradual onset of recession (clothing beingthe first sector affected by the decline).
For the upstream stages of textile transformation, the dropin end demand was felt in their respective activities, even
though raw material prices had returned to normal levels.Therefore, spinning, the first stage of processing taken as awhole (all types of thread: cotton, worsted, carded wool, syn-thetic and artificial linen) experienced near stagnant exports,down slightly -0.6% in value and -4.5% in volume (howev-er, the average price for a kilogramme of thread in 2012 re-mained higher).
The next stage of processing, weaving, is traditionally ahighly productive and export-oriented sector and it behavedmuch the same as did spinning. Its exports were also stag-nant, down slightly -0.6% in value and -4.8% in volume.
Regarding other textile products and stages, their exportsbroadly exhibited the same behaviour i.e.: › Knitted fabrics: -3.9% in value and +1.1% in volume. › Carpets and Rugs: +5.8% in value and -0.6% in volume. › Other textile products: +6.0% in value and +4.2% in vol-
ume.
This was a far cry from the double-digit yearly change ob-served in 2011. The improvement did not last and the returnto reality was hard to bear, for both the economy and em-ployment.
In clothing, EU-27 exports benefitted from unexpected for-eign demand which enabled the EU textile & clothing indus-try to partially smooth out the lack of a domestic market.
As stated previously, clothing exports outside the Communi-ty increased in value terms. With an increase of +11.3% (+2.3%in volume), demand for woven items was much strongerthan for knitted items with +7.6% in value (+1.2% in volume).
In relative terms, demand for menswear (+13.5% in value)was higher than for womenswear (+11.5% in value). However,exports of womenswear remained prominent, representing
38.7% of total clothing exports compared to 22.6% for ex-ports of menswear.

8/13/2019 Euratex nr 2
http://slidepdf.com/reader/full/euratex-nr-2 6/214
BULLETIN 2013/2
6
Globally, demand for European textile & clothing products
increased in value in a number of markets that are more
consumers of finished products than intermediate prod-
ucts. Some nations with strong purchasing power and even
some buoyant developing countries recorded the biggest in-creases with double-digit growth for leaders such as the USA
(+15.1%), Russia (+11.6%), Japan (+15.1%), China (+12.4%), UAE
(+15.7%) and Australia (+27.3%). Only Switzerland (-1.4%) was
absent from this list.
Countries where manufactured items are widely processed
had to bear weak demand in the internal EU market. Very
often they were in decline e.g. Tunisia (-11.6%), Egypt (-1.2%)
and Morocco (-0.6%).
TEXTILE EXPORTS
Natural Fibres – EU-27 produces few natural fibres in volume
when compared to global production, but its trading activ-
ity remains significant. However, the fall in prices during 2011
had caused a fall of -16% in average unit prices, meaning
that, this year, value and volume were reversed since exports
had advanced +25.5% in value but +49.2% in volume.
Although it declined sharply (-6.2%), China was still the
biggest client, with over one third of total industry exports
(34.6% in value but 46.5% of exports in 2011). This decrease
arose out of a cut in the purchases of raw wool (-4.2%), linen
(-3.1%) and cotton (-13.1%).
The same was true for Egypt whose market share moved year
on year from 4.3% to 2.2% with a decline in natural fibre
purchases of -34.3%, attributed to wool (-28.1%) and cotton
(-37.8%).
In contrast, exports to large consumer nations such as Tur-
key (+83.9%), Indonesia (+123.4%), Pakistan (+693%) and
Malaysia (+1021%) recorded exceptional growth rates, mainly
thanks to cotton.
The question arises whether these textile fibre exports, which
are remarkable given the current economic situation, consti-
tute stocking up for future needs, and so bring prices down
at a later date.
Synthetic & artificial fibres – EU-27 exports outside Europe
benefitted from the textile materials price climate (-1.5% on
the average unit price) increasing +2.2% in value and +3.8%
in volume (+8% in value and -1.7% in volume in 2011). Three
major textile countries: Turkey (+9.3%), China (+33.2%) and
India (+26.7%) boosted their purchases. We can add to the list
Russia (+35.4%) and Bangladesh (+20.5%), whereas there was
a significant fall in exports to the USA (-10.8%), Iran (-35.6%)
and Switzerland (-19.9%).
Exports outside the Community were particularly healthy for
artificial fibre cables (+29.4% in value and +15.8% in volume)and, to a lesser degree, for discontinuous synthetic fibres
(+1.1% in value and +6.6% in volume).
We can but wonder if the previous comment regarding acqui-
sition of fibres by processing countries in the current climatemight also apply to synthetic and artificial fibres.
Thread and yarn – From this stage of processing onwards,we encountered a situation more in step with the economicsituation of the day, and indeed thread exports in value
were almost stable, just slightly down (-0.6%), whereas involume terms the change was sharply downwards (-4.5%),
thus enabling the average unit price for thread to be main-tained (+4.1% but this varied depending on the textile ma-terials used).
Exports of continuous synthetic fibre filament threads,which hold the lion’s share of this processing stage (59%)
declined slightly (-0.8% in value and -4.4% in volume).Cotton thread (9% of exports at this stage) also decreased
(-7.8% in value and -5.7% in volume). Woollen yarn (17%)and discontinuous synthetic fibres (14%) grew by +1.1% in
value (but -13% in volume) and +3.9% in value (+3.4% involume) respectively.
Among the main thread clients, Switzerland, Tunisia, Mo-rocco and Egypt showed diminished value and volume with
-7.1%, -15.7%, -10.1% and -8.1% respectively. For the others,the value increases were relatively slight and most often ac-
companied by decreases in volume, such as the USA (+6.3%),Hong Kong (+4.3%), China (+2.4%) and Russia (+1.3%). Pur-
chases of European thread remained stable in Turkey, our
principle buyer in volume terms.
Woven fabrics – This sector of textile products was again one
of the concentrations of EU-27 exports outside Europe, with28% of total textile exports. As was the case for thread in2012, its exports also fell slightly (-0.6% in value and -4.8%
in volume). As in the preceding year, all of silk, wool, cottonand discontinuous artificial or synthetic fibres posted a drop
in exports by volume, the only exception being fabrics madeusing continuous chemical fibre filaments.
In value terms, the 2011/12 change was positive for woollen
fabrics (+2.4%), discontinuous artificial or synthetic fibrefabrics (+2.5%) and continuous artificial or synthetic fibre
fabrics (+4%). Exports of special fabrics (13% of exports) alsoincreased (+3.9% in value but -7.2% in volume). For woollencloth, (17% of exports) there was greater demand for carded
wool (+5.3% in value) than for worsted (+1.2% in value).Cotton fabrics still accounted for the bulk of exports (33%)
but they declined -6.6% in value terms.
Regarding the main customers, we noted that exports tomajor purchasing nations such as Tunisia and Morocco fell
for the second year running with -14.1% (14.4% in volume)and -1.7% (-6.7% in volume) respectively, as was the case in
Switzerland with -9.1% (-12.5% in volume). By contrast, therewas marked growth in value and volume to the USA (+17.9%),China (+7.3%), Russia (+8.4%) and Japan (+14%).

8/13/2019 Euratex nr 2
http://slidepdf.com/reader/full/euratex-nr-2 7/214
BULLETIN 2013/2
7
Knitted fabrics – As a consequence of weak demand in theEU, exports of knitted fabrics, in particular to the main buy-ing countries, had a significantly lower average unit price(-4.9%), which was seen in a fall of -3.5% in value but an
increase of +1.1% in volume. Velvet type fabrics were stablewith -0.2% in value (+6.5% in volume) as were curtains andembroidery made on warp and Raschel machines with -3.4%in value (+7% in volume).Both main buyers cut back – Morocco (17% of exports) by-1.9% in value (+10.7% in volume), and Tunisia (15% of ex-ports) by -13.9% in value (-10.5% in volume). Some good newsfor the sector arose out of exports to China, +3.7% in value(+4.3% in volume).
Carpets & Rugs– For the third year running, the carpets &rugs sector continued to grow by yet again pushing its ex-
ports up +5.1% in value but -0.6% in volume, thereby ena-bling it to increase its average unit price by +5.6%. Tuftedcarpets, which make up the largest share of exports (40%),boosted their exports by +11.4% in value (+6.6% in volume),as did woven rugs and carpets (33% of exports) up +4.1%in value (-2.2% in volume). Exports of needled carpets lostground.Although the two main buyers – the USA (-4.9%) and Switzer-land (-4.6%) – fell away sharply, exports skyrocketed to Russia(+8.4%), Norway (+10.5%), Japan (+13.7%), Australia (+12.8%)and especially China (+44.9%) and Singapore (+75.2%).
Other textiles – In 2012, this sector accounted for 33.3% of to-tal EU-27 textiles imports. It is a very large sector, very export-oriented with €7.25bn in total, i.e. an increase of +6% (+4.2% involume) which is progressively replacing the woven sector forthe leading position owing to the advances and added value itcreates in particular to do with technical fabrics.There were particularly good results for sales of non-wovens- up +6.8% to €1 492m – and sales of coated textiles, tyrethread etc. – up +1.5% to €2 065m, and the latter two subsec-tors made up 49% of exports of other textiles.
This positive sales trend was particularly felt among the maintraditional buyers, i.e. the USA (13.6%), Russia (+20.5%), Nor-
way (+0%) and China (+8.8%) whereas Switzerland (-2.9%)and Turkey (-8.3%) were in decline.
Home textiles – 2012 was a year of strong demand for allhousehold goods, as evidenced by the constant growth inexports since 2010. They grew +9.8% in value (+1.8% in vol-ume). All table, bed and bathroom linens – generally madefrom cotton – found their second wind after that materialprices dropped, enabling these to post growth of +7.5% invalue (+5% in volume). These goods accounted for 60% ofhome textiles exports.
Purchase orders came particularly from Switzerland (+6.5%),Russia (+14.9%), Japan (+14%), Saudi Arabia (+14.1%) and Qa-tar (+84.7%).
EXPORTS OFCLOTHING PRODUCTS
Workwear – Overall, we can note that exports of workwearremained stable in 2012, down only slightly by -0.4% in value(+0.6% in volume), but we recall that this sector only makesup 1% of European clothing exports. Among the subcatego-ries in this sector, exports of all types of men’s workwear tak-en together decreased by -4.3% (especially overalls -37.1%),whereas in womenswear, exports increased +16.5%, notablyfor trousers (+24.7%) and bib and brace overalls (+70.7%).Within the two main buyers of these products, Norway cutback purchasing by -9.2%, while Switzerland – the biggestpurchaser – merely increased its purchases by +2.2%. Fromthe other buyers, we should add Russia (+18.8%), the USA
(+19.7%), UAE (+48.5%), Saudi Arabia (+31.6%) and in particu-lar Ukraine (+130.6%) and China (+101.2%).
Men’s clothing – Exports of men’s clothing outside the EU-27made up 22.6% of total exports for the clothing sector (21.8%in 2011), i.e. increase in value of +13.5% (+24% in 2011). Thisgrowth was realised against a harsh global environment butwhere there was still demand in consumer-hungry emergingnations.Analysing the items of menswear sold, coats (16% of men’sclothing exports) posted the strongest growth (+32.7%)whereas trousers (30% of exports and the most exportedproduct in absolute value) were up by just +13.3%. Exports of
jackets and blazers were also up +27.7%, as were suits (+11%).
From the list of main buyers of menswear, developed coun-tries very often posted double-digit growth in their purchasessuch as Russia (+12.7%), the USA (+31%), Japan (+21.2%), Aus-tralia (+128.6%), China (+20.2%) and South Korea (+21.6%),the only exception being the number one: Switzerland(+3.6%). Several developing countries also posted double-digit growth including UAE (+23.7%), Saudi Arabia (+40.7%),Kazakhstan (+27.4%) and even Lebanon (+16.8%) in spite ofits strained political and economic situation.
Women’s clothing – Similar to menswear, EU-27 exports ofwomen’s clothing outside Europe increased by +11.5% reach-ing €7.85bn (+19.4% in 2011). Since this sector makes up 39%of total clothing exports, the 2011/12 increase in absolute val-ue (€807m) is noticeably greater than that for men’s clothing(€542m).Apart from outfits (-4.2%) and suits (-6.8%), which weresomewhat snubbed by foreign clients, all other womensweararticles were in considerable demand. Dresses and skirtswere the most sought-after items (24% of womenswear ex-ports) posting growth of 16.6%, whereas the other headlineproduct – trousers – (17% of womenswear exports) grew by
+12.7%.The top honour for relative increase went to coats (11% ofwomenswear exports) on +15.8% (+27.3% in 2011). There was

8/13/2019 Euratex nr 2
http://slidepdf.com/reader/full/euratex-nr-2 8/214
BULLETIN 2013/2
8
also strong demand for blouses with +11.5% in 2012 (+19.3%in 2011).
As was the case for men’s clothing, several countries showeddouble-digit growth in their purchases of womenswear. De-mand was strongest in 2012 in the following markets: Russia+15.1% (+24% in 2011), the USA +17.4% (+14.3% in 2011), HongKong +17.7% (+32.7% in 2011) and China +50.1% (+61.6% in2011), and also in: South Korea (+29.8%), Australia (+93.9%),and even in some Persian Gulf states including UAE (+22.2%)and Saudi Arabia (+22.2%). Among the big clients, only Swit-zerland declined slightly (-2.4% compared to 2011).
Other clothing articles and accessories – This sector com-
bines a whole series of articles, trinkets and other clothingaccessories. It is certainly no lightweight. In 2012, its exportsoutside Europe made up 39% of total clothing exports by
value. Pullovers and other cardigans form the largest subcat-egory in this sector (23% in value); exports of these to thirdcountries grew by +8.9% reaching €1.78bn. T-shirts form thesecond largest subcategory in this sector (18% in value); ex-ports of t-shirts were up +3.2% at €1.38bn. Specific articles(18% of the value of the sector) also experienced exportgrowth of +18.4% at €1.42bn.In accessories, exports notably decreased for stockings andsocks (-4.1%), but increased for shawls, stoles and mantillas(+13.1%) and other bras and corsets (+3.8%).
The same countries constitute the export zones for men’sclothing as for women’s clothing. This means that exportsincreased to the USA (+26.1%), Russia (+3%), Hong Kong
(+5.6%), China (+29%), the UAE (+11.4%), and also to SouthKorea (+11.8%). The most noteworthy countries in declinewere Switzerland (-0.4%) and Turkey (-8.7%).

8/13/2019 Euratex nr 2
http://slidepdf.com/reader/full/euratex-nr-2 9/214
BULLETIN 2013/2
9
› TRENDS IN TEXTILE & CLOTHING
IMPORTS IN 2012As already mentioned in the previous section on exports,
2012 saw a significant drop in textile & clothing imports.
This was a reflection of the economic climate faced by the
European Union: since the second half of 2011, recession had
returned, businesses were closing down or making staff re-
dundant, unemployment was rising, growth was on a slow
decline in each Member State, and indeed recession was on
the way. The burden of sovereign debt and unresolved social
issues caused the Member States to retighten their budgets,
meaning that consumers had less spending power.Company order books were increasingly light and price pres-
sure was growing, which gradually caused repercussions on a
global scale for developing countries which also experienced
a decline in their activity and were awaiting orders from con-
sumer nations.
The only positive point to note from 2012 was that the weath-
er in Europe was either good or exceptionally good which was
a boon for retail.
Against this background of an EU internal market at the
height of its problems, it came as no surprise that imports
fell both in value and volume. With the bullish effect of raw
materials no longer relevant, textile imports from outsidethe Community had risen to €24.4bn, i.e. a drop of -7.7% in
value, and similar in volume, -7.4%. For their part, clothing
imports added up to €65.2bn i.e. a decline of -4.8% in value
and -11.3% in volume.
In clothing, the decline observed both in knitted articles and
woven articles was almost the same in value and volume.
In total, the textile & clothing sector experienced a -5.6%
drop in its imports from outside the Community and ended
up at €89.6bn. The bright side of this economic crisis was
that, in the end, the balance of trade deficit for textile &
clothing shrank from €55.3bn to €47.6bn, i.e. a 13.9% reduc-tion. Likewise, Import/Export coverage improved, moving
from 42% in 2011 to 47% in 2012.
Even though they were still the two main suppliers to the
EU, China and Turkey bore the full brunt of the moribund EU
internal market in 2012. This resulted in a -7.8% fall in textile
& clothing imports originating from China (and more par-
ticularly in clothing -9.4%) and a -2.6% drop from Turkey
(more so in textiles -5.5%). China’s market share was one
point lower at 39.2% (40.2% in 2011) whilst Turkey grew a
little on 13.5% (13.1% in 2011). This situation above all ben-
efitted Bangladesh 9.7% (8.5% in 2011), with India and Paki-stan in decline 7.1% and 3.2% respectively (7.9% and 3.5%
in 2011).
TEXTILE IMPORTS
Natural fibres – Although the prices of natural raw materials
had returned to “normal” values, this did not make imports
rise again. On the contrary, the lack of demand within the
textile processing chain had repercussions on imports which
fell drastically -21.3% in value (-15.6% in volume), which is a
good illustration of the effects of the EU’s economic crisis.
Wool, which made up over 68% in value of total imports
for this sector, held its place because its price was still high,
despite a slight decrease, and it did not escape the turmoil
down -14.3% in value (-21.9% in volume).
The same was true for cotton which only accounted for 22%
of total imports, it fell -41.2% in value and -19% in volume,
an imbalance that would return to normality with fresh good
harvests, but which did not spare this highly used fibre.
Linen imports continued to be minor compared to exports
since the EU is the world’s leading producer of that fibre.
Silk remained a luxury good, and very marginal. Imports of silk
also felt the backlash of the recession, albeit not as forcefully.
Looking at where these textile raw materials come from, the
leading supplier to the EU was still China on 29% of the market,
despite falling -16.1% (-29.9% in volume), and Australia came
next (13% of the market), sliding -11.6% (-15.4% in volume).
The decrease in Chinese imports was above all due to wool
which was down -17.8%. However, for this fibre, the statistics
from China include semi-processed wool and worsted, 75%
of which is sourced from Australia as greasy wool. Australia
remained a major supplier of raw wool and raw cotton. Tur-
key held onto its position as third ranked supplier (6.5% of
imports) although it had slid -21.5%. The most spectacular
decline was to Argentina’s cost, nose-diving -48.8%.
Synthetic and artificial fibres – For the same reasons as nat-
ural fibres, imports of synthetic and artificial fibres followed
suit. In all, they were down -7.5% in value (-4.3% in volume).
With imports down, only artificial fibre cables posted growth
of 19.8%, however, these make up just 8% of total imports.
Each one of the big suppliers in Asia was in decline, including
South Korea (-0.3%), Taiwan (-10.1%), Japan (-17%), Indonesia
(-21.5%), India (-9.1%) and Thailand (-28%). We could also add
the USA to this list (-6.0%). Very few nations saw higher EU
imports in 2012, but two of them were China (+3.6%) and Be-
larus (+3.4%).
Thread and yarn – When an ill wind blows, all along the
chain cowers and shakes. First raw materials, then imports

8/13/2019 Euratex nr 2
http://slidepdf.com/reader/full/euratex-nr-2 10/214
BULLETIN 2013/2
10
of thread and yarn were hit by the recession. In all, they weredown -13.4% in value and -9.1% in volume, such drops wereexplained by lower raw materials prices and weaker domesticdemand.
Imports of continuous synthetic and artificial fibre thread –the largest share for this sector on 49% of market share –were down -7.6% in value (-7.1% in volume), yet the biggestfall both in value and volume was in cotton yarn with -23.9%(-9.1% in volume), meaning it only accounted for 25% of thetotal.Imports of woollen yarn and of discontinuous synthetic andartificial fibre thread also slid back -15.6% and -14.7% respec-tively (-24.8% and -12.7% in volume).
Both of the EU-27’s main suppliers – China and Turkey – de-clined -4.9% and -4.4% in value respectively (-2.8% and
+4.8% in volume). Many other suppliers posted double-digitdeclines, including India (-24%), Indonesia (-18%), SouthKorea (-10.8%), Egypt (-23.9%), Pakistan (-45%), Thailand(-49.4%) and Malaysia (-14.6%).
Woven fabrics – The recession hit imports of woven fab-rics too. They declined -6.7% in value (-7.9% in volume) to€4 969m, i.e. 21% of total textile imports. The explanationfor this decline was the same as for thread and yarn (fallingprices, weaker domestic demand).Imports of cotton fabrics – one third of all imports for thesector – slid the furthest in value (-16.6%) and in volume(-11.6%). Silk and woollen fabrics managed to curtail the de-
cline with -7.3% and -4.1% respectively. And as regards syn-thetic and artificial fibre fabrics, continuous filament fabricsbucked the trend and increased +9%, however, those fabricsmade using discontinuous fibres fell by -10.9%.
Imports of special fabrics continued their steady advance, up+2.9%.
China was still the main EU-27 supplier with 36% marketshare in spite of a dip of 5.6% in import value (-6.3% in vol-ume), next came Turkey (19% market share) down -0.6% invalue and -1% in volume. Of the top ten nations, Pakistan(10% market share) fell hardest with -20% in value and -12.1%in volume.
Knitted fabrics – Unlike the other textile sectors, imports ofknitted fabrics (5% of all textile imports) showed growth of
+5.1% in value and +7% in volume, reaching €1 172m.
Turkey with 39% of total knitted fabric imports is the mainsupplier, advancing +2.4% in value (+14.7% in volume). Nextwas China (31% of the sector total), up +4.2% (+4% in vol-ume) and then South Korea (15% of the sector total) followedthe trend up +30.1% in value (+19.2% in volume).
Carpets and Rugs – In the EU, the home improvement crazealso suffered the vagaries of the recession and the construc-tion sector was idling, or at a standstill. In these conditions,imports of carpets and rugs dipped -4.7% in value (-7% involume). Such a decrease was largely attributable to woven

8/13/2019 Euratex nr 2
http://slidepdf.com/reader/full/euratex-nr-2 11/214
BULLETIN 2013/2
11
carpets and rugs (-10.8%), which are more expensive thantufted carpets and rugs (+7.3%).
India remained the EU-27’s main supplier with 26% of mar-ket share, however, imports were down for the second yearrunning, by -17.1% (-5.2% in 2011), and following on its heelswas Turkey (22% of market share) advancing +6.4% (+20.3%in 2011). China (20% of market share) was next, up +5.8%,whereas Egypt (9% of market share) beset with social issues
tumbled -11.7%.
Other textiles - With 25.2% of total EU textile imports, thisheavyweight sector held its value at +0.8% on €6 156m, if notits volume (-3.7%).These imports mainly involve three product categories i.e.: › Felt and non-wovens (20% of the sector)
+4.5% › Coated textiles (19% of this sector)
+0.1% › Manufactured textile articles (47% of total in this sector)
+0.4%
China with 41% market share in this sector was still the mainEU-27 supplier and advanced by +4.4%. The same was true
for the USA (12% market share), up +2.4%. By contrast, Turkey(9% market share) slipped back -2.7%.
Home textiles – As was the case for rugs and carpets, hometextile goods also experienced a fall in imports of -12.2% invalue to €4 506m (-13% in volume). This sector still accountedfor 19% of total EU textile imports.This fall in imports was seen across all products making upthe sector, i.e.:
› Bed linen -18.8% › Bathroom linens -10.4% › Table linens -10.6% › Curtains -4.6% › Other furnishings -8.3%
China, with 35% market share, was still the main EU-27 sup-plier, in spite of a fall of -3.4% in value (-12.2% in volume).Pakistan (19% market share), Turkey (16% market share), andIndia (13% market share) were the other three biggest suppli-ers with -16.3%, 19.2% and -18.5% in value respectively (but
declined in volume).Note that among the other suppliers, there was a rapid rise inimports originating from Morocco up +51.2% (+171% in 2011).

8/13/2019 Euratex nr 2
http://slidepdf.com/reader/full/euratex-nr-2 12/214
BULLETIN 2013/2
12
IMPORTS OFCLOTHING PRODUCTS
Workwear - EU-27 imports of workwear declined significantlyin 2012, down -13.9% in value. It should be noted though thatthis sector carries less than 2% of total clothing imports.All of the products that make up this sector declined both invalue and in volume.
With 31% market share (37% in 2011), China was the main EU-27 supplier and showed a drop of -24.7% in value (+32.7% in2011). Tunisia (17% market share) and Morocco (8% marketshare), the two other main suppliers, were also down -6.5%and -13% respectively.
Men’s clothing – In 2012, this sector accounted for 25.1% ofall EU-27 clothing imports. Its imports decreased by -3.7% to€16.3bn. With the exception of imports of jackets and blaz-
ers (7% of the menswear market) which grew +3.1%, all othercategories in this sector were in decline. Coats (14% of thesector) decreased by -9%, trousers (39% of the sector) by-1.4%, shirts (24% of the sector) by -2.9% and underwear (8%
of the sector) by -5.8%.
In the supplier rankings, China with 37% market share (40%in 2011) was still by far the main supplier despite a severe dropof -12.5%. By contrast, Bangladesh secured second place withan increase of +17.5% (+40.3% in 2011), in other words, morethan 15% of the market. Turkey, with modest growth of +2.7%and 10% market share, was still the third ranked supplier.Amongst the other countries, there was growth from Viet-nam (+5.9%) and especially Cambodia +83.6% (+74.3% in2011).
Women’s clothing - In 2012, this sector still accounted for34.8% of all EU-27 clothing imports. Its imports decreasedby -4% to €22.7bn. As was the case for menswear, only jack-

8/13/2019 Euratex nr 2
http://slidepdf.com/reader/full/euratex-nr-2 13/214
BULLETIN 2013/2
13
ets (6% of womenswear) recorded higher imports, up +9.2%.Every other category of womenswear posted diminishing im-ports as shown below: › Coats (15% of womenswear imports) : -9.3% › Dresses & skirts (20% of womenswear imports) : -7.8%
› Blouses (15% of womenswear imports) : -4.0% › Underwear (9% of womenswear imports) : -7.3%
Only trouser imports (30% of womenswear imports) re-mained unchanged.
In the rankings of the main suppliers of women’s clothing, asalways China lead with 44% market share (45% in 2011) andimports fell sharply, down -7.3%. Turkey on 13% market shareheld onto second place also with just a modest -2.1% slip, fol-lowed by India (8% market share) which fell back -17.3%. Witha +22.8% increase in purchases (+32.2% in 2011), Bangladesh(8% market share) superseded Morocco (5% market share)
for fourth place with -8.4%. Among the other suppliers, therewas double-digit import growth from the USA (+32.6%),Hong Kong (+16.8%) and Cambodia (+53.2%).
Other articles of clothing & accessories – Products in thissector accounted for 40% of total clothing imports. In 2012,its imports decreased by -6.1% to €26bn compared to a riseof +6.9% in 2011.This sector was also affected by the recession in Europe and
nearly all of its constituent categories recorded a drop in im-ports: › Pullovers and cardigans (33% of sector imports) : -7.1% › T-shirts (28% of sector imports) : -3.6%
› Baby articles (8% of sector imports) : -8.3% › Socks, tights and stockings (6.5% of sector imports) : -7.7% › Bras and corsets (6.3% of sector imports) : -1.2%
In the main supplier rankings, China was top of the list with43% market share (45% in 2011) and imports down by -9.5%.In second place was Bangladesh which cornered over 15% ofthe market but declined slightly by -1.2%. Turkey accountedfor over 13% of the sector and saw its EU imports fall by -2.3%.

8/13/2019 Euratex nr 2
http://slidepdf.com/reader/full/euratex-nr-2 14/214
BULLETIN 2013/2
14
› GRAPHS AND TABLES
EXTRA-EU IMPORTS AND EXPORTS, BY SECTOR 16
EU NATURAL FIBERS’MAIN SUPPLIERS & CUSTOMERS 18
EU MAN-MADE FIBRES’MAIN SUPPLIERS & CUSTOMERS 20
EU YARNS & THREADS’ MAIN SUPPLIERS & CUSTOMERS 22
EU WOVEN FABRICS’MAIN SUPPLIERS & CUSTOMERS 24
EU KNITTED FABRICS’MAIN SUPPLIERS & CUSTOMERS 26
EU CARPETS’ MAIN SUPPLIERS & CUSTOMERS 28
EU OTHER TEXTILES’MAIN SUPPLIERS & CUSTOMERS 30
EU HOME TEXTILES’MAIN SUPPLIERS & CUSTOMERS 32
EU OCCUPATIONALS’ MAIN SUPPLIERS & CUSTOMERS 34
EU MEN CLOTHING’S MAIN SUPPLIERS & CUSTOMERS 36
EU WOMEN CLOTHING’S MAIN SUPPLIERS & CUSTOMERS 38
EU OTHER GARMENTS’ MAIN SUPPLIERS & CUSTOMERS 40

8/13/2019 Euratex nr 2
http://slidepdf.com/reader/full/euratex-nr-2 15/214
BULLETIN 2013/2
15
› TRADE SECTORS 2012
Imports - EXTRA-EU27TEXTILES, Textiles HS50-60 + 63
Year To Date: January - December
PartnerCountry
Unit2011 2012 2012/2011 Market share 2012
EUR Quantity EUR Quantity EUR Quantity EUR Quantity
World T 68.935.306.880 65.341.859.610 -5,2%
EXTRA EU27 T 26.467.038.470 6.656.693 24.440.790.900 6.165.561 -7,7% -7,4% 100,0% 100,0%
China T 7.984.559.990 1.903.391 7.828.504.940 1.814.229 -2,0% -4,7% 32,0% 29,4%
Turkey T 4.001.259.740 841.733 3.780.436.220 867.777 -5,5% 3,1% 15,5% 14,1%
India T 2.761.151.390 772.273 2.306.563.810 693.216 -16,5% -10,2% 9,4% 11,2%
Pakistan T 1.990.573.180 424.477 1.578.168.410 367.367 -20,7% -13,5% 6,5% 6,0%
United States T 1.236.735.120 266.747 1.203.676.590 226.472 -2,7% -15,1% 4,9% 3,7%
Korea South T 883.760.580 310.208 943.195.660 303.318 6,7% -2,2% 3,9% 4,9%
Switzerland T 917.140.100 125.546 858.902.590 117.257 -6,3% -6,6% 3,5% 1,9%Japan T 673.484.550 90.144 634.715.870 74.081 -5,8% -17,8% 2,6% 1,2%
Taiwan T 513.600.160 227.130 471.549.130 203.982 -8,2% -10,2% 1,9% 3,3%
Egypt T 470.234.040 111.133 428.001.320 97.766 -9,0% -12,0% 1,8% 1,6%
Indonesia T 472.489.220 187.497 408.105.070 165.408 -13,6% -11,8% 1,7% 2,7%
Bangladesh T 389.837.250 115.522 311.968.510 98.787 -20,0% -14,5% 1,3% 1,6%
Tunisia T 304.364.290 53.003 296.591.970 54.411 -2,6% 2,7% 1,2% 0,9%
Thailand T 354.142.180 100.125 280.800.060 80.932 -20,7% -19,2% 1,1% 1,3%
Vietnam T 234.400.540 85.369 257.319.340 91.415 9,8% 7,1% 1,1% 1,5%
Israel T 253.288.100 62.504 235.184.050 58.469 -7,1% -6,5% 1,0% 0,9%
Australia T 261.384.480 38.364 232.318.000 32.922 -11,1% -14,2% 1,0% 0,5%
Morocco T 186.025.640 29.025 176.962.080 27.932 -4,9% -3,8% 0,7% 0,5%
Malaysia T 187.499.380 121.987 141.354.810 92.060 -24,6% -24,5% 0,6% 1,5%
South Africa T 156.165.940 29.244 130.206.740 24.774 -16,6% -15,3% 0,5% 0,4%
Exports - EXTRA EU27TEXTILES, Textiles HS50-60 + 63
Year To Date: January - December
ClientCountry
Unit2011 2012 2012/2011 Market share 2012
EUR Quantity EUR Quantity EUR Quantity EUR Quantity
World T 66.280.794.080 65.079.650.470 -1,8%
EXTRA EU27 T 21.157.710.440 4.348.116 21.780.995.020 4.611.543 2,9% 6,1% 100,0% 100,0%
United States T 2.113.875.530 318.367 2.279.663.180 324.015 7,8% 1,8% 10,5% 7,0%
Turkey T 1.742.480.970 383.328 1.825.109.710 486.267 4,7% 26,9% 8,4% 10,5%
China T 1.634.160.940 393.889 1.719.434.950 416.341 5,2% 5,7% 7,9% 9,0%
Switzerland T 1.466.599.970 187.142 1.407.026.800 175.427 -4,1% -6,3% 6,5% 3,8%
Russia T 1.126.910.470 205.520 1.292.154.090 233.537 14,7% 13,6% 5,9% 5,1%
Morocco T 1.252.471.720 155.598 1.241.106.000 158.553 -0,9% 1,9% 5,7% 3,4%
Tunisia T 1.370.742.780 220.291 1.211.766.420 210.472 -11,6% -4,5% 5,6% 4,6%
Hong Kong T 694.320.240 44.045 674.439.660 39.283 -2,9% -10,8% 3,1% 0,9%
Japan T 541.736.150 54.138 599.492.490 60.835 10,7% 12,4% 2,8% 1,3%
Ukraine T 589.072.750 151.651 591.033.410 159.502 0,3% 5,2% 2,7% 3,5%
Norway T 482.561.050 73.990 502.603.260 74.760 4,2% 1,0% 2,3% 1,6%
Korea South T 378.910.590 59.601 357.859.430 58.185 -5,6% -2,4% 1,6% 1,3%
Mexico T 322.682.020 52.702 332.052.610 54.960 2,9% 4,3% 1,5% 1,2%
India T 351.572.560 170.714 324.836.100 170.260 -7,6% -0,3% 1,5% 3,7%
Brazil T 280.537.880 53.273 307.154.000 57.865 9,5% 8,6% 1,4% 1,3%
Croatia T 326.336.150 53.015 299.376.490 52.875 -8,3% -0,3% 1,4% 1,1%
Canada T 316.163.950 47.334 296.412.710 45.647 -6,2% -3,6% 1,4% 1,0%
Macedonia T 293.026.240 24.043 293.662.860 23.250 0,2% -3,3% 1,3% 0,5%
Australia T 274.997.420 35.871 291.766.780 36.177 6,1% 0,9% 1,3% 0,8%
Serbia T 234.477.750 41.341 252.331.660 43.016 7,6% 4,1% 1,2% 0,9%

8/13/2019 Euratex nr 2
http://slidepdf.com/reader/full/euratex-nr-2 16/214
BULLETIN 2013/2
16
0
5.000.000
10.000.000
15.000.000
20.000.000
25.000.000
30.000.000
EX TRA -EU imports, by sector 2011-2012 (000 Euros)
2011
2012
0
1.000.000
2.000.000
3.000.000
4.000.000
5.000.000
6.000.000
7.000.000
8.000.000
EXTRA-EU exports by sector
2011-2012 (000 Euros)
2011
2012

8/13/2019 Euratex nr 2
http://slidepdf.com/reader/full/euratex-nr-2 17/214
BULLETIN 2013/2
17
Imports - EXTRA-EU27CLOTHING, HS 61 & 62
Year To Date: January - December
SupplyingCountry
Unit2011 2012 2012/2011 Market share 2012
EUR Quantity EUR Quantity EUR Quantity EUR QuantityWorld T 123.946.055.330 120.165.611.740 -3,1%
EXTRA EU27 T 68.446.771.290 4.347.423 65.187.369.660 3.854.650 -4,8% -11,3% 100,0% 100,0%
China T 30.052.650.690 2.184.118 27.234.102.880 1.783.208 -9,4% -18,4% 41,8% 46,3%
Bangladesh T 7.589.551.260 645.650 8.249.774.500 664.040 8,7% 2,8% 12,7% 17,2%
Turkey T 8.310.931.640 375.179 8.211.952.890 364.220 -1,2% -2,9% 12,6% 9,4%
India T 4.653.708.800 220.727 3.985.262.780 185.686 -14,4% -15,9% 6,1% 4,8%
Tunisia T 2.412.767.900 85.885 2.109.113.290 74.537 -12,6% -13,2% 3,2% 1,9%
Morocco T 2.196.422.340 101.537 2.039.113.850 91.125 -7,2% -10,3% 3,1% 2,4%
Vietnam T 1.687.764.310 100.855 1.732.046.100 94.482 2,6% -6,3% 2,7% 2,5%
Sri Lanka T 1.298.189.460 74.142 1.366.824.520 73.207 5,3% -1,3% 2,1% 1,9%
Pakistan T 1.272.026.140 126.487 1.248.141.150 117.890 -1,9% -6,8% 1,9% 3,1%
Cambodia T 922.320.980 63.048 1.219.474.760 75.883 32,2% 20,4% 1,9% 2,0%
Indonesia T 1.253.709.090 67.746 1.191.387.540 58.804 -5,0% -13,2% 1,8% 1,5%
Thailand T 692.560.200 31.579 616.816.590 25.507 -10,9% -19,2% 0,9% 0,7%
Switzerland T 536.224.600 4.207 527.753.570 4.092 -1,6% -2,7% 0,8% 0,1%
Hong Kong T 435.436.270 17.129 512.671.880 19.620 17,7% 14,5% 0,8% 0,5%
United States T 366.934.130 9.957 465.002.690 13.102 26,7% 31,6% 0,7% 0,3%
Macedonia T 469.401.550 18.768 450.534.830 17.431 -4,0% -7,1% 0,7% 0,5%
Egypt T 457.019.280 25.547 382.678.790 20.444 -16,3% -20,0% 0,6% 0,5%
Croatia T 360.287.730 10.125 339.392.270 9.484 -5,8% -6,3% 0,5% 0,2%
Ukraine T 316.326.750 14.442 293.016.350 12.130 -7,4% -16,0% 0,4% 0,3%
Mauritius T 303.518.840 12.395 282.611.480 10.993 -6,9% -11,3% 0,4% 0,3%
Exports - EXTRA EU27CLOTHING, HS 61 & 62
Year To Date: January - December
ClientCountry
Unit2011 2012 2012/2011 Market share 2012
EUR Quantity EUR Quantity EUR Quantity EUR Quantity
World T 80.566.035.600 81.804.735.750 1,5%
EXTRA EU27 T 18.419.040.740 369.972 20.270.519.990 376.642 10,1% 1,8% 100,0% 100,0%
Switzerland T 3.296.190.090 45.915 3.291.157.570 44.133 -0,2% -3,9% 16,2% 11,7%
Russia T 2.731.416.270 47.482 3.017.121.840 49.416 10,5% 4,1% 14,9% 13,1%
United States T 1.799.100.980 17.613 2.233.466.570 20.865 24,1% 18,5% 11,0% 5,5%
Japan T 1.097.828.560 8.718 1.289.513.030 9.825 17,5% 12,7% 6,4% 2,6%
Hong Kong T 1.154.670.890 7.348 1.232.604.750 7.396 6,7% 0,7% 6,1% 2,0%
Norway T 724.181.760 16.082 763.562.040 15.047 5,4% -6,4% 3,8% 4,0%
China T 568.067.030 7.424 757.083.080 8.881 33,3% 19,6% 3,7% 2,4%
Turkey T 773.041.060 23.957 740.304.840 21.064 -4,2% -12,1% 3,7% 5,6%
United Arab
Emirates T 456.117.950 7.651 539.684.700 10.069 18,3% 31,6% 2,7% 2,7%Ukraine T 485.371.630 9.605 525.330.360 9.519 8,2% -0,9% 2,6% 2,5%
Korea South T 327.854.820 2.899 395.583.300 2.931 20,7% 1,1% 2,0% 0,8%
Saudi Arabia T 309.852.440 5.270 372.990.150 6.698 20,4% 27,1% 1,8% 1,8%
Canada T 319.875.220 4.527 343.601.810 4.280 7,4% -5,5% 1,7% 1,1%
Australia T 215.507.230 3.327 333.729.630 4.279 54,9% 28,6% 1,6% 1,1%
Mexico T 321.516.930 7.646 332.658.150 8.008 3,5% 4,7% 1,6% 2,1%
Croatia T 338.661.780 13.798 302.217.980 13.566 -10,8% -1,7% 1,5% 3,6%
Tunisia T 268.289.870 13.980 240.076.190 11.775 -10,5% -15,8% 1,2% 3,1%
Serbia T 185.139.840 11.010 187.548.450 9.624 1,3% -12,6% 0,9% 2,6%
Morocco T 180.883.130 11.512 184.792.120 10.724 2,2% -6,8% 0,9% 2,8%
Lebanon T 179.610.300 2.725 183.377.170 2.772 2,1% 1,7% 0,9% 0,7%

8/13/2019 Euratex nr 2
http://slidepdf.com/reader/full/euratex-nr-2 18/214
BULLETIN 2013/2
18
0
100.000.000
200.000.000
300.000.000
400.000.000
500.000.000
600.000.000
EU natural fibres' main suppliers
2011-2012 (Euros)
2011
2012
0
25.000.000
50.000.000
75.000.000
100.000.000
125.000.000
150.000.000
175.000.000
200.000.000
225.000.000
250.000.000
275.000.000
300.000.000
325.000.000
350.000.000
EU natural fibres' main customers2011-2012 (Euros)
2011
2012

8/13/2019 Euratex nr 2
http://slidepdf.com/reader/full/euratex-nr-2 19/214
BULLETIN 2013/2
19
Imports - EXTRA-EU27Natural fibers
Year To Date: January - December
SupplyingCountry
Unit2011 2012 2012/2011 Market share 2012
EUR Quantity EUR Quantity EUR Quantity EUR QuantityWorld T 3.432.950.560 2.792.719.420 -18,6%
EXTRA EU27 T 2.167.978.640 643.335 1.706.269.490 542.881 -21,3% -15,6% 100,0% 100,0%
China T 585.772.260 41.839 491.720.200 29.311 -16,1% -29,9% 28,8% 5,4%
Australia T 253.618.710 37.222 224.135.820 31.499 -11,6% -15,4% 13,1% 5,8%
Turkey T 141.328.250 69.374 110.934.560 77.005 -21,5% 11,0% 6,5% 14,2%
New Zealand T 90.418.920 22.529 89.055.860 21.710 -1,5% -3,6% 5,2% 4,0%
South Africa T 109.246.540 16.335 85.354.220 12.804 -21,9% -21,6% 5,0% 2,4%
India T 85.312.120 68.740 75.656.980 77.222 -11,3% 12,3% 4,4% 14,2%
Argentina T 115.351.910 22.095 59.071.700 9.435 -48,8% -57,3% 3,5% 1,7%
Uruguay T 64.781.010 11.444 53.490.560 7.719 -17,4% -32,5% 3,1% 1,4%
Pakistan T 87.498.360 41.571 47.097.040 33.915 -46,2% -18,4% 2,8% 6,2%
Brazil T 42.951.030 19.091 39.742.620 19.709 -7,5% 3,2% 2,3% 3,6%
Egypt T 24.807.250 9.692 34.834.930 8.128 40,4% -16,1% 2,0% 1,5%
United States T 66.966.110 26.657 34.570.860 13.984 -48,4% -47,5% 2,0% 2,6%
Mongolia T 36.207.780 567 34.369.800 517 -5,1% -8,8% 2,0% 0,1%
Peru T 21.667.210 2.974 19.260.740 2.193 -11,1% -26,3% 1,1% 0,4%
Sri Lanka T 18.494.100 45.162 18.962.490 42.051 2,5% -6,9% 1,1% 7,7%
Israel T 7.498.770 3.262 14.638.180 5.488 95,2% 68,2% 0,9% 1,0%
Tajikistan T 16.222.610 5.549 10.986.900 6.724 -32,3% 21,2% 0,6% 1,2%
Chile T 10.054.510 2.008 10.960.510 1.663 9,0% -17,2% 0,6% 0,3%
Kazakhstan T 22.729.340 8.427 10.051.990 5.842 -55,8% -30,7% 0,6% 1,1%
Philippines T 10.733.660 10.102 9.764.110 7.966 -9,0% -21,1% 0,6% 1,5%
Exports - EXTRA EU27Natural fibers
Year To Date: January - December
ClientCountry
Unit2011 2012 2012/2011 Market share 2012
EUR Quantity EUR Quantity EUR Quantity EUR Quantity
World T 1.950.372.620 1.970.005.280 1,0%
EXTRA EU27 T 745.979.500 386.254 941.619.760 577.002 26,2% 49,4% 100,0% 100,0%
China T 347.435.600 196.829 325.919.310 204.680 -6,2% 4,0% 34,6% 35,5%
Turkey T 115.276.810 61.858 211.938.940 141.290 83,9% 128,4% 22,5% 24,5%
Indonesia T 26.419.920 16.117 59.021.530 41.135 123,4% 155,2% 6,3% 7,1%
Pakistan T 5.188.570 3.051 41.160.210 30.919 693,3% 913,4% 4,4% 5,4%
Tunisia T 19.870.850 7.809 25.445.230 11.710 28,1% 50,0% 2,7% 2,0%
India T 20.010.070 13.297 22.311.800 16.010 11,5% 20,4% 2,4% 2,8%
Egypt T 32.102.960 11.460 21.097.800 10.792 -34,3% -5,8% 2,2% 1,9%
Japan T 11.679.370 5.189 20.614.650 11.512 76,5% 121,9% 2,2% 2,0%
Malaysia T 1.798.050 1.016 20.158.780 15.695 1021,1% 1444,8% 2,1% 2,7%
Bangladesh T 3.578.600 1.521 16.413.990 10.488 358,7% 589,5% 1,7% 1,8%
Morocco T 16.493.020 7.547 13.256.570 6.827 -19,6% -9,5% 1,4% 1,2%
United States T 9.483.190 3.620 12.584.240 3.908 32,7% 8,0% 1,3% 0,7%
Switzerland T 13.200.520 5.771 12.211.550 7.543 -7,5% 30,7% 1,3% 1,3%
Hong Kong T 6.854.510 4.376 9.181.180 6.983 33,9% 59,6% 1,0% 1,2%
Vietnam T 2.828.930 2.026 9.000.330 6.823 218,2% 236,8% 1,0% 1,2%
Taiwan T 5.062.580 3.548 7.028.160 5.234 38,8% 47,5% 0,7% 0,9%
Bosnia &Herzegovina
T 5.801.710 3.023 6.257.910 2.966 7,9% -1,9% 0,7% 0,5%
Korea South T 4.665.660 888 4.761.600 1.125 2,1% 26,7% 0,5% 0,2%
Canada T 3.421.850 656 4.547.640 1.087 32,9% 65,7% 0,5% 0,2%
Russia T 3.465.230 3.101 4.024.350 3.996 16,1% 28,9% 0,4% 0,7%

8/13/2019 Euratex nr 2
http://slidepdf.com/reader/full/euratex-nr-2 20/214
BULLETIN 2013/2
20
0
25.000.000
50.000.000
75.000.000
100.000.000
125.000.000
150.000.000
175.000.000
200.000.000
225.000.000
250.000.000
EU man-made fibres' main suppliers 2010-2011 (Euro)
2011
2012
0
25.000.000
50.000.000
75.000.000
100.000.000
125.000.000
150.000.000
175.000.000
200.000.000
EU man-made fibres' main customers2010-2011 (Euro)
2011
2012

8/13/2019 Euratex nr 2
http://slidepdf.com/reader/full/euratex-nr-2 21/214
BULLETIN 2013/2
21
Imports - EXTRA-EU27Man-made fibers
Year To Date: January - December
SupplyingCountry
Unit2011 2012 2012/2011 Market share 2012
EUR Quantity EUR Quantity EUR Quantity EUR QuantityWorld T 3.280.188.470 3.051.502.290 -7,0%
EXTRA EU27 T 1.165.594.150 674.815 1.078.643.230 646.114 -7,5% -4,3% 100,0% 100,0%
Korea South T 235.933.730 170.245 235.109.400 168.963 -0,3% -0,8% 21,8% 26,2%
Taiwan T 165.110.860 112.321 148.463.090 103.614 -10,1% -7,8% 13,8% 16,0%
Japan T 139.252.120 36.584 115.544.200 28.496 -17,0% -22,1% 10,7% 4,4%
United States T 116.420.270 49.455 109.396.000 37.780 -6,0% -23,6% 10,1% 5,8%
India T 103.354.160 72.089 93.970.360 73.687 -9,1% 2,2% 8,7% 11,4%
Turkey T 88.949.440 50.668 88.419.210 56.578 -0,6% 11,7% 8,2% 8,8%
China T 73.507.130 31.753 76.156.780 37.199 3,6% 17,2% 7,1% 5,8%
Indonesia T 59.095.470 40.308 46.403.260 33.582 -21,5% -16,7% 4,3% 5,2%
Thailand T 46.419.770 29.362 33.444.770 23.609 -28,0% -19,6% 3,1% 3,7%
Vietnam T 31.342.810 26.351 31.894.700 26.936 1,8% 2,2% 3,0% 4,2%
Belarus T 24.083.380 14.736 24.905.360 18.025 3,4% 22,3% 2,3% 2,8%
Switzerland T 26.711.670 6.017 23.214.600 4.967 -13,1% -17,5% 2,2% 0,8%
Mexico T 7.358.110 2.666 14.072.950 4.131 91,3% 55,0% 1,3% 0,6%
Malaysia T 11.700.290 8.339 9.232.720 7.014 -21,1% -15,9% 0,9% 1,1%
Nigeria T 5.772.590 4.716 7.104.320 6.015 23,1% 27,5% 0,7% 0,9%
Iran T 4.182.820 2.827 2.645.700 2.036 -36,7% -28,0% 0,2% 0,3%
Morocco T 3.945.140 3.813 2.547.630 2.092 -35,4% -45,1% 0,2% 0,3%
Lebanon T 2.276.190 1.998 2.289.360 1.888 0,6% -5,5% 0,2% 0,3%
Brazil T 3.069.860 1.337 2.183.650 1.232 -28,9% -7,9% 0,2% 0,2%
Russia T 4.081.310 1.431 2.021.030 934 -50,5% -34,7% 0,2% 0,1%
Exports - EXTRA EU27Man-made fibers
Year To Date: January - December
ClientCountry
Unit2011 2012 2012/2011 Market share 2012
EUR Quantity EUR Quantity EUR Quantity EUR Quantity
World T 2.522.920.880 2.449.772.910 -2,9%
EXTRA EU27 T 865.450.040 352.401 884.720.360 365.645 2,2% 3,8% 100,0% 100,0%
Turkey T 180.081.380 77.663 196.875.110 88.458 9,3% 13,9% 22,3% 24,2%
United States T 145.611.230 46.555 129.930.780 45.986 -10,8% -1,2% 14,7% 12,6%
China T 52.281.080 21.081 69.575.110 27.800 33,1% 31,9% 7,9% 7,6%
Iran T 83.615.470 35.662 53.888.030 24.350 -35,6% -31,7% 6,1% 6,7%
India T 28.801.580 17.813 36.505.480 22.204 26,7% 24,7% 4,1% 6,1%
Mexico T 28.526.940 13.039 29.834.060 14.212 4,6% 9,0% 3,4% 3,9%
Morocco T 26.974.220 12.639 28.175.510 13.356 4,5% 5,7% 3,2% 3,7%
Russia T 20.487.100 7.439 27.740.450 9.247 35,4% 24,3% 3,1% 2,5%
Egypt T 21.758.840 3.169 25.958.060 2.810 19,3% -11,3% 2,9% 0,8%
Canada T 20.534.070 8.377 23.367.870 10.150 13,8% 21,2% 2,6% 2,8%
Switzerland T 23.478.650 7.537 18.804.270 5.734 -19,9% -23,9% 2,1% 1,6%
Israel T 14.265.110 7.272 16.193.340 8.534 13,5% 17,4% 1,8% 2,3%
Brazil T 21.930.330 8.980 15.708.040 6.695 -28,4% -25,4% 1,8% 1,8%
Bangladesh T 11.717.260 5.975 14.113.640 7.520 20,5% 25,9% 1,6% 2,1%
Syria T 20.967.870 9.304 13.913.020 6.457 -33,6% -30,6% 1,6% 1,8%
Serbia T 5.295.410 1.782 13.406.470 3.678 153,2% 106,4% 1,5% 1,0%
Ukraine T 18.609.310 6.384 12.202.580 3.883 -34,4% -39,2% 1,4% 1,1%
Algeria T 7.567.330 2.752 11.162.900 3.495 47,5% 27,0% 1,3% 1,0%
Japan T 11.161.010 1.858 10.528.010 1.680 -5,7% -9,6% 1,2% 0,5%
Peru T 8.113.360 3.221 10.202.290 3.667 25,7% 13,8% 1,2% 1,0%

8/13/2019 Euratex nr 2
http://slidepdf.com/reader/full/euratex-nr-2 22/214
BULLETIN 2013/2
22
0
100.000.000
200.000.000
300.000.000
400.000.000
500.000.000
600.000.000
700.000.000
800.000.000
900.000.000
EU yarns & threads' main suppliers 2011-2012 (Euros)
2011
2012
0
50.000.000
100.000.000
150.000.000
200.000.000
250.000.000
300.000.000
EU yarns & threads' main customers2011-2012 (Euros)
2011
2012

8/13/2019 Euratex nr 2
http://slidepdf.com/reader/full/euratex-nr-2 23/214
BULLETIN 2013/2
23
Imports - EXTRA-EU27Yarns and threads
Year To Date: January - December
SupplyingCountry
Unit2011 2012 2012/2011 Market share 2012
EUR Quantity EUR Quantity EUR Quantity EUR QuantityWorld T 10.256.936.770 9.121.467.100 -11,1%
EXTRA EU27 T 4.120.648.470 1.189.977 3.566.683.680 1.082.021 -13,4% -9,1% 100,0% 100,0%
China T 818.921.570 247.641 778.659.210 240.657 -4,9% -2,8% 21,8% 22,2%
Turkey T 699.826.020 190.278 669.108.560 199.330 -4,4% 4,8% 18,8% 18,4%
India T 648.862.680 196.703 493.367.850 166.343 -24,0% -15,4% 13,8% 15,4%
Indonesia T 232.675.600 93.544 190.700.140 82.562 -18,0% -11,7% 5,3% 7,6%
Japan T 209.002.240 27.829 189.446.060 23.916 -9,4% -14,1% 5,3% 2,2%
United States T 166.260.170 30.751 151.106.930 25.854 -9,1% -15,9% 4,2% 2,4%
Korea South T 167.560.730 62.643 149.480.130 55.173 -10,8% -11,9% 4,2% 5,1%
Egypt T 146.921.860 24.584 111.796.950 20.473 -23,9% -16,7% 3,1% 1,9%
Switzerland T 115.711.450 20.908 98.550.370 15.547 -14,8% -25,6% 2,8% 1,4%
Pakistan T 159.407.050 42.355 87.663.980 27.957 -45,0% -34,0% 2,5% 2,6%
Taiwan T 85.001.090 40.337 75.493.100 37.833 -11,2% -6,2% 2,1% 3,5%
Thailand T 101.808.540 30.301 51.498.420 20.584 -49,4% -32,1% 1,4% 1,9%
Belarus T 45.468.890 15.917 45.806.930 16.880 0,7% 6,1% 1,3% 1,6%
Israel T 43.714.160 10.346 41.960.920 9.193 -4,0% -11,1% 1,2% 0,8%
Tunisia T 34.252.620 6.205 39.934.520 7.527 16,6% 21,3% 1,1% 0,7%
Croatia T 28.779.600 6.599 32.356.280 7.817 12,4% 18,5% 0,9% 0,7%
Peru T 27.928.850 2.605 29.273.870 2.484 4,8% -4,6% 0,8% 0,2%
Malaysia T 33.806.410 17.812 28.876.040 16.091 -14,6% -9,7% 0,8% 1,5%
United ArabEmirates
T 30.567.330 10.398 28.474.840 9.864 -6,8% -5,1% 0,8% 0,9%
Vietnam T 17.981.270 4.055 23.434.950 5.602 30,3% 38,2% 0,7% 0,5%
Exports - EXTRA EU27Yarns and threads
Year To Date: January - December
ClientCountry
Unit2011 2012 2012/2011 Market share 2012
EUR Quantity EUR Quantity EUR Quantity EUR Quantity
World T 8.524.767.030 7.983.655.540 -6,3%
EXTRA EU27 T 2.270.620.570 355.030 2.257.078.300 339.090 -0,6% -4,5% 100,0% 100,0%
United States T 259.164.750 32.515 275.555.190 32.334 6,3% -0,6% 12,2% 9,5%
Turkey T 267.463.420 44.158 268.746.860 44.294 0,5% 0,3% 11,9% 13,1%
Hong Kong T 169.761.730 6.730 177.143.540 5.707 4,3% -15,2% 7,8% 1,7%
China T 146.980.880 17.912 150.453.040 16.189 2,4% -9,6% 6,7% 4,8%
Switzerland T 124.642.700 15.371 115.853.850 13.185 -7,1% -14,2% 5,1% 3,9%
Russia T 96.872.990 18.193 98.125.190 17.743 1,3% -2,5% 4,3% 5,2%
Brazil T 54.521.450 14.405 83.531.330 19.889 53,2% 38,1% 3,7% 5,9%
Tunisia T 92.379.750 16.113 77.913.000 15.677 -15,7% -2,7% 3,5% 4,6%
Croatia T 85.060.790 11.775 77.518.590 11.290 -8,9% -4,1% 3,4% 3,3%Serbia T 59.902.860 12.135 62.059.760 11.364 3,6% -6,4% 2,7% 3,4%
Canada T 69.502.840 6.153 59.646.760 4.930 -14,2% -19,9% 2,6% 1,5%
Mexico T 57.604.770 12.460 57.216.760 12.091 -0,7% -3,0% 2,5% 3,6%
Japan T 51.762.350 3.426 51.302.200 2.620 -0,9% -23,5% 2,3% 0,8%
Egypt T 55.464.090 15.570 50.992.250 12.869 -8,1% -17,3% 2,3% 3,8%
Norway T 45.622.830 5.630 50.217.870 6.669 10,1% 18,5% 2,2% 2,0%
Morocco T 49.700.450 9.069 44.666.460 8.394 -10,1% -7,4% 2,0% 2,5%
Ukraine T 41.051.890 10.083 40.143.930 9.965 -2,2% -1,2% 1,8% 2,9%
Belarus T 39.310.230 6.449 38.030.650 6.494 -3,3% 0,7% 1,7% 1,9%
Korea South T 49.333.740 8.677 37.424.640 5.592 -24,1% -35,6% 1,7% 1,6%
India T 33.170.080 6.545 36.050.540 6.313 8,7% -3,5% 1,6% 1,9%

8/13/2019 Euratex nr 2
http://slidepdf.com/reader/full/euratex-nr-2 24/214
BULLETIN 2013/2
24
0
400.000.000
800.000.000
1.200.000.000
1.600.000.000
2.000.000.000
EU wov en fabrics' main suppliers 2011-2012 (Euros)
2011
2012
0
250.000.000
500.000.000
750.000.000
1.000.000.000
EU wov en fabrics' main customers2011-2012 (Euros)
2011
2012

8/13/2019 Euratex nr 2
http://slidepdf.com/reader/full/euratex-nr-2 25/214
BULLETIN 2013/2
25
Imports - EXTRA-EU27Woven fabrics
Year To Date: January - December
SupplyingCountry
Unit2011 2012 2012/2011 Market share 2012
EUR Quantity EUR Quantity EUR Quantity EUR QuantityWorld T 13.908.604.070 12.885.904.380 -7,4%
EXTRA EU27 T 5.326.722.710 794.637 4.969.354.220 731.578 -6,7% -7,9% 100,0% 100,0%
China T 1.912.471.690 310.556 1.804.811.290 290.971 -5,6% -6,3% 36,3% 39,8%
Turkey T 940.830.680 101.590 935.140.430 100.527 -0,6% -1,0% 18,8% 13,7%
Pakistan T 627.477.540 140.778 502.063.360 123.785 -20,0% -12,1% 10,1% 16,9%
India T 448.803.500 76.179 381.135.850 64.276 -15,1% -15,6% 7,7% 8,8%
Switzerland T 303.784.040 12.179 273.764.240 10.523 -9,9% -13,6% 5,5% 1,4%
Korea South T 157.563.930 16.526 188.045.770 16.790 19,3% 1,6% 3,8% 2,3%
Japan T 129.577.830 3.999 130.669.720 3.714 0,8% -7,1% 2,6% 0,5%
Taiwan T 102.670.050 15.692 100.455.720 15.514 -2,2% -1,1% 2,0% 2,1%
Thailand T 110.772.030 17.808 94.454.880 14.740 -14,7% -17,2% 1,9% 2,0%
Indonesia T 93.943.170 21.349 83.672.570 18.659 -10,9% -12,6% 1,7% 2,6%
United States T 78.144.890 5.242 82.113.380 4.856 5,1% -7,4% 1,7% 0,7%
Tunisia T 56.490.650 7.643 52.373.850 7.605 -7,3% -0,5% 1,1% 1,0%
Morocco T 52.565.260 5.890 46.824.650 4.347 -10,9% -26,2% 0,9% 0,6%
Egypt T 25.214.490 2.781 31.898.300 3.455 26,5% 24,2% 0,6% 0,5%
United ArabEmirates
T 32.037.100 7.562 26.670.520 6.565 -16,8% -13,2% 0,5% 0,9%
Hong Kong T 16.365.900 739 19.261.550 1.116 17,7% 51,0% 0,4% 0,2%
Malaysia T 25.072.990 6.109 18.615.170 4.110 -25,8% -32,7% 0,4% 0,6%
Belarus T 13.991.650 2.219 15.421.240 2.302 10,2% 3,7% 0,3% 0,3%
Uzbekistan T 16.081.070 4.217 14.717.570 4.345 -8,5% 3,0% 0,3% 0,6%
Norway T 13.330.470 806 13.713.220 720 2,9% -10,7% 0,3% 0,1%
Exports - EXTRA EU27Woven fabrics
Year To Date: January - December
ClientCountry
Unit2011 2012 2012/2011 Market share 2012
EUR Quantity EUR Quantity EUR Quantity EUR Quantity
World T 15.118.558.230 14.597.081.730 -3,4%
EXTRA EU27 T 6.149.213.630 398.977 6.114.586.330 380.116 -0,6% -4,7% 100,0% 100,0%
Morocco T 738.880.230 56.051 726.096.620 52.271 -1,7% -6,7% 11,9% 13,8%
Tunisia T 799.895.590 62.784 687.501.900 53.714 -14,1% -14,4% 11,2% 14,1%
Turkey T 508.449.790 38.717 508.945.660 39.882 0,1% 3,0% 8,3% 10,5%
United States T 400.791.270 23.967 472.513.830 26.242 17,9% 9,5% 7,7% 6,9%
China T 324.255.950 11.869 347.897.860 12.412 7,3% 4,6% 5,7% 3,3%
Switzerland T 326.069.890 20.225 296.298.850 17.699 -9,1% -12,5% 4,8% 4,7%
Russia T 242.407.670 17.974 262.741.750 18.678 8,4% 3,9% 4,3% 4,9%
Hong Kong T 274.543.220 7.846 262.044.060 6.517 -4,6% -16,9% 4,3% 1,7%
Japan T 183.199.720 3.982 208.846.900 4.489 14,0% 12,7% 3,4% 1,2%Ukraine T 227.558.580 16.372 205.666.670 14.454 -9,6% -11,7% 3,4% 3,8%
Macedonia T 209.327.850 12.465 199.099.760 11.452 -4,9% -8,1% 3,3% 3,0%
Mali T 88.256.720 2.719 100.569.770 3.148 14,0% 15,8% 1,6% 0,8%
Korea South T 94.337.830 2.212 82.508.710 2.043 -12,5% -7,6% 1,3% 0,5%
Madagascar T 58.156.850 1.080 73.726.260 1.227 26,8% 13,6% 1,2% 0,3%
Nigeria T 63.012.560 4.005 73.454.610 4.121 16,6% 2,9% 1,2% 1,1%
Mexico T 76.557.070 6.554 70.391.540 5.525 -8,1% -15,7% 1,2% 1,5%
Serbia T 66.772.980 6.478 69.081.640 6.348 3,5% -2,0% 1,1% 1,7%
United ArabEmirates
T 59.813.410 4.752 64.808.030 3.595 8,4% -24,3% 1,1% 0,9%
Croatia T 77.146.110 4.443 64.775.380 3.768 -16,0% -15,2% 1,1% 1,0%
Moldova T 66.523.050 4.475 64.147.050 4.424 -3,6% -1,1% 1,0% 1,2%

8/13/2019 Euratex nr 2
http://slidepdf.com/reader/full/euratex-nr-2 26/214
BULLETIN 2013/2
26
0
50.000.000
100.000.000
150.000.000
200.000.000
250.000.000
300.000.000
350.000.000
400.000.000
450.000.000
500.000.000
EU knitted fabrics' main suppliers 2011-2012 (Euros)
2011
2012
0
25.000.000
50.000.000
75.000.000
100.000.000
125.000.000
150.000.000
175.000.000
200.000.000
225.000.000
250.000.000
EU knitted fabrics' main customers2011-2012 (Euros)
2011
2012

8/13/2019 Euratex nr 2
http://slidepdf.com/reader/full/euratex-nr-2 27/214
BULLETIN 2013/2
27
Imports - EXTRA-EU27Knitted fabrics
Year To Date: January - December
SupplyingCountry
Unit2011 2012 2012/2011 Market share 2012
EUR Quantity EUR Quantity EUR Quantity EUR QuantityWorld T 3.044.472.500 3.005.854.050 -1,3%
EXTRA EU27 T 1.114.953.550 212.395 1.171.667.990 227.271 5,1% 7,0% 100,0% 100,0%
Turkey T 445.092.990 68.241 455.895.730 78.277 2,4% 14,7% 38,9% 34,4%
China T 345.116.530 95.994 359.532.750 99.879 4,2% 4,0% 30,7% 43,9%
Korea South T 136.567.230 20.245 177.635.600 24.136 30,1% 19,2% 15,2% 10,6%
Switzerland T 39.341.760 1.537 33.549.250 1.338 -14,7% -12,9% 2,9% 0,6%
Taiwan T 26.624.760 4.584 26.419.870 3.875 -0,8% -15,5% 2,3% 1,7%
United States T 22.604.940 1.459 19.732.810 1.228 -12,7% -15,8% 1,7% 0,5%
Vietnam T 10.279.340 2.858 14.061.680 3.456 36,8% 20,9% 1,2% 1,5%
Japan T 10.347.730 392 11.268.660 454 8,9% 15,8% 1,0% 0,2%
Indonesia T 7.821.470 2.974 8.978.790 2.761 14,8% -7,2% 0,8% 1,2%
Tunisia T 11.984.740 2.099 8.686.110 1.690 -27,5% -19,5% 0,7% 0,7%
Israel T 11.111.640 2.868 7.957.810 2.068 -28,4% -27,9% 0,7% 0,9%
Egypt T 5.383.200 865 7.274.640 1.285 35,1% 48,6% 0,6% 0,6%
Morocco T 4.874.860 488 6.686.860 662 37,2% 35,7% 0,6% 0,3%
India T 9.965.280 2.188 6.074.260 1.476 -39,0% -32,5% 0,5% 0,6%
Thailand T 4.030.160 1.316 5.487.430 822 36,2% -37,5% 0,5% 0,4%
Macedonia T 3.814.650 1.456 3.834.360 1.412 0,5% -3,0% 0,3% 0,6%
Norway T 3.832.610 348 3.019.390 235 -21,2% -32,5% 0,3% 0,1%
Serbia T 2.243.860 443 2.391.240 465 6,6% 5,0% 0,2% 0,2%
Hong Kong T 1.859.880 187 2.310.520 331 24,2% 77,0% 0,2% 0,1%
Ukraine T 2.761.640 293 1.518.040 175 -45,0% -40,3% 0,1% 0,1%
Exports - EXTRA EU27Knitted fabrics
Year To Date: January - December
ClientCountry
Unit2011 2012 2012/2011 Market share 2012
EUR Quantity EUR Quantity EUR Quantity EUR Quantity
World T 3.674.060.660 3.477.442.370 -5,4%
EXTRA EU27 T 1.456.238.530 113.263 1.405.844.190 114.938 -3,5% 1,5% 100,0% 100,0%
Morocco T 236.865.120 15.892 232.369.240 17.586 -1,9% 10,7% 16,5% 15,3%
Tunisia T 241.082.900 16.589 207.458.800 14.839 -13,9% -10,5% 14,8% 12,9%
Hong Kong T 91.011.350 3.628 81.782.780 3.359 -10,1% -7,4% 5,8% 2,9%
China T 73.452.530 4.671 76.199.380 4.871 3,7% 4,3% 5,4% 4,2%
Sri Lanka T 87.064.050 4.783 73.527.590 4.073 -15,5% -14,8% 5,2% 3,5%
United States T 63.849.930 6.650 67.454.310 6.896 5,6% 3,7% 4,8% 6,0%
Turkey T 66.967.940 5.050 60.802.390 5.628 -9,2% 11,4% 4,3% 4,9%
Macedonia T 46.228.760 6.149 52.650.340 6.164 13,9% 0,2% 3,7% 5,4%
Switzerland T 53.027.160 4.192 50.182.320 4.335 -5,4% 3,4% 3,6% 3,8%
Russia T 40.936.700 4.170 46.716.350 4.949 14,1% 18,7% 3,3% 4,3%
Ukraine T 45.288.490 3.977 41.452.880 3.759 -8,5% -5,5% 2,9% 3,3%
Japan T 26.612.390 2.236 34.672.300 2.486 30,3% 11,2% 2,5% 2,2%
Croatia T 36.991.480 2.559 32.845.360 1.980 -11,2% -22,6% 2,3% 1,7%
Vietnam T 36.244.440 1.517 32.485.130 1.509 -10,4% -0,5% 2,3% 1,3%
Belarus T 32.409.320 2.692 31.638.990 2.905 -2,4% 7,9% 2,3% 2,5%
Moldova T 30.171.740 2.811 26.335.000 2.443 -12,7% -13,1% 1,9% 2,1%
Korea South T 23.271.820 665 22.297.670 685 -4,2% 3,0% 1,6% 0,6%
Mexico T 19.167.490 1.834 21.147.530 1.913 10,3% 4,3% 1,5% 1,7%
Norway T 12.990.160 2.190 13.875.700 2.473 6,8% 12,9% 1,0% 2,2%
India T 13.226.860 717 13.417.150 761 1,4% 6,1% 1,0% 0,7%

8/13/2019 Euratex nr 2
http://slidepdf.com/reader/full/euratex-nr-2 28/214
BULLETIN 2013/2
28
0
50.000.000
100.000.000
150.000.000
200.000.000
250.000.000
300.000.000
350.000.000
400.000.000
EU carpets' main suppliers 2011-2012 (Euros)
2011
2012
0
40.000.000
80.000.000
120.000.000
160.000.000
200.000.000
240.000.000
EU carpets' main customers2011-2012 (Euros)
2011
2012

8/13/2019 Euratex nr 2
http://slidepdf.com/reader/full/euratex-nr-2 29/214
BULLETIN 2013/2
29
Imports - EXTRA-EU27Carpets
Year To Date: January - December
SupplyingCountry
Unit2011 2012 2012/2011 Market share 2012
EUR Quantity EUR Quantity EUR Quantity EUR QuantityWorld T 4.377.201.930 4.114.218.990 -6,0%
EXTRA EU27 T 1.314.283.890 337.169 1.252.967.490 313.520 -4,7% -7,0% 100,0% 100,0%
India T 396.267.330 102.011 328.595.550 83.863 -17,1% -17,8% 26,2% 26,7%
Turkey T 262.447.070 83.190 279.297.900 89.842 6,4% 8,0% 22,3% 28,7%
China T 232.070.240 70.112 245.569.650 67.822 5,8% -3,3% 19,6% 21,6%
Egypt T 128.954.460 47.289 113.826.810 40.124 -11,7% -15,2% 9,1% 12,8%
Switzerland T 66.308.930 6.822 67.444.360 6.413 1,7% -6,0% 5,4% 2,0%
Iran T 58.354.490 3.195 55.167.850 3.127 -5,5% -2,1% 4,4% 1,0%
United States T 37.574.250 7.010 39.126.270 5.963 4,1% -14,9% 3,1% 1,9%
Pakistan T 45.807.810 2.437 35.497.630 1.835 -22,5% -24,7% 2,8% 0,6%
Nepal T 31.239.400 1.854 27.636.330 1.205 -11,5% -35,0% 2,2% 0,4%
Thailand T 7.884.170 576 7.807.850 439 -1,0% -23,8% 0,6% 0,1%
Morocco T 8.419.650 960 6.753.210 687 -19,8% -28,4% 0,5% 0,2%
Saudi Arabia T 1.154.550 694 4.866.220 2.577 321,5% 271,3% 0,4% 0,8%
South Africa T 3.368.710 622 4.499.870 717 33,6% 15,3% 0,4% 0,2%
Indonesia T 2.487.710 1.047 3.964.900 824 59,4% -21,3% 0,3% 0,3%
Israel T 3.744.070 930 3.566.230 924 -4,7% -0,6% 0,3% 0,3%
Mexico T 3.795.330 1.461 3.414.420 1.232 -10,0% -15,7% 0,3% 0,4%
Serbia T 2.380.530 912 2.624.770 953 10,3% 4,5% 0,2% 0,3%
Moldova T 2.577.290 687 2.537.300 691 -1,6% 0,6% 0,2% 0,2%
Bangladesh T 2.337.580 1.216 2.534.640 911 8,4% -25,1% 0,2% 0,3%
Korea South T 1.115.710 270 2.130.240 302 90,9% 11,9% 0,2% 0,1%
Exports - EXTRA EU27Carpets
Year To Date: January - December
ClientCountry
Unit2011 2012 2012/2011 Market share 2012
EUR Quantity EUR Quantity EUR Quantity EUR Quantity
World T 4.493.920.040 4.399.992.890 -2,1%
EXTRA EU27 T 1.010.539.260 234.464 1.068.715.250 234.836 5,8% 0,2% 100,0% 100,0%
United States T 205.523.690 47.166 198.218.540 40.350 -3,6% -14,5% 18,5% 17,2%
Switzerland T 142.632.930 22.818 136.099.980 21.379 -4,6% -6,3% 12,7% 9,1%
Russia T 96.620.640 20.628 104.709.330 23.879 8,4% 15,8% 9,8% 10,2%
Norway T 69.316.300 13.869 76.607.920 14.254 10,5% 2,8% 7,2% 6,1%
Australia T 31.371.130 6.491 35.379.030 7.577 12,8% 16,7% 3,3% 3,2%
Japan T 30.944.910 5.466 35.180.020 5.631 13,7% 3,0% 3,3% 2,4%
China T 21.734.820 4.715 31.504.670 6.018 45,0% 27,6% 2,9% 2,6%
United ArabEmirates
T 31.753.330 6.661 30.138.580 6.307 -5,1% -5,3% 2,8% 2,7%
Turkey T 30.972.910 10.025 28.426.960 8.454 -8,2% -15,7% 2,7% 3,6%Canada T 23.108.910 5.708 21.589.740 4.452 -6,6% -22,0% 2,0% 1,9%
Saudi Arabia T 16.126.760 2.279 19.328.120 3.568 19,9% 56,6% 1,8% 1,5%
Ukraine T 15.716.040 7.098 18.740.230 7.443 19,2% 4,9% 1,8% 3,2%
Morocco T 13.469.330 3.239 15.397.260 3.866 14,3% 19,4% 1,4% 1,6%
Singapore T 8.128.790 1.341 14.245.170 1.764 75,2% 31,5% 1,3% 0,8%
Mexico T 12.060.360 2.697 14.057.150 3.179 16,6% 17,9% 1,3% 1,4%
Chile T 10.261.930 3.613 12.331.760 4.318 20,2% 19,5% 1,2% 1,8%
Croatia T 13.690.170 3.424 12.306.840 3.094 -10,1% -9,6% 1,2% 1,3%
South Africa T 12.260.820 3.173 11.670.270 2.862 -4,8% -9,8% 1,1% 1,2%
Israel T 9.205.240 2.359 11.596.440 3.152 26,0% 33,6% 1,1% 1,3%
Brazil T 10.629.730 2.442 11.300.000 2.241 6,3% -8,2% 1,1% 1,0%

8/13/2019 Euratex nr 2
http://slidepdf.com/reader/full/euratex-nr-2 30/214
BULLETIN 2013/2
30
0
400.000.000
800.000.000
1.200.000.000
1.600.000.000
2.000.000.000
2.400.000.000
2.800.000.000
EU other textiles' main suppliers 2011-2012 (Euros)
2011
2012
0
100.000.000
200.000.000
300.000.000
400.000.000
500.000.000
600.000.000
700.000.000
800.000.000
900.000.000
1.000.000.000
EU other textiles' main customers2011-2012 (Euros)
2011
2012

8/13/2019 Euratex nr 2
http://slidepdf.com/reader/full/euratex-nr-2 31/214
BULLETIN 2013/2
31
Imports - EXTRA-EU27Other Textiles
Year To Date: January - December
SupplyingCountry
Unit2011 2012 2012/2011 Market share 2012
EUR Quantity EUR Quantity EUR Quantity EUR QuantityWorld T 20.084.528.910 19.732.834.270 -1,8%
EXTRA EU27 T 6.109.038.560 1.965.575 6.154.355.240 1.891.362 0,7% -3,8% 100,0% 100,0%
China T 2.396.475.510 778.939 2.502.158.750 761.690 4,4% -2,2% 40,7% 40,3%
United States T 737.141.010 145.216 754.523.020 136.009 2,4% -6,3% 12,3% 7,2%
Turkey T 553.343.060 179.484 538.419.140 179.238 -2,7% -0,1% 8,7% 9,5%
India T 355.081.130 147.166 344.902.140 140.725 -2,9% -4,4% 5,6% 7,4%
Switzerland T 322.952.310 73.487 319.809.480 73.738 -1,0% 0,3% 5,2% 3,9%
Japan T 183.634.480 21.254 185.703.680 17.422 1,1% -18,0% 3,0% 0,9%
Korea South T 172.170.720 36.576 182.296.880 35.543 5,9% -2,8% 3,0% 1,9%
Vietnam T 123.859.040 37.519 153.778.300 49.231 24,2% 31,2% 2,5% 2,6%
Israel T 146.495.850 39.959 138.957.450 37.023 -5,1% -7,3% 2,3% 2,0%
Taiwan T 114.605.820 50.953 103.097.910 40.788 -10,0% -19,9% 1,7% 2,2%
Tunisia T 85.546.310 27.161 82.486.760 27.704 -3,6% 2,0% 1,3% 1,5%
Malaysia T 113.293.040 89.005 81.031.120 64.211 -28,5% -27,9% 1,3% 3,4%
Norway T 82.742.310 58.429 77.027.070 59.092 -6,9% 1,1% 1,3% 3,1%
Thailand T 58.366.450 13.353 64.090.540 14.997 9,8% 12,3% 1,0% 0,8%
Pakistan T 55.320.240 19.747 55.914.260 17.560 1,1% -11,1% 0,9% 0,9%
Bangladesh T 45.200.620 25.940 49.272.220 26.623 9,0% 2,6% 0,8% 1,4%
Indonesia T 36.706.550 17.533 49.087.970 20.455 33,7% 16,7% 0,8% 1,1%
Mexico T 39.390.920 22.103 42.144.430 25.887 7,0% 17,1% 0,7% 1,4%
Serbia T 35.618.310 10.804 40.716.450 11.816 14,3% 9,4% 0,7% 0,6%
Russia T 42.378.890 18.223 36.848.390 16.976 -13,1% -6,8% 0,6% 0,9%
Exports - EXTRA EU27Other Textiles
Year To Date: January - December
ClientCountry
Unit2011 2012 2012/2011 Market share 2012
EUR Quantity EUR Quantity EUR Quantity EUR Quantity
World T 22.137.328.130 22.209.969.300 0,3%
EXTRA EU27 T 6.842.349.440 2.127.474 7.255.069.170 2.216.348 6,0% 4,2% 100,0% 100,0%
United States T 808.855.250 128.738 919.378.840 143.964 13,7% 11,8% 12,7% 6,5%
Russia T 535.203.630 120.385 645.012.900 140.437 20,5% 16,7% 8,9% 6,3%
Switzerland T 551.072.590 92.013 535.287.370 87.277 -2,9% -5,1% 7,4% 3,9%
China T 421.321.080 61.655 458.704.040 58.485 8,9% -5,1% 6,3% 2,6%
Turkey T 446.230.660 97.860 409.536.960 99.597 -8,2% 1,8% 5,6% 4,5%
Ukraine T 223.449.690 105.472 247.998.650 116.237 11,0% 10,2% 3,4% 5,2%
Norway T 243.111.960 41.966 243.211.490 40.797 0,0% -2,8% 3,4% 1,8%
Tunisia T 195.509.480 113.039 192.498.620 110.454 -1,5% -2,3% 2,7% 5,0%
Japan T 167.967.230 20.570 183.184.870 22.881 9,1% 11,2% 2,5% 1,0%
Morocco T 159.803.500 50.152 164.230.030 53.602 2,8% 6,9% 2,3% 2,4%
Australia T 135.094.170 15.463 150.621.210 15.232 11,5% -1,5% 2,1% 0,7%
South Africa T 117.358.130 27.743 123.340.230 30.776 5,1% 10,9% 1,7% 1,4%
India T 148.526.600 113.088 120.659.300 107.129 -18,8% -5,3% 1,7% 4,8%
Brazil T 126.398.110 17.049 120.632.240 17.042 -4,6% 0,0% 1,7% 0,8%
Mexico T 111.570.470 14.261 120.157.410 16.082 7,7% 12,8% 1,7% 0,7%
Hong Kong T 128.040.970 15.383 118.501.230 11.313 -7,5% -26,5% 1,6% 0,5%
Korea South T 97.142.020 10.302 106.152.730 13.936 9,3% 35,3% 1,5% 0,6%
United ArabEmirates
T 89.004.370 70.994 105.102.240 74.896 18,1% 5,5% 1,4% 3,4%
Saudi Arabia T 97.613.900 22.701 103.175.010 24.966 5,7% 10,0% 1,4% 1,1%
Canada T 110.161.620 18.518 93.906.260 17.830 -14,8% -3,7% 1,3% 0,8%

8/13/2019 Euratex nr 2
http://slidepdf.com/reader/full/euratex-nr-2 32/214
BULLETIN 2013/2
32
0
150.000.000
300.000.000
450.000.000
600.000.000
750.000.000
900.000.000
1.050.000.000
1.200.000.000
1.350.000.000
1.500.000.000
1.650.000.000
EU home textiles' main suppliers
2011-2012 (Euros)
2011
2012
0
20.000.000
40.000.000
60.000.000
80.000.000
100.000.000
120.000.000
140.000.000
160.000.000
180.000.000
200.000.000
220.000.000
240.000.000
EU ho me textiles' main customers2011-2012 (Euros )
2011
2012

8/13/2019 Euratex nr 2
http://slidepdf.com/reader/full/euratex-nr-2 33/214
BULLETIN 2013/2
33
Imports - EXTRA-EU27Home Textiles
Year To Date: January - December
SupplyingCountry
Unit2011 2012 2012/2011 Market share 2012
EUR Quantity EUR Quantity EUR Quantity EUR QuantityWorld T 8.165.893.030 7.266.224.120 -11,0%
EXTRA EU27 T 5.132.713.930 834.803 4.505.824.810 726.347 -12,2% -13,0% 100,0% 100,0%
China T 1.619.245.790 326.556 1.564.866.760 286.700 -3,4% -12,2% 34,7% 39,5%
Pakistan T 1.013.570.250 176.991 848.302.000 161.841 -16,3% -8,6% 18,8% 22,3%
Turkey T 868.955.600 98.908 702.086.530 86.980 -19,2% -12,1% 15,6% 12,0%
India T 712.602.690 107.198 580.656.230 85.625 -18,5% -20,1% 12,9% 11,8%
Bangladesh T 293.146.170 45.341 224.949.280 38.127 -23,3% -15,9% 5,0% 5,2%
Egypt T 127.051.660 20.076 118.862.060 19.455 -6,4% -3,1% 2,6% 2,7%
Tunisia T 113.268.380 8.591 109.802.570 7.950 -3,1% -7,5% 2,4% 1,1%
Morocco T 51.636.010 3.296 78.082.360 5.246 51,2% 59,2% 1,7% 0,7%
Switzerland T 37.865.850 2.113 38.401.520 2.290 1,4% 8,4% 0,9% 0,3%
Moldova T 39.084.960 5.735 28.070.500 4.756 -28,2% -17,1% 0,6% 0,7%
Vietnam T 38.880.130 10.895 23.284.030 3.396 -40,1% -68,8% 0,5% 0,5%
Israel T 25.913.440 3.135 19.314.860 2.659 -25,5% -15,2% 0,4% 0,4%
Indonesia T 24.268.610 3.417 16.839.210 2.470 -30,6% -27,7% 0,4% 0,3%
Taiwan T 17.347.090 2.492 16.464.430 2.085 -5,1% -16,3% 0,4% 0,3%
Ukraine T 15.532.990 1.849 16.090.570 1.916 3,6% 3,6% 0,4% 0,3%
Thailand T 15.244.340 2.945 14.898.640 2.854 -2,3% -3,1% 0,3% 0,4%
United States T 11.116.270 957 11.924.100 797 7,3% -16,7% 0,3% 0,1%
Macedonia T 9.457.260 1.210 11.896.200 1.332 25,8% 10,1% 0,3% 0,2%
Belarus T 7.364.740 737 7.790.880 685 5,8% -7,1% 0,2% 0,1%
Russia T 7.201.980 608 7.111.780 574 -1,3% -5,6% 0,2% 0,1%
Exports - EXTRA EU27Home Textiles
Year To Date: January - December
ClientCountry
Unit2011 2012 2012/2011 Market share 2012
EUR Quantity EUR Quantity EUR Quantity EUR Quantity
World T 4.349.274.280 4.147.117.660 -4,6%
EXTRA EU27 T 849.874.780 65.454 933.998.910 66.633 9,9% 1,8% 100,0% 100,0%
Switzerland T 219.013.390 14.321 233.165.330 14.658 6,5% 2,4% 25,0% 22,0%
United States T 151.392.120 10.603 158.656.080 9.131 4,8% -13,9% 17,0% 13,7%
Norway T 61.475.740 5.761 66.710.610 5.538 8,5% -3,9% 7,1% 8,3%
Russia T 57.206.700 2.739 65.704.860 3.323 14,9% 21,3% 7,0% 5,0%
Saudi Arabia T 29.146.660 2.451 33.243.800 2.825 14,1% 15,3% 3,6% 4,2%
United ArabEmirates
T 29.577.080 2.150 30.006.020 2.233 1,5% 3,9% 3,2% 3,4%
Japan T 24.358.680 859 27.775.160 870 14,0% 1,3% 3,0% 1,3%
Canada T 13.485.640 1.210 16.052.220 1.216 19,0% 0,5% 1,7% 1,8%
Mexico T 15.074.800 1.346 15.494.940 1.430 2,8% 6,2% 1,7% 2,1%Ukraine T 12.457.870 997 15.491.270 1.092 24,3% 9,5% 1,7% 1,6%
Tunisia T 16.183.380 1.779 14.372.170 1.483 -11,2% -16,6% 1,5% 2,2%
Turkey T 16.222.290 1.683 14.255.600 1.318 -12,1% -21,7% 1,5% 2,0%
Angola T 13.283.990 1.188 14.053.340 1.261 5,8% 6,1% 1,5% 1,9%
China T 11.574.990 629 13.631.220 628 17,8% -0,2% 1,5% 0,9%
Croatia T 13.772.350 1.612 13.624.020 1.555 -1,1% -3,5% 1,5% 2,3%
Qatar T 6.485.480 223 11.978.740 334 84,7% 49,8% 1,3% 0,5%
Morocco T 8.656.040 647 11.558.840 864 33,5% 33,5% 1,2% 1,3%
Australia T 9.298.840 333 10.982.150 358 18,1% 7,5% 1,2% 0,5%
Algeria T 8.730.000 1.529 9.845.270 1.809 12,8% 18,3% 1,1% 2,7%
Kuwait T 8.466.820 650 9.604.890 705 13,4% 8,5% 1,0% 1,1%

8/13/2019 Euratex nr 2
http://slidepdf.com/reader/full/euratex-nr-2 34/214
BULLETIN 2013/2
34
0
50.000.000
100.000.000
150.000.000
200.000.000
250.000.000
300.000.000
350.000.000
400.000.000
450.000.000
500.000.000
EU occupationals' main suppliers 2011-2012 (Euros)
2011
2012
0
10.000.000
20.000.000
30.000.000
40.000.000
50.000.000
60.000.000
EU occupationals' main customers2011-2012 (Euros)
2011
2012

8/13/2019 Euratex nr 2
http://slidepdf.com/reader/full/euratex-nr-2 35/214
BULLETIN 2013/2
35
Imports - EXTRA-EU27Occupationals
Year To Date: January - December
SupplyingCountry
Unit2011 2012 2012/2011 Market share 2012
EUR Quantity EUR Quantity EUR Quantity EUR QuantityWorld T 2.139.172.250 1.920.307.070 -10,2%
EXTRA EU27 T 1.278.533.500 115.321 1.100.156.660 92.970 -14,0% -19,4% 100,0% 100,0%
China T 455.548.750 55.629 343.189.300 43.021 -24,7% -22,7% 31,2% 46,3%
Tunisia T 204.044.920 12.202 190.815.030 11.295 -6,5% -7,4% 17,3% 12,1%
Morocco T 104.350.460 6.271 90.835.610 4.837 -13,0% -22,9% 8,3% 5,2%
Vietnam T 82.700.980 7.349 80.541.550 6.037 -2,6% -17,9% 7,3% 6,5%
Macedonia T 55.630.750 2.993 53.019.500 2.714 -4,7% -9,3% 4,8% 2,9%
India T 54.593.550 5.150 41.826.080 3.738 -23,4% -27,4% 3,8% 4,0%
Pakistan T 36.538.090 4.336 31.627.530 3.471 -13,4% -19,9% 2,9% 3,7%
Sri Lanka T 30.207.040 3.190 30.948.070 2.771 2,5% -13,1% 2,8% 3,0%
Laos T 28.434.890 2.308 30.344.540 2.185 6,7% -5,3% 2,8% 2,4%
Ukraine T 32.587.920 2.292 30.060.840 1.854 -7,8% -19,1% 2,7% 2,0%
Bosnia &Herzegovina T 22.016.800 1.276 21.469.220 1.069 -2,5% -16,2% 2,0% 1,1%
Bangladesh T 18.440.520 1.895 19.154.950 1.441 3,9% -24,0% 1,7% 1,5%
Albania T 16.134.720 1.377 17.019.860 1.381 5,5% 0,3% 1,5% 1,5%
Madagascar T 10.492.420 648 13.841.660 871 31,9% 34,4% 1,3% 0,9%
Turkey T 13.293.400 679 13.546.520 631 1,9% -7,1% 1,2% 0,7%
Moldova T 13.958.110 1.389 13.020.720 1.201 -6,7% -13,5% 1,2% 1,3%
Thailand T 10.915.210 797 11.604.840 787 6,3% -1,3% 1,1% 0,8%
Switzerland T 10.547.810 251 9.638.780 212 -8,6% -15,5% 0,9% 0,2%
Serbia T 8.095.910 720 8.071.710 677 -0,3% -6,0% 0,7% 0,7%
Armenia T 10.322.990 526 6.879.840 352 -33,4% -33,1% 0,6% 0,4%
Exports - EXTRA EU27
OccupationalsYear To Date: January - December
ClientCountry
Unit2011 2012 2012/2011 Market share 2012
EUR Quantity EUR Quantity EUR Quantity EUR Quantity
World T 1.190.634.080 1.143.609.870 -3,9%
EXTRA EU27 T 207.234.920 7.906 206.508.000 7.965 -0,4% 0,7% 100,0% 100,0%
Switzerland T 58.321.900 1.790 59.633.000 1.740 2,2% -2,8% 28,9% 21,8%
Norway T 29.235.170 984 26.551.990 823 -9,2% -16,4% 12,9% 10,3%
Russia T 8.565.290 431 10.176.550 435 18,8% 0,9% 4,9% 5,5%
United States T 7.115.310 152 8.517.180 148 19,7% -2,6% 4,1% 1,9%
United ArabEmirates
T 5.567.870 89 8.266.320 208 48,5% 133,7% 4,0% 2,6%
Angola T 5.861.320 272 7.359.740 305 25,6% 12,1% 3,6% 3,8%
Saudi Arabia T 4.170.340 64 5.487.320 58 31,6% -9,4% 2,7% 0,7%
Albania T 4.307.320 651 4.446.890 527 3,2% -19,0% 2,2% 6,6%
Turkey T 3.229.360 200 3.570.430 204 10,6% 2,0% 1,7% 2,6%
Ukraine T 1.426.810 93 3.290.650 207 130,6% 122,6% 1,6% 2,6%
Japan T 2.737.410 43 3.193.620 59 16,7% 37,2% 1,5% 0,7%
Algeria T 2.352.250 140 2.972.360 435 26,4% 210,7% 1,4% 5,5%
Croatia T 3.128.430 218 2.606.940 198 -16,7% -9,2% 1,3% 2,5%
Tunisia T 4.721.790 447 2.561.420 184 -45,8% -58,8% 1,2% 2,3%
China T 1.223.230 37 2.461.620 100 101,2% 170,3% 1,2% 1,3%
Morocco T 2.769.960 179 2.317.470 120 -16,3% -33,0% 1,1% 1,5%
Australia T 1.231.300 20 2.265.030 45 84,0% 125,0% 1,1% 0,6%
Cuba T 1.457.450 79 2.224.150 145 52,6% 83,5% 1,1% 1,8%
Greenland T 1.992.410 56 2.055.150 59 3,1% 5,4% 1,0% 0,7%
Hong Kong T 5.841.750 37 2.010.650 22 -65,6% -40,5% 1,0% 0,3%

8/13/2019 Euratex nr 2
http://slidepdf.com/reader/full/euratex-nr-2 36/214
BULLETIN 2013/2
36
0
1.000.000.000
2.000.000.000
3.000.000.000
4.000.000.000
5.000.000.000
6.000.000.000
7.000.000.000
EU men clothing' main suppliers
2011-2012 (Euros)
2011
2012
0
200.000.000
400.000.000
600.000.000
800.000.000
1.000.000.000
EU men clothing' main customers2011-2012 (Euros)
2011
2012

8/13/2019 Euratex nr 2
http://slidepdf.com/reader/full/euratex-nr-2 37/214
BULLETIN 2013/2
37
Imports - EXTRA-EU27Men’s clothing (knitted or woven)Year To Date: January - December
SupplyingCountry
Unit2011 2012 2012/2011 Market share 2012
EUR Quantity EUR Quantity EUR Quantity EUR QuantityWorld T 29.643.183.880 28.866.239.850 -2,6%
EXTRA EU27 T 16.972.057.060 1.121.268 16.351.484.420 997.233 -3,7% -11,1% 100,0% 100,0%
China T 6.863.698.590 538.474 6.005.782.800 422.221 -12,5% -21,6% 36,7% 42,3%
Bangladesh T 2.148.486.370 181.225 2.524.385.440 196.756 17,5% 8,6% 15,4% 19,7%
Turkey T 1.654.249.340 64.101 1.698.955.520 64.965 2,7% 1,3% 10,4% 6,5%
India T 968.847.560 54.773 854.052.220 46.589 -11,8% -14,9% 5,2% 4,7%
Tunisia T 909.478.220 34.721 809.828.670 31.475 -11,0% -9,3% 5,0% 3,2%
Vietnam T 630.750.470 37.548 667.968.180 35.835 5,9% -4,6% 4,1% 3,6%
Pakistan T 599.094.920 53.839 589.873.570 50.646 -1,5% -5,9% 3,6% 5,1%
Morocco T 504.975.910 23.043 479.418.110 21.396 -5,1% -7,1% 2,9% 2,1%
Indonesia T 368.016.130 18.437 342.262.870 15.498 -7,0% -15,9% 2,1% 1,6%
Sri Lanka T 272.278.200 17.811 292.662.320 18.239 7,5% 2,4% 1,8% 1,8%
Cambodia T 136.960.970 10.208 251.424.710 17.136 83,6% 67,9% 1,5% 1,7%
Switzerland T 222.607.760 1.720 208.262.480 1.511 -6,4% -12,2% 1,3% 0,2%
Macedonia T 170.416.660 6.909 161.486.130 6.314 -5,2% -8,6% 1,0% 0,6%
Egypt T 180.965.010 7.925 158.014.890 6.600 -12,7% -16,7% 1,0% 0,7%
Thailand T 149.656.740 7.478 139.546.310 6.044 -6,8% -19,2% 0,9% 0,6%
Ukraine T 121.271.950 5.887 113.896.090 4.780 -6,1% -18,8% 0,7% 0,5%
Hong Kong T 87.693.260 3.952 106.785.900 4.635 21,8% 17,3% 0,7% 0,5%
Albania T 100.590.230 8.177 95.326.240 7.352 -5,2% -10,1% 0,6% 0,7%
Laos T 89.198.080 7.971 94.842.760 6.982 6,3% -12,4% 0,6% 0,7%
Myanmar T 75.985.720 4.978 65.450.870 3.832 -13,9% -23,0% 0,4% 0,4%
Exports - EXTRA EU27Men’s clothing (knitted or woven)Year To Date: January - December
ClientCountry
Unit2011 2012 2012/2011 Market share 2012
EUR Quantity EUR Quantity EUR Quantity EUR Quantity
World T 18.488.428.560 18.939.508.930 2,4%
EXTRA EU27 T 4.027.468.280 82.693 4.571.773.650 86.802 13,5% 5,0% 100,0% 100,0%
Switzerland T 839.118.890 12.577 869.566.210 12.459 3,6% -0,9% 19,0% 14,4%
Russia T 500.004.630 9.044 563.603.720 10.493 12,7% 16,0% 12,3% 12,1%
United States T 419.845.370 4.522 550.435.650 5.778 31,1% 27,8% 12,0% 6,7%
Japan T 199.723.460 1.669 242.028.560 1.952 21,2% 17,0% 5,3% 2,2%
Hong Kong T 251.982.430 1.688 235.167.120 1.553 -6,7% -8,0% 5,1% 1,8%
Turkey T 195.193.700 6.006 199.645.520 5.759 2,3% -4,1% 4,4% 6,6%
China T 165.589.860 1.940 199.147.780 2.354 20,3% 21,3% 4,4% 2,7%
Norway T 187.069.230 3.891 196.776.780 3.726 5,2% -4,2% 4,3% 4,3%
United Arab
Emirates T 95.602.440 1.433 118.284.490 1.921 23,7% 34,1% 2,6% 2,2%Australia T 51.483.940 665 117.680.150 1.409 128,6% 111,9% 2,6% 1,6%
Canada T 84.833.810 1.212 98.488.100 1.171 16,1% -3,4% 2,2% 1,3%
Mexico T 80.404.950 1.825 87.452.100 2.046 8,8% 12,1% 1,9% 2,4%
Ukraine T 72.427.870 1.526 79.922.030 1.664 10,3% 9,0% 1,7% 1,9%
Korea South T 57.853.070 532 70.392.430 691 21,7% 29,9% 1,5% 0,8%
Saudi Arabia T 42.397.180 716 59.669.990 1.144 40,7% 59,8% 1,3% 1,3%
Croatia T 58.651.050 2.540 53.692.450 2.464 -8,5% -3,0% 1,2% 2,8%
Singapore T 31.008.790 415 39.491.060 508 27,4% 22,4% 0,9% 0,6%
Albania T 35.353.380 4.607 36.473.330 4.344 3,2% -5,7% 0,8% 5,0%
Kazakhstan T 28.518.480 421 36.324.180 542 27,4% 28,7% 0,8% 0,6%
Lebanon T 29.671.660 441 34.645.650 508 16,8% 15,2% 0,8% 0,6%

8/13/2019 Euratex nr 2
http://slidepdf.com/reader/full/euratex-nr-2 38/214
BULLETIN 2013/2
38
0
1.000.000.000
2.000.000.000
3.000.000.000
4.000.000.000
5.000.000.000
6.000.000.000
7.000.000.000
8.000.000.000
9.000.000.000
10.000.000.000
11.000.000.000
EU women clothing' main suppliers
2011-2012 (Euros)
2011
2012
0
250.000.000
500.000.000
750.000.000
1.000.000.000
1.250.000.000
1.500.000.000
EU women clothing' main customers2011-2012 (Euros)
2011
2012

8/13/2019 Euratex nr 2
http://slidepdf.com/reader/full/euratex-nr-2 39/214
BULLETIN 2013/2
39
Imports - EXTRA-EU27Women’s clothing (knitted or woven)
Year To Date: January - December
SupplyingCountry
Unit2011 2012 2012/2011 Market share 2012
EUR Quantity EUR Quantity EUR Quantity EUR QuantityWorld T 42.774.839.780 41.370.367.590 -3,3%
EXTRA EU27 T 23.671.135.460 1.339.018 22.713.332.500 1.203.079 -4,0% -10,2% 100,0% 100,0%
China T 10.769.815.240 724.327 9.981.311.520 609.407 -7,3% -15,9% 43,9% 50,7%
Turkey T 2.998.465.690 126.580 2.936.422.810 121.813 -2,1% -3,8% 12,9% 10,1%
India T 2.175.052.280 86.795 1.799.483.080 71.292 -17,3% -17,9% 7,9% 5,9%
Bangladesh T 1.459.316.240 114.695 1.791.476.520 133.076 22,8% 16,0% 7,9% 11,1%
Morocco T 1.207.242.150 45.188 1.106.047.450 39.316 -8,4% -13,0% 4,9% 3,3%
Tunisia T 895.652.560 28.660 782.734.800 23.978 -12,6% -16,3% 3,4% 2,0%
Vietnam T 614.920.410 38.580 657.422.720 38.637 6,9% 0,1% 2,9% 3,2%
Sri Lanka T 488.858.380 28.794 526.749.440 27.762 7,8% -3,6% 2,3% 2,3%
Indonesia T 435.714.730 21.120 406.333.040 18.016 -6,7% -14,7% 1,8% 1,5%
Cambodia T 233.768.080 15.132 358.087.910 21.481 53,2% 42,0% 1,6% 1,8%
Pakistan T 307.384.490 28.166 305.421.120 26.006 -0,6% -7,7% 1,3% 2,2%
Macedonia T 255.060.760 9.672 249.613.840 9.086 -2,1% -6,1% 1,1% 0,8%
United States T 146.255.180 2.359 193.889.160 3.299 32,6% 39,8% 0,9% 0,3%
Hong Kong T 157.039.000 5.780 183.372.570 6.309 16,8% 9,2% 0,8% 0,5%
Thailand T 173.132.090 7.451 148.123.470 5.811 -14,4% -22,0% 0,7% 0,5%
Ukraine T 156.905.280 6.384 142.375.240 5.341 -9,3% -16,3% 0,6% 0,4%
Switzerland T 138.299.690 898 140.572.320 788 1,6% -12,2% 0,6% 0,1%
Egypt T 132.355.400 7.393 110.389.300 6.013 -16,6% -18,7% 0,5% 0,5%
Moldova T 102.032.210 4.218 105.582.000 4.310 3,5% 2,2% 0,5% 0,4%
Philippines T 58.118.990 3.127 64.634.300 2.975 11,2% -4,9% 0,3% 0,2%
Exports - EXTRA EU27Women’s clothing (knitted or woven)
Year To Date: January - December
ClientCountry
Unit2011 2012 2012/2011 Market share 2012
EUR Quantity EUR Quantity EUR Quantity EUR Quantity
World T 28.796.759.910 29.349.523.260 1,9%
EXTRA EU27 T 7.041.184.570 109.968 7.851.016.060 115.689 11,5% 5,2% 100,0% 100,0%
Russia T 1.281.285.190 16.302 1.474.890.820 17.934 15,1% 10,0% 18,8% 15,5%
Switzerland T 1.278.284.590 15.402 1.247.876.280 14.181 -2,4% -7,9% 15,9% 12,3%
United States T 643.053.010 4.940 755.209.890 6.036 17,4% 22,2% 9,6% 5,2%
Japan T 449.520.700 3.162 482.361.640 3.343 7,3% 5,7% 6,1% 2,9%
Hong Kong T 361.855.760 2.242 425.757.930 2.459 17,7% 9,7% 5,4% 2,1%
China T 183.125.860 2.232 274.937.980 2.934 50,1% 31,5% 3,5% 2,5%
Turkey T 285.437.960 7.615 273.728.560 6.669 -4,1% -12,4% 3,5% 5,8%
Norway T 247.386.140 4.712 267.983.670 4.490 8,3% -4,7% 3,4% 3,9%
Ukraine T 234.830.870 3.075 255.813.290 3.046 8,9% -0,9% 3,3% 2,6%
United ArabEmirates
T 183.849.360 2.809 224.595.150 3.734 22,2% 32,9% 2,9% 3,2%
Saudi Arabia T 150.153.280 2.474 183.499.070 3.032 22,2% 22,6% 2,3% 2,6%
Korea South T 129.754.260 1.057 168.637.640 980 30,0% -7,3% 2,1% 0,8%
Australia T 65.618.860 772 127.261.060 1.394 93,9% 80,6% 1,6% 1,2%
Mexico T 119.659.180 2.655 121.164.700 2.662 1,3% 0,3% 1,5% 2,3%
Canada T 111.584.790 1.329 120.618.060 1.364 8,1% 2,6% 1,5% 1,2%
Lebanon T 85.128.610 1.222 92.075.710 1.183 8,2% -3,2% 1,2% 1,0%
Kazakhstan T 71.521.780 643 89.674.400 897 25,4% 39,5% 1,1% 0,8%
Croatia T 97.534.340 3.230 87.384.850 3.062 -10,4% -5,2% 1,1% 2,6%
Kuwait T 59.158.550 649 71.316.000 709 20,6% 9,2% 0,9% 0,6%
Singapore T 63.151.540 698 70.690.300 858 11,9% 22,9% 0,9% 0,7%

8/13/2019 Euratex nr 2
http://slidepdf.com/reader/full/euratex-nr-2 40/214
BULLETIN 2013/2
40
0
1.000.000.000
2.000.000.000
3.000.000.000
4.000.000.000
5.000.000.000
6.000.000.000
7.000.000.000
8.000.000.000
9.000.000.000
10.000.000.000
11.000.000.000
12.000.000.000
13.000.000.000
EU other garments' main suppliers 2011-2012 (Euros)
2011
2012
0
100.000.000
200.000.000
300.000.000
400.000.000
500.000.000
600.000.000
700.000.000
800.000.000
900.000.000
1.000.000.000
1.100.000.000
1.200.000.000
EU other garments' main customers
2011-2012 (Euros)
2011
2012

8/13/2019 Euratex nr 2
http://slidepdf.com/reader/full/euratex-nr-2 41/214
BULLETIN 2013/2
41
Imports - EXTRA-EU27Other garments
Year To Date: January - December
SupplyingCountry
Unit2011 2012 2012/2011 Market share 2012
EUR Quantity EUR Quantity EUR Quantity EUR QuantityWorld T 49.188.823.330 46.532.738.020 -5,4%
EXTRA EU27 T 27.761.382.450 1.886.534 26.069.814.520 1.653.715 -6,1% -12,3% 100,0% 100,0%
China T 12.403.360.410 920.908 11.222.445.510 751.160 -9,5% -18,4% 43,0% 45,4%
Bangladesh T 3.981.748.220 349.730 3.933.335.560 334.207 -1,2% -4,4% 15,1% 20,2%
Turkey T 3.655.429.850 184.412 3.570.636.420 177.372 -2,3% -3,8% 13,7% 10,7%
India T 1.507.622.730 79.157 1.328.134.560 67.804 -11,9% -14,3% 5,1% 4,1%
Cambodia T 551.583.630 37.708 609.672.840 37.266 10,5% -1,2% 2,3% 2,3%
Sri Lanka T 537.052.630 27.537 547.376.140 27.205 1,9% -1,2% 2,1% 1,6%
Tunisia T 607.496.780 22.501 514.723.250 19.075 -15,3% -15,2% 2,0% 1,2%
Morocco T 484.197.010 33.306 453.648.290 30.412 -6,3% -8,7% 1,7% 1,8%
Indonesia T 446.442.270 28.189 440.674.460 25.288 -1,3% -10,3% 1,7% 1,5%
Vietnam T 442.003.210 24.721 406.586.590 20.007 -8,0% -19,1% 1,6% 1,2%
Pakistan T 365.326.380 44.463 352.561.670 41.201 -3,5% -7,3% 1,4% 2,5%
Thailand T 368.210.200 16.651 328.331.180 13.652 -10,8% -18,0% 1,3% 0,8%
Croatia T 230.710.850 7.088 231.680.660 7.126 0,4% 0,5% 0,9% 0,4%
Hong Kong T 188.700.450 7.396 220.769.170 8.675 17,0% 17,3% 0,8% 0,5%
United States T 168.591.770 5.937 213.102.220 8.001 26,4% 34,8% 0,8% 0,5%
Switzerland T 175.309.980 1.588 178.912.280 1.789 2,1% 12,7% 0,7% 0,1%
Serbia T 183.486.740 13.509 176.731.300 10.054 -3,7% -25,6% 0,7% 0,6%
Mauritius T 182.778.100 7.577 160.361.100 6.164 -12,3% -18,6% 0,6% 0,4%
Madagascar T 138.679.880 3.462 145.079.790 3.012 4,6% -13,0% 0,6% 0,2%
Egypt T 143.543.400 10.207 114.067.290 7.795 -20,5% -23,6% 0,4% 0,5%
Exports - EXTRA EU27Other garments
Year To Date: January - December
ClientCountry
Unit2011 2012 2012/2011 Market share 2012
EUR Quantity EUR Quantity EUR Quantity EUR Quantity
World T 31.115.730.830 30.705.043.550 -1,3%
EXTRA EU27 T 7.342.448.260 177.006 7.839.382.460 173.923 6,8% -1,7% 100,0% 100,0%
Switzerland T 1.177.970.900 17.922 1.172.757.030 17.478 -0,4% -2,5% 15,0% 10,0%
Russia T 949.893.750 22.132 978.139.450 20.983 3,0% -5,2% 12,5% 12,1%
United States T 733.431.680 8.107 924.953.610 8.991 26,1% 10,9% 11,8% 5,2%
Hong Kong T 540.641.810 3.416 570.880.580 3.372 5,6% -1,3% 7,3% 1,9%
Japan T 448.319.360 3.883 564.885.540 4.527 26,0% 16,6% 7,2% 2,6%
Norway T 289.629.440 7.477 298.670.080 6.829 3,1% -8,7% 3,8% 3,9%
China T 219.263.430 3.250 282.860.580 3.591 29,0% 10,5% 3,6% 2,1%
Turkey T 292.224.900 10.326 266.794.820 8.625 -8,7% -16,5% 3,4% 5,0%
United Arab
Emirates T 176.568.490 3.408 196.771.900 4.413 11,4% 29,5% 2,5% 2,5%Ukraine T 178.065.060 5.002 189.498.360 4.808 6,4% -3,9% 2,4% 2,8%
Tunisia T 179.561.210 8.606 169.516.930 7.746 -5,6% -10,0% 2,2% 4,5%
Croatia T 182.428.130 8.025 161.106.470 8.036 -11,7% 0,1% 2,1% 4,6%
Korea South T 139.915.390 1.304 156.416.430 1.258 11,8% -3,5% 2,0% 0,7%
Saudi Arabia T 117.297.890 2.080 129.813.540 2.521 10,7% 21,2% 1,7% 1,4%
Canada T 123.120.740 1.975 124.233.690 1.739 0,9% -11,9% 1,6% 1,0%
Mexico T 121.430.390 3.166 124.026.760 3.299 2,1% 4,2% 1,6% 1,9%
Morocco T 110.779.600 8.146 113.316.960 7.883 2,3% -3,2% 1,4% 4,5%
Serbia T 113.059.580 7.227 111.628.210 6.500 -1,3% -10,1% 1,4% 3,7%
Australia T 98.282.100 1.889 88.727.380 1.475 -9,7% -21,9% 1,1% 0,8%
Israel T 71.197.010 1.726 77.653.860 1.988 9,1% 15,2% 1,0% 1,1%

8/13/2019 Euratex nr 2
http://slidepdf.com/reader/full/euratex-nr-2 42/214
BULLETIN 2013/2
42
› EU EXTERNAL TRADE - TABLES
EXTRA EU-27 – TEXTILE AND CLOTHING TRADE 2011-2012 – IN VALUE 43
EXTRA EU-27 – TEXTILE AND CLOTHING TRADE 2011-2012 – IN VOLUME 47

8/13/2019 Euratex nr 2
http://slidepdf.com/reader/full/euratex-nr-2 43/214
BULLETIN 2013/2
43
EU 27 (External Trade) Textile and Clothing Trade 2011 - 2012Country :
EXTRA EU-27Unit : 1000 €
IMPORTS EXPORTS Coverage E/I
2011 2012 Evol. % 2011 2012 Evol. % 2011 2012
Natural fibers 2.168.363 1.706.223 - 21.3 749.500 940.486 25.5 35 55
Silk 77.107 75.432 - 2.2 2.777 2.372 - 14.6 4 3
o.w. raw silk 58.019 59.758 3.0 1.091 521 - 52.3 2 1
Wool, fine or coarse animalhair
1.361.787 1.166.808 - 14.3 212.512 206.425 - 2.9 16 18
o.w. wool, not carded orcombed
532.425 465.941 - 12.5 135.898 128.657 - 5.3 26 28
o.w. wool and fine or coarseanimal hair
517.324 423.026 - 18.2 60.997 60.504 - 0.8 12 14
Cotton 651.060 382.865 - 41.2 316.276 505.545 59.8 49 132
Other vegetable fibres 78.409 81.117 3.5 217.936 226.145 3.8 278 279
o.w. flax 17.235 14.526 - 15.7 214.944 220.690 2.7 1 2
Man-made fibres 1.165.594 1.078.595 - 7.5 865.450 884.754 2.2 74 82
Synthetic filament tow 74.699 61.213 - 18.1 226.701 214.479 - 5.4 303 350Artificial filament tow 71.138 85.233 19.8 85.205 110.282 29.4 120 129
Synthetic staple fibres 927.270 850.810 - 8.2 388.927 393.374 1.1 42 46
Artificial staple fibres 60.946 50.353 - 17.4 100.050 91.158 - 8.9 164 181
Yarns and Threads 4.120.649 3.566.829 - 13.4 2.270.663 2.256.241 - 0.6 55 63
Silk 72.949 66.753 - 8.5 7.538 7.386 - 2.0 10 11
Wool 231.633 195.409 - 15.6 384.744 388.822 1.1 166 199
o.w. carded wool, n.p.r.s. 22.793 18.548 - 18.6 130.449 140.170 7.5 572 756
o.w. combed wool, n.p.r.s. 140.751 108.876 - 22.6 172.524 154.208 - 10.6 123 142
Cotton 1.157.760 880.633 - 23.9 219.188 201.888 - 7.9 19 23
o.w. cotton yarn, n.p.r.s. 1.129.806 859.284 - 23.9 168.158 147.098 - 12.5 15 17
o.w. cotton yarn, p.r.s. 27.954 21.349 - 23.6 51.030 54.790 7.4 183 257
Other - Vegetable yarns 122.508 126.868 3.6 26.216 24.669 - 5.9 21 19
Man-made filaments yarns 1.886.186 1.743.089 - 7.6 1.335.633 1.324.934 - 0.8 71 76o.w. sewing thread 43.112 42.241 - 2.0 108.039 108.864 0.8 251 258
o.w. synthetic filament yarn 1.620.240 1.495.584 - 7.7 965.052 956.317 - 0.9 60 64
o.w. artificial filament yarn 94.596 85.407 - 9.7 46.194 38.644 - 16.3 49 45
o.w. synthetic monofilament 113.654 106.619 - 6.2 213.055 216.148 1.5 187 203
Man made staple yarns 649.613 554.076 - 14.7 297.345 308.541 3.8 46 56
o.w. man made staple yarns,n.p.r.s.
540.743 434.185 - 19.7 257.087 266.344 3.6 48 61
o.w. man made staple yarns,p.r.s.
108.871 119.891 10.1 40.258 42.197 4.8 37 35
Woven fabrics 5.326.778 4.969.436 - 6.7 6.150.432 6.112.856 - 0.6 115 123
Silk 251.356 232.932 - 7.3 209.253 208.824 - 0.2 83 90
Wool 137.765 132.077 - 4.1 995.612 1.019.868 2.4 723 772
o.w. carded wool 29.808 34.490 15.7 296.804 312.464 5.3 996 906
o.w. combed wool 103.348 93.753 - 9.3 694.806 703.459 1.2 672 750
Cotton 2.008.087 1.674.627 - 16.6 2.159.820 2.018.244 - 6.6 108 121
o.w. cotton, unbleached 618.031 494.304 - 20.0 104.190 94.656 - 9.2 17 19
o.w. cotton, dyed 335.155 271.808 - 18.9 493.274 417.161 - 15.4 147 153
o.w. denim fabric 198.048 163.184 - 17.6 250.623 203.465 - 18.8 127 125
Other fabrics 154.715 134.851 - 12.8 160.839 151.405 - 5.9 104 112
o.w. flax 105.713 93.511 - 11.5 149.593 141.867 - 5.2 142 152
Synthetic and artificialfilament yarn
1.158.887 1.263.192 9.0 956.833 995.583 4.0 83 79
o.w. synthetic filament yarn 1.053.914 1.160.320 10.1 780.292 835.106 7.0 74 72
o.w. artificial filament yarn 104.973 102.872 - 2.0 176.541 160.477 - 9.1 168 156
Synthetic and artificialsstaple fibres
953.089 849.369 - 10.9 896.217 918.823 2.5 94 108

8/13/2019 Euratex nr 2
http://slidepdf.com/reader/full/euratex-nr-2 44/214
BULLETIN 2013/2
44
EU 27 (External Trade) Textile and Clothing Trade 2011 - 2012 (continued)Country :
EXTRA EU-27Unit : 1000 €
IMPORTS EXPORTS Coverage E/I
2011 2012 Evol. % 2011 2012 Evol. % 2011 2012
o.w. containing > 85% ofsynthetic
129.215 121.379 - 6.1 197.135 218.402 10.8 153 180
o.w. containing < 85% ofsynthetic
215.711 168.467 - 21.9 68.869 54.600 - 20.7 32 32
o.w. containing < 85% syn-thetic mixed natural fibres
174.305 140.108 - 19.6 203.950 183.658 - 9.9 117 131
o.w. other synthetics 276.201 255.734 - 7.4 251.177 276.711 10.2 91 108
o.w. artificial staple fibres 157.658 163.682 3.8 175.086 185.453 5.9 111 113
Special woven fabrics 654.545 673.807 2.9 767.170 796.952 3.9 117 118
o.w. pile fabrics 189.158 187.850 - 0.7 170.109 202.188 18.9 90 108
o.w. narrow woven fabrics 161.316 167.746 4.0 228.696 234.393 2.5 142 140
o.w. labels, badges 42.851 45.973 7.3 118.446 106.310 - 10.2 276 231
o.w. embroidery 161.161 161.055 - 0.1 92.675 95.697 3.3 58 59
Knitted fabrics 1.114.993 1.171.744 5.1 1.459.044 1.401.654 - 3.9 131 120
Pile fabrics 102.004 106.911 4.8 113.184 112.936 - 0.2 111 106
< 30 cm; w 5% or moreelastome
11.377 10.472 - 8.0 84.701 65.443 - 22.7 744 625
> 30 cm; w 5% or moreelastome
348.580 373.633 7.2 382.718 386.797 1.1 110 104
Curtain fabrics and raschellace
137.168 149.070 8.7 321.001 310.047 - 3.4 234 208
Other fabrics 515.864 531.658 3.1 557.440 526.431 - 5.6 108 99
Carpets 1.314.459 1.253.007 - 4.7 1.011.322 1.063.311 5.1 77 85
Knotted carpets 258.788 256.899 - 0.7 39.401 43.368 10.1 15 17
Woven carpets 515.833 460.372 - 10.8 337.227 351.012 4.1 65 76
Tufted carpets 332.849 357.058 7.3 377.640 420.731 11.4 113 118
Carpets of felt 49.976 50.886 1.8 94.781 89.244 - 5.8 190 175
Other textiles 6.109.035 6.156.064 0.8 6.844.037 7.254.660 6.0 112 118
Wadding, felt, nonwovens,rubber thread, twine, cor-dage, etc.
1.172.167 1.224.509 4.5 2.340.128 2.492.313 6.5 200 204
o.w. felt 45.285 49.902 10.2 128.974 119.062 - 7.7 285 239
o.w. nonwovens 672.852 722.936 7.4 1.397.464 1.492.622 6.8 208 206
o.w. special yarn 82.046 81.965 - 0.1 67.183 78.832 17.3 82 96
o.w. twine, rope 96.843 103.393 6.8 179.804 216.449 20.4 186 209
o.w. nets 96.884 96.788 - 0.1 117.891 121.526 3.1 122 126
Handwoven tapestries &quilted products
6.975 6.462 - 7.4 26.789 19.953 - 25.5 384 309
Impregnated, coated, etc,,textile fabrics
1.177.323 1.179.028 0.1 2.034.316 2.064.819 1.5 173 175
o.w. tyre cord fabric 230.603 216.061 - 6.3 55.964 51.162 - 8.6 24 24
o.w. fabrics impregnated,coated etc, 503.741 526.459 4.5 862.289 879.891 2.0 171 167
o.w. textile products, articlesfor technical uses
255.702 255.858 0.1 680.877 669.747 - 1.6 266 262
Other made up textilearticles
2.853.605 2.864.291 0.4 1.639.939 1.898.102 15.7 57 66
o.w. sacks and bags 691.306 646.369 - 6.5 66.974 64.753 - 3.3 10 10
o.w. tarpaulins, sunblinds& alike
573.226 560.071 - 2.3 181.925 214.746 18.0 32 38
o.w. other : floorcloths,dishcloths etc
1.426.757 1.484.431 4.0 386.798 418.935 8.3 27 28
Worn clothing and otherworn articles
130.341 142.292 9.2 985.887 1.181.676 19.9 756 830
Home textiles 5.132.927 4.506.085 - 12.2 850.025 933.397 9.8 17 21
Bedlinen, table, toilet andkitchen linen
3.462.401 2.931.241 - 15.3 521.481 560.588 7.5 15 19
o.w. Bedlinen, woven 1.789.322 1.452.787 - 18.8 284.580 308.073 8.3 16 21
o.w. toilet linen 1.077.744 965.526 - 10.4 139.963 153.409 9.6 13 16
o.w. table linen, woven 275.993 246.785 - 10.6 58.782 60.625 3.1 21 25

8/13/2019 Euratex nr 2
http://slidepdf.com/reader/full/euratex-nr-2 45/214
BULLETIN 2013/2
45
EU 27 (External Trade) Textile and Clothing Trade 2011 - 2012 (continued)Country :
EXTRA EU-27Unit : 1000 €
IMPORTS EXPORTS Coverage E/I
2011 2012 Evol. % 2011 2012 Evol. % 2011 2012
Curtains 730.879 697.108 - 4.6 147.246 165.219 12.2 20 24
Other furnishing articles 559.553 513.075 - 8.3 106.001 117.922 11.2 19 23
Garments 68.408.875 65.143.967 - 4.8 18.420.866 20.263.055 10.0 27 31
Occupationals (woven) 1.278.532 1.100.222 - 13.9 207.374 206.480 - 0.4 16 19
Men’s ensembles 47.600 35.122 - 26.2 16.146 10.154 - 37.1 34 29
o.w. jackets 166.370 149.836 - 9.9 21.052 23.614 12.2 13 16
o.w. trousers 378.618 326.520 - 13.8 48.671 51.001 4.8 13 16
o.w. overalls 112.494 90.487 - 19.6 12.703 13.243 4.2 11 15
o.w. Others 345.566 292.986 - 15.2 70.389 63.726 - 9.5 20 22
Women’s ensembles 3.327 2.082 - 37.4 1.956 2.189 11.9 59 105
o.w. jackets 17.947 17.351 - 3.3 7.393 8.185 10.7 41 47
o.w. trousers 44.543 43.546 - 2.2 8.579 10.699 24.7 19 25
o.w. overalls 2.615 2.244 - 14.2 922 1.575 70.7 35 70
o.w. others 159.453 140.049 - 12.2 19.563 22.095 12.9 12 16
Men’s Clothing (knittedand woven)
16.972.496 16.352.046 - 3.7 4.027.819 4.569.850 13.5 24 28
Overcoats 2.540.951 2.311.436 - 9.0 554.084 735.450 32.7 22 32
o.w. woven 2.262.142 2.036.243 - 10.0 497.263 668.898 34.5 22 33
Suits 499.385 446.734 - 10.5 491.520 545.506 11.0 98 122
o.w. woven 483.488 427.482 - 11.6 478.066 529.676 10.8 99 124
Ensembles 138.443 125.810 - 9.1 218.953 170.760 - 22.0 158 136
o.w. woven 81.956 74.736 - 8.8 205.521 155.809 - 24.2 251 208
Jackets and blazers 1.077.826 1.111.047 3.1 388.402 495.830 27.7 36 45
o.w. woven 975.921 972.880 - 0.3 341.976 433.583 26.8 35 45
Trousers 6.553.406 6.463.121 - 1.4 1.230.432 1.393.532 13.3 19 22
o.w. woven 6.108.080 6.014.319 - 1.5 1.158.384 1.305.881 12.7 19 22
Shirts 4.097.371 3.977.019 - 2.9 767.723 846.345 10.2 19 21o.w. woven 2.682.794 2.591.716 - 3.4 551.653 606.607 10.0 21 23
Underpants, briefs, etc. 1.307.216 1.231.347 - 5.8 143.132 138.264 - 3.4 11 11
o.w. knitted 1.087.154 1.042.777 - 4.1 114.032 109.796 - 3.7 10 11
Swimwear 162.766 155.084 - 4.7 24.023 29.061 21.0 15 19
Tracksuits 230.715 215.665 - 6.5 91.700 93.649 2.1 40 43
Women’s Clothing (knittedand woven)
23.671.244 22.713.319 - 4.0 7.042.458 7.848.900 11.5 30 35
Overcoats 3.648.778 3.309.637 - 9.3 771.966 893.579 15.8 21 27
o.w. woven 3.021.302 2.768.447 - 8.4 681.964 806.477 18.3 23 29
Suits 69.253 67.549 - 2.5 150.356 140.120 - 6.8 217 207
o.w. woven 46.111 44.921 - 2.6 126.526 117.766 - 6.9 274 262
Ensembles 150.810 138.269 - 8.3 537.503 514.666 - 4.2 356 372
o.w. woven 76.727 73.996 - 3.6 520.575 496.934 - 4.5 678 672
Jackets 1.250.641 1.366.178 9.2 476.973 545.945 14.5 38 40
o.w. woven 964.641 1.043.817 8.2 401.346 454.265 13.2 42 44
Skirts and dresses 4.844.665 4.467.207 - 7.8 1.611.398 1.879.291 16.6 33 42
o.w. woven 3.190.055 2.849.889 - 10.7 1.194.227 1.366.063 14.4 37 48
Trousers 6.708.945 6.718.449 0.1 1.153.691 1.300.674 12.7 17 19
o.w. woven 5.052.732 5.056.990 0.1 968.912 1.089.014 12.4 19 22
Blouses 3.500.529 3.359.595 - 4.0 759.781 846.805 11.5 22 25
o.w. woven 2.409.976 2.275.000 - 5.6 566.410 625.482 10.4 24 27
Slips, petticoats, etc. 2.288.594 2.122.056 - 7.3 339.610 336.998 - 0.8 15 16
o.w. knitted 1.958.168 1.826.650 - 6.7 262.677 262.469 - 0.1 13 14
Swimwear 535.621 512.327 - 4.3 140.944 142.132 0.8 26 28
Tracksuits 462.287 460.894 - 0.3 279.144 294.023 5.3 60 64
Others (knitted and woven) 27.761.417 26.072.926 - 6.1 7.342.739 7.836.229 6.7 26 30
Babies’ garments 2.180.425 1.998.919 - 8.3 271.108 281.073 3.7 12 14
o.w. knitted or crocheted 1.522.635 1.408.491 - 7.5 164.417 173.500 5.5 11 12
T-shirts 7.678.629 7.399.685 - 3.6 1.338.085 1.381.537 3.2 17 19

8/13/2019 Euratex nr 2
http://slidepdf.com/reader/full/euratex-nr-2 46/214
BULLETIN 2013/2
46
EU 27 (External Trade) Textile and Clothing Trade 2011 - 2012 (continued)Country :
EXTRA EU-27Unit : 1000 €
IMPORTS EXPORTS Coverage E/I
2011 2012 Evol. % 2011 2012 Evol. % 2011 2012
Jerseys, pullovers, cardigans 9.228.718 8.571.682 - 7.1 1.623.081 1.767.390 8.9 18 21
Special garments 1.966.799 1.759.203 - 10.6 1.200.699 1.421.584 18.4 61 81
o.w. woven 1.828.812 1.635.036 - 10.6 1.057.816 1.188.250 12.3 58 73
Other garments, knitted orcrocheted
512.616 530.252 3.4 582.577 594.202 2.0 114 112
Gloves 994.896 865.171 - 13.0 72.598 81.208 11.9 7 9
Ties, bow ties, and cravats 153.651 143.010 - 6.9 217.526 219.340 0.8 142 153
Shawls, scarves, mufflers,mantillas, etc
992.144 974.695 - 1.8 447.534 506.176 13.1 45 52
Pantyhose, tights, stockings,socks, etc
1.841.254 1.699.740 - 7.7 657.276 630.471 - 4.1 36 37
Brassières, girdles, corsets,etc,
1.666.466 1.645.980 - 1.2 440.305 456.914 3.8 26 28
Other accessories 250.180 250.238 0.0 479.648 477.776 - 0.4 192 191
TOTAL Chapter 61 KnittedGarments
33.754.431 32.084.481 - 4.9 6.677.442 7.186.795 7.6 20 22
TOTAL Chapter 62 WovenGarments
34.654.524 33.059.682 - 4.6 11.743.420 13.076.258 11.3 34 40
Total Clothing - (CH 61+62) 68.447.433 65.184.749 - 4.8 18.420.951 20.263.318 10.0 27 31
Total Textile - (CH 50-60 + 63) 26.470.507 24.437.206 - 7.7 21.172.511 21.766.645 2.8 80 89
Total 94.917.940 89.621.954 - 5.6 39.593.462 42.029.963 6.2 42 47

8/13/2019 Euratex nr 2
http://slidepdf.com/reader/full/euratex-nr-2 47/214

8/13/2019 Euratex nr 2
http://slidepdf.com/reader/full/euratex-nr-2 48/214
BULLETIN 2013/2
48
EU 27 (External Trade) Textile and Clothing Trade 2011 - 2012 (continued)Country :
EXTRA EU-27Unit : Tone
IMPORTS EXPORTS Coverage E/I
2011 2012 Evol. % 2011 2012 Evol. % 2011 2012
o.w. containing < 85% syn-thetic mixed natural fibres
49.106 39.416 - 19.7 24.128 21.711 - 10.0 49 55
o.w. other synthetics 55.118 50.795 - 7.8 21.390 24.160 12.9 39 48
o.w. artificial staple fibres 22.150 22.920 3.5 12.420 11.808 - 4.9 56 52
Special woven fabrics 69.883 65.562 - 6.2 44.002 40.847 - 7.2 63 62
o.w. pile fabrics 28.487 26.528 - 6.9 11.307 10.730 - 5.1 40 40
o.w. narrow woven fabrics 23.421 22.027 - 5.9 19.567 19.028 - 2.8 84 86
o.w. labels, badges 1.998 1.936 - 3.1 5.321 4.199 - 21.1 266 217
o.w. embroidery 7.346 6.332 - 13.8 1.402 1.229 - 12.3 19 19
Knitted fabrics 212.445 227.290 7.0 113.765 115.001 1.1 54 51
Pile fabrics 18.570 18.590 0.1 11.480 12.225 6.5 62 66
< 30 cm; w 5% or moreelastome
1.276 1.260 - 1.3 4.772 3.889 - 18.5 374 309
> 30 cm; w 5% or moreelastome 60.737 66.696 9.8 22.317 23.819 6.7 37 36
Curtain fabrics and raschellace
28.530 28.715 0.6 28.081 30.051 7.0 98 105
Other fabrics 103.331 112.029 8.4 47.115 45.018 - 4.5 46 40
Carpets 337.182 313.527 - 7.0 234.598 233.074 - 0.6 70 74
Knotted carpets 25.738 21.225 - 17.5 1.490 1.483 - 0.5 6 7
Woven carpets 156.813 146.088 - 6.8 56.564 55.334 - 2.2 36 38
Tufted carpets 96.368 94.609 - 1.8 87.327 93.131 6.6 91 98
Carpets of felt 7.408 6.437 - 13.1 37.986 35.739 - 5.9 513 555
Other textiles 1.965.477 1.891.986 - 3.7 2.127.895 2.216.366 4.2 108 117
Wadding, felt, nonwovens,rubber thread, twine, cor-dage, etc.
296.932 301.989 1.7 465.297 496.455 6.7 157 164
o.w. felt 18.448 19.584 6.2 25.861 25.197 - 2.6 140 129
o.w. nonwovens 174.260 185.632 6.5 321.254 342.504 6.6 184 185
o.w. special yarn 8.024 8.008 - 0.2 4.216 4.556 8.1 53 57
o.w. twine, rope 29.294 28.580 - 2.4 41.708 51.638 23.8 142 181
o.w. nets 26.714 22.550 - 15.6 17.263 18.287 5.9 65 81
Handwoven tapestries &quilted products
658 606 - 7.9 2.060 1.299 - 36.9 313 215
Impregnated, coated, etc,,textile fabrics
218.717 210.501 - 3.8 197.442 187.382 - 5.1 90 89
o.w. tyre cord fabric 61.252 58.092 - 5.2 20.278 17.450 - 13.9 33 30
o.w. fabrics impregnated,coated etc,
97.450 96.787 - 0.7 89.297 91.416 2.4 92 94
o.w. textile products, articlesfor technical uses
12.237 12.526 2.4 40.154 31.927 - 20.5 328 255
Other made up textilearticles 889.636 839.705 - 5.6 1.271.079 1.330.185 4.7 143 158
o.w. sacks and bags 299.277 265.780 - 11.2 16.781 13.579 - 19.1 6 5
o.w. tarpaulins, sunblinds& alike
167.953 142.656 - 15.1 16.357 19.624 20.0 10 14
o.w. other : floorcloths,dishcloths etc
243.619 247.077 1.4 34.542 34.317 - 0.7 14 14
Worn clothing and otherworn articles
173.799 179.791 3.4 1.202.043 1.261.339 4.9 692 702
Home textiles 834.844 726.421 - 13.0 65.460 66.628 1.8 8 9
Bedlinen, table, toilet andkitchen linen
544.343 478.356 - 12.1 41.441 43.532 5.0 8 9
o.w. Bedlinen, woven 268.363 229.484 - 14.5 20.728 21.922 5.8 8 10
o.w. toilet linen 175.939 162.320 - 7.7 14.059 15.057 7.1 8 9
o.w. table linen, woven 42.189 36.546 - 13.4 3.192 3.222 0.9 8 9
Curtains 112.510 102.552 - 8.9 8.065 8.178 1.4 7 8
Other furnishing articles 85.594 65.802 - 23.1 9.359 7.396 - 21.0 11 11
Garments 4.346.435 3.855.245 - 11.3 369.876 376.592 1.8 9 10

8/13/2019 Euratex nr 2
http://slidepdf.com/reader/full/euratex-nr-2 49/214
BULLETIN 2013/2
49
EU 27 (External Trade) Textile and Clothing Trade 2011 - 2012 (continued)Country :
EXTRA EU-27Unit : Tone
IMPORTS EXPORTS Coverage E/I
2011 2012 Evol. % 2011 2012 Evol. % 2011 2012
Occupationals (woven) 115.320 92.973 - 19.4 7.914 7.963 0.6 7 9
Men’s ensembles 4.998 3.093 - 38.1 541 371 - 31.4 11 12
o.w. jackets 11.864 9.605 - 19.0 670 569 - 15.0 6 6
o.w. trousers 34.335 26.873 - 21.7 1.627 1.593 - 2.1 5 6
o.w. overalls 10.075 7.470 - 25.9 531 483 - 9.1 5 6
o.w. Others 29.417 22.999 - 21.8 3.112 3.207 3.1 11 14
Women’s ensembles 297 272 - 8.4 51 76 48.5 17 28
o.w. jackets 1.104 939 - 15.0 192 176 - 8.1 17 19
o.w. trousers 8.235 9.224 12.0 268 441 64.3 3 5
o.w. overalls 216 171 - 20.9 21 33 52.6 10 19
o.w. others 14.780 12.326 - 16.6 901 1.015 12.7 6 8
Men’s Clothing (knitted andwoven)
1.120.779 997.247 - 11.0 82.681 86.790 5.0 7 9
Overcoats 161.226 124.333 - 22.9 9.895 10.938 10.5 6 9o.w. woven 140.300 106.555 - 24.1 8.522 9.543 12.0 6 9
Suits 18.006 14.987 - 16.8 3.549 3.731 5.1 20 25
o.w. woven 16.362 13.209 - 19.3 3.377 3.444 2.0 21 26
Ensembles 15.933 12.131 - 23.9 3.966 2.737 - 31.0 25 23
o.w. woven 8.394 6.544 - 22.0 3.621 2.018 - 44.3 43 31
Jackets and blazers 50.564 47.384 - 6.3 4.591 5.919 28.9 9 12
o.w. woven 42.945 38.733 - 9.8 3.923 5.012 27.8 9 13
Trousers 469.478 434.243 - 7.5 32.482 35.179 8.3 7 8
o.w. woven 425.845 393.004 - 7.7 29.121 31.882 9.5 7 8
Shirts 231.349 210.760 - 8.9 13.416 14.223 6.0 6 7
o.w. woven 135.083 123.554 - 8.5 9.131 9.757 6.9 7 8
Underpants, briefs, etc. 116.196 107.441 - 7.5 7.892 6.711 - 15.0 7 6
o.w. knitted 95.380 89.120 - 6.6 6.523 5.179 - 20.6 7 6Swimwear 8.485 6.839 - 19.4 368 468 27.2 4 7
Tracksuits 18.899 14.862 - 21.4 2.473 2.933 18.6 13 20
Women’s Clothing (knittedand woven)
1.338.745 1.203.089 - 10.1 109.985 115.674 5.2 8 10
Overcoats 219.652 177.934 - 19.0 11.743 12.214 4.0 5 7
o.w. woven 176.885 143.197 - 19.0 9.563 10.407 8.8 5 7
Suits 5.855 6.721 14.8 1.345 1.335 - 0.7 23 20
o.w. woven 3.066 3.613 17.9 1.106 1.058 - 4.4 36 29
Ensembles 17.635 15.551 - 11.8 6.394 5.116 - 20.0 36 33
o.w. woven 6.448 6.373 - 1.2 5.617 3.914 - 30.3 87 61
Jackets 56.812 57.613 1.4 5.456 6.585 20.7 10 11
o.w. woven 41.404 42.532 2.7 4.409 5.033 14.1 11 12
Skirts and dresses 197.409 168.863 - 14.5 18.442 19.318 4.7 9 11
o.w. woven 119.365 100.570 - 15.7 11.465 11.790 2.8 10 12
Trousers 463.495 441.526 - 4.7 26.258 30.937 17.8 6 7
o.w. woven 327.205 314.411 - 3.9 20.358 22.981 12.9 6 7
Blouses 145.379 132.723 - 8.7 12.239 13.313 8.8 8 10
o.w. woven 86.312 77.204 - 10.6 7.049 8.025 13.9 8 10
Slips, petticoats, etc. 173.508 149.885 - 13.6 10.470 10.938 4.5 6 7
o.w. knitted 145.280 124.354 - 14.4 8.099 8.278 2.2 6 7
Swimwear 18.834 17.409 - 7.6 1.713 1.562 - 8.8 9 9
Tracksuits 23.740 21.083 - 11.2 5.953 5.050 - 15.2 25 24
Others (knitted and woven) 1.886.308 1.654.288 - 12.3 177.016 173.902 - 1.8 9 11
Babies’ garments 123.496 117.644 - 4.7 7.548 8.195 8.6 6 7
o.w. knitted or crocheted 88.142 79.201 - 10.1 5.058 5.603 10.8 6 7
T-shirts 540.061 500.708 - 7.3 39.363 38.682 - 1.7 7 8
Jerseys, pullovers, cardigans 573.616 471.905 - 17.7 32.468 34.269 5.5 6 7
Special garments 147.627 126.936 - 14.0 19.175 19.577 2.1 13 15
o.w. woven 139.395 120.510 - 13.5 17.471 17.570 0.6 13 15

8/13/2019 Euratex nr 2
http://slidepdf.com/reader/full/euratex-nr-2 50/214
BULLETIN 2013/2
50
EU 27 (External Trade) Textile and Clothing Trade 2011 - 2012 (continued)Country :
EXTRA EU-27Unit : Tone
IMPORTS EXPORTS Coverage E/I
2011 2012 Evol. % 2011 2012 Evol. % 2011 2012
Other garments, knitted orcrocheted
29.913 29.299 - 2.1 11.269 10.833 - 3.9 38 37
Gloves 95.625 77.432 - 19.0 3.069 3.484 13.5 3 4
Ties, bow ties, and cravats 7.616 7.357 - 3.4 1.905 1.685 - 11.5 25 23
Shawls, scarves, mufflers,mantillas, etc
66.098 57.838 - 12.5 4.325 4.191 - 3.1 7 7
Pantyhose, tights, stockings,socks, etc
197.013 173.411 - 12.0 28.529 25.922 - 9.1 14 15
Brassières, girdles, corsets,etc,
57.207 53.731 - 6.1 6.438 6.375 - 1.0 11 12
Other accessories 17.887 18.084 1.1 22.845 19.347 - 15.3 128 107
TOTAL Chapter 61 KnittedGarments
2.367.208 2.086.173 - 11.9 175.206 177.369 1.2 7 9
TOTAL Chapter 62 Woven
Garments
1.979.151 1.769.085 - 10.6 194.664 199.218 2.3 10 11
Total Clothing - (CH 61+62) 4.346.360 3.855.269 - 11.3 369.980 376.586 1.8 9 10
Total Textile - (CH 50-60+ 63)
6.657.347 6.166.267 - 7.4 4.351.926 4.611.248 6.0 65 75
Total 11.003.707 10.021.536 - 8.9 4.721.906 4.987.835 5.6 43 50

8/13/2019 Euratex nr 2
http://slidepdf.com/reader/full/euratex-nr-2 51/214
BULLETIN 2013/2
51
› EU EXTERNAL TRADE BY COUNTRIES -
TABLESARGENTINA 52
BANGLADESH 56
BANGLADESH – IN VOLUME 60
BRAZIL 64
CAMBODIA 68
CANADA 71
CHINA 75
CHINA – IN VOLUME 79
CEI/CIS (EXCLUDING RUSSIAAND BALTIC) 83
CROATIA 87
EGYPT 91
HONG-KONG 95
INDIA 99
INDIA – IN VOLUME 103
INDONESIA 107
JAPAN 111
LAOS 115
MALAYSIA 118
MEXICO 122
MONTENEGRO 126
MOROCCO 129
NORWAY 133
PAKISTAN 137
PHILIPPINES 141
RUSSIA 145
SERBIA 149
SINGAPORE 153
SOUTH AFRICA 157
SOUTH KOREA 161
SOUTH KOREA – IN VOLUME 165
SWITZERLAND 169
TAIWAN 173
TAIWAN – IN VOLUME 177
THAILAND 181
THAILAND – IN VOLUME 185
TUNISIA 189
TURKEY 193
USA 197
VIETNAM 201

8/13/2019 Euratex nr 2
http://slidepdf.com/reader/full/euratex-nr-2 52/214
BULLETIN 2013/2
52
(External Trade) Textile and Clothing Trade 2011 - 2012Country :
ArgentinaIMPORTS EXPORTS Coverage E/I
Unit : 1000 € 2011 2012 Evol. % 2011 2012 Evol. % 2011 2012
Natural fibers 115.352 59.072 - 48.8 197 222 12.8 0 0
Silk 0 0 0 38 8
Wool, fine or coarse animalhair
0 0 0 0 0
o.w. wool, not carded orcombed
96.232 56.283 - 41.5 179 114 - 36.4 0 0
o.w. wool and fine or coarseanimal hair
15.718 8.611 - 45.2 0 13 0 0
Cotton 77.126 44.565 - 42.2 0 0 0 0
Other vegetable fibres 19.120 2.788 - 85.4 0 0 0 0
o.w. flax 0 0 18 70 297.9
Man-made fibres 0 0 14 64 360.3
Synthetic filament tow 0 131 7.050 5.784 - 18.0 4
Artificial filament tow 0 0 6.106 4.056 - 33.6Synthetic staple fibres 0 0 0 1.094
Artificial staple fibres 0 0 339 468 37.9
Yarns and Threads 0 0 227 0 - 100.0
Silk 756 879 16.3 13.607 12.894 - 5.2 2 1
Wool 0 0 1 1 3.3
o.w. carded wool, n.p.r.s. 535 475 - 11.2 1.183 933 - 21.2 221 196
o.w. combed wool, n.p.r.s. 35 0 - 100.0 1.076 822 - 23.6 3
Cotton 354 330 - 6.7 8 111 1306.2 2 33
o.w. cotton yarn, n.p.r.s. 205 34 - 83.3 76 25 - 67.4 37 72
o.w. cotton yarn, p.r.s. 205 34 - 83.5 41 4 - 88.9 20 13
Other - Vegetable yarns 1 1 - 35.9 35 20 - 42.5 4 4
Man-made filaments yarns 0 0 375 360 - 3.8
o.w. sewing thread 15 335 2196.1 10.774 9.892 - 8.2 74 3o.w. synthetic filament yarn 0 0 243 219 - 9.7
o.w. artificial filament yarn 10 299 2967.5 8.819 7.850 - 11.0 91 3
o.w. synthetic monofilament 0 5 392 439 12.0 8
Man made staple yarns 1 31 5583.3 1.286 1.384 7.6 238 5
o.w. man made staple yarns,n.p.r.s.
2 35 2245.3 1.198 1.683 40.4 80 5
o.w. man made staple yarns,p.r.s.
0 35 1.164 1.607 38.0 5
Woven fabrics 2 0 - 100.0 34 76 120.0 2
Silk 37 30 - 18.6 12.484 11.100 - 11.1 34 37
Wool 0 1 10300.0 282 283 0.5 27
o.w. carded wool 9 1 - 83.6 1.120 1.797 60.4 13 127
o.w. combed wool 0 0 636 1.246 96.0
Cotton 9 1 - 83.6 470 534 13.7 5 38
o.w. cotton, unbleached 13 3 - 79.1 2.539 2.941 15.8 19 105
o.w. cotton, dyed 5 0 - 100.0 8 38 391.0 158
o.w. denim fabric 7 0 - 97.0 256 255 - 0.2 3 116
Other fabrics 0 0 366 587 60.4
o.w. flax 0 0 187 154 - 17.7
Synthetic and artificial fila-ment yarn
0 0 161 154 - 4.7
o.w. synthetic filament yarn 6 8 36.7 4.136 1.843 - 55.4 74 24
o.w. artificial filament yarn 6 8 37.2 3.863 1.628 - 57.9 69 21
Synthetic and artificialsstaple fibres
0 0 - 100.0 273 216 - 21.0
o.w. containing > 85% ofsynthetic
3 4 34.5 2.596 2.637 1.6 90 68

8/13/2019 Euratex nr 2
http://slidepdf.com/reader/full/euratex-nr-2 53/214
BULLETIN 2013/2
53
(External Trade) Textile and Clothing Trade 2011 - 2012 (continued)Country :
ArgentinaIMPORTS EXPORTS Coverage E/I
Unit : 1000 € 2011 2012 Evol. % 2011 2012 Evol. % 2011 2012
o.w. containing < 85% ofsynthetic
1 1 - 32.0 1.624 2.012 23.9 216 395
o.w. containing < 85% syn-thetic mixed natural fibres
0 0 271 146 - 45.9
o.w. other synthetics 0 0 422 100 - 76.2
o.w. artificial staple fibres 1 2 81.9 87 237 173.4 9 14
Special woven fabrics 1 2 38.8 192 141 - 26.6 16 8
o.w. pile fabrics 6 13 113.7 1.624 1.444 - 11.1 27 11
o.w. narrow woven fabrics 0 0 600 613 2.2
o.w. labels, badges 2 2 - 6.5 260 132 - 49.3 15 8
o.w. embroidery 1 1 - 33.1 376 323 - 14.1 26 33
Knitted fabrics 2 0 - 100.0 14 4 - 73.6 589
Pile fabrics 1 5 405.3 3.624 3.401 - 6.2 381 71
< 30 cm; w 5% or moreelastome
1 5 474.1 3.092 2.704 - 12.6 382 58
> 30 cm; w 5% or moreelastome
0 0 46 54 16.6
Curtain fabrics and raschellace
0 0 108 123 14.4 82
Other fabrics 0 0 168 212 26.5
Carpets 0 0 - 100.0 211 308 45.9 151
Knotted carpets 90 102 14.3 1.941 1.858 - 4.2 2 2
Woven carpets 4 4 13.7 3 0 - 100.0 86 0
Tufted carpets 18 17 - 4.1 385 348 - 9.5 2 2
Carpets of felt 17 13 - 24.8 813 1.118 37.6 5 9
Other textiles 1 0 - 100.0 516 245 - 52.5 88
Wadding, felt, nonwovens,
rubber thread, twine, cor-dage, etc.
998 893 - 10.5 26.767 26.603 - 0.6 3 3
o.w. felt 41 55 33.0 10.061 8.252 - 18.0 24 15
o.w. nonwovens 0 0 955 1.017 6.5
o.w. special yarn 40 54 35.9 5.245 3.317 - 36.8 13 6
o.w. twine, rope 0 0 257 97 - 62.2
o.w. nets 0 1 80.6 844 1.370 62.3 235 211
Handwoven tapestries &quilted products
1 1 - 28.0 330 314 - 5.0 44 58
Impregnated, coated, etc,,textile fabrics
0 0 0 6 7675.0
o.w. tyre cord fabric 581 533 - 8.2 10.303 12.176 18.2 2 2
o.w. fabrics impregnated,coated etc,
402 361 - 10.1 454 345 - 24.0 113 95
o.w. textile products, articlesfor technical uses 17 30 76.8 3.033 3.034 0.0 18 10
Other made up textilearticles
95 68 - 28.5 3.941 4.371 10.9 4 6
o.w. sacks and bags 261 294 12.4 1.146 1.097 - 4.3 439 373
o.w. tarpaulins, sunblinds& alike
4 6 62.4 19 102 439.1 488 2
o.w. other : floorcloths,dishcloths etc
161 112 - 30.5 51 61 19.2 32 55
Worn clothing and otherworn articles
69 161 132.9 849 755 - 11.0 1 470
Home textiles 28 15 - 47.2 227 178 - 21.5 825 1
Bedlinen, table, toilet andkitchen linen
63 32 - 49.1 1.015 876 - 13.7 2 3
o.w. Bedlinen, woven 28 15 - 48.2 470 573 21.9 2 4
o.w. toilet linen 2 14 614.6 144 48 - 66.2 7 342
o.w. table linen, woven 0 0 - 23.8 14 17 15.4 3 5
Curtains 2 0 - 91.9 22 20 - 9.2 1 13
Other furnishing articles 0 0 - 100.0 373 194 - 47.9 233

8/13/2019 Euratex nr 2
http://slidepdf.com/reader/full/euratex-nr-2 54/214
BULLETIN 2013/2
54
(External Trade) Textile and Clothing Trade 2011 - 2012 (continued)Country :
ArgentinaIMPORTS EXPORTS Coverage E/I
Unit : 1000 € 2011 2012 Evol. % 2011 2012 Evol. % 2011 2012
Garments 11 0 - 96.1 86 10 - 87.9 773 2
Occupationals (woven) 2.883 1.643 - 43.0 19.214 15.901 - 17.2 666 968
Men’s ensembles 15 24 58.5 197 123 - 37.5 1 507
Men's jackets 0 0 12 0 - 99.8
Men's trousers 0 0 0 0 192.3
Men's overalls 0 0 5 1 - 75.2 3
Other men's occupationals 15 24 57.4 160 97 - 39.7 1 405
Women's ensembles 0 0 0 0 0
Women's trousers 0 0 0 5
Women's overalls 0 0 18 19 5.4
Other women's occupation-nals
0 0 - 71.4 2 1 - 43.0 852 2
Men’s Clothing (knitted and
woven)663 387 - 41.6 4.801 4.364 - 9.1 724 1
Overcoats 9 4 - 57.9 527 379 - 28.1 6 10
o.w. woven 1 3 226.9 467 337 - 27.7 60 13
Suits 34 1 - 98.4 510 497 - 2.5 1 92
o.w. woven 34 0 - 98.6 510 497 - 2.5 1 101
Ensembles 35 3 - 92.6 356 414 16.3 1 16
o.w. woven 6 1 - 80.7 289 77 - 73.5 5 7
Jackets and blazers 18 30 62.1 575 771 34.2 3 3
o.w. woven 10 15 53.8 511 594 16.3 5 4
Trousers 119 52 - 56.3 1.468 1.380 - 6.0 1 3
o.w. woven 61 17 - 72.8 1.458 1.351 - 7.3 2 8
Shirts 336 231 - 31.1 1.117 727 - 34.9 333 315
o.w. woven 157 65 - 58.8 952 609 - 36.0 605 940
Underpants, briefs, etc. 14 32 126.2 28 7 - 74.2 193 22o.w. knitted 11 29 172.4 26 7 - 73.6 239 23
Swimwear 2 1 - 34.0 4 17 368.5 197 1
Tracksuits 80 4 - 94.5 33 42 27.9 41 960
Women’s Clothing (knittedand woven)
421 320 - 23.9 7.838 6.517 - 16.8 2 2
Overcoats 22 15 - 33.8 552 752 36.3 2 5
o.w. woven 6 3 - 44.9 451 715 58.7 8 23
Suits 0 12 102 92 - 10.2 797
o.w. woven 0 0 102 92 - 10.2 22
Ensembles 28 4 - 86.3 103 317 207.2 371 8
o.w. woven 22 3 - 84.1 103 315 205.9 474 9
Jackets 34 16 - 51.5 1.014 926 - 8.6 3 6
o.w. woven 21 13 - 40.1 971 910 - 6.3 5 7
Skirts and dresses 130 68 - 47.3 1.884 1.257 - 33.3 1 2
o.w. woven 119 55 - 53.8 1.362 928 - 31.9 1 2
Trousers 40 35 - 12.8 1.765 1.065 - 39.7 4 3
o.w. woven 35 32 - 10.7 1.482 877 - 40.8 4 3
Blouses 59 90 53.5 1.755 1.658 - 5.5 3 2
o.w. woven 30 24 - 19.1 1.588 1.400 - 11.9 5 6
Slips, petticoats, etc. 45 29 - 35.9 30 41 37.6 67 143
o.w. knitted 43 21 - 51.0 21 41 90.0 50 193
Swimwear 52 26 - 49.6 138 78 - 43.3 265 298
Tracksuits 10 15 38.6 395 84 - 78.7 4 580
Others (knitted and woven) 1.799 935 - 48.0 6.576 5.006 - 23.9 366 535
Babies’ garments 10 9 - 7.5 185 90 - 51.6 2 960
o.w. knitted or crocheted 9 8 - 18.0 120 71 - 41.4 1 917
T-shirts 683 545 - 20.3 1.087 485 - 55.4 159 89
Jerseys, pullovers, cardigans 99 53 - 46.5 1.912 1.514 - 20.8 2 3
Special garments 39 24 - 39.6 1.044 886 - 15.2 3 4
o.w. woven 39 22 - 42.5 503 683 35.9 1 3

8/13/2019 Euratex nr 2
http://slidepdf.com/reader/full/euratex-nr-2 55/214
BULLETIN 2013/2
55
(External Trade) Textile and Clothing Trade 2011 - 2012 (continued)Country :
ArgentinaIMPORTS EXPORTS Coverage E/I
Unit : 1000 € 2011 2012 Evol. % 2011 2012 Evol. % 2011 2012
Other garments, knitted orcrocheted
816 134 - 83.6 129 237 83.9 16 177
Gloves 12 24 95.7 227 97 - 57.3 2 402
Ties, bow ties, and cravats 12 20 68.6 523 359 - 31.2 4 2
Shawls, scarves, mufflers,mantillas, etc
36 57 58.2 724 489 - 32.5 2 859
Pantyhose, tights, stockings,socks, etc
63 51 - 18.3 535 518 - 3.0 854 1
Brassières, girdles, corsets,etc,
20 3 - 84.2 50 204 312.0 252 7
Other accessories 16 21 30.3 56 69 22.4 344 324
TOTAL Chapter 61 KnittedGarments
2.163 1.236 - 42.8 6.241 4.883 - 21.8 288 395
TOTAL Chapter 62 Woven
Garments720 407 - 43.5 12.974 11.017 - 15.1 2 3
Total Clothing - (CH 61+62) 2.883 1.643 - 43.0 19.218 15.900 - 17.3 667 968
Total Textile - (CH 50-60+ 63)
117.297 61.155 - 47.9 67.859 64.750 - 4.6 58 106
Total 120.180 62.798 - 47.7 87.078 80.650 - 7.4 72 128

8/13/2019 Euratex nr 2
http://slidepdf.com/reader/full/euratex-nr-2 56/214
BULLETIN 2013/2
56
(External Trade) Textile and Clothing Trade 2011 - 2012Country :
BangladeshIMPORTS EXPORTS Coverage E/I
Unit : 1000 € 2011 2012 Evol. % 2011 2012 Evol. % 2011 2012
Natural fibers 5.729 4.810 - 16.0 3.579 16.414 358.7 62 341
Silk 0 0 0 1
Wool, fine or coarse animalhair
2 28 1437.8 0 6 0 22
o.w. wool, not carded orcombed
0 0 0 6
o.w. wool and fine or coarseanimal hair
2 28 1454.6 0 0 0 0
Cotton 2.104 935 - 55.6 3.271 15.198 364.7 155 1,625
Other vegetable fibres 3.623 3.846 6.2 308 1.209 292.8 8 31
o.w. flax 0 14 308 1.209 292.8 8,932
Man-made fibres 0 0 11.717 14.114 20.5
Synthetic filament tow 0 0 9.786 13.780 40.8
Synthetic staple fibres 0 0 1.793 296 - 83.5Artificial staple fibres 0 0 125 0 - 99.8
Yarns and Threads 30.361 18.640 - 38.6 4.923 7.781 58.1 16 42
Wool 151 0 - 100.0 1.260 2.514 99.6 833
o.w. carded wool, n.p.r.s. 0 0 840 1.708 103.4
o.w. combed wool, n.p.r.s. 151 0 - 100.0 391 768 96.6 259
Cotton 755 811 7.3 1.480 1.351 - 8.8 196 167
o.w. cotton yarn, n.p.r.s. 755 811 7.3 1.478 1.319 - 10.7 196 163
o.w. cotton yarn, p.r.s. 0 0 3 31 1130.0 20,747
Other - Vegetable yarns 29.449 17.554 - 40.4 42 11 - 74.6 0 0
Man-made filaments yarns 5 3 - 30.0 525 751 43.1 10,582 21,648
o.w. sewing thread 4 0 - 93.5 155 165 6.2 3,507 56,866
o.w. synthetic filament yarn 0 0 256 510 99.3
o.w. artificial filament yarn 0 3 94 40 - 57.2 1,266o.w. synthetic monofilament 1 0 - 100.0 19 36 84.3 3,674
Man made staple yarns 0 271 1.616 3.155 95.2 1,163
o.w. man made staple yarns,n.p.r.s.
0 248 1.524 3.128 105.3 1,259
o.w. man made staple yarns,p.r.s.
0 23 92 26 - 71.3 76,733 116
Woven fabrics 12.996 11.701 - 10.0 12.043 13.833 14.9 93 118
Silk 2 7 180.5 17 10 - 39.1 724 157
Wool 0 40 1.189 1.601 34.6 3,962
o.w. carded wool 0 0 1.189 1.447 21.7
o.w. combed wool 0 40 0 154 382
Cotton 3.483 2.877 - 17.4 7.259 6.323 - 12.9 208 220
o.w. cotton, unbleached 1.086 860 - 20.8 29 26 - 10.7 3 3
o.w. cotton, dyed 1.196 655 - 45.3 2.918 2.799 - 4.1 244 427
o.w. denim fabric 322 93 - 71.0 540 948 75.8 168 1,016
Other fabrics 8.569 7.706 - 10.1 293 246 - 15.9 3 3
o.w. flax 0 0 293 246 - 15.9
Synthetic and artificial fila-ment yarn
114 238 109.0 617 444 - 28.0 542 187
o.w. synthetic filament yarn 114 237 108.8 602 348 - 42.2 529 146
o.w. artificial filament yarn 0 0 15 96 549.9 45,929
Synthetic and artificialsstaple fibres
117 74 - 37.0 1.136 2.442 115.0 970 3,311
o.w. containing > 85% ofsynthetic
0 0 1166.7 39 49 26.1 129,433 12,887
o.w. containing < 85% ofsynthetic
116 68 - 41.2 374 177 - 52.8 322 258
o.w. containing < 85% syn-thetic mixed natural fibres
0 3 366 1.566 328.3 58,013
o.w. other synthetics 0 2 448.5 310 458 47.8 93,976 25,327

8/13/2019 Euratex nr 2
http://slidepdf.com/reader/full/euratex-nr-2 57/214
BULLETIN 2013/2
57
(External Trade) Textile and Clothing Trade 2011 - 2012 (continued)Country :
BangladeshIMPORTS EXPORTS Coverage E/I
Unit : 1000 € 2011 2012 Evol. % 2011 2012 Evol. % 2011 2012
o.w. artificial staple fibres 0 0 53.3 46 192 312.5 15,48 41,646
Special woven fabrics 135 347 156.5 1.533 2.766 80.5 1,133 797
o.w. pile fabrics 47 183 291.2 342 32 - 90.6 729 17
o.w. narrow woven fabrics 21 35 64.4 246 204 - 17.2 1,146 577
o.w. labels, badges 29 48 67.6 879 2.462 180.2 3,042 5,087
o.w. embroidery 1 55 4034.8 24 32 34.3 1,783 58
Knitted fabrics 66 62 - 7.2 186 248 33.2 280 402
Pile fabrics 0 21 41000.0 32 49 53.2 63,92 238
< 30 cm; w 5% or moreelastome
1 0 - 100.0 52 44 - 14.4 5,929
> 30 cm; w 5% or moreelastome
2 1 - 24.7 6 40 539.6 337 2,864
Curtain fabrics and raschel
lace
0 0 77 78 2.2 27,003
Other fabrics 64 39 - 38.0 20 37 84.2 31 93
Carpets 2.338 2.535 8.4 2 21 1096.0 0 1
Knotted carpets 0 0 1 14 974.6
Woven carpets 2.242 2.318 3.4 0 0 - 100.0 0 0
Tufted carpets 42 134 215.4 0 7 0 5
Other textiles 45.201 49.272 9.0 5.294 6.255 18.2 12 13
Wadding, felt, nonwovens,rubber thread, twine, cor-dage, etc.
367 254 - 31.0 624 831 33.3 170 328
o.w. felt 8 9 24.1 2 20 1154.7 21 213
o.w. nonwovens 9 32 270.3 282 140 - 50.2 3,28 441
o.w. special yarn 0 0 76 39 - 48.8
o.w. twine, rope 304 133 - 56.1 49 68 39.2 16 51
o.w. nets 18 27 54.8 119 297 150.0 675 1,09
Handwoven tapestries &quilted products
5 1 - 86.4 136 0 - 100.0 2,685 0
Impregnated, coated, etc,,textile fabrics
47 63 33.4 3.614 4.334 19.9 7,645 6,874
o.w. tyre cord fabric 0 0 - 100.0 310 293 - 5.4 238,546
o.w. fabrics impregnated,coated etc,
47 63 33.0 1.458 1.935 32.7 3,101 3,095
o.w. textile products, articlesfor technical uses
0 1 1666.7 1.055 1.549 46.8 3,516,467 292,226
Other made up textilearticles
44.781 48.916 9.2 841 744 - 11.5 2 2
o.w. sacks and bags 31.962 31.478 - 1.5 103 64 - 37.8 0 0
o.w. tarpaulins, sunblinds& alike
5.247 9.568 82.3 170 568 233.9 3 6
o.w. other : floorcloths,dishcloths etc
5.260 5.188 - 1.4 514 55 - 89.4 10 1
Worn clothing and otherworn articles
2.302 2.682 16.5 53 37 - 30.8 2 1
Home textiles 293.146 224.949 - 23.3 6 651 11586.9 0 0
Bedlinen, table, toilet andkitchen linen
278.424 212.504 - 23.7 2 607 40129.8 0 0
o.w. Bedlinen, woven 241.792 181.215 - 25.1 1 607 0 0
o.w. toilet linen 30.225 29.121 - 3.7 0 0 - 35.3 0 0
o.w. table linen, woven 1.121 1.207 7.7 0 0 0 0
Curtains 11.854 10.624 - 10.4 0 0 0 0
Other furnishing articles 2.433 1.812 - 25.5 0 40 0 2
Garments 7.589.551 8.249.205 8.7 3.674 4.581 24.7 0 0
Occupationals (woven) 18.441 19.155 3.9 367 1.216 231.2 2 6Men’s ensembles 584 1.838 214.9 40 92 130.3 7 5
Men’s jackets 2.887 1.193 - 58.7 2 0 - 92.0 0 0

8/13/2019 Euratex nr 2
http://slidepdf.com/reader/full/euratex-nr-2 58/214

8/13/2019 Euratex nr 2
http://slidepdf.com/reader/full/euratex-nr-2 59/214
BULLETIN 2013/2
59
(External Trade) Textile and Clothing Trade 2011 - 2012 (continued)Country :
BangladeshIMPORTS EXPORTS Coverage E/I
Unit : 1000 € 2011 2012 Evol. % 2011 2012 Evol. % 2011 2012
Gloves 1.410 2.452 73.9 1 1 11.2 0 0
Ties, bow ties, and cravats 908 956 5.3 10 8 - 19.1 1 1
Shawls, scarves, mufflers,mantillas, etc
5.468 4.755 - 13.0 19 3 - 81.5 0 0
Pantyhose, tights, stockings,socks, etc
3.428 4.701 37.2 3 2 - 41.8 0 0
Brassières, girdles, corsets,etc,
38.118 55.890 46.6 0 0 0 0
Other accessories 994 1.071 7.7 1.385 2.297 65.9 139 215
TOTAL Chapter 61 KnittedGarments
5.064.111 5.071.838 0.2 437 251 - 42.6 0 0
TOTAL Chapter 62 WovenGarments
2.525.440 3.177.598 25.8 3.238 4.331 33.8 0 0
Total Clothing 7.589.551 8.249.436 8.7 3.674 4.581 24.7 0 0
Total Textile 389.837 311.973 - 20.0 46.124 70.542 52.9 12 23
Total 7.979.388 8.561.409 7.3 49.799 75.123 50.9 1 1

8/13/2019 Euratex nr 2
http://slidepdf.com/reader/full/euratex-nr-2 60/214
BULLETIN 2013/2
60
(External Trade) Textile and Clothing Trade 2011 - 2012Country :
BangladeshIMPORTS EXPORTS Coverage E/I
Unit : Tone 2011 2012 Evol. % 2011 2012 Evol. % 2011 2012
Natural fibers 7.306 6.382 - 12.7 1.521 10.488 589.4 21 164
Silk 0 0 0 0
Wool, fine or coarse animalhair
0 3 0 4 134
o.w. wool, not carded orcombed
0 0 0 4
o.w. wool and fine or coarseanimal hair
0 3 0 0 0
Cotton 1.933 1.159 - 40.0 1.416 10.136 615.5 73 874
Other vegetable fibres 5.374 5.220 - 2.9 105 349 232.5 2 7
o.w. flax 0 18 105 349 232.5 1,96
Man-made fibres 0 0 5.975 7.519 25.8
Synthetic filament tow 0 0 4.682 7.259 55.0
Synthetic staple fibres 0 0 1.214 212 - 82.6Artificial staple fibres 0 0 59 0 - 100.0
Yarns and Threads 28.798 20.418 - 29.1 622 913 46.8 2 4
Wool 14 0 - 100.0 95 126 32.1 705
o.w. carded wool, n.p.r.s. 0 0 64 89 39.8
o.w. combed wool, n.p.r.s. 14 0 - 100.0 19 33 79.0 138
Cotton 506 543 7.2 287 346 20.8 57 64
o.w. cotton yarn, n.p.r.s. 506 543 7.2 287 343 19.6 57 63
o.w. cotton yarn, p.r.s. 0 0 0 4 3600.0
Other - Vegetable yarns 28.277 19.800 - 30.0 1 2 185.7 0 0
Man-made filaments yarns 1 1 14.3 87 105 20.3 12,443 13,1
o.w. sewing thread 1 0 - 50.0 4 3 - 17.9 650 1,067
o.w. synthetic filament yarn 0 0 49 94 90.1
o.w. artificial filament yarn 0 1 33 5 - 84.4 1,02o.w. synthetic monofilament 0 0 - 100.0 1 3 116.7 1,2
Man made staple yarns 0 75 153 335 118.9 448
o.w. man made staple yarns,n.p.r.s.
0 68 149 333 123.1 489
o.w. man made staple yarns,p.r.s.
0 7 4 2 - 51.4 27
Woven fabrics 6.902 6.322 - 8.4 959 1.022 6.5 14 16
Silk 0 0 1 0 - 100.0
Wool 0 0 112 142 27.3 142,1
o.w. carded wool 0 0 112 136 22.0
o.w. combed wool 0 0 0 6 6
Cotton 777 652 - 16.1 617 509 - 17.5 79 78
o.w. cotton, unbleached 232 239 2.8 3 2 - 34.6 1 1
o.w. cotton, dyed 271 137 - 49.6 264 251 - 4.6 97 184
o.w. denim fabric 71 28 - 59.9 70 85 20.5 100 299
Other fabrics 5.854 5.302 - 9.4 9 8 - 8.0 0 0
o.w. flax 0 0 9 8 - 8.0
Synthetic and artificial fila-ment yarn
39 102 158.8 58 28 - 52.1 148 27
o.w. synthetic filament yarn 39 102 158.8 58 23 - 59.8 147 23
o.w. artificial filament yarn 0 0 0 5 1050.0
Synthetic and artificialsstaple fibres
26 11 - 58.0 94 266 182.7 359 2,418
o.w. containing > 85% ofsynthetic
0 0 2 2 10.0
o.w. containing < 85% ofsynthetic
26 11 - 58.8 27 8 - 70.6 101 72
o.w. containing < 85% syn-thetic mixed natural fibres
0 0 31 216 591.3 215,7
o.w. other synthetics 0 0 30 26 - 13.9 26

8/13/2019 Euratex nr 2
http://slidepdf.com/reader/full/euratex-nr-2 61/214
BULLETIN 2013/2
61
(External Trade) Textile and Clothing Trade 2011 - 2012 (continued)Country :
BangladeshIMPORTS EXPORTS Coverage E/I
Unit : Tone 2011 2012 Evol. % 2011 2012 Evol. % 2011 2012
o.w. artificial staple fibres 0 0 4 14 240.5
Special woven fabrics 48 157 228.9 68 69 0.6 143 44
o.w. pile fabrics 31 136 339.5 34 0 - 99.1 110 0
o.w. narrow woven fabrics 7 10 40.6 16 12 - 23.6 228 124
o.w. labels, badges 1 3 211.1 18 56 206.0 2,044 2,011
o.w. embroidery 0 4 0 0 0.0 2
Knitted fabrics 19 5 - 75.7 36 56 55.4 196 1,253
Pile fabrics 0 1 6 6 - 1.6 508
< 30 cm; w 5% or moreelastome
0 0 - 100.0 21 37 77.4 20,8
> 30 cm; w 5% or moreelastome
0 0 100.0 0 1 100.0 300 300
Curtain fabrics and raschel
lace
0 0 8 8 5.1
Other fabrics 18 3 - 83.1 1 5 283.3 7 148
Carpets 1.216 911 - 25.1 0 2 1400.0 0 0
Knotted carpets 0 0 0 0
Woven carpets 1.144 864 - 24.5 0 0 - 100.0 0 0
Tufted carpets 42 28 - 33.3 0 1 0 4
Other textiles 25.940 26.623 2.6 676 780 15.4 3 3
Wadding, felt, nonwovens,rubber thread, twine, cor-dage, etc.
256 210 - 18.0 122 98 - 19.8 48 47
o.w. felt 2 4 100.0 0 0 0 7
o.w. nonwovens 9 12 33.0 35 17 - 50.7 384 142
o.w. special yarn 0 0 1 2 250.0
o.w. twine, rope 221 108 - 50.9 10 7 - 36.5 5 6
o.w. nets 7 4 - 36.9 62 28 - 55.0 954 680
Handwoven tapestries &quilted products
3 0 - 96.6 1 0 - 100.0 34 0
Impregnated, coated, etc,,textile fabrics
20 17 - 11.7 492 553 12.4 2,496 3,178
o.w. tyre cord fabric 0 0 373 415 11.3
o.w. fabrics impregnated,coated etc,
20 17 - 11.7 47 64 36.9 237 367
o.w. textile products, articlesfor technical uses
0 0 54 57 4.2
Other made up textilearticles
25.661 26.380 2.8 59 118 99.2 0 0
o.w. sacks and bags 19.298 18.498 - 4.1 2 23 940.9 0 0
o.w. tarpaulins, sunblinds& alike
1.229 1.780 44.8 21 48 124.9 2 3
o.w. other : floorcloths,dishcloths etc
1.268 1.231 - 2.9 7 2 - 72.6 1 0
Worn clothing and otherworn articles
3.864 4.871 26.1 29 44 52.4 1 1
Home textiles 45.341 38.127 - 15.9 0 91 90900.0 0 0
Bedlinen, table, toilet andkitchen linen
42.711 35.806 - 16.2 0 91 0 0
o.w. Bedlinen, woven 35.266 28.968 - 17.9 0 91 0 0
o.w. toilet linen 6.492 6.405 - 1.3 0 0 0 0
o.w. table linen, woven 222 252 13.6 0 0 0 0
Curtains 2.320 2.059 - 11.3 0 0 0 0
Other furnishing articles 323 305 - 5.4 0 0 0 0
Garments 645.650 664.040 2.8 258 234 - 9.3 0 0
Occupationals (woven) 1.895 1.441 - 24.0 15 44 196.6 1 3Men’s ensembles 76 125 65.0 3 5 65.5 4 4
Men’s jackets 281 73 - 74.1 0 0 - 100.0 0 0

8/13/2019 Euratex nr 2
http://slidepdf.com/reader/full/euratex-nr-2 62/214
BULLETIN 2013/2
62
(External Trade) Textile and Clothing Trade 2011 - 2012 (continued)Country :
BangladeshIMPORTS EXPORTS Coverage E/I
Unit : Tone 2011 2012 Evol. % 2011 2012 Evol. % 2011 2012
Men’s trousers 563 531 - 5.6 10 29 193.8 2 5
Men’s overalls 451 78 - 82.7 1 10 716.7 0 13
Other men’s occupationals 244 313 28.3 1 1 12.5 0 0
Women’s ensembles 7 11 66.2 0 0 0 0
Women’s jackets 33 20 - 38.5 0 0 0 0
Women’s trousers 133 138 3.5 0 0 0 0
Women’s overalls 1 0 - 100.0 0 0 0
Other women’s occupation-nals
108 152 41.0 0 0 0.0 0 0
Men’s Clothing (knitted andwoven)
181.225 196.756 8.6 84 80 - 4.7 0 0
Overcoats 4.667 6.377 36.7 9 10 14.1 0 0
o.w. woven 2.726 4.395 61.2 9 9 10.6 0 0
Suits 102 56 - 45.6 0 0 0 0o.w. woven 71 44 - 38.2 0 0 0 0
Ensembles 450 585 30.1 3 5 65.5 1 1
o.w. woven 134 195 46.1 3 5 65.5 2 2
Jackets and blazers 1.328 891 - 32.9 0 0 - 100.0 0 0
o.w. woven 1.033 670 - 35.1 0 0 - 100.0 0 0
Trousers 94.066 104.286 10.9 47 40 - 14.4 0 0
o.w. woven 89.121 98.236 10.2 47 40 - 13.3 0 0
Shirts 71.504 73.168 2.3 22 24 7.7 0 0
o.w. woven 35.144 38.783 10.4 22 22 - 0.9 0 0
Underpants, briefs, etc. 7.897 10.024 26.9 2 0 - 100.0 0 0
o.w. knitted 7.310 9.121 24.8 2 0 - 100.0 0 0
Swimwear 503 622 23.7 0 0 0 0
Tracksuits 448 429 - 4.4 0 0 0 0Women’s Clothing (knittedand woven)
114.695 133.076 16.0 54 27 - 50.2 0 0
Overcoats 8.532 8.672 1.6 0 0 0 0
o.w. woven 2.627 2.932 11.6 0 0 0 0
Suits 99 142 43.0 0 0 0 0
o.w. woven 44 84 92.9 0 0 0 0
Ensembles 358 377 5.3 0 0 - 100.0 0 0
o.w. woven 81 55 - 32.3 0 0 - 100.0 0 0
Jackets 1.432 2.134 49.0 0 0 0 0
o.w. woven 837 1.442 72.4 0 0 0 0
Skirts and dresses 12.397 12.360 - 0.3 0 0 0 0
o.w. woven 4.138 4.702 13.6 0 0 0 0
Trousers 62.029 76.677 23.6 35 23 - 34.8 0 0
o.w. woven 41.023 52.075 26.9 34 23 - 33.2 0 0
Blouses 18.311 19.503 6.5 0 0 - 100.0 0 0
o.w. woven 7.296 8.164 11.9 0 0 0 0
Slips, petticoats, etc. 10.551 11.825 12.1 0 0 0 0
o.w. knitted 10.154 11.328 11.6 0 0 0 0
Swimwear 208 365 75.6 0 0 0 0
Tracksuits 602 863 43.5 19 4 - 80.7 3 0
Others (knitted and woven) 349.730 334.207 - 4.4 120 127 6.0 0 0
Babies’ garments 14.743 16.086 9.1 8 1 - 84.4 0 0
o.w. knitted or crocheted 10.279 11.085 7.8 0 1 250.0 0 0
T-shirts 197.562 194.267 - 1.7 1 5 575.0 0 0
Jerseys, pullovers, cardigans 129.449 115.081 - 11.1 28 12 - 58.5 0 0
Special garments 1.811 1.814 0.2 5 4 - 27.5 0 0
o.w. woven 1.783 1.801 1.0 5 4 - 27.5 0 0
Other garments, knitted orcrocheted
2.087 2.409 15.4 2 0 - 95.7 0 0

8/13/2019 Euratex nr 2
http://slidepdf.com/reader/full/euratex-nr-2 63/214
BULLETIN 2013/2
63
(External Trade) Textile and Clothing Trade 2011 - 2012 (continued)Country :
BangladeshIMPORTS EXPORTS Coverage E/I
Unit : Tone 2011 2012 Evol. % 2011 2012 Evol. % 2011 2012
Gloves 347 461 33.0 0 0 0 0
Ties, bow ties, and cravats 64 80 25.1 2 2 - 15.0 3 2
Shawls, scarves, mufflers,mantillas, etc
507 435 - 14.2 2 0 - 88.2 0 0
Pantyhose, tights, stockings,socks, etc
335 481 43.5 0 0 0 0
Brassières, girdles, corsets,etc,
1.561 1.946 24.7 0 0 0 0
Other accessories 97 99 2.4 74 105 41.6 76 106
TOTAL Chapter 61 KnittedGarments
450.397 439.530 - 2.4 39 23 - 42.2 0 0
TOTAL Chapter 62 WovenGarments
195.241 224.529 15.0 219 211 - 3.3 0 0
Total Clothing 645.638 664.058 2.9 258 234 - 9.2 0 0
Total Textile 115.521 98.788 - 14.5 12.278 24.542 99.9 11 25
Total 761.159 762.846 0.2 12.536 24.776 97.6 2 3

8/13/2019 Euratex nr 2
http://slidepdf.com/reader/full/euratex-nr-2 64/214
BULLETIN 2013/2
64
(External Trade) Textile and Clothing Trade 2011 - 2012Country :
BrazilIMPORTS EXPORTS Coverage E/I
Unit : 1000 € 2011 2012 Evol. % 2011 2012 Evol. % 2011 2012
Natural fibers 42.951 39.743 - 7.5 2.224 3.657 64.4 5 9
Silk 5.592 7.141 27.7 272 54 - 80.1 5 1
o.w. raw silk 5.592 7.141 27.7 202 1 - 99.4 4 0
Wool, fine or coarse animalhair
10.033 6.321 - 37.0 5 0 - 99.4 0 0
o.w. wool, not carded orcombed
463 821 77.2 0 0 0 0
o.w. wool and fine or coarseanimal hair
9.190 5.260 - 42.8 5 0 - 99.4 0 0
Cotton 22.935 21.977 - 4.2 344 1.077 213.2 1 5
Other vegetable fibres 4.392 4.303 - 2.0 1.603 2.526 57.5 37 59
o.w. flax 413 226 - 45.3 1.549 2.516 62.4 376 1,114
Man-made fibres 3.070 2.184 - 28.9 21.930 15.708 - 28.4 714 719
Synthetic filament tow 1.691 1.880 11.2 8.487 2.638 - 68.9 502 140Artificial filament tow 37 40 8.5 32 96 200.7 88 243
Synthetic staple fibres 1.045 92 - 91.2 5.577 3.989 - 28.5 534 4,339
Artificial staple fibres 140 95 - 32.6 6.600 8.526 29.2 4,701 9,015
Yarns and Threads 4.680 7.422 58.6 54.521 83.531 53.2 1,165 1,125
Silk 2.997 5.842 94.9 85 13 - 85.0 3 0
Wool 0 1 206 55 - 73.3 4,915
o.w. carded wool, n.p.r.s. 0 0 25 12 - 54.0 4,485
o.w. combed wool, n.p.r.s. 0 0 152 14 - 90.5
Cotton 44 58 31.7 764 352 - 53.9 1,749 612
o.w. cotton yarn, n.p.r.s. 22 27 24.2 673 317 - 52.8 3,119 1,184
o.w. cotton yarn, p.r.s. 22 31 39.0 91 35 - 62.0 412 113
Other - Vegetable yarns 275 414 50.6 502 442 - 12.0 183 107
Man-made filaments yarns 1.316 956 - 27.3 31.758 51.809 63.1 2,413 5,418o.w. sewing thread 30 86 189.6 501 146 - 71.0 1,68 168
o.w. synthetic filament yarn 1.252 852 - 32.0 25.815 43.139 67.1 2,062 5,064
o.w. artificial filament yarn 11 0 - 100.0 1.122 3.933 250.6 10,684
o.w. synthetic monofilament 24 14 - 38.8 4.225 4.589 8.6 17,866 31,712
Man made staple yarns 48 152 215.7 21.206 30.861 45.5 44,015 20,287
o.w. man made staple yarns,n.p.r.s.
48 152 215.5 20.986 30.469 45.2 43,657 20,092
o.w. man made staple yarns,p.r.s.
0 0 327.3 221 392 77.7 200,473 83,374
Woven fabrics 15.154 11.936 - 21.2 40.330 48.373 19.9 266 405
Silk 11 1 - 87.8 1.369 1.698 24.0 12,37 125,788
Wool 36 28 - 22.9 3.607 4.160 15.3 9,888 14,794
o.w. carded wool 7 8 7.4 779 1.063 36.4 10,447 13,272
o.w. combed wool 29 20 - 30.7 2.828 3.086 9.1 9,745 15,348
Cotton 8.055 6.724 - 16.5 13.403 15.590 16.3 166 232
o.w. cotton, unbleached 24 15 - 38.0 798 299 - 62.5 3,376 2,044
o.w. cotton, dyed 505 406 - 19.5 776 754 - 2.9 154 186
o.w. denim fabric 2.220 1.830 - 17.6 79 335 322.4 4 18
Other fabrics 179 212 18.5 476 497 4.5 266 234
o.w. flax 179 212 18.6 416 438 5.2 233 206
Synthetic and artificial fila-ment yarn
1.894 899 - 52.6 7.811 9.840 26.0 412 1,095
o.w. synthetic filament yarn 1.893 897 - 52.6 7.197 9.419 30.9 380 1,05
o.w. artificial filament yarn 1 2 94.2 614 421 - 31.5 71,415 25,21
Synthetic and artificialsstaple fibres
62 62 - 0.3 6.268 6.103 - 2.6 10,048 9,809
o.w. containing > 85% ofsynthetic 5 5 - 5.2 2.767 1.903 - 31.2 55,11 39,982
o.w. containing < 85% ofsynthetic
3 8 192.3 164 347 111.3 6,323 4,571

8/13/2019 Euratex nr 2
http://slidepdf.com/reader/full/euratex-nr-2 65/214
BULLETIN 2013/2
65
(External Trade) Textile and Clothing Trade 2011 - 2012 (continued)Country :
BrazilIMPORTS EXPORTS Coverage E/I
Unit : 1000 € 2011 2012 Evol. % 2011 2012 Evol. % 2011 2012
o.w. containing < 85% syn-thetic mixed natural fibres
12 2 - 85.6 389 191 - 50.9 3,186 10,868
o.w. other synthetics 6 8 24.0 1.309 1.252 - 4.4 21,397 16,499
o.w. artificial staple fibres 36 41 11.2 1.638 2.409 47.1 4,498 5,947
Special woven fabrics 4.892 3.961 - 19.0 7.358 10.482 42.5 150 265
o.w. pile fabrics 8 1 - 85.2 2.136 3.235 51.5 26,602 271,874
o.w. narrow woven fabrics 4.760 3.881 - 18.5 2.465 2.649 7.5 52 68
o.w. labels, badges 100 67 - 32.7 806 1.285 59.4 810 1,919
o.w. embroidery 20 8 - 59.7 348 712 104.4 1,729 8,756
Knitted fabrics 320 481 50.1 14.074 11.143 - 20.8 4,394 2,318
Pile fabrics 0 2 723.8 3.497 3.829 9.5 221,351
< 30 cm; w 5% or moreelastome
0 4 368 98 - 73.3 2,715
> 30 cm; w 5% or moreelastome
195 201 3.1 699 504 - 27.9 358 251
Curtain fabrics and raschellace
8 21 150.8 7.176 4.486 - 37.5 85,738 21,37
Other fabrics 117 253 117.3 2.333 2.226 - 4.6 2,002 879
Carpets 220 485 120.4 10.630 11.300 6.3 4,829 2,329
Knotted carpets 77 40 - 48.3 240 302 25.6 312 757
Woven carpets 31 40 27.5 6.226 6.916 11.1 19,873 17,312
Tufted carpets 5 365 6849.3 3.102 2.699 - 13.0 59,078 740
Carpets of felt 0 7 8044.4 32 70 121.8 35,133 957
Other textiles 12.213 12.597 3.1 126.398 120.614 - 4.6 1,035 958
Wadding, felt, nonwovens,rubber thread, twine, cor-dage, etc.
5.537 4.213 - 23.9 41.716 37.983 - 8.9 753 902
o.w. felt 34 33 - 2.4 2.498 1.615 - 35.4 7,414 4,907o.w. nonwovens 1.942 1.331 - 31.4 22.461 23.067 2.7 1,157 1,733
o.w. special yarn 0 0 569 894 57.3 372,696
o.w. twine, rope 3.118 2.633 - 15.6 6.494 4.079 - 37.2 208 155
o.w. nets 434 129 - 70.2 535 367 - 31.5 123 284
Handwoven tapestries &quilted products
1 1 - 26.3 105 106 0.7 11,033 15,079
Impregnated, coated, etc,,textile fabrics
1.914 2.879 50.4 53.122 59.827 12.6 2,776 2,078
o.w. tyre cord fabric 7 85 1128.6 1.469 3.061 108.3 21,235 3,601
o.w. fabrics impregnated,coated etc,
176 526 198.8 8.084 10.801 33.6 4,594 2,055
o.w. textile products, articlesfor technical uses
1.508 2.167 43.7 20.176 21.064 4.4 1,338 972
Other made up textilearticles 2.481 2.839 14.4 6.601 5.720 - 13.3 266 201
o.w. sacks and bags 9 31 264.9 512 450 - 12.1 5,952 1,433
o.w. tarpaulins, sunblinds& alike
1.983 2.129 7.4 1.522 1.396 - 8.3 77 66
o.w. other : floorcloths,dishcloths etc
412 588 42.7 2.554 2.928 14.7 620 498
Worn clothing and otherworn articles
62 76 23.7 1.952 914 - 53.2 3,17 1,2
Home textiles 3.277 2.515 - 23.2 3.276 4.150 26.7 100 165
Bedlinen, table, toilet andkitchen linen
3.022 2.294 - 24.1 1.982 2.540 28.1 66 111
o.w. Bedlinen, woven 161 94 - 41.8 978 1.498 53.1 606 1,597
o.w. toilet linen 2.694 1.835 - 31.9 466 510 9.5 17 28
o.w. table linen, woven 165 364 121.3 483 458 - 5.2 294 126
Curtains 12 10 - 14.0 169 435 157.9 1,398 4,193
Other furnishing articles 170 129 - 23.8 406 511 25.9 239 395
Garments 17.193 12.257 - 28.7 69.891 93.995 34.5 407 767

8/13/2019 Euratex nr 2
http://slidepdf.com/reader/full/euratex-nr-2 66/214
BULLETIN 2013/2
66
(External Trade) Textile and Clothing Trade 2011 - 2012 (continued)Country :
BrazilIMPORTS EXPORTS Coverage E/I
Unit : 1000 € 2011 2012 Evol. % 2011 2012 Evol. % 2011 2012
Occupationals (woven) 49 30 - 37.9 557 435 - 22.0 1,136 1,426
Men's ensembles 2 2 39.6 73 17 - 77.1 4,721 774
Men's jackets 1 0 - 43.9 30 70 132.3 4,597 19,051
Men's trousers 0 16 111 57 - 48.4 362
Men's overalls 0 0 10 20 101.8
Other men's occupationals 14 3 - 75.3 129 119 - 7.4 932 3,492
Women's ensembles 0 4 0 4 4914.3 93
Women's jackets 0 0 41 2 - 94.3
Women's trousers 29 2 - 91.4 3 0 - 96.7 11 4
Women's overalls 0 0 85 79 - 7.1
Other women's occupation-nals
4 3 - 40.1 76 66 - 13.0 1,812 2,633
Men’s Clothing (knitted and
woven)1.576 1.532 - 2.8 14.020 18.339 30.8 890 1,197
Overcoats 86 70 - 18.9 1.348 2.254 67.2 1,565 3,226
o.w. woven 63 41 - 35.7 1.213 2.009 65.6 1,912 4,924
Suits 118 4 - 96.6 3.684 2.627 - 28.7 3,112 65,665
o.w. woven 118 4 - 96.7 3.543 2.627 - 25.9 2,998 68,046
Ensembles 199 177 - 11.0 372 217 - 41.7 187 123
o.w. woven 141 160 13.9 361 60 - 83.4 257 37
Jackets and blazers 10 3 - 70.1 1.359 2.256 66.0 13,117 72,78
o.w. woven 3 1 - 53.8 1.232 1.869 51.7 38,509 126,293
Trousers 442 858 93.9 2.595 5.685 119.1 587 663
o.w. woven 243 805 230.6 2.504 5.563 122.2 1,029 691
Shirts 507 128 - 74.7 3.452 4.580 32.7 681 3,568
o.w. woven 86 55 - 36.3 3.008 3.262 8.5 3,505 5,972
Underpants, briefs, etc. 32 102 214.8 404 348 - 13.9 1,248 341o.w. knitted 28 102 263.2 376 335 - 10.9 1,343 329
Swimwear 75 96 28.3 35 62 74.6 47 64
Tracksuits 88 89 1.8 598 118 - 80.3 680 131
Women’s Clothing (knittedand woven)
11.943 7.876 - 34.1 27.742 42.821 54.4 232 544
Overcoats 155 82 - 47.1 1.457 4.286 194.1 943 5,246
o.w. woven 95 41 - 56.4 1.091 4.062 272.2 1,155 9,867
Suits 220 221 0.4 261 140 - 46.4 119 63
o.w. woven 212 214 0.8 259 103 - 60.1 122 48
Ensembles 196 80 - 59.4 826 340 - 58.9 420 426
o.w. woven 98 36 - 63.3 759 329 - 56.7 778 919
Jackets 86 82 - 4.9 2.477 4.770 92.6 2,864 5,803
o.w. woven 51 54 5.6 2.380 4.688 96.9 4,626 8,625
Skirts and dresses 2.294 1.388 - 39.5 7.693 10.481 36.2 335 755
o.w. woven 1.114 694 - 37.7 5.443 7.268 33.5 488 1,047
Trousers 2.262 807 - 64.3 5.144 8.397 63.2 227 1,041
o.w. woven 1.473 352 - 76.1 4.191 7.161 70.9 284 2,034
Blouses 1.091 857 - 21.4 4.442 6.783 52.7 407 791
o.w. woven 234 334 42.4 3.945 5.738 45.4 1,683 1,719
Slips, petticoats, etc. 1.111 565 - 49.1 895 758 - 15.3 81 134
o.w. knitted 769 459 - 40.4 818 609 - 25.6 106 133
Swimwear 4.158 3.501 - 15.8 173 146 - 15.2 4 4
Tracksuits 204 142 - 30.7 581 1.384 138.1 284 977
Others (knitted and woven) 3.656 2.846 - 22.1 28.125 32.827 16.7 769 1,153
Babies’ garments 388 471 21.6 848 800 - 5.6 219 170
o.w. knitted or crocheted 175 106 - 39.8 562 565 0.6 320 535
T-shirts 962 741 - 23.0 5.307 7.842 47.8 552 1,058
Jerseys, pullovers, cardigans 117 110 - 5.8 8.212 10.326 25.7 7,044 9,402
Special garments 217 118 - 45.5 2.710 2.871 5.9 1,25 2,43
o.w. woven 114 102 - 10.4 2.537 2.646 4.3 2,232 2,598

8/13/2019 Euratex nr 2
http://slidepdf.com/reader/full/euratex-nr-2 67/214
BULLETIN 2013/2
67
(External Trade) Textile and Clothing Trade 2011 - 2012 (continued)Country :
BrazilIMPORTS EXPORTS Coverage E/I
Unit : 1000 € 2011 2012 Evol. % 2011 2012 Evol. % 2011 2012
Other garments, knitted orcrocheted
318 173 - 45.5 1.623 1.850 14.0 511 1,07
Gloves 26 14 - 47.9 143 330 131.1 549 2,439
Ties, bow ties, and cravats 7 7 5.0 2.104 1.098 - 47.8 32,029 15,918
Shawls, scarves, mufflers,mantillas, etc
73 75 2.7 1.775 1.755 - 1.1 2,44 2,348
Pantyhose, tights, stockings,socks, etc
154 70 - 54.5 3.911 4.048 3.5 2,535 5,761
Brassières, girdles, corsets,etc,
1.262 980 - 22.4 606 1.272 109.9 48 130
Other accessories 72 68 - 5.6 881 652 - 26.0 1,23 964
TOTAL Chapter 61 KnittedGarments
10.210 6.732 - 34.1 26.864 34.397 28.0 263 511
TOTAL Chapter 62 Woven
Garments6.984 5.526 - 20.9 43.026 59.597 38.5 616 1079
Total Clothing - (CH 61+62) 17.194 12.259 - 28.7 69.891 93.995 34.5 406 767
Total Textile - (CH 50-60+ 63)
82.139 77.371 - 5.8 282.571 307.137 8.7 344 397
Total 99.333 89.630 - 9.8 352.461 401.131 13.8 355 448

8/13/2019 Euratex nr 2
http://slidepdf.com/reader/full/euratex-nr-2 68/214
BULLETIN 2013/2
68
(External Trade) Textile and Clothing Trade 2011 - 2012Country :
CambodiaIMPORTS EXPORTS Coverage E/I
Unit : 1000 € 2011 2012 Evol. % 2011 2012 Evol. % 2011 2012
Natural fibers 0 0 1 0 - 100.0 0
Cotton 0 0 0 0 0
Other vegetable fibres 0 0 1 0 - 100.0
o.w. flax 0 0 1 0 - 100.0
Yarns and Threads 0 0 1.631 1.535 - 5.9
Wool 0 0 1.111 766 - 31.0
o.w. carded wool, n.p.r.s. 0 0 1.081 647 - 40.2
o.w. combed wool, n.p.r.s. 0 0 30 120 295.6
Cotton 0 0 377 750 99.1
o.w. cotton yarn, n.p.r.s. 0 0 377 750 99.1
Man-made filaments yarns 0 0 30 8 - 73.0
o.w. sewing thread 0 0 0 8 2792.9
o.w. artificial filament yarn 0 0 30 0 - 100.0
Man made staple yarns 0 0 114 10 - 91.1
o.w. man made staple yarns,n.p.r.s.
0 0 114 10 - 91.3
o.w. man made staple yarns,p.r.s.
0 0 0 0
Woven fabrics 92 137 48.7 2.363 7.041 198.0 3 5
Silk 6 5 - 14.5 0 0 0 0
Wool 0 0 679 1.269 86.9
o.w. carded wool 0 0 679 969 42.7
o.w. combed wool 0 0 0 300
Cotton 32 40 25.9 397 2.074 422.2 1 5
o.w. cotton, unbleached 0 0 0 0
o.w. cotton, dyed 0 7 1441.7 80 642 701.4 17 9
o.w. denim fabric 0 0 62.5 0 0 0 0Other fabrics 0 3 5 1.393 25738.2 42
o.w. flax 0 3 5 1.393 42
Synthetic and artificial fila-ment yarn
54 6 - 89.1 445 219 - 50.8 817 4
o.w. synthetic filament yarn 54 6 - 89.1 400 207 - 48.3 734 3
o.w. artificial filament yarn 0 0 45 12 - 73.0
Synthetic and artificialsstaple fibres
0 12 525 1.742 231.6 15
o.w. containing > 85% ofsynthetic
0 0 19 2 - 89.6
o.w. containing < 85% ofsynthetic
0 2 0 0 0
o.w. containing < 85% syn-thetic mixed natural fibres
0 10 279 1.474 429.2 15
o.w. other synthetics 0 0 29 5 - 83.3
o.w. artificial staple fibres 0 0 199 261 31.1
Special woven fabrics 0 71 311 345 10.9 487
o.w. narrow woven fabrics 0 0 16 81 398.5
o.w. labels, badges 0 41 185 72 - 61.3 177
o.w. embroidery 0 28 29 152 425.8 535
Knitted fabrics 0 0 - 100.0 347 399 15.2 347
> 30 cm; w 5% or moreelastome
0 0 266 341 28.4
Curtain fabrics and raschellace
0 0 14 10 - 26.0
Other fabrics 0 0 - 100.0 67 48 - 28.2 67
Carpets 0 2 103 28 - 73.0 1
Woven carpets 0 0 15 28 81.8Tufted carpets 0 0 62 0 - 100.0

8/13/2019 Euratex nr 2
http://slidepdf.com/reader/full/euratex-nr-2 69/214
BULLETIN 2013/2
69
(External Trade) Textile and Clothing Trade 2011 - 2012 (continued)Country :
CambodiaIMPORTS EXPORTS Coverage E/I
Unit : 1000 € 2011 2012 Evol. % 2011 2012 Evol. % 2011 2012
Other textiles 228 1.296 467.2 1.088 2.485 128.4 476 192
Wadding, felt, nonwovens,rubber thread, twine, cor-dage, etc.
2 30 1158.0 357 1.519 325.0 15 5
o.w. felt 0 0 0 27
o.w. nonwovens 0 30 325 1.468 351.9 5
o.w. twine, rope 1 0 - 100.0 1 0 - 84.5 97
o.w. nets 2 0 - 100.0 0 0 0
Impregnated, coated, etc,,textile fabrics
0 25 517 761 47.2 3
o.w. fabrics impregnated,coated etc,
0 0 473 567 20.0
o.w. textile products, articlesfor technical uses
0 0 2 29 1676.4
Other made up textilearticles
226 1.240 448.7 213 186 - 12.8 94 15
o.w. sacks and bags 1 16 1918.2 0 0 0 1
o.w. tarpaulins, sunblinds& alike
1 0 - 100.0 0 0 0
o.w. other : floorcloths,dishcloths etc
217 1.221 461.6 37 43 18.0 17 4
Worn clothing and otherworn articles
5 4 - 25.5 177 130 - 26.3 3 3
Home textiles 1.218 2.432 99.7 8 5 - 41.7 1 0
Bedlinen, table, toilet andkitchen linen
1.100 1.387 26.1 0 5 0 0
o.w. Bedlinen, woven 1 25 1997.4 0 2 0 8
o.w. toilet linen 108 27 - 75.2 0 1 0 5
o.w. table linen, woven 991 1.336 34.8 0 2 0 0Curtains 0 44 8 0 - 100.0 0
Other furnishing articles 0 0 - 90.9 0 0 0 0
Garments 922.321 1.219.186 32.2 779 957 22.8 0 0
Occupationals (woven) 898 3.306 268.1 38 0 - 99.5 4 0
Men's ensembles 7 0 - 100.0 0 0 0
Men's jackets 37 148 300.7 0 0 0 0
Men's trousers 176 1.673 851.0 2 0 - 100.0 1 0
Men's overalls 6 142 2296.1 0 0 0 0
Other men's occupationals 56 104 84.0 36 0 - 99.4 64 0
Women's ensembles 0 0 - 100.0 0 0 0
Women's trousers 68 458 575.5 0 0 0 0
Other women's occupation-nals
548 782 42.6 1 0 - 100.0 0 0
Men’s Clothing (knitted andwoven)
136.961 251.425 83.6 251 198 - 20.9 0 0
Overcoats 10.226 16.430 60.7 196 130 - 33.3 2 1
o.w. woven 4.914 8.134 65.5 196 116 - 40.5 4 1
Suits 958 661 - 30.9 0 0 0 0
o.w. woven 958 661 - 31.0 0 0 0 0
Ensembles 300 53 - 82.4 0 0 0 0
o.w. woven 298 11 - 96.2 0 0 0 0
Jackets and blazers 5.897 11.134 88.8 0 0 0 0
o.w. woven 5.538 10.214 84.4 0 0 0 0
Trousers 45.499 122.116 168.4 2 2 8.5 0 0
o.w. woven 38.052 102.977 170.6 2 0 - 76.3 0 0
Shirts 58.078 74.677 28.6 18 66 270.3 0 0
o.w. woven 18.994 31.783 67.3 13 6 - 51.7 0 0
Underpants, briefs, etc. 10.848 20.525 89.2 0 0 0 0
o.w. knitted 9.549 18.051 89.0 0 0 0 0

8/13/2019 Euratex nr 2
http://slidepdf.com/reader/full/euratex-nr-2 70/214
BULLETIN 2013/2
70
(External Trade) Textile and Clothing Trade 2011 - 2012 (continued)Country :
CambodiaIMPORTS EXPORTS Coverage E/I
Unit : 1000 € 2011 2012 Evol. % 2011 2012 Evol. % 2011 2012
Swimwear 1.951 3.776 93.5 0 0 0 0
Tracksuits 3.147 1.948 - 38.1 0 0 0 0
Women’s Clothing (knittedand woven)
233.768 358.088 53.2 278 357 28.5 0 0
Overcoats 49.277 49.916 1.3 9 2 - 76.6 0 0
o.w. woven 4.797 5.305 10.6 7 2 - 70.6 0 0
Suits 11 3 - 68.7 2 16 636.6 20 469
o.w. woven 10 2 - 83.6 2 16 636.6 21 925
Ensembles 117 456 291.5 0 0 0 0
o.w. woven 7 11 56.9 0 0 0 0
Jackets 4.970 3.963 - 20.3 0 51 0 1
o.w. woven 490 950 93.8 0 51 0 5
Skirts and dresses 43.652 51.719 18.5 121 125 3.4 0 0
o.w. woven 5.757 9.117 58.4 117 122 4.0 2 1
Trousers 98.143 186.277 89.8 1 15 1166.4 0 0
o.w. woven 44.581 107.939 142.1 0 10 3603.7 0 0
Blouses 17.668 25.390 43.7 0 5 15766.7 0 0
o.w. woven 3.608 7.173 98.8 0 4 13033.3 0 0
Slips, petticoats, etc. 12.838 24.067 87.5 0 0 0 0
o.w. knitted 11.786 21.958 86.3 0 0 0 0
Swimwear 440 3.689 737.7 0 0 0 0
Tracksuits 6.088 11.741 92.8 122 9 - 92.7 2 0
Others (knitted and woven) 551.584 609.673 10.5 250 401 60.3 0 0
Babies’ garments 14.527 22.175 52.6 25 5 - 78.2 0 0
o.w. knitted or crocheted 13.420 19.737 47.1 25 5 - 78.6 0 0
T-shirts 98.822 143.594 45.3 3 20 490.0 0 0
Jerseys, pullovers, cardigans 382.205 370.261 - 3.1 0 92 41845.5 0 0
Special garments 27.759 31.125 12.1 74 138 86.7 0 0
o.w. woven 19.573 22.431 14.6 74 103 38.9 0 0
Other garments, knitted orcrocheted
4.793 9.202 92.0 20 16 - 22.0 0 0
Gloves 1.162 1.205 3.6 0 0 0 0
Ties, bow ties, and cravats 47 8 - 83.2 0 0 0 0
Shawls, scarves, mufflers,mantillas, etc
1.347 515 - 61.7 0 5 17166.7 0 1
Pantyhose, tights, stockings,socks, etc
5.206 4.313 - 17.1 8 1 - 93.3 0 0
Brassières, girdles, corsets,etc,
1.830 7.490 309.3 18 12 - 32.3 1 0
Other accessories 856 589 - 31.2 35 100 183.5 4 17
TOTAL Chapter 61 KnittedGarments
756.500 878.474 16.1 152 306 102.0 0 0
TOTAL Chapter 62 WovenGarments
165.822 340.712 105.5 628 650 3.6 0 0
Total Clothing 922.322 1.219.186 32.2 779 957 22.8 0 0
Total Textile 1.538 3.866 151.3 6.515 12.968 99.1 424 335
Total 923.860 1.223.052 32.4 7.294 13.925 90.9 1 1

8/13/2019 Euratex nr 2
http://slidepdf.com/reader/full/euratex-nr-2 71/214
BULLETIN 2013/2
71
(External Trade) Textile and Clothing Trade 2011 - 2012Country :
CanadaIMPORTS EXPORTS Coverage E/I
Unit : 1000 € 2011 2012 Evol. % 2011 2012 Evol. % 2011 2012
Natural fibers 3.419 2.240 - 34.5 3.422 4.548 32.9 100 203
Silk 7 0 - 100.0 26 23 - 12.6 389
o.w. raw silk 61 5 - 91.5 1.497 1.658 10.7 2,472 32,063
Wool, fine or coarse animalhair
0 0 65 170 161.9
o.w. wool, not carded orcombed
1 2 270.3 1.154 1.390 20.5 180,261 58,653
o.w. wool and fine or coarseanimal hair
75 8 - 89.3 1.854 1.981 6.8 2,479 24,794
Cotton 3.277 2.227 - 32.0 44 886 1915.4 1 40
Other vegetable fibres 3.222 2.218 - 31.1 28 10 - 62.9 1 0
o.w. flax 1.015 871 - 14.2 20.534 23.368 13.8 2,024 2,684
Man-made fibres 46 131 184.0 162 212 30.7 351 162
Synthetic filament tow 0 0 5 1 - 84.7Artificial filament tow 405 488 20.6 14.034 17.545 25.0 3,467 3,594
Synthetic staple fibres 259 0 - 99.9 2.210 1.469 - 33.5 853 918,363
Artificial staple fibres 15.728 6.859 - 56.4 69.503 59.647 - 14.2 442 870
Yarns and Threads 2 3 26.7 35 45 28.5 1,598 1,621
Silk 72 56 - 21.4 5.203 7.114 36.7 7,241 12,599
Wool 6 4 - 27.7 381 375 - 1.4 6,349 8,652
o.w. carded wool, n.p.r.s. 0 12 3.428 5.488 60.1 44,29
o.w. combed wool, n.p.r.s. 18 17 - 5.6 1.415 1.564 10.6 7,784 9,117
Cotton 4 4 - 8.1 431 564 30.9 10,942 15,588
o.w. cotton yarn, n.p.r.s. 14 14 - 4.9 984 1.000 1.6 6,91 7,387
o.w. cotton yarn, p.r.s. 10 2 - 78.3 247 381 54.5 2,598 18,512
Other - Vegetable yarns 15.587 6.766 - 56.6 57.739 45.827 - 20.6 370 677
Man-made filaments yarns 19 34 85.0 1.294 1.226 - 5.2 6,97 3,571o.w. sewing thread 14.915 6.189 - 58.5 47.885 37.467 - 21.8 321 605
o.w. synthetic filament yarn 1 0 - 100.0 3 4 25.3 311
o.w. artificial filament yarn 621 511 - 17.6 8.498 6.980 - 17.9 1,369 1,365
o.w. synthetic monofilament 39 15 - 63.1 4.863 4.715 - 3.1 12,367 32,492
Man made staple yarns 25 12 - 50.6 3.140 3.262 3.9 12,485 26,267
o.w. man made staple yarns,n.p.r.s.
14 2 - 85.3 1.723 1.452 - 15.7 12,158 69,484
o.w. man made staple yarns,p.r.s.
4.305 6.625 53.9 59.688 60.959 2.1 1,386 920
Woven fabrics 33 22 - 32.2 2.004 2.015 0.5 6,152 9,125
Silk 54 66 22.9 18.714 21.520 15.0 34,624 32,391
Wool 17 46 172.2 4.470 3.869 - 13.4 26,543 8,441
o.w. carded wool 37 21 - 44.6 14.219 17.649 24.1 38,213 85,673
o.w. combed wool 1.257 978 - 22.2 10.945 10.139 - 7.4 871 1,037
Cotton 8 30 294.3 544 418 - 23.1 7,191 1,402
o.w. cotton, unbleached 40 19 - 53.8 2.614 1.592 - 39.1 6,525 8,591
o.w. cotton, dyed 5 2 - 55.0 199 330 65.8 3,76 13,852
o.w. denim fabric 13 102 675.4 1.445 1.339 - 7.3 10,995 1,314
Other fabrics 3 10 191.6 1.362 1.298 - 4.7 40,782 13,33
o.w. flax 1.532 2.764 80.4 15.456 14.523 - 6.0 1,009 525
Synthetic and artificial fila-ment yarn
1.507 2.738 81.7 13.737 12.390 - 9.8 912 452
o.w. synthetic filament yarn 26 26 1.2 1.719 2.133 24.0 6,687 8,199
o.w. artificial filament yarn 410 274 - 33.3 5.478 5.667 3.5 1,336 2,071
Synthetic and artificialsstaple fibres
99 126 27.8 1.569 2.060 31.3 1,588 1,632
o.w. containing > 85% ofsynthetic 117 12 - 90.0 741 324 - 56.2 631 2,776
o.w. containing < 85% ofsynthetic

8/13/2019 Euratex nr 2
http://slidepdf.com/reader/full/euratex-nr-2 72/214
BULLETIN 2013/2
72
(External Trade) Textile and Clothing Trade 2011 - 2012 (continued)Country :
CanadaIMPORTS EXPORTS Coverage E/I
Unit : 1000 € 2011 2012 Evol. % 2011 2012 Evol. % 2011 2012
o.w. containing < 85% syn-thetic mixed natural fibres
77 25 - 67.6 211 204 - 3.3 274 818
o.w. other synthetics 94 76 - 19.8 1.408 1.632 15.9 1,491 2,156
o.w. artificial staple fibres 22 35 56.2 1.549 1.447 - 6.6 6,904 4,126
Special woven fabrics 1.006 2.419 140.5 5.633 5.739 1.9 560 237
o.w. pile fabrics 150 1.585 958.2 2.870 3.195 11.3 1,916 202
o.w. narrow woven fabrics 727 695 - 4.3 1.403 1.085 - 22.7 193 156
o.w. labels, badges 96 83 - 13.1 281 223 - 20.8 293 267
o.w. embroidery 13 34 154.8 358 338 - 5.6 2,696 998
Knitted fabrics 390 383 - 1.8 13.144 13.118 - 0.2 3,369 3,424
Pile fabrics 23 7 - 69.1 320 245 - 23.2 1,394 3,466
< 30 cm; w 5% or moreelastome
4 5 21.3 432 482 11.6 11,108 10,214
> 30 cm; w 5% or moreelastome
68 135 98.4 2.351 2.287 - 2.7 3,468 1,7
Curtain fabrics and raschellace
121 123 1.6 6.623 6.633 0.1 5,49 5,412
Other fabrics 175 114 - 34.6 3.418 3.471 1.5 1,955 3,037
Carpets 1.599 1.615 1.1 23.109 21.590 - 6.6 1,446 1,336
Knotted carpets 6 32 442.3 1.050 1.263 20.3 17,982 3,988
Woven carpets 34 46 34.9 8.764 8.894 1.5 25,747 19,373
Tufted carpets 1.003 823 - 17.9 5.831 5.783 - 0.8 581 702
Carpets of felt 5 3 - 40.6 4.700 3.925 - 16.5 103,747 145,899
Other textiles 43.411 33.910 - 21.9 110.162 93.906 - 14.8 254 277
Wadding, felt, nonwovens,rubber thread, twine, cor-dage, etc.
4.648 4.165 - 10.4 34.327 33.932 - 1.2 739 815
o.w. felt 1.789 1.945 8.7 1.470 1.902 29.4 82 98o.w. nonwovens 2.240 1.696 - 24.3 15.539 14.579 - 6.2 694 860
o.w. special yarn 4 7 82.2 692 841 21.6 19,226 12,827
o.w. twine, rope 312 279 - 10.6 8.383 9.769 16.5 2,689 3,505
o.w. nets 21 27 31.7 4.167 3.248 - 22.0 20,305 12,016
Handwoven tapestries &quilted products
66 63 - 5.6 87 128 47.4 131 205
Impregnated, coated, etc,,textile fabrics
13.338 8.715 - 34.7 34.973 31.861 - 8.9 262 366
o.w. tyre cord fabric 0 10 3109.4 128 108 - 15.3 39,953 1,054
o.w. fabrics impregnated,coated etc,
2.658 1.291 - 51.4 8.756 6.801 - 22.3 329 527
o.w. textile products, articlesfor technical uses
4.246 4.242 - 0.1 11.846 9.268 - 21.8 279 218
Other made up textilearticles 11.349 10.028 - 11.6 13.815 13.457 - 2.6 122 134
o.w. sacks and bags 180 164 - 8.9 617 703 14.0 343 430
o.w. tarpaulins, sunblinds& alike
1.392 1.389 - 0.2 2.250 2.303 2.4 162 166
o.w. other : floorcloths,dishcloths etc
5.351 4.399 - 17.8 9.118 9.085 - 0.4 170 207
Worn clothing and otherworn articles
4.393 4.038 - 8.1 1.605 1.127 - 29.8 37 28
Home textiles 1.571 1.229 - 21.8 13.486 16.052 19.0 858 1,306
Bedlinen, table, toilet andkitchen linen
1.258 992 - 21.2 10.071 11.098 10.2 800 1,119
o.w. Bedlinen, woven 1.179 877 - 25.6 7.134 7.824 9.7 605 892
o.w. toilet linen 60 64 6.8 1.971 2.109 7.0 3,272 3,28
o.w. table linen, woven 12 24 93.0 624 895 43.5 5,076 3,774
Curtains 38 32 - 16.2 1.401 1.665 18.9 3,649 5,178
Other furnishing articles 112 92 - 18.0 741 1.393 88.1 659 1,513
Garments 75.378 78.345 3.9 319.873 343.531 7.4 424 438

8/13/2019 Euratex nr 2
http://slidepdf.com/reader/full/euratex-nr-2 73/214
BULLETIN 2013/2
73
(External Trade) Textile and Clothing Trade 2011 - 2012 (continued)Country :
CanadaIMPORTS EXPORTS Coverage E/I
Unit : 1000 € 2011 2012 Evol. % 2011 2012 Evol. % 2011 2012
Occupationals (woven) 1.978 1.153 - 41.7 1.703 1.169 - 31.3 86 101
Men's ensembles 10 5 - 45.0 17 20 18.7 173 372
Men's jackets 3 3 - 21.6 117 141 19.9 3,57 5,459
Men's trousers 8 103 1207.8 111 221 98.9 1,414 215
Men's overalls 1 2 75.3 53 70 30.7 5,486 4,092
Other men's occupationals 1.898 985 - 48.1 1.122 168 - 85.0 59 17
Women's ensembles 3 0 - 95.5 21 41 95.4 784 33,817
Women's jackets 24 3 - 86.7 28 39 36.9 119 1,227
Women's trousers 11 17 51.0 111 166 50.2 998 993
Women's overalls 3 0 - 100.0 11 115 969.7 387
Other women's occupation-nals
17 36 104.3 112 189 69.5 640 531
Men’s Clothing (knitted and
woven)15.130 13.602 - 10.1 84.834 98.488 16.1 561 724
Overcoats 11.224 10.575 - 5.8 8.148 9.300 14.1 73 88
o.w. woven 11.129 10.440 - 6.2 7.019 8.177 16.5 63 78
Suits 88 184 109.3 20.231 26.043 28.7 23,077 14,19
o.w. woven 82 181 119.8 19.791 25.500 28.8 24,054 14,1
Ensembles 45 38 - 15.6 4.566 4.494 - 1.6 10,104 11,787
o.w. woven 17 20 23.4 4.444 4.347 - 2.2 26,774 21,213
Jackets and blazers 363 200 - 44.8 10.030 14.281 42.4 2,764 7,128
o.w. woven 329 167 - 49.2 9.508 13.403 41.0 2,894 8,029
Trousers 550 564 2.5 21.428 23.642 10.3 3,893 4,19
o.w. woven 444 473 6.6 20.809 22.670 8.9 4,686 4,79
Shirts 202 231 14.1 16.834 17.594 4.5 8,316 7,619
o.w. woven 97 130 33.4 14.314 15.138 5.8 14,732 11,676
Underpants, briefs, etc. 202 239 18.2 823 974 18.3 408 408o.w. knitted 178 203 14.4 421 476 13.0 237 234
Swimwear 73 18 - 74.9 438 405 - 7.4 602 2,222
Tracksuits 431 543 25.8 724 920 27.0 168 170
Women’s Clothing (knittedand woven)
38.695 44.058 13.9 111.585 120.618 8.1 288 274
Overcoats 5.984 5.850 - 2.2 12.677 13.891 9.6 212 237
o.w. woven 5.879 5.738 - 2.4 11.819 12.853 8.8 201 224
Suits 137 57 - 58.7 1.242 1.317 6.0 904 2,322
o.w. woven 117 30 - 73.9 1.017 708 - 30.4 873 2,326
Ensembles 86 67 - 22.2 14.815 14.443 - 2.5 17,263 21,634
o.w. woven 61 59 - 2.7 14.659 14.234 - 2.9 24,142 24,101
Jackets 4.682 6.780 44.8 12.258 13.783 12.4 262 203
o.w. woven 652 1.294 98.3 10.285 11.243 9.3 1,576 869
Skirts and dresses 20.941 24.284 16.0 24.111 26.814 11.2 115 110
o.w. woven 2.928 4.007 36.8 17.299 18.198 5.2 591 454
Trousers 3.106 3.191 2.7 16.182 19.275 19.1 521 604
o.w. woven 760 1.358 78.7 14.293 16.686 16.7 1,882 1,229
Blouses 1.312 1.895 44.4 11.884 12.806 7.8 906 676
o.w. woven 227 636 180.5 9.342 9.738 4.2 4,12 1,531
Slips, petticoats, etc. 1.174 765 - 34.8 2.579 2.396 - 7.1 220 313
o.w. knitted 1.109 722 - 34.9 2.010 1.926 - 4.2 181 267
Swimwear 354 236 - 33.3 2.134 2.322 8.8 603 984
Tracksuits 720 677 - 5.8 2.816 2.955 4.9 391 436
Others (knitted and woven) 21.552 20.685 - 4.0 123.121 124.234 0.9 571 601
Babies’ garments 425 300 - 29.4 2.248 2.154 - 4.2 529 718
o.w. knitted or crocheted 178 69 - 61.3 1.302 1.372 5.4 732 1,994
T-shirts 2.528 2.542 0.5 16.285 16.616 2.0 644 654
Jerseys, pullovers, cardigans 5.803 6.317 8.8 26.345 26.574 0.9 454 421
Special garments 2.194 1.191 - 45.7 19.248 22.097 14.8 877 1,855
o.w. woven 1.752 1.021 - 41.7 17.322 20.410 17.8 989 1,998

8/13/2019 Euratex nr 2
http://slidepdf.com/reader/full/euratex-nr-2 74/214
BULLETIN 2013/2
74
(External Trade) Textile and Clothing Trade 2011 - 2012 (continued)Country :
CanadaIMPORTS EXPORTS Coverage E/I
Unit : 1000 € 2011 2012 Evol. % 2011 2012 Evol. % 2011 2012
Other garments, knitted orcrocheted
6.854 5.528 - 19.3 12.668 11.870 - 6.3 185 215
Gloves 763 860 12.7 963 931 - 3.4 126 108
Ties, bow ties, and cravats 97 65 - 33.4 5.171 5.463 5.7 5,312 8,431
Shawls, scarves, mufflers,mantillas, etc
113 1.073 848.5 7.983 7.176 - 10.1 7,053 668
Pantyhose, tights, stockings,socks, etc
686 548 - 20.1 11.414 11.749 2.9 1,664 2,143
Brassières, girdles, corsets,etc,
1.401 1.233 - 12.0 18.003 17.071 - 5.2 1,285 1,385
Other accessories 747 910 21.8 2.753 2.556 - 7.2 369 281
TOTAL Chapter 61 KnittedGarments
44.770 47.463 6.0 97.514 102.004 4.6 218 215
TOTAL Chapter 62 Woven
Garments30.608 30.885 0.9 222.360 241.446 8.6 726 782
Total Clothing - (CH 61+62) 75.380 78.350 3.9 319.876 343.521 7.4 424 438
Total Textile - (CH 50-60+ 63)
71.438 53.732 - 24.8 317.492 296.369 - 6.7 444 552
Total 146.818 132.082 - 10.0 637.368 639.890 0.4 434 484

8/13/2019 Euratex nr 2
http://slidepdf.com/reader/full/euratex-nr-2 75/214
BULLETIN 2013/2
75
(External Trade) Textile and Clothing Trade 2011 - 2012Country :
ChinaIMPORTS EXPORTS Coverage E/I
Unit : 1000 € 2011 2012 Evol. % 2011 2012 Evol. % 2011 2012
Natural fibers 585.772 491.720 - 16.1 347.436 325.919 - 6.2 59 66
Silk 69.472 66.210 - 4.7 1 9 600.0 0 0
o.w. raw silk 52.027 52.411 0.7 0 4 0 0
Wool, fine or coarse animalhair
510.692 420.022 - 17.8 67.553 64.748 - 4.2 13 15
o.w. wool, not carded orcombed
16.624 13.820 - 16.9 56.364 53.837 - 4.5 339 390
o.w. wool and fine or coarseanimal hair
261.062 200.608 - 23.2 7.646 7.677 0.4 3 4
Cotton 2.912 3.109 6.8 102.220 88.867 - 13.1 3,51 2,858
Other vegetable fibres 2.696 2.379 - 11.7 177.662 172.294 - 3.0 6,591 7,241
o.w. flax 385 201 - 47.8 177.607 172.150 - 3.1 46,138 85,681
Man-made fibres 73.507 76.157 3.6 52.281 69.657 33.2 71 91
Synthetic filament tow 9.153 3.852 - 57.9 19.323 23.569 22.0 211 612Artificial filament tow 289 194 - 33.1 68 587 759.1 24 303
Synthetic staple fibres 55.231 65.028 17.7 20.645 34.893 69.0 37 54
Artificial staple fibres 7.494 5.695 - 24.0 8.363 7.396 - 11.6 112 130
Yarns and Threads 818.922 778.620 - 4.9 146.981 150.528 2.4 18 19
Silk 53.134 42.537 - 19.9 638 790 23.8 1 2
Wool 72.112 69.420 - 3.7 29.127 32.292 10.9 40 47
o.w. carded wool, n.p.r.s. 3.069 862 - 71.9 6.663 9.408 41.2 217 1,091
o.w. combed wool, n.p.r.s. 45.406 46.619 2.7 15.146 16.032 5.8 33 34
Cotton 89.653 66.298 - 26.1 4.386 5.794 32.1 5 9
o.w. cotton yarn, n.p.r.s. 85.265 61.592 - 27.8 3.163 5.171 63.5 4 8
o.w. cotton yarn, p.r.s. 4.389 4.706 7.2 1.222 623 - 49.0 28 13
Other - Vegetable yarns 55.589 69.839 25.6 4.138 1.029 - 75.1 7 1
Man-made filaments yarns 482.360 457.499 - 5.2 102.003 103.083 1.1 21 23o.w. sewing thread 17.033 16.089 - 5.5 6.661 7.820 17.4 39 49
o.w. synthetic filament yarn 406.929 388.036 - 4.6 60.914 62.264 2.2 15 16
o.w. artificial filament yarn 41.028 35.646 - 13.1 5.050 2.123 - 58.0 12 6
o.w. synthetic monofilament 9.093 9.429 3.7 29.280 30.787 5.1 322 327
Man made staple yarns 66.073 73.027 10.5 6.689 7.539 12.7 10 10
o.w. man made staple yarns,n.p.r.s.
28.566 33.318 16.6 6.003 6.797 13.2 21 20
o.w. man made staple yarns,p.r.s.
37.507 39.709 5.9 686 742 8.1 2 2
Woven fabrics 1.912.508 1.804.826 - 5.6 324.271 347.306 7.1 17 19
Silk 186.578 177.371 - 4.9 10.327 9.365 - 9.3 6 5
Wool 30.176 30.206 0.1 150.392 156.492 4.1 498 518
o.w. carded wool 4.771 5.479 14.8 34.543 39.869 15.4 724 728
o.w. combed wool 20.889 21.017 0.6 115.842 116.581 0.6 555 555
Cotton 514.277 365.223 - 29.0 71.066 75.474 6.2 14 21
o.w. cotton, unbleached 139.055 91.172 - 34.4 2.479 2.299 - 7.3 2 3
o.w. cotton, dyed 111.527 82.740 - 25.8 13.723 10.799 - 21.3 12 13
o.w. denim fabric 7.330 4.971 - 32.2 1.647 698 - 57.6 22 14
Other fabrics 64.633 51.342 - 20.6 9.464 8.841 - 6.6 15 17
o.w. flax 57.644 45.356 - 21.3 8.883 8.436 - 5.0 15 19
Synthetic and artificial fila-ment yarn
408.175 500.535 22.6 33.651 41.015 21.9 8 8
o.w. synthetic filament yarn 381.849 472.611 23.8 27.643 34.336 24.2 7 7
o.w. artificial filament yarn 26.326 27.924 6.1 6.008 6.678 11.2 23 24
Synthetic and artificialsstaple fibres
443.177 392.769 - 11.4 23.448 26.618 13.5 5 7
o.w. containing > 85% ofsynthetic 65.127 60.477 - 7.1 3.324 8.218 147.2 5 14
o.w. containing < 85% ofsynthetic
69.227 51.621 - 25.4 678 552 - 18.6 1 1

8/13/2019 Euratex nr 2
http://slidepdf.com/reader/full/euratex-nr-2 76/214
BULLETIN 2013/2
76
(External Trade) Textile and Clothing Trade 2011 - 2012 (continued)Country :
ChinaIMPORTS EXPORTS Coverage E/I
Unit : 1000 € 2011 2012 Evol. % 2011 2012 Evol. % 2011 2012
o.w. containing < 85% syn-thetic mixed natural fibres
52.651 44.153 - 16.1 4.217 1.756 - 58.3 8 4
o.w. other synthetics 160.295 139.486 - 13.0 10.137 11.449 13.0 6 8
o.w. artificial staple fibres 95.877 97.031 1.2 5.092 4.643 - 8.8 5 5
Special woven fabrics 264.689 285.945 8.0 25.922 29.486 13.8 10 10
o.w. pile fabrics 80.981 82.013 1.3 6.055 8.339 37.7 7 10
o.w. narrow woven fabrics 70.412 78.037 10.8 8.620 10.501 21.8 12 13
o.w. labels, badges 17.848 19.306 8.2 4.808 4.667 - 2.9 27 24
o.w. embroidery 54.358 57.164 5.2 3.417 2.915 - 14.7 6 5
Knitted fabrics 345.117 359.545 4.2 73.453 76.196 3.7 21 21
Pile fabrics 55.897 55.004 - 1.6 11.254 12.397 10.2 20 23
< 30 cm; w 5% or moreelastome
3.091 3.389 9.6 1.109 898 - 19.0 36 27
> 30 cm; w 5% or moreelastome
83.312 84.113 1.0 13.619 12.349 - 9.3 16 15
Curtain fabrics and raschellace
56.658 61.489 8.5 28.782 28.246 - 1.9 51 46
Other fabrics 146.159 155.551 6.4 18.689 22.306 19.4 13 14
Carpets 232.070 245.570 5.8 21.735 31.503 44.9 9 13
Knotted carpets 11.677 11.045 - 5.4 752 941 25.1 6 9
Woven carpets 65.960 56.144 - 14.9 8.964 13.308 48.5 14 24
Tufted carpets 117.796 136.258 15.7 7.110 10.364 45.8 6 8
Carpets of felt 1.518 1.778 17.1 787 1.014 29.0 52 57
Other textiles 2.396.402 2.502.835 4.4 421.321 458.511 8.8 18 18
Wadding, felt, nonwovens,rubber thread, twine, cor-dage, etc.
275.110 311.502 13.2 146.959 181.971 23.8 53 58
o.w. felt 17.668 21.323 20.7 8.855 8.692 - 1.8 50 41o.w. nonwovens 126.057 149.347 18.5 117.155 146.617 25.1 93 98
o.w. special yarn 12.736 9.068 - 28.8 2.807 4.877 73.7 22 54
o.w. twine, rope 23.931 28.544 19.3 4.216 4.798 13.8 18 17
o.w. nets 35.508 42.869 20.7 1.773 2.579 45.5 5 6
Handwoven tapestries &quilted products
1.909 1.618 - 15.2 458 279 - 39.1 24 17
Impregnated, coated, etc,,textile fabrics
353.508 370.873 4.9 201.481 209.651 4.1 57 57
o.w. tyre cord fabric 39.376 38.863 - 1.3 3.491 2.025 - 42.0 9 5
o.w. fabrics impregnated,coated etc,
207.831 223.967 7.8 68.020 72.236 6.2 33 32
o.w. textile products, articlesfor technical uses
32.034 35.732 11.5 98.559 101.092 2.6 308 283
Other made up textilearticles 1.532.082 1.562.961 2.0 19.150 20.114 5.0 1 1
o.w. sacks and bags 125.087 113.702 - 9.1 805 1.591 97.6 1 1
o.w. tarpaulins, sunblinds& alike
476.082 464.188 - 2.5 1.573 1.789 13.8 0 0
o.w. other : floorcloths,dishcloths etc
902.815 956.459 5.9 10.128 11.221 10.8 1 1
Worn clothing and otherworn articles
1.876 1.996 6.4 5.916 4.896 - 17.2 315 245
Home textiles 1.619.308 1.564.858 - 3.4 11.575 13.633 17.8 1 1
Bedlinen, table, toilet andkitchen linen
673.230 624.935 - 7.2 5.502 7.410 34.7 1 1
o.w. Bedlinen, woven 269.581 236.754 - 12.2 3.470 4.984 43.7 1 2
o.w. toilet linen 216.882 193.783 - 10.7 1.182 1.532 29.6 1 1
o.w. table linen, woven 99.688 102.640 3.0 295 430 45.6 0 0
Curtains 407.051 418.517 2.8 3.500 3.367 - 3.8 1 1
Other furnishing articles 219.548 216.376 - 1.4 1.047 1.153 10.1 0 1
Garments 30.039.688 27.215.797 - 9.4 568.067 756.752 33.2 2 3

8/13/2019 Euratex nr 2
http://slidepdf.com/reader/full/euratex-nr-2 77/214
BULLETIN 2013/2
77
(External Trade) Textile and Clothing Trade 2011 - 2012 (continued)Country :
ChinaIMPORTS EXPORTS Coverage E/I
Unit : 1000 € 2011 2012 Evol. % 2011 2012 Evol. % 2011 2012
Occupationals (woven) 455.549 343.209 - 24.7 1.223 2.462 101.2 0 1
Men's ensembles 21.299 13.603 - 36.1 76 155 105.5 0 1
Men's jackets 59.395 47.818 - 19.5 88 496 463.0 0 1
Men's trousers 141.490 101.924 - 28.0 219 138 - 37.0 0 0
Men's overalls 46.522 35.964 - 22.7 27 67 151.0 0 0
Other men's occupationals 118.654 78.928 - 33.5 532 481 - 9.6 0 1
Women's ensembles 1.698 1.075 - 36.7 0 20 10755.6 0 2
Women's jackets 6.069 6.487 6.9 40 80 102.1 1 1
Women's trousers 13.386 13.793 3.0 131 857 555.2 1 6
Women's overalls 1.714 690 - 59.8 9 7 - 16.6 1 1
Other women's occupation-nals
45.321 42.927 - 5.3 102 160 56.4 0 0
Men’s Clothing (knitted and
woven)6.863.993 6.005.872 - 12.5 165.590 199.089 20.2 2 3
Overcoats 1.802.473 1.557.462 - 13.6 22.975 31.868 38.7 1 2
o.w. woven 1.640.653 1.416.837 - 13.6 21.619 29.904 38.3 1 2
Suits 216.274 179.740 - 16.9 20.033 29.411 46.8 9 16
o.w. woven 210.640 169.830 - 19.4 19.722 29.140 47.7 9 17
Ensembles 76.607 67.179 - 12.3 8.572 4.565 - 46.7 11 7
o.w. woven 39.448 34.250 - 13.2 8.355 4.322 - 48.3 21 13
Jackets and blazers 505.175 506.374 0.2 16.857 22.501 33.5 3 4
o.w. woven 452.997 450.132 - 0.6 14.842 20.347 37.1 3 5
Trousers 2.123.010 1.807.858 - 14.8 52.828 61.689 16.8 2 3
o.w. woven 1.941.030 1.638.880 - 15.6 52.148 60.008 15.1 3 4
Shirts 1.128.576 1.015.713 - 10.0 40.600 42.879 5.6 4 4
o.w. woven 801.967 694.869 - 13.4 20.965 28.551 36.2 3 4
Underpants, briefs, etc. 628.066 557.870 - 11.2 1.168 1.438 23.1 0 0o.w. knitted 522.019 474.684 - 9.1 918 920 0.3 0 0
Swimwear 103.161 95.417 - 7.5 222 295 33.0 0 0
Tracksuits 152.703 127.858 - 16.3 879 2.127 142.0 1 2
Women’s Clothing (knittedand woven)
10.769.868 9.981.232 - 7.3 183.126 274.944 50.1 2 3
Overcoats 2.636.874 2.356.063 - 10.6 26.174 39.113 49.4 1 2
o.w. woven 2.318.908 2.085.523 - 10.1 23.198 35.202 51.7 1 2
Suits 32.723 29.803 - 8.9 3.945 7.126 80.7 12 24
o.w. woven 22.770 22.619 - 0.7 3.751 6.866 83.0 16 30
Ensembles 67.695 59.371 - 12.3 11.507 12.868 11.8 17 22
o.w. woven 27.477 24.550 - 10.7 10.889 12.695 16.6 40 52
Jackets 653.738 705.303 7.9 12.707 15.994 25.9 2 2
o.w. woven 509.162 557.500 9.5 11.010 13.790 25.2 2 2
Skirts and dresses 2.066.720 1.944.598 - 5.9 31.978 44.383 38.8 2 2
o.w. woven 1.378.986 1.272.179 - 7.7 23.485 33.632 43.2 2 3
Trousers 2.563.989 2.300.345 - 10.3 27.261 38.521 41.3 1 2
o.w. woven 1.957.610 1.739.052 - 11.2 23.504 34.014 44.7 1 2
Blouses 946.228 938.986 - 0.8 16.994 22.369 31.6 2 2
o.w. woven 706.816 709.390 0.4 13.895 18.120 30.4 2 3
Slips, petticoats, etc. 1.166.429 1.047.787 - 10.2 1.872 3.665 95.8 0 0
o.w. knitted 1.005.006 902.045 - 10.2 1.392 2.236 60.6 0 0
Swimwear 332.431 315.473 - 5.1 583 466 - 19.9 0 0
Tracksuits 237.598 222.576 - 6.3 4.686 5.426 15.8 2 2
Others (knitted and woven) 12.403.360 11.225.131 - 9.5 219.263 282.583 28.9 2 3
Babies’ garments 1.329.983 1.123.682 - 15.5 3.116 5.249 68.5 0 0
o.w. knitted or crocheted 929.875 796.183 - 14.4 1.702 2.169 27.4 0 0
T-shirts 1.433.280 1.336.646 - 6.7 34.319 40.311 17.5 2 3
Jerseys, pullovers, cardigans 4.682.078 4.256.534 - 9.1 45.293 61.292 35.3 1 1
Special garments 1.499.121 1.279.963 - 14.6 61.264 92.628 51.2 4 7
o.w. woven 1.409.188 1.198.522 - 14.9 56.685 77.951 37.5 4 7

8/13/2019 Euratex nr 2
http://slidepdf.com/reader/full/euratex-nr-2 78/214
BULLETIN 2013/2
78
(External Trade) Textile and Clothing Trade 2011 - 2012 (continued)Country :
ChinaIMPORTS EXPORTS Coverage E/I
Unit : 1000 € 2011 2012 Evol. % 2011 2012 Evol. % 2011 2012
Other garments, knitted orcrocheted
223.854 232.784 4.0 34.011 31.800 - 6.5 15 14
Gloves 616.517 523.206 - 15.1 1.493 1.551 3.9 0 0
Ties, bow ties, and cravats 109.110 107.236 - 1.7 5.124 5.934 15.8 5 6
Shawls, scarves, mufflers,mantillas, etc
593.340 580.024 - 2.2 10.504 18.864 79.6 2 3
Pantyhose, tights, stockings,socks, etc
660.791 584.600 - 11.5 5.231 5.938 13.5 1 1
Brassières, girdles, corsets,etc,
931.053 933.938 0.3 9.748 10.683 9.6 1 1
Other accessories 143.840 149.203 3.7 9.215 8.237 - 10.6 6 6
TOTAL Chapter 61 KnittedGarments
13.662.547 12.486.520 - 8.6 176.435 210.655 19.4 1 2
TOTAL Chapter 62 Woven
Garments16.377.150 14.729.402 - 10.1 391.632 546.097 39.4 2 4
Total Clothing - (CH 61+62) 30.053.008 27.234.353 - 9.4 568.067 756.752 33.2 2 3
Total Textile - (CH 50-60+ 63)
7.985.797 7.826.908 - 2.0 1.634.583 1.718.744 5.1 20 22
Total 38.038.804 35.061.261 - 7.8 2.202.650 2.475.497 12.4 6 7

8/13/2019 Euratex nr 2
http://slidepdf.com/reader/full/euratex-nr-2 79/214
BULLETIN 2013/2
79
(External Trade) Textile and Clothing Trade 2011 - 2012Country :
ChinaIMPORTS EXPORTS Coverage E/I
Unit : Tons 2011 2012 Evol. % 2011 2012 Evol. % 2011 2012
Natural fibers 41.839 29.311 - 29.9 196.829 204.680 4.0 470 698
Silk 2.306 1.989 - 13.8 0 1 0 0
o.w. raw silk 1.253 1.226 - 2.2 0 0 0 0
Wool, fine or coarse animalhair
37.215 24.939 - 33.0 36.195 39.179 8.2 97 157
o.w. wool, not carded orcombed
4.477 3.718 - 16.9 31.099 33.678 8.3 695 906
o.w. wool and fine or coarseanimal hair
21.624 13.959 - 35.4 3.183 3.967 24.6 15 28
Cotton 1.121 1.413 26.0 62.864 62.744 - 0.2 5,607 4,441
Other vegetable fibres 1.197 970 - 19.0 97.771 102.755 5.1 8,167 10,593
o.w. flax 247 148 - 39.9 97.766 102.612 5.0 39,662 69,286
Man-made fibres 31.753 37.199 17.2 21.081 27.800 31.9 66 75
Synthetic filament tow 9.047 2.823 - 68.8 7.703 8.117 5.4 85 287Artificial filament tow 71 46 - 34.4 2 441 24377.8 3 952
Synthetic staple fibres 18.547 30.987 67.1 7.168 13.895 93.8 39 45
Artificial staple fibres 3.449 2.821 - 18.2 3.146 2.708 - 13.9 91 96
Yarns and Threads 247.641 240.657 - 2.8 17.912 16.189 - 9.6 7 7
Silk 1.398 1.043 - 25.4 15 35 131.4 1 3
Wool 4.286 3.774 - 12.0 1.174 1.155 - 1.6 27 31
o.w. carded wool, n.p.r.s. 489 376 - 23.2 274 304 10.9 56 81
o.w. combed wool, n.p.r.s. 2.735 2.530 - 7.5 576 467 - 19.0 21 18
Cotton 14.193 10.623 - 25.2 358 446 24.7 3 4
o.w. cotton yarn, n.p.r.s. 13.376 9.876 - 26.2 212 274 29.2 2 3
o.w. cotton yarn, p.r.s. 817 748 - 8.5 145 172 18.0 18 23
Other - Vegetable yarns 9.092 10.399 14.4 1.780 89 - 95.0 20 1
Man-made filaments yarns 202.036 196.731 - 2.6 14.084 13.930 - 1.1 7 7o.w. sewing thread 3.466 3.065 - 11.6 320 425 32.8 9 14
o.w. synthetic filament yarn 188.353 184.303 - 2.2 9.466 10.204 7.8 5 6
o.w. artificial filament yarn 7.391 6.673 - 9.7 701 208 - 70.4 9 3
o.w. synthetic monofilament 1.588 1.523 - 4.1 3.573 3.090 - 13.5 225 203
Man made staple yarns 16.636 18.088 8.7 500 533 6.6 3 3
o.w. man made staple yarns,n.p.r.s.
7.648 9.622 25.8 457 390 - 14.5 6 4
o.w. man made staple yarns,p.r.s.
8.988 8.466 - 5.8 44 143 226.0 0 2
Woven fabrics 310.556 290.971 - 6.3 11.869 12.412 4.6 4 4
Silk 2.902 2.602 - 10.3 127 61 - 52.2 4 2
Wool 1.872 1.642 - 12.3 4.140 3.719 - 10.2 221 226
o.w. carded wool 374 435 16.2 1.882 1.708 - 9.3 504 393
o.w. combed wool 1.002 845 - 15.6 2.257 2.009 - 11.0 225 238
Cotton 71.313 56.563 - 20.7 2.787 2.664 - 4.4 4 5
o.w. cotton, unbleached 20.688 15.134 - 26.8 185 206 11.8 1 1
o.w. cotton, dyed 16.579 13.096 - 21.0 652 497 - 23.8 4 4
o.w. denim fabric 1.333 741 - 44.4 125 41 - 67.0 9 6
Other fabrics 8.127 5.949 - 26.8 299 267 - 10.6 4 4
o.w. flax 6.980 4.935 - 29.3 283 254 - 10.1 4 5
Synthetic and artificial fila-ment yarn
83.760 94.205 12.5 1.785 2.365 32.5 2 3
o.w. synthetic filament yarn 79.033 90.351 14.3 1.490 2.197 47.4 2 2
o.w. artificial filament yarn 4.727 3.853 - 18.5 295 168 - 42.9 6 4
Synthetic and artificialsstaple fibres
103.799 93.562 - 9.9 1.508 1.718 13.9 1 2
o.w. containing > 85% ofsynthetic 15.551 15.598 0.3 180 350 94.1 1 2
o.w. containing < 85% ofsynthetic
13.995 10.671 - 23.7 44 46 4.1 0 0

8/13/2019 Euratex nr 2
http://slidepdf.com/reader/full/euratex-nr-2 80/214
BULLETIN 2013/2
80
(External Trade) Textile and Clothing Trade 2011 - 2012 (continued)Country :
ChinaIMPORTS EXPORTS Coverage E/I
Unit : Tons 2011 2012 Evol. % 2011 2012 Evol. % 2011 2012
o.w. containing < 85% syn-thetic mixed natural fibres
15.569 11.359 - 27.0 442 155 - 64.9 3 1
o.w. other synthetics 43.067 39.394 - 8.5 649 680 4.7 2 2
o.w. artificial staple fibres 15.617 16.540 5.9 193 487 153.0 1 3
Special woven fabrics 38.617 36.113 - 6.5 1.224 1.616 32.0 3 4
o.w. pile fabrics 15.621 14.280 - 8.6 305 459 50.4 2 3
o.w. narrow woven fabrics 13.131 12.368 - 5.8 719 1.000 39.0 5 8
o.w. labels, badges 1.206 1.117 - 7.4 85 66 - 22.4 7 6
o.w. embroidery 4.220 3.674 - 13.0 46 22 - 52.2 1 1
Knitted fabrics 95.994 99.879 4.0 4.672 4.871 4.3 5 5
Pile fabrics 12.470 12.174 - 2.4 1.158 1.384 19.5 9 11
< 30 cm; w 5% or moreelastome
447 565 26.3 385 35 - 90.9 86 6
> 30 cm; w 5% or moreelastome
21.265 22.882 7.6 558 571 2.4 3 2
Curtain fabrics and raschellace
15.011 14.835 - 1.2 1.782 1.928 8.2 12 13
Other fabrics 46.800 49.422 5.6 789 953 20.8 2 2
Carpets 70.112 67.822 - 3.3 4.715 6.018 27.6 7 9
Knotted carpets 2.375 2.111 - 11.1 14 15 8.8 1 1
Woven carpets 20.125 15.504 - 23.0 1.834 2.234 21.8 9 14
Tufted carpets 32.592 34.595 6.1 1.153 1.268 9.9 4 4
Carpets of felt 769 873 13.4 290 320 10.3 38 37
Other textiles 778.939 761.690 - 2.2 61.655 58.485 - 5.1 8 8
Wadding, felt, nonwovens,rubber thread, twine, cor-dage, etc.
93.076 100.755 8.3 23.993 28.881 20.4 26 29
o.w. felt 6.256 7.363 17.7 961 845 - 12.1 15 11o.w. nonwovens 46.865 53.310 13.8 20.716 25.224 21.8 44 47
o.w. special yarn 1.767 1.497 - 15.3 136 150 10.5 8 10
o.w. twine, rope 8.882 8.873 - 0.1 678 731 7.9 8 8
o.w. nets 10.636 10.671 0.3 141 249 77.0 1 2
Handwoven tapestries &quilted products
187 179 - 4.4 25 9 - 64.2 13 5
Impregnated, coated, etc,,textile fabrics
98.290 96.313 - 2.0 13.727 12.819 - 6.6 14 13
o.w. tyre cord fabric 11.986 11.485 - 4.2 888 311 - 65.0 7 3
o.w. fabrics impregnated,coated etc,
55.506 56.936 2.6 5.924 6.171 4.2 11 11
o.w. textile products, articlesfor technical uses
3.653 4.011 9.8 4.169 2.835 - 32.0 114 71
Other made up textilearticles 387.705 349.789 - 9.8 12.696 8.072 - 36.4 3 2
o.w. sacks and bags 52.694 41.885 - 20.5 122 148 21.7 0 0
o.w. tarpaulins, sunblinds& alike
155.537 131.548 - 15.4 195 164 - 15.9 0 0
o.w. other : floorcloths,dishcloths etc
174.098 171.279 - 1.6 646 525 - 18.7 0 0
Worn clothing and otherworn articles
991 1.162 17.2 11.691 7.154 - 38.8 1,179 616
Home textiles 326.556 286.701 - 12.2 629 628 - 0.2 0 0
Bedlinen, table, toilet andkitchen linen
128.783 110.683 - 14.1 255 295 15.6 0 0
o.w. Bedlinen, woven 48.764 39.907 - 18.2 103 138 34.7 0 0
o.w. toilet linen 39.734 33.368 - 16.0 94 87 - 7.2 0 0
o.w. table linen, woven 19.812 18.238 - 7.9 17 21 27.9 0 0
Curtains 74.259 70.229 - 5.4 266 213 - 20.1 0 0
Other furnishing articles 40.311 34.926 - 13.4 41 44 7.0 0 0
Garments 2.184.118 1.783.208 - 18.4 7.424 8.881 19.6 0 0

8/13/2019 Euratex nr 2
http://slidepdf.com/reader/full/euratex-nr-2 81/214
BULLETIN 2013/2
81
(External Trade) Textile and Clothing Trade 2011 - 2012 (continued)Country :
ChinaIMPORTS EXPORTS Coverage E/I
Unit : Tons 2011 2012 Evol. % 2011 2012 Evol. % 2011 2012
Occupationals (woven) 55.629 43.021 - 22.7 37 100 172.8 0 0
Men's ensembles 2.777 1.705 - 38.6 2 3 34.8 0 0
Men's jackets 5.391 4.118 - 23.6 1 7 1240.0 0 0
Men's trousers 16.186 11.635 - 28.1 11 4 - 67.3 0 0
Men's overalls 5.230 3.916 - 25.1 0 2 533.3 0 0
Other men's occupationals 13.660 8.370 - 38.7 15 61 308.8 0 1
Women's ensembles 209 218 4.4 0 0 0 0
Women's jackets 404 422 4.6 0 0 - 50.0 0 0
Women's trousers 6.231 7.446 19.5 3 6 134.6 0 0
Women's overalls 137 67 - 51.5 0 0 0.0 0 0
Other women's occupation-nals
5.404 5.125 - 5.2 5 17 278.3 0 0
Men’s Clothing (knitted and
woven) 538.474 422.221 - 21.6 1.940 2.354 21.3 0 1Overcoats 129.265 93.762 - 27.5 228 288 26.7 0 0
o.w. woven 115.211 83.608 - 27.4 195 257 32.2 0 0
Suits 12.562 10.085 - 19.7 77 102 33.2 1 1
o.w. woven 11.358 8.673 - 23.6 75 101 34.8 1 1
Ensembles 11.445 8.441 - 26.3 54 28 - 47.4 0 0
o.w. woven 5.189 4.186 - 19.3 48 26 - 45.5 1 1
Jackets and blazers 29.593 26.336 - 11.0 157 224 42.8 1 1
o.w. woven 24.813 21.973 - 11.4 115 179 56.7 0 1
Trousers 187.086 148.332 - 20.7 951 1.136 19.4 1 1
o.w. woven 164.181 128.734 - 21.6 933 1.084 16.2 1 1
Shirts 68.055 54.027 - 20.6 416 454 9.0 1 1
o.w. woven 46.693 36.532 - 21.8 192 286 49.0 0 1
Underpants, briefs, etc. 65.907 57.662 - 12.5 24 35 45.8 0 0o.w. knitted 54.982 48.379 - 12.0 16 20 26.1 0 0
Swimwear 5.911 4.538 - 23.2 4 3 - 35.0 0 0
Tracksuits 14.150 9.821 - 30.6 10 14 50.0 0 0
Women’s Clothing (knittedand woven)
724.327 609.407 - 15.9 2.232 2.934 31.4 0 0
Overcoats 170.616 134.567 - 21.1 301 477 58.0 0 0
o.w. woven 147.497 116.351 - 21.1 242 416 72.1 0 0
Suits 3.982 4.499 13.0 19 46 142.9 0 1
o.w. woven 1.908 2.515 31.8 18 45 154.8 1 2
Ensembles 10.811 7.469 - 30.9 63 81 28.5 1 1
o.w. woven 3.630 2.842 - 21.7 59 79 35.0 2 3
Jackets 35.216 33.983 - 3.5 151 207 37.0 0 1
o.w. woven 25.731 25.891 0.6 135 170 25.8 1 1
Skirts and dresses 92.428 76.532 - 17.2 454 445 - 1.9 0 1
o.w. woven 57.051 47.181 - 17.3 259 259 - 0.0 0 1
Trousers 230.741 199.911 - 13.4 730 958 31.2 0 0
o.w. woven 166.487 147.016 - 11.7 571 792 38.8 0 1
Blouses 42.954 37.608 - 12.4 218 302 38.6 1 1
o.w. woven 28.532 26.063 - 8.7 145 199 37.3 1 1
Slips, petticoats, etc. 102.731 84.342 - 17.9 35 92 163.0 0 0
o.w. knitted 86.610 69.661 - 19.6 21 80 284.5 0 0
Swimwear 14.291 13.088 - 8.4 14 3 - 78.7 0 0
Tracksuits 14.388 11.681 - 18.8 50 39 - 22.8 0 0
Others (knitted and woven) 920.908 751.160 - 18.4 3.250 3.591 10.5 0 0
Babies’ garments 78.553 71.748 - 8.7 104 90 - 13.1 0 0
o.w. knitted or crocheted 54.735 44.875 - 18.0 66 53 - 19.8 0 0
T-shirts 107.233 89.558 - 16.5 756 845 11.8 1 1
Jerseys, pullovers, cardigans 290.316 216.621 - 25.4 922 1.008 9.3 0 0
Special garments 125.799 104.814 - 16.7 433 525 21.3 0 1
o.w. woven 119.474 99.806 - 16.5 382 445 16.6 0 0

8/13/2019 Euratex nr 2
http://slidepdf.com/reader/full/euratex-nr-2 82/214
BULLETIN 2013/2
82
(External Trade) Textile and Clothing Trade 2011 - 2012 (continued)Country :
ChinaIMPORTS EXPORTS Coverage E/I
Unit : Tons 2011 2012 Evol. % 2011 2012 Evol. % 2011 2012
Other garments, knitted orcrocheted
17.457 16.686 - 4.4 267 226 - 15.5 2 1
Gloves 65.932 52.339 - 20.6 51 78 54.9 0 0
Ties, bow ties, and cravats 6.236 6.531 4.7 30 30 1.0 0 0
Shawls, scarves, mufflers,mantillas, etc
52.108 45.216 - 13.2 141 149 5.1 0 0
Pantyhose, tights, stockings,socks, etc
101.832 84.812 - 16.7 233 198 - 14.8 0 0
Brassières, girdles, corsets,etc,
41.374 38.341 - 7.3 159 268 68.4 0 1
Other accessories 12.996 13.787 6.1 150 149 - 0.7 1 1
TOTAL Chapter 61 KnittedGarments
1.065.684 856.733 - 19.6 3.260 3.511 7.7 0 0
TOTAL Chapter 62 Woven
Garments1.117.398 926.934 - 17.0 4.164 5.371 29.0 0 1
Total Clothing - (CH 61+62) 2.183.081 1.783.667 - 18.3 7.424 8.882 19.6 0 0
Total Textile - (CH 50-60+ 63)
1.903.484 1.814.551 - 4.7 393.922 416.345 5.7 21 23
Total 4.086.566 3.598.217 - 12.0 401.346 425.227 6.0 10 12

8/13/2019 Euratex nr 2
http://slidepdf.com/reader/full/euratex-nr-2 83/214
BULLETIN 2013/2
83
(External Trade) Textile and Clothing Trade 2011 - 2012Country :
CEI / CIS (excl.
Russie & Baltes)
IMPORTS EXPORTS Coverage E/I
Unit : 1000 € 2011 2012 Evol. % 2011 2012 Evol. % 2011 2012
Natural fibers 89.955 38.350 - 57.4 3.999 4.021 0.5 4 10
Silk 4 49 1150.6 0 2 0 4
Wool, fine or coarse animalhair
2.846 1.565 - 45.0 1.682 2.227 32.4 59 142
o.w. wool, not carded orcombed
676 266 - 60.7 224 242 7.9 33 91
o.w. wool and fine or coarseanimal hair
1.694 958 - 43.4 1.102 940 - 14.6 65 98
Cotton 80.463 30.754 - 61.8 111 22 - 80.2 0 0
Other vegetable fibres 6.642 5.982 - 9.9 2.206 1.770 - 19.8 33 30
o.w. flax 6.641 5.981 - 9.9 2.104 1.541 - 26.7 32 26
Man-made fibres 24.153 24.956 3.3 24.105 23.882 - 0.9 100 96
Synthetic filament tow 12.096 9.976 - 17.5 269 80 - 70.1 2 1Artificial filament tow 0 27 19.980 21.112 5.7 77,191
Synthetic staple fibres 11.287 14.038 24.4 2.836 1.926 - 32.1 25 14
Artificial staple fibres 13 0 - 100.0 384 40 - 89.5 2,966
Yarns and Threads 82.437 79.459 - 3.6 82.821 80.994 - 2.2 100 102
Silk 0 0 82 114 39.4
Wool 316 143 - 54.8 1.068 1.196 12.0 338 838
o.w. carded wool, n.p.r.s. 16 0 - 100.0 231 137 - 40.6 1,462
o.w. combed wool, n.p.r.s. 300 143 - 52.4 674 885 31.3 225 621
Cotton 36.480 33.533 - 8.1 20.044 16.938 - 15.5 55 51
o.w. cotton yarn, n.p.r.s. 36.480 33.533 - 8.1 19.122 15.842 - 17.2 52 47
o.w. cotton yarn, p.r.s. 0 1 922 1.096 18.9 182,69
Other - Vegetable yarns 55 274 396.4 912 477 - 47.6 1,653 174
Man-made filaments yarns 44.986 45.333 0.8 49.403 51.671 4.6 110 114o.w. sewing thread 38 67 74.9 8.975 9.158 2.0 23,329 13,612
o.w. synthetic filament yarn 38.677 38.358 - 0.8 35.721 37.129 3.9 92 97
o.w. artificial filament yarn 140 131 - 6.1 1.234 1.281 3.8 883 975
o.w. synthetic monofilament 6.130 6.776 10.5 3.397 4.073 19.9 55 60
Man made staple yarns 600 176 - 70.6 11.313 10.599 - 6.3 1,886 6,008
o.w. man made staple yarns,n.p.r.s.
597 174 - 70.8 8.583 8.247 - 3.9 1,438 4,736
o.w. man made staple yarns,p.r.s.
3 2 - 20.8 2.730 2.351 - 13.9 94,794 103,136
Woven fabrics 45.567 45.670 0.2 304.340 277.433 - 8.8 668 607
Silk 29 19 - 33.5 3.141 3.134 - 0.2 10,841 16,264
Wool 1.106 928 - 16.1 54.938 48.964 - 10.9 4,968 5,279
o.w. carded wool 844 634 - 24.9 32.453 26.650 - 17.9 3,845 4,205
o.w. combed wool 262 294 12.2 22.467 22.302 - 0.7 8,581 7,591
Cotton 29.404 29.088 - 1.1 85.812 71.575 - 16.6 292 246
o.w. cotton, unbleached 26.765 26.127 - 2.4 1.357 809 - 40.4 5 3
o.w. cotton, dyed 192 229 18.9 30.657 26.555 - 13.4 15,935 11,612
o.w. denim fabric 1.687 1.905 12.9 4.379 4.925 12.5 260 259
Other fabrics 11.139 13.213 18.6 6.329 3.392 - 46.4 57 26
o.w. flax 11.139 13.213 18.6 6.138 3.155 - 48.6 55 24
Synthetic and artificial fila-ment yarn
1.224 981 - 19.9 55.368 56.513 2.1 4,522 5,761
o.w. synthetic filament yarn 1.186 922 - 22.3 46.274 48.175 4.1 3,901 5,227
o.w. artificial filament yarn 38 59 54.8 9.093 8.338 - 8.3 23,749 14,065
Synthetic and artificialsstaple fibres
1.769 855 - 51.7 61.604 54.485 - 11.6 3,483 6,375
o.w. containing > 85% ofsynthetic 88 46 - 47.1 8.147 8.636 6.0 9,276 18,584
o.w. containing < 85% ofsynthetic
46 27 - 41.8 4.754 3.972 - 16.5 10,342 14,837

8/13/2019 Euratex nr 2
http://slidepdf.com/reader/full/euratex-nr-2 84/214
BULLETIN 2013/2
84
(External Trade) Textile and Clothing Trade 2011 - 2012 (continued)Country :
CEI / CIS (excl.
Russie & Baltes)
IMPORTS EXPORTS Coverage E/I
Unit : 1000 € 2011 2012 Evol. % 2011 2012 Evol. % 2011 2012
o.w. containing < 85% syn-thetic mixed natural fibres
106 55 - 48.6 14.836 12.947 - 12.7 13,946 23,69
o.w. other synthetics 1.502 714 - 52.5 24.787 22.479 - 9.3 1,65 3,149
o.w. artificial staple fibres 26 13 - 51.1 9.080 6.451 - 29.0 34,395 49,966
Special woven fabrics 765 576 - 24.7 36.590 39.011 6.6 4,786 6,778
o.w. pile fabrics 21 82 291.3 6.872 7.148 4.0 32,817 8,725
o.w. narrow woven fabrics 579 468 - 19.1 17.753 18.398 3.6 3,065 3,927
o.w. labels, badges 139 19 - 86.2 6.491 6.062 - 6.6 4,654 31,457
o.w. embroidery 4 1 - 80.9 1.823 2.980 63.5 40,956 350,636
Knitted fabrics 3.265 1.907 - 41.6 79.440 75.294 - 5.2 2,433 3,948
Pile fabrics 709 587 - 17.3 5.085 4.782 - 6.0 717 815
< 30 cm; w 5% or more
elastome 4 1 - 80.3 8.460 7.159 - 15.4 205,342 883,874
> 30 cm; w 5% or moreelastome
123 41 - 66.4 21.194 21.770 2.7 17,192 52,508
Curtain fabrics and raschellace
326 353 8.2 12.714 11.579 - 8.9 3,896 3,281
Other fabrics 2.102 925 - 56.0 31.987 30.003 - 6.2 1,522 3,242
Carpets 1.044 1.170 12.0 29.282 33.994 16.1 2,804 2,906
Knotted carpets 514 372 - 27.6 1.235 1.452 17.6 240 390
Woven carpets 344 616 78.9 6.861 6.406 - 6.6 1,993 1,04
Tufted carpets 80 55 - 30.8 14.770 18.484 25.1 18,576 33,577
Carpets of felt 13 49 269.9 1.865 2.404 28.9 14,011 4,882
Other textiles 60.916 56.167 - 7.8 330.781 371.564 12.3 543 662
Wadding, felt, nonwovens,rubber thread, twine, cor-
dage, etc.
14.326 11.157 - 22.1 98.688 104.157 5.5 689 934
o.w. felt 39 55 39.8 7.408 6.141 - 17.1 18,984 11,258
o.w. nonwovens 9.384 9.253 - 1.4 38.014 42.860 12.7 405 463
o.w. special yarn 149 247 65.7 8.460 7.919 - 6.4 5,674 3,206
o.w. twine, rope 1.247 1.085 - 13.0 5.625 7.393 31.4 451 681
o.w. nets 20 40 103.1 1.248 1.389 11.3 6,358 3,485
Handwoven tapestries &quilted products
174 203 17.2 1.939 2.427 25.2 1,117 1,193
Impregnated, coated, etc,,textile fabrics
1.179 725 - 38.5 83.229 84.505 1.5 7,059 11,663
o.w. tyre cord fabric 513 195 - 62.0 1.423 1.424 0.1 277 731
o.w. fabrics impregnated,coated etc,
197 304 54.6 34.380 35.259 2.6 17,47 11,59
o.w. textile products, articles
for technical uses 342 151 - 56.0 22.282 25.337 13.7 6,509 16,827
Other made up textilearticles
22.567 25.163 11.5 128.004 158.735 24.0 567 631
o.w. sacks and bags 5.089 6.793 33.5 1.650 1.393 - 15.6 32 21
o.w. tarpaulins, sunblinds& alike
368 309 - 16.1 2.602 2.648 1.7 706 857
o.w. other : floorcloths,dishcloths etc
13.449 14.807 10.1 15.429 17.846 15.7 115 121
Worn clothing and otherworn articles
3.648 3.233 - 11.4 108.032 136.691 26.5 2,962 4,228
Home textiles 25.450 26.118 2.6 20.755 25.875 24.7 82 99
Bedlinen, table, toilet andkitchen linen
13.558 13.415 - 1.1 11.647 11.989 2.9 86 89
o.w. Bedlinen, woven 4.135 3.475 - 16.0 5.091 4.497 - 11.7 123 129
o.w. toilet linen 205 141 - 31.0 4.543 4.944 8.8 2,216 3,494
o.w. table linen, woven 6.933 7.481 7.9 1.503 2.137 42.2 22 29
Curtains 8.158 8.840 8.4 5.397 7.537 39.7 66 85
Other furnishing articles 3.711 3.694 - 0.5 2.247 2.335 3.9 61 63

8/13/2019 Euratex nr 2
http://slidepdf.com/reader/full/euratex-nr-2 85/214
BULLETIN 2013/2
85
(External Trade) Textile and Clothing Trade 2011 - 2012 (continued)Country :
CEI / CIS (excl.
Russie & Baltes)
IMPORTS EXPORTS Coverage E/I
Unit : 1000 € 2011 2012 Evol. % 2011 2012 Evol. % 2011 2012
Garments 420.420 383.631 - 8.8 800.685 914.454 14.2 190 238
Occupationals (woven) 43.399 37.073 - 14.6 5.135 6.641 29.3 12 18
Men's ensembles 188 149 - 21.1 321 461 43.6 171 311
Men's jackets 8.042 5.405 - 32.8 456 969 112.3 6 18
Men's trousers 12.991 12.936 - 0.4 722 879 21.7 6 7
Men's overalls 10.871 8.234 - 24.3 696 462 - 33.6 6 6
Other men's occupationals 7.143 7.130 - 0.2 2.245 2.630 17.2 31 37
Women's ensembles 86 23 - 73.4 2 10 386.5 2 43
Women's jackets 304 91 - 70.1 166 507 204.7 55 558
Women's trousers 982 898 - 8.6 176 287 63.1 18 32
Women's overalls 29 164 456.2 12 13 7.4 40 8
Other women's occupation-nals 2.763 2.044 - 26.0 339 423 24.8 12 21
Men’s Clothing (knitted andwoven)
165.528 154.384 - 6.7 137.443 164.121 19.4 83 106
Overcoats 27.115 27.729 2.3 22.373 27.971 25.0 83 101
o.w. woven 26.093 27.403 5.0 20.417 26.109 27.9 78 95
Suits 12.186 7.372 - 39.5 14.501 16.007 10.4 119 217
o.w. woven 12.180 7.365 - 39.5 13.779 15.065 9.3 113 205
Ensembles 248 216 - 12.8 13.083 11.884 - 9.2 5,284 5,502
o.w. woven 231 170 - 26.6 12.723 11.284 - 11.3 5,502 6,646
Jackets and blazers 21.720 20.802 - 4.2 8.229 13.961 69.7 38 67
o.w. woven 21.560 20.224 - 6.2 7.457 12.253 64.3 35 61
Trousers 81.723 74.955 - 8.3 41.825 49.141 17.5 51 66
o.w. woven 79.681 74.016 - 7.1 37.955 46.075 21.4 48 62
Shirts 13.045 13.727 5.2 24.263 30.136 24.2 186 220o.w. woven 12.760 10.154 - 20.4 17.333 20.559 18.6 136 202
Underpants, briefs, etc. 2.004 1.962 - 2.1 4.921 5.466 11.1 246 279
o.w. knitted 1.967 1.798 - 8.6 4.044 4.535 12.1 206 252
Swimwear 16 24 51.1 965 1.094 13.3 6,126 4,591
Tracksuits 285 356 24.8 3.946 3.363 - 14.8 1,385 945
Women’s Clothing (knittedand woven)
200.436 179.972 - 10.2 372.423 427.232 14.7 186 237
Overcoats 51.691 46.235 - 10.6 30.423 35.816 17.7 59 77
o.w. woven 50.803 45.047 - 11.3 26.084 31.518 20.8 51 70
Suits 220 284 29.0 7.709 6.595 - 14.5 3,507 2,325
o.w. woven 214 277 29.8 5.743 5.539 - 3.5 2,688 1,997
Ensembles 804 273 - 66.0 81.078 78.779 - 2.8 10,086 28,812
o.w. woven 480 60 - 87.5 80.075 77.803 - 2.8 16,687 129,932Jackets 35.801 33.170 - 7.3 15.211 17.932 17.9 42 54
o.w. woven 30.653 27.624 - 9.9 12.020 14.338 19.3 39 52
Skirts and dresses 35.819 35.790 - 0.1 74.786 103.336 38.2 209 289
o.w. woven 27.018 24.712 - 8.5 50.157 67.747 35.1 186 274
Trousers 43.785 35.147 - 19.7 41.039 52.975 29.1 94 151
o.w. woven 37.384 30.267 - 19.0 33.307 42.856 28.7 89 142
Blouses 18.747 17.901 - 4.5 27.230 35.051 28.7 145 196
o.w. woven 13.091 13.213 0.9 18.314 22.510 22.9 140 170
Slips, petticoats, etc. 4.308 4.320 0.3 23.014 24.830 7.9 534 575
o.w. knitted 4.177 4.127 - 1.2 17.092 18.172 6.3 409 440
Swimwear 2.915 3.445 18.2 9.439 10.833 14.8 324 314
Tracksuits 3.389 1.154 - 66.0 11.938 11.468 - 3.9 352 994
Others (knitted and woven) 54.456 49.274 - 9.5 290.672 322.909 11.1 534 655
Babies’ garments 4.092 4.005 - 2.1 18.911 18.332 - 3.1 462 458
o.w. knitted or crocheted 3.388 3.284 - 3.1 13.243 11.609 - 12.3 391 354
T-shirts 24.176 21.202 - 12.3 51.790 65.122 25.7 214 307
Jerseys, pullovers, cardigans 12.467 9.519 - 23.6 74.904 85.619 14.3 601 899

8/13/2019 Euratex nr 2
http://slidepdf.com/reader/full/euratex-nr-2 86/214
BULLETIN 2013/2
86
(External Trade) Textile and Clothing Trade 2011 - 2012 (continued)Country :
CEI / CIS (excl.Russie & Baltes)
IMPORTS EXPORTS Coverage E/I
Unit : 1000 € 2011 2012 Evol. % 2011 2012 Evol. % 2011 2012
Special garments 4.623 5.036 8.9 23.583 29.056 23.2 510 577
o.w. woven 4.512 4.884 8.2 21.566 26.773 24.1 478 548
Other garments, knitted orcrocheted
623 1.449 132.6 13.881 16.111 16.1 2,228 1,112
Gloves 170 176 3.4 3.491 4.380 25.5 2,053 2,491
Ties, bow ties, and cravats 137 132 - 4.3 3.684 3.887 5.5 2,681 2,956
Shawls, scarves, mufflers,mantillas, etc
427 261 - 39.0 6.970 8.479 21.6 1,633 3,255
Pantyhose, tights, stockings,socks, etc
691 1.210 75.2 34.492 38.773 12.4 4,993 3,204
Brassières, girdles, corsets,etc,
6.308 5.500 - 12.8 31.165 29.915 - 4.0 494 544
Other accessories 730 648 - 11.2 27.850 23.145 - 16.9 3,817 3,573
TOTAL Chapter 61 KnittedGarments
81.974 80.016 - 2.4 296.736 348.928 17.6 362 436
TOTAL Chapter 62 WovenGarments
338.446 303.661 - 10.3 504.220 565.101 12.1 149 186
Total Clothing - (CH 61+62) 420.420 383.677 - 8.7 800.957 914.028 14.1 191 238
Total Textile - (CH 50-60+ 63)
332.902 273.792 - 17.8 900.191 917.267 1.9 270 335
Total 753.322 657.469 - 12.7 1.701.148 1.831.295 7.7 226 279

8/13/2019 Euratex nr 2
http://slidepdf.com/reader/full/euratex-nr-2 87/214
BULLETIN 2013/2
87
(External Trade) Textile and Clothing Trade 2011 - 2012Country :
CroatiaIMPORTS EXPORTS Coverage E/I
Unit : 1000 € 2011 2012 Evol. % 2011 2012 Evol. % 2011 2012
Natural fibers 286 292 2.2 598 308 - 48.4 209 105
Silk 0 0 7 0 - 99.7
o.w. raw silk 0 0 4 0 - 100.0
Wool, fine or coarse animalhair
209 281 34.1 18 27 53.3 8 10
o.w. wool, not carded orcombed
97 100 3.2 4 2 - 57.4 4 2
o.w. wool and fine or coarseanimal hair
0 0 13 25 87.5
Cotton 77 12 - 84.7 543 247 - 54.5 706 2,102
Other vegetable fibres 0 0 30 35 14.9 172,7
o.w. flax 0 0 2 5 160.7
Man-made fibres 269 240 - 10.5 2.250 3.476 54.5 837 1,446
Synthetic filament tow 2 9 473.0 2 3 27.1 134 30Artificial filament tow 0 0 18 1.060 5749.4
Synthetic staple fibres 2 6 155.1 1.199 1.422 18.6 50,808 23,623
Artificial staple fibres 15 11 - 28.9 18 0 - 100.0 117 0
Yarns and Threads 28.780 32.356 12.4 85.061 77.519 - 8.9 296 240
Silk 0 0 64 7 - 89.6
Wool 245 462 88.8 26.204 24.783 - 5.4 10,707 5,363
o.w. carded wool, n.p.r.s. 151 433 186.3 23.783 20.191 - 15.1 15,718 4,66
o.w. combed wool, n.p.r.s. 14 4 - 74.3 2.134 4.420 107.1 15,181 122,102
Cotton 1.680 1.905 13.4 18.503 14.646 - 20.8 1,102 769
o.w. cotton yarn, n.p.r.s. 137 194 41.4 18.409 14.499 - 21.2 13,409 7,469
o.w. cotton yarn, p.r.s. 1.542 1.710 10.9 95 148 56.2 6 9
Other - Vegetable yarns 0 1 77 164 113.5 19,057
Man-made filaments yarns 21.056 19.315 - 8.3 28.420 26.592 - 6.4 135 138o.w. sewing thread 40 7 - 83.5 4.076 2.816 - 30.9 10,299 43,189
o.w. synthetic filament yarn 20.971 19.261 - 8.2 23.257 22.625 - 2.7 111 117
o.w. artificial filament yarn 0 0 195 197 0.8
o.w. synthetic monofilament 3 2 - 17.9 885 897 1.4 35,265 43,552
Man made staple yarns 5.800 10.674 84.0 11.792 11.327 - 3.9 203 106
o.w. man made staple yarns,n.p.r.s.
5.402 10.287 90.4 11.101 10.794 - 2.8 206 105
o.w. man made staple yarns,p.r.s.
398 387 - 2.7 691 532 - 23.0 174 138
Woven fabrics 6.546 6.212 - 5.1 77.146 64.775 - 16.0 1,179 1,043
Silk 55 119 117.4 2.568 2.975 15.9 4,676 2,493
Wool 174 165 - 5.4 21.847 17.533 - 19.7 12,555 10,646
o.w. carded wool 32 18 - 45.5 4.847 4.176 - 13.8 14,996 23,725
o.w. combed wool 142 147 3.8 16.977 13.340 - 21.4 11,982 9,069
Cotton 3.031 1.955 - 35.5 18.217 12.850 - 29.5 601 657
o.w. cotton, unbleached 326 210 - 35.6 523 220 - 57.8 160 105
o.w. cotton, dyed 213 47 - 78.0 3.936 2.766 - 29.7 1,847 5,909
o.w. denim fabric 0 0 687 642 - 6.6
Other fabrics 5 1 - 85.3 1.488 991 - 33.4 30,062 135,803
o.w. flax 0 1 151.7 1.394 941 - 32.5 480,597 128,955
Synthetic and artificial fila-ment yarn
159 107 - 32.9 14.481 13.937 - 3.8 9,126 13,083
o.w. synthetic filament yarn 133 64 - 51.7 9.382 9.541 1.7 7,074 14,886
o.w. artificial filament yarn 26 42 62.9 5.099 4.396 - 13.8 19,573 10,36
Synthetic and artificialsstaple fibres
59 289 390.0 8.538 8.283 - 3.0 14,499 2,87
o.w. containing > 85% ofsynthetic 4 9 154.6 2.459 2.070 - 15.8 68,11 22,522
o.w. containing < 85% ofsynthetic
1 3 217.8 1.582 1.381 - 12.7 156,664 43,02

8/13/2019 Euratex nr 2
http://slidepdf.com/reader/full/euratex-nr-2 88/214
BULLETIN 2013/2
88
(External Trade) Textile and Clothing Trade 2011 - 2012 (continued)Country :
CroatiaIMPORTS EXPORTS Coverage E/I
Unit : 1000 € 2011 2012 Evol. % 2011 2012 Evol. % 2011 2012
o.w. containing < 85% syn-thetic mixed natural fibres
29 58 100.7 847 950 12.2 2,945 1,646
o.w. other synthetics 17 217 1169.8 2.154 2.351 9.1 12,612 1,084
o.w. artificial staple fibres 8 2 - 81.4 1.497 1.531 2.3 17,733 97,527
Special woven fabrics 3.064 3.552 15.9 9.977 8.187 - 17.9 326 230
o.w. pile fabrics 54 146 169.6 989 842 - 14.9 1,831 578
o.w. narrow woven fabrics 2.856 3.268 14.4 4.554 3.660 - 19.6 159 112
o.w. labels, badges 79 33 - 58.2 1.235 1.110 - 10.1 1,572 3,38
o.w. embroidery 10 54 427.3 659 460 - 30.1 6,401 848
Knitted fabrics 190 832 336.9 36.991 32.845 - 11.2 19,432 3,949
Pile fabrics 8 8 - 2.0 1.874 1.204 - 35.8 23,169 15,183
< 30 cm; w 5% or moreelastome
7 4 - 43.2 1.042 802 - 23.1 14,066 19,047
> 30 cm; w 5% or moreelastome
56 574 933.1 15.167 16.187 6.7 27,288 2,819
Curtain fabrics and raschellace
52 32 - 38.3 8.308 6.091 - 26.7 15,846 18,834
Other fabrics 67 213 218.7 10.600 8.561 - 19.2 15,856 4,018
Carpets 435 290 - 33.2 13.690 12.307 - 10.1 3,149 4,238
Knotted carpets 6 0 - 100.0 704 385 - 45.3 12,644
Woven carpets 6 11 76.4 3.180 2.665 - 16.2 49,994 23,756
Tufted carpets 394 209 - 46.9 6.684 6.600 - 1.2 1,697 3,157
Carpets of felt 1 2 228.1 1.601 1.168 - 27.1 250,117 55,6
Other textiles 27.690 25.751 - 7.0 82.985 76.825 - 7.4 300 298
Wadding, felt, nonwovens,rubber thread, twine, cor-dage, etc.
12.527 12.216 - 2.5 30.687 29.008 - 5.5 245 237
o.w. felt 4.236 4.346 2.6 2.525 2.928 16.0 60 67o.w. nonwovens 1.050 460 - 56.2 17.670 16.835 - 4.7 1,683 3,661
o.w. special yarn 6.721 6.900 2.7 1.329 1.012 - 23.8 20 15
o.w. twine, rope 443 485 9.4 2.727 1.898 - 30.4 616 392
o.w. nets 21 16 - 26.1 1.739 1.440 - 17.2 8,289 9,292
Handwoven tapestries &quilted products
3 34 1180.8 518 383 - 26.1 19,549 1,127
Impregnated, coated, etc,,textile fabrics
3.171 2.551 - 19.6 27.968 23.390 - 16.4 882 917
o.w. tyre cord fabric 0 0 17 11 - 36.0
o.w. fabrics impregnated,coated etc,
1.925 1.524 - 20.8 21.958 18.266 - 16.8 1,141 1,199
o.w. textile products, articlesfor technical uses
147 63 - 57.2 3.440 2.642 - 23.2 2,347 4,213
Other made up textilearticles 3.928 2.317 - 41.0 13.145 13.391 1.9 335 578
o.w. sacks and bags 1.244 279 - 77.6 1.524 892 - 41.5 123 320
o.w. tarpaulins, sunblinds& alike
897 552 - 38.4 3.668 4.088 11.4 409 740
o.w. other : floorcloths,dishcloths etc
1.637 1.299 - 20.7 7.026 6.968 - 0.8 429 537
Worn clothing and otherworn articles
137 177 29.2 718 1.371 91.1 522 773
Home textiles 9.063 5.366 - 40.8 13.772 13.624 - 1.1 152 254
Bedlinen, table, toilet andkitchen linen
8.253 4.953 - 40.0 7.998 7.967 - 0.4 97 161
o.w. Bedlinen, woven 5.255 2.854 - 45.7 2.839 3.678 29.5 54 129
o.w. toilet linen 986 287 - 70.9 3.655 2.686 - 26.5 371 937
o.w. table linen, woven 1.950 1.784 - 8.5 736 801 8.8 38 45
Curtains 58 14 - 75.8 2.905 2.675 - 7.9 5,017 19,11
Other furnishing articles 76 19 - 74.6 1.028 1.033 0.5 1,353 5,342
Garments 360.288 338.410 - 6.1 338.662 302.218 - 10.8 94 89

8/13/2019 Euratex nr 2
http://slidepdf.com/reader/full/euratex-nr-2 89/214
BULLETIN 2013/2
89
(External Trade) Textile and Clothing Trade 2011 - 2012 (continued)Country :
CroatiaIMPORTS EXPORTS Coverage E/I
Unit : 1000 € 2011 2012 Evol. % 2011 2012 Evol. % 2011 2012
Occupationals (woven) 1.936 903 - 53.3 3.128 2.607 - 16.7 162 289
Men's ensembles 78 36 - 54.1 180 133 - 26.1 232 374
Men's jackets 353 248 - 29.9 304 262 - 14.0 86 106
Men's trousers 410 357 - 12.8 401 299 - 25.4 98 84
Men's overalls 701 85 - 87.9 281 162 - 42.3 40 192
Other men's occupationals 223 99 - 55.6 1.673 1.455 - 13.0 750 1,47
Women's ensembles 1 2 128.0 17 14 - 16.9 1,809 659
Women's jackets 13 0 - 100.0 37 40 8.0 287
Women's trousers 13 6 - 56.4 26 11 - 59.1 195 183
Women's overalls 21 18 - 14.5 24 11 - 53.3 113 62
Other women's occupation-nals
123 53 - 56.5 185 220 18.9 151 412
Men’s Clothing (knitted and
woven) 61.082 45.918 - 24.8 58.651 53.692 - 8.5 96 117
Overcoats 5.433 4.234 - 22.1 8.268 6.816 - 17.6 152 161
o.w. woven 5.314 4.112 - 22.6 7.468 6.225 - 16.6 141 151
Suits 17.818 12.030 - 32.5 3.122 2.658 - 14.9 18 22
o.w. woven 17.817 12.030 - 32.5 3.035 2.613 - 13.9 17 22
Ensembles 85 65 - 22.9 565 281 - 50.3 668 431
o.w. woven 81 49 - 39.7 486 222 - 54.4 599 453
Jackets and blazers 19.302 16.628 - 13.9 3.382 3.316 - 1.9 18 20
o.w. woven 16.969 14.643 - 13.7 3.007 2.957 - 1.6 18 20
Trousers 5.963 4.846 - 18.7 23.050 22.892 - 0.7 387 472
o.w. woven 4.827 4.207 - 12.8 22.299 22.010 - 1.3 462 523
Shirts 3.561 2.953 - 17.1 12.680 11.469 - 9.6 356 388
o.w. woven 3.105 2.815 - 9.4 8.000 7.020 - 12.2 258 249
Underpants, briefs, etc. 3.318 2.505 - 24.5 3.970 3.198 - 19.4 120 128o.w. knitted 3.135 2.394 - 23.6 3.407 2.698 - 20.8 109 113
Swimwear 3.298 695 - 78.9 826 734 - 11.2 25 106
Tracksuits 1.616 1.323 - 18.2 871 678 - 22.1 54 51
Women’s Clothing (knittedand woven)
68.495 60.809 - 11.2 97.534 87.385 - 10.4 142 144
Overcoats 5.381 3.507 - 34.8 15.243 12.967 - 14.9 283 370
o.w. woven 4.447 2.653 - 40.3 12.405 11.358 - 8.4 279 428
Suits 18 82 359.3 467 579 23.9 2,613 705
o.w. woven 14 79 450.8 327 514 57.4 2,277 650
Ensembles 59 90 53.4 2.010 940 - 53.2 3,416 1,042
o.w. woven 47 39 - 17.2 1.587 685 - 56.9 3,382 1,762
Jackets 9.394 7.669 - 18.4 5.662 5.424 - 4.2 60 71
o.w. woven 7.923 6.129 - 22.6 4.692 4.106 - 12.5 59 67Skirts and dresses 15.647 14.519 - 7.2 20.239 19.028 - 6.0 129 131
o.w. woven 2.520 2.690 6.7 11.660 10.783 - 7.5 463 401
Trousers 6.641 5.212 - 21.5 22.811 20.236 - 11.3 343 388
o.w. woven 2.628 2.146 - 18.3 17.881 15.307 - 14.4 680 713
Blouses 5.968 5.327 - 10.7 13.634 11.208 - 17.8 228 210
o.w. woven 3.939 3.814 - 3.2 8.984 7.388 - 17.8 228 194
Slips, petticoats, etc. 9.725 8.531 - 12.3 7.915 6.768 - 14.5 81 79
o.w. knitted 9.607 8.166 - 15.0 6.976 6.167 - 11.6 73 76
Swimwear 14.566 15.340 5.3 3.513 3.043 - 13.4 24 20
Tracksuits 783 399 - 49.1 2.342 1.951 - 16.7 299 489
Others (knitted and woven) 230.711 231.681 0.4 182.428 161.106 - 11.7 79 70
Babies’ garments 4.187 3.064 - 26.8 6.927 4.442 - 35.9 165 145
o.w. knitted or crocheted 4.086 3.004 - 26.5 5.078 3.308 - 34.8 124 110
T-shirts 18.664 16.099 - 13.7 38.138 34.550 - 9.4 204 215
Jerseys, pullovers, cardigans 84.705 87.458 3.3 45.041 32.948 - 26.8 53 38
Special garments 2.566 1.580 - 38.4 7.278 5.917 - 18.7 284 375
o.w. woven 2.564 1.580 - 38.4 6.323 5.592 - 11.6 247 354

8/13/2019 Euratex nr 2
http://slidepdf.com/reader/full/euratex-nr-2 90/214
BULLETIN 2013/2
90
(External Trade) Textile and Clothing Trade 2011 - 2012 (continued)Country :
CroatiaIMPORTS EXPORTS Coverage E/I
Unit : 1000 € 2011 2012 Evol. % 2011 2012 Evol. % 2011 2012
Other garments, knitted orcrocheted
1.445 675 - 53.3 3.277 3.154 - 3.8 227 467
Gloves 1.369 1.100 - 19.6 1.282 1.149 - 10.4 94 104
Ties, bow ties, and cravats 34 123 258.1 1.192 1.174 - 1.5 3,478 956
Shawls, scarves, mufflers,mantillas, etc
2.993 2.895 - 3.3 3.327 2.614 - 21.4 111 90
Pantyhose, tights, stockings,socks, etc
95.363 97.931 2.7 50.871 55.328 8.8 53 56
Brassières, girdles, corsets,etc,
18.120 19.586 8.1 10.496 9.390 - 10.5 58 48
Other accessories 1.151 1.233 7.1 13.781 9.773 - 29.1 1,197 793
TOTAL Chapter 61 KnittedGarments
265.410 257.319 - 3.0 195.814 175.169 - 10.5 74 68
TOTAL Chapter 62 Woven
Garments94.878 81.091 - 14.5 142.848 127.117 - 11.0 151 157
Total Clothing - (CH 61+62) 360.288 338.410 - 6.1 338.662 302.286 - 10.7 94 89
Total Textile - (CH 50-60+ 63)
73.259 71.347 - 2.6 326.351 299.316 - 8.3 445 420
Total 433.547 409.756 - 5.5 665.012 601.602 - 9.5 153 147

8/13/2019 Euratex nr 2
http://slidepdf.com/reader/full/euratex-nr-2 91/214
BULLETIN 2013/2
91
(External Trade) Textile and Clothing Trade 2011 - 2012Country :
EgyptIMPORTS EXPORTS Coverage E/I
Unit : 1000 € 2011 2012 Evol. % 2011 2012 Evol. % 2011 2012
Natural fibers 24.807 34.835 40.4 32.103 21.098 - 34.3 129 61
Wool, fine or coarse animalhair
140 20.165 14267.6 6.790 4.883 - 28.1 4,838 24
o.w. wool, not carded orcombed
78 158 102.8 421 465 10.4 541 295
o.w. wool and fine or coarseanimal hair
0 19.647 6.368 4.418 - 30.6 22
Cotton 19.189 10.237 - 46.7 24.761 15.394 - 37.8 129 150
Other vegetable fibres 5.477 4.433 - 19.1 552 820 48.5 10 19
o.w. flax 5.263 4.205 - 20.1 552 817 48.0 10 19
Man-made fibres 3.574 1.740 - 51.3 21.759 25.958 19.3 609 1,492
Synthetic filament tow 1.574 845 - 46.3 1.493 1.459 - 2.3 95 173
Artificial filament tow 0 0 6.722 5.820 - 13.4
Synthetic staple fibres 213 276 29.8 12.766 18.195 42.5 5,996 6,584Artificial staple fibres 0 0 3 0 - 100.0 0
Yarns and Threads 146.922 111.797 - 23.9 55.464 50.992 - 8.1 38 46
Silk 0 0 9 9 3.3
Wool 1 0 - 100.0 1.380 1.916 38.9 105,308
o.w. carded wool, n.p.r.s. 0 0 1.060 1.754 65.6
o.w. combed wool, n.p.r.s. 1 0 - 100.0 221 152 - 31.3 16,894
Cotton 136.161 101.554 - 25.4 6.937 7.305 5.3 5 7
o.w. cotton yarn, n.p.r.s. 135.845 101.064 - 25.6 6.513 7.105 9.1 5 7
o.w. cotton yarn, p.r.s. 316 490 54.9 423 200 - 52.7 134 41
Other - Vegetable yarns 2.742 3.223 17.6 182 213 17.0 7 7
Man-made filaments yarns 2.278 1.610 - 29.3 43.565 37.799 - 13.2 1,912 2,348
o.w. sewing thread 23 55 143.0 990 815 - 17.7 4,395 1,489
o.w. synthetic filament yarn 2.072 1.454 - 29.8 32.665 32.161 - 1.5 1,576 2,212o.w. artificial filament yarn 0 0 - 72.2 1.436 872 - 39.3 797,817
o.w. synthetic monofilament 183 101 - 44.9 8.472 3.940 - 53.5 4,622 3,899
Man made staple yarns 5.739 5.410 - 5.7 3.392 3.750 10.5 59 69
o.w. man made staple yarns,n.p.r.s.
5.739 5.311 - 7.5 3.295 3.636 10.3 57 68
o.w. man made staple yarns,p.r.s.
0 99 97 114 17.5 115
Woven fabrics 25.214 31.898 26.5 44.888 46.797 4.3 178 147
Silk 0 1 222.2 152 198 30.4 42,175 17,062
Wool 485 211 - 56.5 12.295 13.264 7.9 2,533 6,277
o.w. carded wool 305 150 - 50.9 1.222 711 - 41.8 400 474
o.w. combed wool 180 61 - 65.9 11.067 12.542 13.3 6,147 20,456
Cotton 19.633 27.514 40.1 15.882 13.860 - 12.7 81 50
o.w. cotton, unbleached 10.960 12.948 18.1 434 257 - 40.7 4 2
o.w. cotton, dyed 5.122 3.231 - 36.9 2.259 2.245 - 0.6 44 69
o.w. denim fabric 175 4.829 2653.7 5.503 4.512 - 18.0 3,138 93
Other fabrics 449 36 - 92.0 795 603 - 24.1 177 1,681
o.w. flax 449 36 - 92.0 737 573 - 22.2 164 1,596
Synthetic and artificial fila-ment yarn
1.501 1.337 - 10.9 7.599 10.016 31.8 506 749
o.w. synthetic filament yarn 1.410 1.327 - 5.9 3.584 5.759 60.7 254 434
o.w. artificial filament yarn 92 10 - 88.9 4.015 4.257 6.0 4,376 41,613
Synthetic and artificialsstaple fibres
2.445 2.133 - 12.8 3.546 3.579 0.9 145 168
o.w. containing > 85% ofsynthetic
1.794 1.605 - 10.5 298 319 6.8 17 20
o.w. containing < 85% of
synthetic 474 381 - 19.7 639 653 2.2 135 172

8/13/2019 Euratex nr 2
http://slidepdf.com/reader/full/euratex-nr-2 92/214
BULLETIN 2013/2
92
(External Trade) Textile and Clothing Trade 2011 - 2012 (continued)Country :
EgyptIMPORTS EXPORTS Coverage E/I
Unit : 1000 € 2011 2012 Evol. % 2011 2012 Evol. % 2011 2012
o.w. containing < 85% syn-thetic mixed natural fibres
3 59 1600.9 568 946 66.7 16,499 1,617
o.w. other synthetics 67 16 - 76.6 1.055 1.279 21.3 1,576 8,165
o.w. artificial staple fibres 108 74 - 31.7 987 382 - 61.3 916 519
Special woven fabrics 585 519 - 11.3 4.619 5.267 14.0 789 1,015
o.w. pile fabrics 87 0 - 99.6 571 536 - 6.2 659 153,123
o.w. narrow woven fabrics 81 35 - 57.4 1.388 1.628 17.3 1,71 4,703
o.w. labels, badges 18 15 - 14.9 1.449 1.091 - 24.7 8,244 7,291
o.w. embroidery 8 0 - 93.9 161 134 - 16.4 2,053 27,983
Knitted fabrics 5.383 7.275 35.1 9.307 8.269 - 11.2 173 114
Pile fabrics 0 0 5.279 4.298 - 18.6
< 30 cm; w 5% or moreelastome
24 39 65.5 101 202 99.3 427 514
> 30 cm; w 5% or moreelastome
1.015 4.913 384.0 1.534 1.492 - 2.8 151 30
Curtain fabrics and raschellace
317 258 - 18.6 411 405 - 1.5 130 157
Other fabrics 4.028 2.065 - 48.7 1.982 1.872 - 5.5 49 91
Carpets 128.954 113.827 - 11.7 1.352 2.503 85.1 1 2
Knotted carpets 531 319 - 39.8 101 142 41.2 19 44
Woven carpets 68.733 65.603 - 4.6 156 204 30.6 0 0
Tufted carpets 43.313 39.517 - 8.8 868 1.066 22.9 2 3
Carpets of felt 3.209 3.883 21.0 42 6 - 86.0 1 0
Other textiles 8.326 7.767 - 6.7 58.539 62.645 7.0 703 807
Wadding, felt, nonwovens,rubber thread, twine, cor-dage, etc.
2.087 1.931 - 7.5 33.554 33.040 - 1.5 1,608 1,711
o.w. felt 0 0 - 100.0 516 394 - 23.5 224,252o.w. nonwovens 640 356 - 44.4 28.550 26.710 - 6.4 4,458 7,505
o.w. special yarn 5 43 760.6 1.345 827 - 38.5 27,053 1,934
o.w. twine, rope 1.374 1.322 - 3.8 1.606 3.608 124.7 117 273
o.w. nets 0 0 85 270 217.2
Handwoven tapestries &quilted products
0 0 - 100.0 15 51 242.0 4,409
Impregnated, coated, etc,,textile fabrics
31 101 229.1 13.278 14.451 8.8 43,196 14,285
o.w. tyre cord fabric 0 1 19 1 - 95.8 124
o.w. fabrics impregnated,coated etc,
2 91 4302.9 1.685 2.308 37.0 81,798 2,545
o.w. textile products, articlesfor technical uses
24 0 - 98.8 6.996 7.912 13.1 29,443
Other made up textilearticles 6.109 5.708 - 6.6 6.783 12.710 87.4 111 223
o.w. sacks and bags 4.348 4.387 0.9 237 808 241.5 5 18
o.w. tarpaulins, sunblinds& alike
68 0 - 100.0 139 1.112 700.7 205
o.w. other : floorcloths,dishcloths etc
1.430 1.132 - 20.9 2.195 1.806 - 17.7 153 160
Worn clothing and otherworn articles
261 184 - 29.3 4.198 8.894 111.9 1,61 4,824
Home textiles 127.052 118.862 - 6.4 1.336 1.771 32.6 1 1
Bedlinen, table, toilet andkitchen linen
122.445 110.987 - 9.4 551 726 31.7 0 1
o.w. Bedlinen, woven 53.067 49.259 - 7.2 344 460 33.9 1 1
o.w. toilet linen 56.191 50.692 - 9.8 140 120 - 14.8 0 0
o.w. table linen, woven 11.032 10.484 - 5.0 57 138 144.2 1 1
Curtains 3.395 7.252 113.6 426 220 - 48.4 13 3
Other furnishing articles 1.073 624 - 41.9 72 159 121.6 7 25
Garments 457.019 382.643 - 16.3 60.229 65.527 8.8 13 17

8/13/2019 Euratex nr 2
http://slidepdf.com/reader/full/euratex-nr-2 93/214
BULLETIN 2013/2
93
(External Trade) Textile and Clothing Trade 2011 - 2012 (continued)Country :
EgyptIMPORTS EXPORTS Coverage E/I
Unit : 1000 € 2011 2012 Evol. % 2011 2012 Evol. % 2011 2012
Occupationals (woven) 1.495 1.199 - 19.7 598 768 28.5 40 64
Men's ensembles 0 0 10 23 134.0
Men's jackets 241 200 - 17.0 8 13 50.2 4 6
Men's trousers 1.080 838 - 22.4 187 10 - 94.6 17 1
Men's overalls 45 54 19.0 0 10 4477.3 0 19
Other men's occupationals 20 7 - 64.3 278 628 125.9 1,388 8,787
Women's ensembles 0 0 26.5 0 0 0 0
Women's jackets 0 0 0 2 679
Women's trousers 67 29 - 57.5 8 1 - 90.6 13 3
Women's overalls 0 0 23 6 - 74.8
Other women's occupation-nals
41 71 75.0 83 76 - 8.6 205 107
Men’s Clothing (knitted and
woven)180.965 158.015 - 12.7 11.113 12.772 14.9 6 8
Overcoats 9.269 2.655 - 71.4 1.132 910 - 19.5 12 34
o.w. woven 8.476 808 - 90.5 779 765 - 1.8 9 95
Suits 11.806 11.484 - 2.7 789 1.020 29.2 7 9
o.w. woven 10.235 9.815 - 4.1 724 921 27.1 7 9
Ensembles 663 289 - 56.4 630 353 - 44.0 95 122
o.w. woven 528 259 - 50.9 419 193 - 54.0 79 74
Jackets and blazers 24.244 24.856 2.5 1.306 1.672 28.0 5 7
o.w. woven 23.803 24.429 2.6 1.274 1.488 16.8 5 6
Trousers 84.598 81.871 - 3.2 3.609 4.473 23.9 4 5
o.w. woven 80.821 74.803 - 7.4 3.520 4.189 19.0 4 6
Shirts 30.996 20.790 - 32.9 2.804 3.168 13.0 9 15
o.w. woven 12.532 12.109 - 3.4 1.985 2.397 20.7 16 20
Underpants, briefs, etc. 18.112 14.985 - 17.3 267 216 - 19.1 1 1o.w. knitted 16.244 13.613 - 16.2 75 90 20.4 0 1
Swimwear 693 302 - 56.4 96 249 160.1 14 82
Tracksuits 218 155 - 28.9 160 55 - 65.7 74 36
Women’s Clothing (knittedand woven)
132.355 110.389 - 16.6 19.263 21.313 10.6 15 19
Overcoats 1.431 1.316 - 8.0 686 1.042 52.0 48 79
o.w. woven 405 157 - 61.3 584 882 50.9 144 561
Suits 580 70 - 87.9 460 506 10.1 79 724
o.w. woven 550 69 - 87.4 407 365 - 10.2 74 526
Ensembles 223 216 - 3.2 1.178 1.071 - 9.1 527 495
o.w. woven 94 178 88.3 1.080 924 - 14.4 1,145 520
Jackets 800 939 17.3 1.484 1.704 14.8 185 182
o.w. woven 550 813 47.8 1.297 1.325 2.1 236 163
Skirts and dresses 10.223 8.034 - 21.4 4.681 4.377 - 6.5 46 54
o.w. woven 4.937 4.649 - 5.8 3.477 3.027 - 12.9 70 65
Trousers 96.488 83.746 - 13.2 3.331 4.451 33.6 3 5
o.w. woven 64.912 58.085 - 10.5 2.789 3.587 28.6 4 6
Blouses 12.557 6.620 - 47.3 3.150 3.015 - 4.3 25 46
o.w. woven 2.919 2.360 - 19.1 2.563 2.135 - 16.7 88 90
Slips, petticoats, etc. 8.855 8.131 - 8.2 964 352 - 63.5 11 4
o.w. knitted 7.178 7.024 - 2.1 125 146 16.3 2 2
Swimwear 432 576 33.5 236 277 17.2 55 48
Tracksuits 702 640 - 8.8 1.298 1.907 46.8 185 298
Others (knitted and woven) 143.543 114.067 - 20.5 29.853 31.437 5.3 21 28
Babies’ garments 11.637 11.264 - 3.2 730 898 23.0 6 8
o.w. knitted or crocheted 11.013 10.933 - 0.7 334 456 36.5 3 4
T-shirts 83.890 64.953 - 22.6 8.739 6.124 - 29.9 10 9
Jerseys, pullovers, cardigans 41.350 30.725 - 25.7 6.723 5.986 - 11.0 16 19
Special garments 914 225 - 75.4 5.003 4.656 - 6.9 547 2,071
o.w. woven 532 216 - 59.5 3.207 3.483 8.6 603 1,615

8/13/2019 Euratex nr 2
http://slidepdf.com/reader/full/euratex-nr-2 94/214
BULLETIN 2013/2
94
(External Trade) Textile and Clothing Trade 2011 - 2012 (continued)Country :
EgyptIMPORTS EXPORTS Coverage E/I
Unit : 1000 € 2011 2012 Evol. % 2011 2012 Evol. % 2011 2012
Other garments, knitted orcrocheted
1.586 1.869 17.9 3.024 7.535 149.2 191 403
Gloves 5 13 144.5 112 191 70.9 2,188 1,529
Ties, bow ties, and cravats 19 16 - 16.3 352 485 37.9 1,832 3,018
Shawls, scarves, mufflers,mantillas, etc
148 129 - 12.4 755 1.052 39.3 511 813
Pantyhose, tights, stockings,socks, etc
2.488 2.363 - 5.0 769 748 - 2.8 31 32
Brassières, girdles, corsets,etc,
267 51 - 80.8 568 443 - 21.9 212 865
Other accessories 643 1.498 133.0 3.105 3.304 6.4 483 221
TOTAL Chapter 61 KnittedGarments
239.291 187.970 - 21.4 26.526 28.548 7.6 11 15
TOTAL Chapter 62 Woven
Garments217.871 194.674 - 10.6 33.710 37.023 9.8 15 19
Total Clothing - (CH 61+62) 457.161 382.643 - 16.3 60.236 65.571 8.9 13 17
Total Textile - (CH 50-60+ 63)
470.327 427.990 - 9.0 249.005 239.895 - 3.7 53 56
Total 927.488 810.634 - 12.6 309.241 305.465 - 1.2 33 38

8/13/2019 Euratex nr 2
http://slidepdf.com/reader/full/euratex-nr-2 95/214
BULLETIN 2013/2
95
(External Trade) Textile and Clothing Trade 2011 - 2012Country :
Hong KongIMPORTS EXPORTS Coverage E/I
Unit : 1000 € 2011 2012 Evol. % 2011 2012 Evol. % 2011 2012
Natural fibers 2.490 4.070 63.4 6.855 9.181 33.9 275 226
Silk 30 3 - 89.4 23 8 - 64.2 78 261
o.w. raw silk 1 0 - 89.3 7 2 - 63.6 785 2,667
Wool, fine or coarse animalhair
2.169 3.496 61.2 2.232 1.023 - 54.1 103 29
o.w. wool, not carded orcombed
0 0 1.320 313 - 76.3
o.w. wool and fine or coarseanimal hair
0 395 139 149 7.1 38
Cotton 287 565 96.7 2.737 2.632 - 3.9 953 466
Other vegetable fibres 5 5 19.6 1.862 5.518 196.3 40,93 101,43
o.w. flax 0 0 1.826 5.478 200.0
Man-made fibres 92 409 345.1 3.907 4.420 13.1 4,254 1,081
Synthetic filament tow 3 27 939.1 961 1.786 85.9 37,237 6,66Artificial filament tow 4 0 - 100.0 290 11 - 96.2 7,485
Synthetic staple fibres 25 208 734.4 1.034 1.467 41.9 4,142 704
Artificial staple fibres 55 0 - 100.0 111 150 34.6 204
Yarns and Threads 2.355 2.061 - 12.5 169.762 177.144 4.3 7,207 8,595
Silk 87 32 - 63.6 1.447 1.394 - 3.7 1,658 4,394
Wool 538 307 - 42.9 124.784 129.217 3.6 23,193 42,031
o.w. carded wool, n.p.r.s. 22 80 259.0 42.476 49.527 16.6 190,56 61,894
o.w. combed wool, n.p.r.s. 84 64 - 23.6 53.204 42.888 - 19.4 63,421 66,918
Cotton 424 814 92.1 9.989 10.854 8.7 2,358 1,334
o.w. cotton yarn, n.p.r.s. 319 688 115.4 7.259 8.278 14.0 2,275 1,204
o.w. cotton yarn, p.r.s. 105 126 20.8 2.729 2.576 - 5.6 2,611 2,041
Other - Vegetable yarns 107 56 - 48.2 5.742 6.320 10.1 5,347 11,362
Man-made filaments yarns 972 628 - 35.5 12.007 11.883 - 1.0 1,235 1,893
o.w. sewing thread 163 45 - 72.1 1.818 1.452 - 20.2 1,118 3,204
o.w. synthetic filament yarn 515 255 - 50.5 5.244 5.345 1.9 1,017 2,093
o.w. artificial filament yarn 58 142 145.7 3.301 2.816 - 14.7 5,709 1,982
o.w. synthetic monofilament 129 180 39.4 1.446 1.751 21.1 1,12 973
Man made staple yarns 227 225 - 0.8 15.792 17.477 10.7 6,967 7,774
o.w. man made staple yarns,n.p.r.s.
35 21 - 41.4 14.917 16.528 10.8 42,632 80,624
o.w. man made staple yarns,p.r.s.
192 204 6.6 875 949 8.4 456 464
Woven fabrics 16.366 19.262 17.7 274.543 262.044 - 4.6 1,678 1,36
Silk 438 325 - 25.8 15.805 12.921 - 18.2 3,605 3,974
Wool 248 180 - 27.4 84.097 82.233 - 2.2 33,851 45,614
o.w. carded wool 56 42 - 25.9 25.400 27.053 6.5 45,019 64,72
o.w. combed wool 188 134 - 28.9 58.625 55.106 - 6.0 31,205 41,253Cotton 914 2.314 153.0 73.970 67.391 - 8.9 8,089 2,913
o.w. cotton, unbleached 68 269 298.4 997 1.545 55.0 1,475 574
o.w. cotton, dyed 207 170 - 17.8 13.135 11.520 - 12.3 6,353 6,777
o.w. denim fabric 157 734 369.2 3.680 2.401 - 34.8 2,351 327
Other fabrics 196 221 12.7 12.095 12.860 6.3 6,159 5,81
o.w. flax 190 216 13.5 10.410 11.543 10.9 5,473 5,347
Synthetic and artificial fila-ment yarn
1.200 1.842 53.5 39.096 42.908 9.7 3,258 2,329
o.w. synthetic filament yarn 1.131 1.651 46.0 30.591 34.422 12.5 2,705 2,085
o.w. artificial filament yarn 69 191 177.2 8.505 8.486 - 0.2 12,332 4,439
Synthetic and artificialsstaple fibres
599 731 22.1 22.436 18.160 - 19.1 3,747 2,484
o.w. containing > 85% of
synthetic 277 239 - 13.9 6.903 3.638 - 47.3 2,49 1,523
o.w. containing < 85% ofsynthetic
42 77 85.4 536 366 - 31.6 1,289 475

8/13/2019 Euratex nr 2
http://slidepdf.com/reader/full/euratex-nr-2 96/214
BULLETIN 2013/2
96
(External Trade) Textile and Clothing Trade 2011 - 2012 (continued)Country :
Hong KongIMPORTS EXPORTS Coverage E/I
Unit : 1000 € 2011 2012 Evol. % 2011 2012 Evol. % 2011 2012
o.w. containing < 85% syn-thetic mixed natural fibres
71 46 - 35.2 1.323 1.803 36.3 1,852 3,893
o.w. other synthetics 127 174 36.5 5.820 5.792 - 0.5 4,572 3,333
o.w. artificial staple fibres 81 195 140.5 7.854 6.561 - 16.5 9,673 3,36
Special woven fabrics 12.769 13.636 6.8 27.038 25.513 - 5.6 212 187
o.w. pile fabrics 21 33 56.3 5.953 4.991 - 16.2 28,042 15,042
o.w. narrow woven fabrics 2.416 2.754 14.0 3.892 4.052 4.1 161 147
o.w. labels, badges 6.183 6.507 5.2 7.619 5.805 - 23.8 123 89
o.w. embroidery 1.132 1.447 27.9 2.877 3.188 10.8 254 220
Knitted fabrics 1.860 2.311 24.2 91.011 81.783 - 10.1 4,893 3,54
Pile fabrics 291 283 - 2.6 3.541 2.475 - 30.1 1,218 873
< 30 cm; w 5% or moreelastome
70 61 - 12.2 1.316 1.265 - 3.9 1,885 2,063
> 30 cm; w 5% or moreelastome
948 1.153 21.6 46.338 41.149 - 11.2 4,887 3,57
Curtain fabrics and raschellace
248 378 52.9 20.522 16.753 - 18.4 8,29 4,427
Other fabrics 303 435 43.3 19.294 20.141 4.4 6,359 4,632
Carpets 1.320 1.395 5.7 5.464 5.953 9.0 414 427
Knotted carpets 108 151 39.5 626 878 40.1 578 580
Woven carpets 540 236 - 56.3 1.429 1.582 10.7 264 670
Tufted carpets 579 713 23.1 2.264 2.316 2.3 391 325
Carpets of felt 2 0 - 90.4 336 461 37.1 15,348 219,362
Other textiles 29.500 27.847 - 5.6 128.041 118.501 - 7.5 434 426
Wadding, felt, nonwovens,rubber thread, twine, cor-dage, etc.
2.504 2.264 - 9.6 47.868 40.295 - 15.8 1,911 1,78
o.w. felt 393 185 - 52.8 13.108 6.473 - 50.6 3,335 3,49o.w. nonwovens 718 681 - 5.1 24.863 23.982 - 3.5 3,462 3,521
o.w. special yarn 62 48 - 23.1 3.185 3.845 20.7 5,146 8,08
o.w. twine, rope 506 430 - 15.0 3.519 3.023 - 14.1 696 703
o.w. nets 101 175 73.6 86 255 195.9 86 146
Handwoven tapestries &quilted products
63 103 62.3 1.747 982 - 43.8 2,761 956
Impregnated, coated, etc,,textile fabrics
2.672 2.995 12.1 59.078 57.141 - 3.3 2,211 1,908
o.w. tyre cord fabric 15 9 - 36.7 137 103 - 24.9 927 1,099
o.w. fabrics impregnated,coated etc,
1.971 2.324 17.9 43.856 42.300 - 3.5 2,225 1,821
o.w. textile products, articlesfor technical uses
523 556 6.3 7.092 7.543 6.4 1,356 1,357
Other made up textilearticles 23.445 21.853 - 6.8 12.653 13.634 7.8 54 62
o.w. sacks and bags 763 890 16.5 1.590 1.594 0.3 208 179
o.w. tarpaulins, sunblinds& alike
2.882 2.310 - 19.9 462 988 114.0 16 43
o.w. other : floorcloths,dishcloths etc
18.772 17.829 - 5.0 4.220 4.223 0.1 22 24
Worn clothing and otherworn articles
30 46 53.3 5.596 6.424 14.8 18,616 13,943
Home textiles 7.457 4.922 - 34.0 6.721 8.730 29.9 90 177
Bedlinen, table, toilet andkitchen linen
2.391 1.716 - 28.2 4.227 5.692 34.7 177 332
o.w. Bedlinen, woven 709 397 - 44.0 2.592 3.910 50.9 365 984
o.w. toilet linen 726 845 16.3 1.004 1.054 5.0 138 125
o.w. table linen, woven 715 333 - 53.5 475 562 18.2 66 169
Curtains 2.883 669 - 76.8 884 1.022 15.6 31 153
Other furnishing articles 412 513 24.5 631 636 0.8 153 124
Garments 433.454 510.949 17.9 1.154.671 1.232.605 6.7 266 241

8/13/2019 Euratex nr 2
http://slidepdf.com/reader/full/euratex-nr-2 97/214
BULLETIN 2013/2
97
(External Trade) Textile and Clothing Trade 2011 - 2012 (continued)Country :
Hong KongIMPORTS EXPORTS Coverage E/I
Unit : 1000 € 2011 2012 Evol. % 2011 2012 Evol. % 2011 2012
Occupationals (woven) 2.757 2.094 - 24.1 5.842 2.011 - 65.6 212 96
Men's ensembles 10 16 50.8 2.592 106 - 95.9 25,093 682
Men's jackets 244 125 - 49.0 146 269 84.0 60 216
Men's trousers 1.014 662 - 34.7 2.163 335 - 84.5 213 51
Men's overalls 200 150 - 25.2 11 13 18.1 6 9
Other men's occupationals 424 118 - 72.1 343 154 - 55.0 81 130
Women's ensembles 2 13 535.5 54 3 - 93.8 2,734 27
Women's jackets 94 95 1.2 222 335 50.8 236 352
Women's trousers 295 467 58.1 202 633 213.2 68 136
Women's overalls 8 6 - 29.2 9 5 - 41.5 117 97
Other women's occupation-nals
465 443 - 4.7 99 156 56.8 21 35
Men’s Clothing (knitted and
woven)87.693 106.786 21.8 251.982 235.167 - 6.7 287 220
Overcoats 16.301 24.103 47.9 44.760 47.237 5.5 275 196
o.w. woven 11.814 15.424 30.6 42.849 44.731 4.4 363 290
Suits 421 538 27.7 31.845 30.493 - 4.2 7,559 5,668
o.w. woven 356 394 10.8 30.691 29.752 - 3.1 8,62 7,542
Ensembles 340 1.454 327.7 18.852 13.015 - 31.0 5,545 895
o.w. woven 282 1.341 376.2 18.714 12.961 - 30.7 6,647 967
Jackets and blazers 6.361 5.468 - 14.0 26.925 32.632 21.2 423 597
o.w. woven 5.798 4.618 - 20.3 23.393 29.973 28.1 403 649
Trousers 28.548 25.346 - 11.2 71.640 55.944 - 21.9 251 221
o.w. woven 23.406 19.791 - 15.4 70.005 52.723 - 24.7 299 266
Shirts 18.420 24.900 35.2 46.381 47.769 3.0 252 192
o.w. woven 14.234 17.071 19.9 35.097 35.322 0.6 247 207
Underpants, briefs, etc. 11.724 15.492 32.1 3.524 2.376 - 32.6 30 15o.w. knitted 8.891 13.102 47.4 3.030 1.760 - 41.9 34 13
Swimwear 3.944 4.296 8.9 500 865 72.8 13 20
Tracksuits 1.035 4.895 373.1 3.731 1.913 - 48.7 361 39
Women’s Clothing (knittedand woven)
157.039 183.373 16.8 361.856 425.758 17.7 230 232
Overcoats 15.916 18.619 17.0 57.394 55.847 - 2.7 361 300
o.w. woven 10.805 12.948 19.8 52.818 52.382 - 0.8 489 405
Suits 615 825 34.2 7.289 13.446 84.5 1,185 1,629
o.w. woven 483 673 39.4 6.841 12.058 76.3 1,417 1,791
Ensembles 1.960 1.804 - 8.0 53.830 44.996 - 16.4 2,746 2,495
o.w. woven 1.642 1.341 - 18.3 53.312 44.433 - 16.7 3,247 3,315
Jackets 7.779 12.700 63.3 29.592 32.699 10.5 380 257
o.w. woven 5.791 9.361 61.6 27.385 29.967 9.4 473 320
Skirts and dresses 44.129 52.204 18.3 65.363 81.358 24.5 148 156
o.w. woven 27.429 33.673 22.8 53.927 65.919 22.2 197 196
Trousers 29.451 38.905 32.1 40.469 42.278 4.5 137 109
o.w. woven 22.402 31.983 42.8 37.086 38.597 4.1 166 121
Blouses 12.232 13.724 12.2 28.040 30.201 7.7 229 220
o.w. woven 9.354 10.304 10.2 23.227 24.415 5.1 248 237
Slips, petticoats, etc. 25.922 24.245 - 6.5 2.696 3.080 14.3 10 13
o.w. knitted 23.625 20.116 - 14.9 1.691 2.028 19.9 7 10
Swimwear 15.019 13.734 - 8.6 493 654 32.7 3 5
Tracksuits 2.330 4.877 109.3 11.885 13.788 16.0 510 283
Others (knitted and woven) 188.700 220.769 17.0 540.642 570.881 5.6 287 259
Babies’ garments 8.753 7.224 - 17.5 4.072 3.984 - 2.2 47 55
o.w. knitted or crocheted 6.622 5.708 - 13.8 2.277 2.303 1.1 34 40
T-shirts 20.012 29.891 49.4 50.872 50.267 - 1.2 254 168
Jerseys, pullovers, cardigans 87.127 111.000 27.4 96.967 89.148 - 8.1 111 80
Special garments 20.741 19.054 - 8.1 215.803 259.599 20.3 1,04 1,362
o.w. woven 18.989 17.556 - 7.5 200.963 229.012 14.0 1,058 1,304

8/13/2019 Euratex nr 2
http://slidepdf.com/reader/full/euratex-nr-2 98/214
BULLETIN 2013/2
98
(External Trade) Textile and Clothing Trade 2011 - 2012 (continued)Country :
Hong KongIMPORTS EXPORTS Coverage E/I
Unit : 1000 € 2011 2012 Evol. % 2011 2012 Evol. % 2011 2012
Other garments, knitted orcrocheted
4.191 4.551 8.6 89.882 77.554 - 13.7 2,145 1,704
Gloves 8.106 6.088 - 24.9 1.441 901 - 37.5 18 15
Ties, bow ties, and cravats 694 890 28.2 11.861 11.370 - 4.1 1,71 1,278
Shawls, scarves, mufflers,mantillas, etc
4.616 3.691 - 20.0 45.136 50.576 12.1 978 1,37
Pantyhose, tights, stockings,socks, etc
1.216 3.002 146.7 3.666 5.376 46.7 301 179
Brassières, girdles, corsets,etc,
29.859 31.902 6.8 3.676 3.828 4.1 12 12
Other accessories 2.805 2.895 3.2 17.780 18.451 3.8 634 637
TOTAL Chapter 61 KnittedGarments
228.594 274.550 20.1 315.488 320.207 1.5 138 117
TOTAL Chapter 62 Woven
Garments204.879 236.460 15.4 839.195 911.712 8.6 410 386
Total Clothing - (CH 61+62) 435.454 512.733 17.7 1.154.684 1.231.920 6.7 265 240
Total Textile - (CH 50-60+ 63)
61.456 62.295 1.4 694.347 673.851 - 3.0 113 1082
Total 496.910 575.029 15.7 1.849.030 1.905.771 3.1 372 331

8/13/2019 Euratex nr 2
http://slidepdf.com/reader/full/euratex-nr-2 99/214
BULLETIN 2013/2
99
EU27 (External Trade) Textile and Clothing Trade 2011 - 2012Country :
IndiaIMPORTS EXPORTS Coverage E/I
Unit : 1000 € 2011 2012 Evol. % 2011 2012 Evol. % 2011 2012
Natural fibers 85.644 75.657 - 11.7 20.022 22.357 11.7 23 30
Silk 1.577 1.823 15.6 88 3 - 96.6 6 0
o.w. raw silk 48 116 143.9 0 0 0 0
Wool, fine or coarse animalhair
32.018 28.683 - 10.4 9.396 9.789 4.2 29 34
o.w. wool, not carded orcombed
418 80 - 80.9 7.000 7.863 12.3 1,675 9,833
o.w. wool and fine or coarseanimal hair
25.827 23.664 - 8.4 1.213 567 - 53.3 5 2
Cotton 39.526 29.316 - 25.8 1.571 1.887 20.1 4 6
Other vegetable fibres 12.522 15.834 26.4 8.968 10.679 19.1 72 67
o.w. flax 349 231 - 33.8 8.941 10.648 19.1 2,562 4,612
Man-made fibres 103.354 93.922 - 9.1 28.802 36.505 26.7 28 39
Synthetic filament tow 642 69 - 89.2 13.792 14.292 3.6 2,149 20,603Artificial filament tow 35 0 - 100.0 534 548 2.5 1,533
Synthetic staple fibres 81.167 78.370 - 3.4 8.631 10.439 21.0 11 13
Artificial staple fibres 19.265 13.282 - 31.1 523 378 - 27.8 3 3
Yarns and Threads 648.863 493.368 - 24.0 33.170 36.051 8.7 5 7
Silk 2.178 1.411 - 35.2 97 167 72.8 4 12
Wool 45.420 42.293 - 6.9 2.613 2.528 - 3.3 6 6
o.w. carded wool, n.p.r.s. 4.295 2.291 - 46.7 553 803 45.2 13 35
o.w. combed wool, n.p.r.s. 40.924 39.851 - 2.6 1.650 1.396 - 15.4 4 4
Cotton 343.342 261.873 - 23.7 1.046 2.173 107.7 0 1
o.w. cotton yarn, n.p.r.s. 341.277 260.048 - 23.8 738 1.015 37.6 0 0
o.w. cotton yarn, p.r.s. 2.065 1.824 - 11.7 308 1.158 275.4 15 63
Other - Vegetable yarns 14.220 11.221 - 21.1 250 266 6.4 2 2
Man-made filaments yarns 98.438 91.443 - 7.1 27.088 29.128 7.5 28 32o.w. sewing thread 1.798 1.779 - 1.0 3.221 2.612 - 18.9 179 147
o.w. synthetic filament yarn 77.123 70.377 - 8.7 17.607 19.820 12.6 23 28
o.w. artificial filament yarn 18.267 18.206 - 0.3 88 189 113.9 0 1
o.w. synthetic monofilament 763 923 20.9 6.110 5.680 - 7.0 801 615
Man made staple yarns 145.265 85.128 - 41.4 2.075 1.788 - 13.9 1 2
o.w. man made staple yarns,n.p.r.s.
144.036 83.962 - 41.7 1.822 1.627 - 10.7 1 2
o.w. man made staple yarns,p.r.s.
1.229 1.166 - 5.1 254 161 - 36.6 21 14
Woven fabrics 448.804 381.198 - 15.1 51.590 43.594 - 15.5 11 11
Silk 50.191 38.378 - 23.5 1.374 748 - 45.5 3 2
Wool 8.415 7.115 - 15.5 9.276 8.118 - 12.5 110 114
o.w. carded wool 1.905 1.446 - 24.1 1.469 1.454 - 1.1 77 101
o.w. combed wool 6.508 5.666 - 12.9 7.792 6.639 - 14.8 120 117
Cotton 177.363 141.639 - 20.1 19.632 15.313 - 22.0 11 11
o.w. cotton, unbleached 81.264 62.260 - 23.4 605 320 - 47.2 1 1
o.w. cotton, dyed 27.124 22.615 - 16.6 1.787 1.299 - 27.3 7 6
o.w. denim fabric 5.473 5.883 7.5 5.674 4.697 - 17.2 104 80
Other fabrics 40.024 33.744 - 15.7 1.108 797 - 28.1 3 2
o.w. flax 11.032 10.692 - 3.1 1.074 703 - 34.6 10 7
Synthetic and artificial fila-ment yarn
56.960 60.560 6.3 7.235 6.183 - 14.5 13 10
o.w. synthetic filament yarn 55.911 59.186 5.9 6.713 5.344 - 20.4 12 9
o.w. artificial filament yarn 1.049 1.373 30.9 522 839 60.7 50 61
Synthetic and artificialsstaple fibres
47.963 35.867 - 25.2 5.412 4.506 - 16.7 11 13
o.w. containing > 85% of
synthetic 1.683 1.697 0.8 1.504 1.653 10.0 89 97
o.w. containing < 85% ofsynthetic
4.549 1.830 - 59.8 359 104 - 71.1 8 6

8/13/2019 Euratex nr 2
http://slidepdf.com/reader/full/euratex-nr-2 100/214
BULLETIN 2013/2
100
EU27 (External Trade) Textile and Clothing Trade 2011 - 2012 (continued)Country :
IndiaIMPORTS EXPORTS Coverage E/I
Unit : 1000 € 2011 2012 Evol. % 2011 2012 Evol. % 2011 2012
o.w. containing < 85% syn-thetic mixed natural fibres
25.775 18.687 - 27.5 408 199 - 51.2 2 1
o.w. other synthetics 13.856 11.775 - 15.0 2.073 1.382 - 33.3 15 12
o.w. artificial staple fibres 2.101 1.878 - 10.6 1.067 1.167 9.4 51 62
Special woven fabrics 67.689 63.741 - 5.8 7.553 7.929 5.0 11 12
o.w. pile fabrics 5.495 4.929 - 10.3 1.230 1.036 - 15.8 22 21
o.w. narrow woven fabrics 1.565 2.026 29.5 3.747 3.191 - 14.8 239 157
o.w. labels, badges 850 932 9.7 1.566 1.799 14.9 184 193
o.w. embroidery 52.404 48.202 - 8.0 311 561 80.4 1 1
Knitted fabrics 9.965 6.074 - 39.0 13.227 13.417 1.4 133 221
Pile fabrics 589 379 - 35.7 4.277 3.353 - 21.6 726 885
< 30 cm; w 5% or moreelastome
259 262 1.1 337 1.064 215.4 130 406
> 30 cm; w 5% or moreelastome
570 311 - 45.5 2.672 3.420 28.0 469 1,101
Curtain fabrics and raschellace
2.057 907 - 55.9 4.220 4.100 - 2.8 205 452
Other fabrics 6.491 4.216 - 35.0 1.721 1.480 - 14.0 27 35
Carpets 396.267 328.542 - 17.1 9.403 8.401 - 10.7 2 3
Knotted carpets 77.364 71.549 - 7.5 404 113 - 71.9 1 0
Woven carpets 187.997 130.374 - 30.7 2.079 1.423 - 31.6 1 1
Tufted carpets 75.401 76.221 1.1 4.722 3.863 - 18.2 6 5
Carpets of felt 908 715 - 21.2 1.169 1.727 47.7 129 242
Other textiles 355.081 344.955 - 2.9 148.527 120.570 - 18.8 42 35
Wadding, felt, nonwovens,rubber thread, twine, cor-dage, etc.
28.457 32.383 13.8 38.697 33.771 - 12.7 136 104
o.w. felt 2.616 2.445 - 6.5 4.674 2.542 - 45.6 179 104o.w. nonwovens 6.059 7.572 25.0 22.384 17.685 - 21.0 369 234
o.w. special yarn 1.045 1.503 43.9 563 788 40.0 54 52
o.w. twine, rope 2.595 2.563 - 1.2 1.494 2.111 41.3 58 82
o.w. nets 3.575 5.116 43.1 368 240 - 34.9 10 5
Handwoven tapestries &quilted products
208 166 - 20.1 374 78 - 79.1 180 47
Impregnated, coated, etc,,textile fabrics
27.529 31.366 13.9 44.198 40.281 - 8.9 161 128
o.w. tyre cord fabric 11.268 15.441 37.0 444 477 7.6 4 3
o.w. fabrics impregnated,coated etc,
5.228 4.815 - 7.9 16.984 13.348 - 21.4 325 277
o.w. textile products, articlesfor technical uses
1.721 3.287 91.0 15.996 14.958 - 6.5 930 455
Other made up textilearticles 287.786 264.677 - 8.0 21.956 25.107 14.4 8 9
o.w. sacks and bags 225.498 208.522 - 7.5 780 1.024 31.3 0 0
o.w. tarpaulins, sunblinds& alike
3.041 3.616 18.9 1.796 811 - 54.8 59 22
o.w. other : floorcloths,dishcloths etc
48.896 44.256 - 9.5 1.736 2.281 31.4 4 5
Worn clothing and otherworn articles
10.046 7.918 - 21.2 17.110 20.665 20.8 170 261
Home textiles 712.750 580.679 - 18.5 3.912 3.086 - 21.1 1 1
Bedlinen, table, toilet andkitchen linen
467.491 395.064 - 15.5 1.256 927 - 26.1 0 0
o.w. Bedlinen, woven 164.225 134.272 - 18.2 692 241 - 65.2 0 0
o.w. toilet linen 201.733 175.370 - 13.1 226 517 128.7 0 0
o.w. table linen, woven 92.601 77.535 - 16.3 78 95 21.7 0 0
Curtains 95.054 71.704 - 24.6 2.007 1.485 - 26.0 2 2
Other furnishing articles 121.144 88.635 - 26.8 248 160 - 35.4 0 0
Garments 4.651.584 3.981.891 - 14.4 52.386 53.004 1.2 1 1

8/13/2019 Euratex nr 2
http://slidepdf.com/reader/full/euratex-nr-2 101/214
BULLETIN 2013/2
101
EU27 (External Trade) Textile and Clothing Trade 2011 - 2012 (continued)Country :
IndiaIMPORTS EXPORTS Coverage E/I
Unit : 1000 € 2011 2012 Evol. % 2011 2012 Evol. % 2011 2012
Occupationals (woven) 54.594 41.826 - 23.4 448 324 - 27.6 1 1
Men's ensembles 1.808 1.555 - 14.0 21 53 156.9 1 3
Men's jackets 4.816 4.029 - 16.3 98 28 - 70.9 2 1
Men's trousers 16.166 10.382 - 35.8 19 14 - 28.2 0 0
Men's overalls 4.727 4.336 - 8.3 0 14 0 0
Other men's occupationals 11.632 8.254 - 29.0 227 132 - 41.7 2 2
Women's ensembles 115 68 - 41.2 0 18 0 26
Women's jackets 294 369 25.2 16 6 - 65.3 6 2
Women's trousers 1.193 883 - 26.0 46 1 - 96.9 4 0
Women's overalls 169 188 11.6 0 1 0 0
Other women's occupation-nals
13.673 11.762 - 14.0 21 56 170.8 0 0
Men’s Clothing (knitted and
woven)968.848 854.085 - 11.8 14.852 15.677 5.6 2 2
Overcoats 18.424 22.738 23.4 1.133 1.163 2.6 6 5
o.w. woven 13.068 15.869 21.4 1.029 1.087 5.5 8 7
Suits 3.888 4.522 16.3 768 420 - 45.3 20 9
o.w. woven 3.650 4.172 14.3 732 395 - 46.0 20 9
Ensembles 5.491 4.450 - 19.0 632 472 - 25.3 12 11
o.w. woven 2.765 2.514 - 9.1 622 468 - 24.7 22 19
Jackets and blazers 21.466 23.157 7.9 1.397 1.349 - 3.4 7 6
o.w. woven 18.905 20.790 10.0 1.221 1.147 - 6.1 6 6
Trousers 236.247 211.854 - 10.3 5.755 7.636 32.7 2 4
o.w. woven 206.325 189.447 - 8.2 5.680 7.489 31.8 3 4
Shirts 497.492 429.286 - 13.7 3.777 3.817 1.1 1 1
o.w. woven 343.944 294.878 - 14.3 2.917 2.639 - 9.5 1 1
Underpants, briefs, etc. 168.293 145.809 - 13.4 293 203 - 30.9 0 0o.w. knitted 147.442 131.206 - 11.0 230 192 - 16.5 0 0
Swimwear 704 238 - 66.2 38 69 80.1 5 29
Tracksuits 4.934 3.246 - 34.2 727 336 - 53.8 15 10
Women’s Clothing (knittedand woven)
2.175.100 1.799.552 - 17.3 15.062 16.193 7.5 1 1
Overcoats 26.649 22.848 - 14.3 733 853 16.3 3 4
o.w. woven 14.524 12.824 - 11.7 622 802 28.9 4 6
Suits 11.014 9.003 - 18.3 201 161 - 20.0 2 2
o.w. woven 6.107 4.847 - 20.6 177 130 - 26.5 3 3
Ensembles 16.345 14.299 - 12.5 1.121 1.278 13.9 7 9
o.w. woven 11.057 11.157 0.9 1.097 1.250 13.9 10 11
Jackets 20.370 20.769 2.0 606 862 42.3 3 4
o.w. woven 14.577 14.273 - 2.1 527 740 40.3 4 5
Skirts and dresses 762.645 602.949 - 20.9 2.649 3.515 32.7 0 1
o.w. woven 625.301 485.587 - 22.3 1.825 2.438 33.6 0 1
Trousers 249.446 214.379 - 14.1 2.784 4.587 64.8 1 2
o.w. woven 152.054 132.248 - 13.0 2.434 4.166 71.2 2 3
Blouses 787.654 646.255 - 18.0 2.980 2.994 0.5 0 0
o.w. woven 675.254 547.775 - 18.9 1.944 2.199 13.1 0 0
Slips, petticoats, etc. 206.694 175.307 - 15.2 291 263 - 9.7 0 0
o.w. knitted 178.484 152.020 - 14.8 246 211 - 14.4 0 0
Swimwear 964 991 2.8 95 90 - 6.0 10 9
Tracksuits 74.010 75.462 2.0 1.737 288 - 83.4 2 0
Others (knitted and woven) 1.507.623 1.328.222 - 11.9 22.472 21.135 - 6.0 1 2
Babies’ garments 243.077 226.233 - 6.9 675 661 - 2.0 0 0
o.w. knitted or crocheted 179.395 169.957 - 5.3 489 417 - 14.7 0 0
T-shirts 708.888 571.571 - 19.4 5.896 4.152 - 29.6 1 1
Jerseys, pullovers, cardigans 187.900 168.347 - 10.4 3.404 2.638 - 22.5 2 2
Special garments 8.690 14.315 64.7 3.750 3.123 - 16.7 43 22
o.w. woven 8.435 14.161 67.9 2.927 1.672 - 42.9 35 12

8/13/2019 Euratex nr 2
http://slidepdf.com/reader/full/euratex-nr-2 102/214
BULLETIN 2013/2
102
EU27 (External Trade) Textile and Clothing Trade 2011 - 2012 (continued)Country :
IndiaIMPORTS EXPORTS Coverage E/I
Unit : 1000€
2011 2012 Evol. % 2011 2012 Evol. % 2011 2012Other garments, knitted orcrocheted
42.666 40.080 - 6.1 3.511 5.325 51.7 8 13
Gloves 17.272 17.667 2.3 235 266 13.1 1 2
Ties, bow ties, and cravats 1.380 1.313 - 4.9 611 548 - 10.3 44 42
Shawls, scarves, mufflers,mantillas, etc
245.108 235.361 - 4.0 945 920 - 2.6 0 0
Pantyhose, tights, stockings,socks, etc
19.861 15.972 - 19.6 1.547 1.519 - 1.8 8 10
Brassières, girdles, corsets,etc,
13.666 17.897 31.0 380 528 39.1 3 3
Other accessories 11.803 14.227 20.5 1.572 1.597 1.6 13 11
TOTAL Chapter 61 KnittedGarments
2.072.319 1.771.728 - 14.5 20.390 20.670 1.4 1 1
TOTAL Chapter 62 Woven
Garments 2.579.266 2.210.163 - 14.3 31.996 32.334 1.1 1 1
Total Clothing - (CH 61+62) 4.653.757 3.985.076 - 14.4 52.386 53.004 1.2 1 1
Total Textile - (CH 50-60+ 63)
2.762.299 2.306.031 - 16.5 351.646 324.589 - 7.7 13 14
Total 7.416.056 6.291.107 - 15.2 404.032 377.593 - 6.5 5 6

8/13/2019 Euratex nr 2
http://slidepdf.com/reader/full/euratex-nr-2 103/214
BULLETIN 2013/2
103
EU27 (External Trade) Textile and Clothing Trade 2011 - 2012Country :
IndiaIMPORTS EXPORTS Coverage E/I
Unit : Tons 2011 2012 Evol. % 2011 2012 Evol. % 2011 2012
Natural fibers 68.740 77.222 12.3 13.297 16.010 20.4 19 21
Silk 102 96 - 5.6 1 0 - 100.0 1 0
o.w. raw silk 1 4 270.0 0 0 0 0
Wool, fine or coarse animalhair
4.474 3.777 - 15.6 8.658 10.538 21.7 194 279
o.w. wool, not carded orcombed
111 20 - 81.7 7.934 10.184 28.4 7,148 50,166
o.w. wool and fine or coarseanimal hair
2.968 2.282 - 23.1 258 213 - 17.5 9 9
Cotton 22.205 21.512 - 3.1 551 816 48.2 2 4
Other vegetable fibres 41.959 51.837 23.5 4.088 4.655 13.9 10 9
o.w. flax 316 203 - 35.9 4.045 4.629 14.4 1,279 2,282
Man-made fibres 72.089 73.687 2.2 17.813 22.204 24.7 25 30
Synthetic filament tow 438 34 - 92.2 6.433 6.938 7.9 1,468 20,227Artificial filament tow 24 0 - 100.0 552 562 1.8 2,291
Synthetic staple fibres 59.283 63.228 6.7 3.795 4.814 26.8 6 8
Artificial staple fibres 9.761 7.775 - 20.3 252 192 - 23.8 3 2
Yarns and Threads 196.703 166.343 - 15.4 6.545 6.313 - 3.5 3 4
Silk 76 59 - 22.4 2 10 494.1 2 17
Wool 4.541 3.421 - 24.7 200 252 25.9 4 7
o.w. carded wool, n.p.r.s. 987 504 - 49.0 60 84 40.8 6 17
o.w. combed wool, n.p.r.s. 3.535 2.910 - 17.7 101 110 8.9 3 4
Cotton 89.267 79.485 - 11.0 193 308 59.3 0 0
o.w. cotton yarn, n.p.r.s. 88.984 79.261 - 10.9 166 212 28.1 0 0
o.w. cotton yarn, p.r.s. 283 224 - 20.8 28 96 245.3 10 43
Other - Vegetable yarns 11.028 11.116 0.8 98 61 - 37.5 1 1
Man-made filaments yarns 46.678 43.381 - 7.1 5.819 5.527 - 5.0 12 13o.w. sewing thread 390 325 - 16.5 238 177 - 25.7 61 54
o.w. synthetic filament yarn 41.131 38.064 - 7.5 4.487 4.348 - 3.1 11 11
o.w. artificial filament yarn 4.959 4.770 - 3.8 16 9 - 47.2 0 0
o.w. synthetic monofilament 166 191 14.9 1.076 959 - 10.8 648 503
Man made staple yarns 45.113 28.880 - 36.0 233 155 - 33.4 1 1
o.w. man made staple yarns,n.p.r.s.
44.876 28.649 - 36.2 224 145 - 35.4 0 1
o.w. man made staple yarns,p.r.s.
236 231 - 2.3 9 10 14.4 4 4
Woven fabrics 76.179 64.276 - 15.6 3.597 2.829 - 21.3 5 4
Silk 792 581 - 26.7 28 32 14.9 4 6
Wool 534 434 - 18.7 204 240 17.6 38 55
o.w. carded wool 223 198 - 11.4 64 110 70.9 29 56
o.w. combed wool 311 236 - 24.0 139 129 - 7.2 45 55
Cotton 30.553 24.747 - 19.0 1.883 1.249 - 33.6 6 5
o.w. cotton, unbleached 17.435 13.489 - 22.6 93 24 - 73.7 1 0
o.w. cotton, dyed 4.489 3.925 - 12.6 341 230 - 32.6 8 6
o.w. denim fabric 1.104 1.207 9.4 588 542 - 7.9 53 45
Other fabrics 18.498 15.752 - 14.8 47 45 - 5.3 0 0
o.w. flax 687 429 - 37.5 45 22 - 50.6 7 5
Synthetic and artificial fila-ment yarn
12.541 12.045 - 4.0 551 514 - 6.6 4 4
o.w. synthetic filament yarn 12.471 11.949 - 4.2 527 486 - 7.7 4 4
o.w. artificial filament yarn 70 97 37.4 24 28 17.2 34 29
Synthetic and artificialsstaple fibres
9.973 7.802 - 21.8 448 416 - 7.2 4 5
o.w. containing > 85% of
synthetic 135 144 6.9 80 86 8.7 59 60
o.w. containing < 85% ofsynthetic
460 198 - 56.9 82 8 - 90.0 18 4

8/13/2019 Euratex nr 2
http://slidepdf.com/reader/full/euratex-nr-2 104/214
BULLETIN 2013/2
104
EU27 (External Trade) Textile and Clothing Trade 2011 - 2012 (continued)Country :
IndiaIMPORTS EXPORTS Coverage E/I
Unit : Tons 2011 2012 Evol. % 2011 2012 Evol. % 2011 2012
o.w. containing < 85% syn-thetic mixed natural fibres
7.746 6.175 - 20.3 46 17 - 63.4 1 0
o.w. other synthetics 1.465 1.131 - 22.8 131 98 - 24.9 9 9
o.w. artificial staple fibres 167 154 - 7.5 109 206 88.9 65 133
Special woven fabrics 3.242 2.893 - 10.7 436 333 - 23.7 13 12
o.w. pile fabrics 573 466 - 18.6 87 49 - 44.0 15 10
o.w. narrow woven fabrics 265 381 43.9 299 219 - 26.8 113 57
o.w. labels, badges 17 15 - 10.4 29 41 41.9 168 266
o.w. embroidery 1.683 1.349 - 19.9 3 6 111.1 0 0
Knitted fabrics 2.188 1.476 - 32.6 717 761 6.1 33 52
Pile fabrics 110 69 - 37.1 208 292 40.0 189 420
< 30 cm; w 5% or moreelastome
47 71 50.3 8 41 432.9 16 57
> 30 cm; w 5% or moreelastome
161 91 - 43.5 135 137 2.0 84 151
Curtain fabrics and raschellace
350 139 - 60.3 236 177 - 25.2 67 127
Other fabrics 1.519 1.105 - 27.2 130 115 - 12.0 9 10
Carpets 102.012 83.863 - 17.8 2.778 3.123 12.4 3 4
Knotted carpets 9.089 6.342 - 30.2 68 14 - 79.4 1 0
Woven carpets 51.763 39.209 - 24.3 312 343 9.9 1 1
Tufted carpets 19.690 18.301 - 7.1 1.163 1.120 - 3.7 6 6
Carpets of felt 144 119 - 16.8 811 1.335 64.7 565 1,118
Other textiles 147.166 140.725 - 4.4 113.088 107.129 - 5.3 77 76
Wadding, felt, nonwovens,rubber thread, twine, cor-dage, etc.
8.283 8.947 8.0 9.420 7.812 - 17.1 114 87
o.w. felt 360 339 - 5.8 865 499 - 42.3 240 147o.w. nonwovens 2.524 3.282 30.0 7.183 6.066 - 15.6 285 185
o.w. special yarn 179 266 48.5 23 24 8.0 13 9
o.w. twine, rope 1.168 998 - 14.5 176 121 - 31.3 15 12
o.w. nets 916 1.023 11.6 39 10 - 75.3 4 1
Handwoven tapestries &quilted products
39 9 - 76.6 11 4 - 68.8 29 38
Impregnated, coated, etc,,textile fabrics
7.402 7.941 7.3 4.243 3.346 - 21.2 57 42
o.w. tyre cord fabric 2.296 3.466 50.9 254 211 - 16.7 11 6
o.w. fabrics impregnated,coated etc,
2.482 2.142 - 13.7 1.488 1.209 - 18.8 60 56
o.w. textile products, articlesfor technical uses
244 452 85.5 968 954 - 1.4 397 211
Other made up textilearticles 123.457 113.603 - 8.0 89.927 89.891 - 0.0 73 79
o.w. sacks and bags 111.629 102.521 - 8.2 197 215 9.3 0 0
o.w. tarpaulins, sunblinds& alike
751 824 9.8 237 72 - 69.8 32 9
o.w. other : floorcloths,dishcloths etc
6.794 6.350 - 6.5 88 97 10.6 1 2
Worn clothing and otherworn articles
4.248 3.881 - 8.7 89.237 89.493 0.3 2,101 2,306
Home textiles 107.198 85.625 - 20.1 288 927 221.6 0 1
Bedlinen, table, toilet andkitchen linen
73.171 61.330 - 16.2 150 789 427.5 0 1
o.w. Bedlinen, woven 25.075 20.219 - 19.4 59 12 - 79.2 0 0
o.w. toilet linen 34.477 30.203 - 12.4 55 769 1289.9 0 3
o.w. table linen, woven 12.102 9.846 - 18.6 3 4 65.4 0 0
Curtains 11.726 8.408 - 28.3 55 78 43.2 0 1
Other furnishing articles 18.341 12.362 - 32.6 57 21 - 62.5 0 0
Garments 220.727 185.686 - 15.9 1.668 1.438 - 13.8 1 1

8/13/2019 Euratex nr 2
http://slidepdf.com/reader/full/euratex-nr-2 105/214
BULLETIN 2013/2
105
EU27 (External Trade) Textile and Clothing Trade 2011 - 2012 (continued)Country :
IndiaIMPORTS EXPORTS Coverage E/I
Unit : Tons 2011 2012 Evol. % 2011 2012 Evol. % 2011 2012
Occupationals (woven) 5.150 3.738 - 27.4 18 10 - 42.7 0 0
Men's ensembles 173 146 - 15.7 2 2 - 37.5 1 1
Men's jackets 432 371 - 14.3 1 1 - 50.0 0 0
Men's trousers 1.598 962 - 39.8 1 0 - 71.4 0 0
Men's overalls 422 378 - 10.4 0 1 0 0
Other men's occupationals 1.119 739 - 34.0 12 3 - 72.9 1 0
Women's ensembles 7 3 - 58.5 0 0 0 11
Women's jackets 20 17 - 11.2 1 0 - 100.0 4 0
Women's trousers 81 56 - 30.9 0 0 - 100.0 0 0
Women's overalls 12 10 - 14.7 0 0 0 0
Other women's occupation-nals
1.288 1.057 - 17.9 1 3 300.0 0 0
Men’s Clothing (knitted and
woven) 54.773 46.589 - 14.9 387 396 2.2 1 1Overcoats 869 1.033 18.9 22 20 - 8.2 3 2
o.w. woven 589 642 8.9 19 19 - 0.5 3 3
Suits 156 154 - 1.3 8 3 - 66.3 5 2
o.w. woven 134 138 3.4 7 2 - 64.2 5 2
Ensembles 412 311 - 24.6 7 3 - 52.9 2 1
o.w. woven 229 208 - 9.1 7 3 - 54.3 3 2
Jackets and blazers 1.189 1.291 8.6 19 21 14.5 2 2
o.w. woven 1.040 1.149 10.5 16 17 3.1 2 1
Trousers 14.460 11.976 - 17.2 198 238 20.0 1 2
o.w. woven 12.147 10.450 - 14.0 195 234 20.5 2 2
Shirts 22.641 19.398 - 14.3 80 89 11.6 0 0
o.w. woven 14.031 12.000 - 14.5 57 46 - 19.0 0 0
Underpants, briefs, etc. 13.625 11.466 - 15.8 7 4 - 48.0 0 0o.w. knitted 11.820 10.303 - 12.8 6 4 - 38.1 0 0
Swimwear 35 11 - 68.1 0 8 2600.0 1 73
Tracksuits 257 185 - 28.2 33 5 - 84.2 13 3
Women’s Clothing (knittedand woven)
86.795 71.292 - 17.9 425 523 23.1 0 1
Overcoats 1.241 1.022 - 17.6 16 15 - 7.0 1 1
o.w. woven 514 422 - 17.9 13 13 0.0 3 3
Suits 565 452 - 20.0 11 4 - 61.6 2 1
o.w. woven 277 226 - 18.3 1 4 263.6 0 2
Ensembles 880 785 - 10.8 7 146 1927.8 1 19
o.w. woven 581 624 7.5 7 98 1301.4 1 16
Jackets 695 709 2.0 13 13 0.8 2 2
o.w. woven 424 409 - 3.5 12 12 - 3.4 3 3
Skirts and dresses 25.544 19.976 - 21.8 109 83 - 24.2 0 0
o.w. woven 19.838 15.307 - 22.8 80 41 - 48.6 0 0
Trousers 13.647 11.427 - 16.3 85 141 66.5 1 1
o.w. woven 7.061 5.872 - 16.8 72 125 74.5 1 2
Blouses 25.111 20.827 - 17.1 81 55 - 32.1 0 0
o.w. woven 20.127 16.226 - 19.4 35 34 - 2.6 0 0
Slips, petticoats, etc. 15.213 12.556 - 17.5 11 6 - 44.1 0 0
o.w. knitted 13.727 11.174 - 18.6 9 5 - 48.3 0 0
Swimwear 25 25 - 2.8 2 2 33.3 7 10
Tracksuits 2.406 2.258 - 6.2 45 6 - 87.9 2 0
Others (knitted and woven) 79.157 67.804 - 14.3 856 519 - 39.4 1 1
Babies’ garments 11.313 10.905 - 3.6 17 12 - 28.1 0 0
o.w. knitted or crocheted 9.251 8.994 - 2.8 13 9 - 31.5 0 0
T-shirts 40.502 32.070 - 20.8 247 121 - 51.2 1 0
Jerseys, pullovers, cardigans 10.799 9.460 - 12.4 135 107 - 20.5 1 1
Special garments 348 688 97.7 79 39 - 50.8 23 6
o.w. woven 337 681 102.2 74 27 - 63.9 22 4

8/13/2019 Euratex nr 2
http://slidepdf.com/reader/full/euratex-nr-2 106/214
BULLETIN 2013/2
106
EU27 (External Trade) Textile and Clothing Trade 2011 - 2012 (continued)Country :
IndiaIMPORTS EXPORTS Coverage E/I
Unit : Tons 2011 2012 Evol. % 2011 2012 Evol. % 2011 2012
Other garments, knitted orcrocheted
1.917 1.855 - 3.2 200 107 - 46.6 10 6
Gloves 1.609 1.576 - 2.0 24 12 - 49.4 1 1
Ties, bow ties, and cravats 60 38 - 37.2 5 10 95.9 8 26
Shawls, scarves, mufflers,mantillas, etc
9.518 8.577 - 9.9 7 8 7.0 0 0
Pantyhose, tights, stockings,socks, etc
1.765 1.316 - 25.5 95 34 - 63.8 5 3
Brassières, girdles, corsets,etc,
378 425 12.4 6 11 69.4 2 2
Other accessories 434 521 20.0 43 67 56.7 10 13
TOTAL Chapter 61 KnittedGarments
122.586 102.838 - 16.1 880 605 - 31.3 1 1
TOTAL Chapter 62 Woven
Garments98.132 82.858 - 15.6 787 833 5.8 1 1
Total Clothing - (CH 61+62) 220.718 185.697 - 15.9 1.668 1.437 - 13.8 1 1
Total Textile - (CH 50-60+ 63)
772.654 693.199 - 10.3 170.740 170.324 - 0.2 22 25
Total 993.372 878.896 - 11.5 172.407 171.761 - 0.4 17 20

8/13/2019 Euratex nr 2
http://slidepdf.com/reader/full/euratex-nr-2 107/214
BULLETIN 2013/2
107
EU27 (External Trade) Textile and Clothing Trade 2011 - 2012Country :
IndonesiaIMPORTS EXPORTS Coverage E/I
Unit : 1000 € 2011 2012 Evol. % 2011 2012 Evol. % 2011 2012
Natural fibers 14.920 6.195 - 58.5 26.558 59.022 122.2 178 953
Wool, fine or coarse animalhair
16 4 - 72.4 0 46 0 1,033
o.w. wool and fine or coarseanimal hair
0 0 0 40
o.w. wool and fine or coarseanimal hair
0 0 0 6
Cotton 14.627 6.047 - 58.7 26.537 58.895 121.9 181 974
Other vegetable fibres 277 144 - 48.2 21 81 286.9 8 56
o.w. flax 0 0 21 81 286.9
Man-made fibres 59.095 46.403 - 21.5 2.625 1.771 - 32.5 4 4
Synthetic filament tow 80 0 - 99.9 1.632 739 - 54.7 2,039
Artificial filament tow 56 233 317.8 69 292 322.2 124 125
Synthetic staple fibres 40.332 30.334 - 24.8 770 715 - 7.1 2 2Artificial staple fibres 18.388 15.684 - 14.7 52 10 - 81.3 0 0
Yarns and Threads 232.676 190.700 - 18.0 7.303 9.655 32.2 3 5
Silk 4.036 1.557 - 61.4 17 286 1533.3 0 18
Wool 0 0 2 3 90.2
o.w. carded wool, n.p.r.s. 4.036 1.557 - 61.4 16 226 1325.0 0 15
o.w. combed wool, n.p.r.s. 18.526 15.363 - 17.1 216 135 - 37.3 1 1
Cotton 18.504 15.351 - 17.0 205 134 - 34.5 1 1
o.w. cotton yarn, n.p.r.s. 22 12 - 44.0 11 1 - 88.5 51 11
o.w. cotton yarn, p.r.s. 187 118 - 37.1 77 12 - 84.8 41 10
Other - Vegetable yarns 60.209 46.594 - 22.6 6.071 7.139 17.6 10 15
Man-made filaments yarns 36 285 686.9 934 475 - 49.1 2,583 167
o.w. sewing thread 58.700 44.977 - 23.4 4.754 5.483 15.3 8 12
o.w. synthetic filament yarn 887 854 - 3.8 337 1.009 199.8 38 118o.w. artificial filament yarn 584 428 - 26.8 44 167 282.8 7 39
o.w. synthetic monofilament 149.717 127.068 - 15.1 923 2.083 125.8 1 2
Man made staple yarns 147.776 125.286 - 15.2 843 2.044 142.5 1 2
o.w. man made staple yarns,n.p.r.s.
1.941 1.782 - 8.2 80 39 - 50.7 4 2
o.w. man made staple yarns,p.r.s.
93.943 83.673 - 10.9 30.452 23.487 - 22.9 32 28
Woven fabrics 37 42 12.0 86 126 46.1 232 303
Silk 10 0 - 98.0 4.105 3.055 - 25.6 41,764
Wool 0 0 1.450 836 - 42.3 418,115
o.w. carded wool 10 0 - 100.0 2.652 2.217 - 16.4 26,982
o.w. combed wool 38.277 32.995 - 13.8 7.845 6.514 - 17.0 20 20
Cotton 18.155 19.320 6.4 62 94 52.0 0 0
o.w. cotton, unbleached 2.275 2.435 7.0 1.691 1.416 - 16.3 74 58
o.w. cotton, dyed 109 59 - 45.9 23 61 169.5 21 104
o.w. denim fabric 23 9 - 60.1 1.717 527 - 69.3 7,446 5,732
Other fabrics 4 9 130.6 1.672 451 - 73.0 41,91 4,907
o.w. flax 17.188 20.585 19.8 4.743 4.936 4.1 28 24
Synthetic and artificial fila-ment yarn
16.925 20.323 20.1 4.705 4.672 - 0.7 28 23
o.w. synthetic filament yarn 263 262 - 0.4 37 264 607.2 14 101
o.w. artificial filament yarn 35.780 27.706 - 22.6 8.346 4.093 - 51.0 23 15
Synthetic and artificialsstaple fibres
2.341 1.868 - 20.2 199 283 41.7 9 15
o.w. containing > 85% ofsynthetic
10.977 10.639 - 3.1 84 79 - 6.4 1 1
o.w. containing < 85% of
synthetic19.522 11.659 - 40.3 6.599 2.380 - 63.9 34 20

8/13/2019 Euratex nr 2
http://slidepdf.com/reader/full/euratex-nr-2 108/214
BULLETIN 2013/2
108
EU27 (External Trade) Textile and Clothing Trade 2011 - 2012 (continued)Country :
IndonesiaIMPORTS EXPORTS Coverage E/I
Unit : 1000 € 2011 2012 Evol. % 2011 2012 Evol. % 2011 2012
o.w. containing < 85% syn-thetic mixed natural fibres
607 921 51.6 1.205 928 - 23.0 198 101
o.w. other synthetics 2.333 2.619 12.3 259 424 63.6 11 16
o.w. artificial staple fibres 2.628 2.328 - 11.4 3.609 4.236 17.4 137 182
Special woven fabrics 93 159 71.2 402 501 24.7 433 316
o.w. pile fabrics 1.740 1.388 - 20.2 1.277 1.352 5.8 73 97
o.w. narrow woven fabrics 56 28 - 50.0 1.078 946 - 12.2 1,913 3,358
o.w. labels, badges 576 466 - 19.0 349 830 137.5 61 178
o.w. embroidery 7.821 8.979 14.8 9.187 10.065 9.6 117 112
Knitted fabrics 257 87 - 66.1 2.642 2.748 4.0 1,03 3,159
Pile fabrics 0 7 18075.0 50 44 - 11.5 124,15 605
< 30 cm; w 5% or moreelastome
4.576 6.435 40.6 1.115 2.192 96.6 24 34
> 30 cm; w 5% or moreelastome
1.673 1.968 17.6 3.148 3.089 - 1.9 188 157
Curtain fabrics and raschellace
1.316 482 - 63.4 2.234 1.993 - 10.8 170 413
Other fabrics 2.488 3.965 59.4 2.825 3.122 10.5 114 79
Carpets 11 93 776.8 57 30 - 46.8 541 33
Knotted carpets 305 282 - 7.2 1.086 1.057 - 2.6 356 374
Woven carpets 756 716 - 5.3 1.561 1.873 20.0 206 262
Tufted carpets 8 33 332.2 71 36 - 49.3 923 108
Carpets of felt 36.707 49.117 33.8 49.153 45.927 - 6.6 134 94
Other textiles 5.564 8.315 49.4 9.004 10.634 18.1 162 128
Wadding, felt, nonwovens,rubber thread, twine, cor-dage, etc.
20 0 - 99.4 494 410 - 17.0 2,438 315,615
o.w. felt 1.048 1.612 53.7 5.651 6.369 12.7 539 395o.w. nonwovens 4 10 164.8 34 77 124.3 940 796
o.w. special yarn 244 286 17.5 669 607 - 9.3 275 212
o.w. twine, rope 2.700 2.449 - 9.3 85 10 - 88.4 3 0
o.w. nets 4 18 403.7 173 130 - 24.8 4,925 735
Handwoven tapestries &quilted products
6.603 7.734 17.1 37.060 32.343 - 12.7 561 418
Impregnated, coated, etc,,textile fabrics
0 0 52 208 300.4
o.w. tyre cord fabric 218 342 56.6 15.550 12.107 - 22.1 7,121 3,539
o.w. fabrics impregnated,coated etc,
372 376 1.0 15.582 12.355 - 20.7 4,189 3,29
o.w. textile products, articlesfor technical uses
24.066 24.557 2.0 1.415 776 - 45.1 6 3
Other made up textilearticles 19.499 18.029 - 7.5 34 56 65.0 0 0
o.w. sacks and bags 414 492 18.8 511 24 - 95.4 123 5
o.w. tarpaulins, sunblinds& alike
3.714 5.925 59.5 651 518 - 20.4 18 9
o.w. other : floorcloths,dishcloths etc
433 104 - 75.9 215 147 - 31.3 50 142
Worn clothing and otherworn articles
24.269 16.839 - 30.6 412 458 11.1 2 3
Home textiles 14.808 9.651 - 34.8 91 92 1.0 1 1
Bedlinen, table, toilet andkitchen linen
8.495 4.420 - 48.0 63 36 - 43.5 1 1
o.w. Bedlinen, woven 6.050 4.770 - 21.2 18 55 200.7 0 1
o.w. toilet linen 226 400 76.6 3 2 - 47.7 1 0
o.w. table linen, woven 6.587 4.501 - 31.7 259 286 10.5 4 6
Curtains 2.663 2.207 - 17.1 27 64 137.7 1 3
Other furnishing articles 1.250.174 1.189.535 - 4.9 41.088 49.719 21.0 3 4
Garments 17.602 6.808 - 61.3 331 373 12.8 2 5

8/13/2019 Euratex nr 2
http://slidepdf.com/reader/full/euratex-nr-2 109/214
BULLETIN 2013/2
109
EU27 (External Trade) Textile and Clothing Trade 2011 - 2012 (continued)Country :
IndonesiaIMPORTS EXPORTS Coverage E/I
Unit : 1000 € 2011 2012 Evol. % 2011 2012 Evol. % 2011 2012
Occupationals (woven) 11 50 371.4 6 0 - 100.0 58 0
Men’s ensembles 1.083 158 - 85.4 54 99 85.1 5 63
o.w. jackets 5.025 1.577 - 68.6 5 189 3475.3 0 12
o.w. trousers 259 173 - 33.1 9 0 - 100.0 4 0
o.w. overalls 3.518 1.892 - 46.2 253 60 - 76.1 7 3
o.w. Others 6 8 37.3 0 1 0 7
Women’s ensembles 558 80 - 85.7 3 2 - 19.9 1 3
o.w. jackets 1.977 579 - 70.7 0 9 2112.5 0 2
o.w. trousers 0 4 0 0 0
o.w. others 5.166 2.289 - 55.7 0 12 10000.0 0 1
Men’s Clothing (knitted andwoven)
368.016 342.413 - 7.0 8.849 11.241 27.0 2 3
Overcoats 88.836 89.796 1.1 577 597 3.5 1 1
o.w. woven 78.373 74.792 - 4.6 482 520 7.9 1 1
Suits 150 68 - 54.5 395 495 25.2 264 726
o.w. woven 145 66 - 54.3 393 495 25.7 271 745
Ensembles 617 881 42.8 7 86 1121.0 1 10
o.w. woven 124 70 - 43.5 6 73 1113.7 5 104
Jackets and blazers 11.366 11.734 3.2 1.267 1.715 35.4 11 15
o.w. woven 10.575 10.314 - 2.5 1.164 1.482 27.3 11 14
Trousers 109.964 106.760 - 2.9 3.074 4.409 43.4 3 4
o.w. woven 101.078 95.243 - 5.8 3.013 4.335 43.9 3 5
Shirts 138.829 114.104 - 17.8 3.024 3.566 17.9 2 3
o.w. woven 108.059 88.157 - 18.4 2.285 2.752 20.4 2 3
Underpants, briefs, etc. 10.395 9.623 - 7.4 142 204 43.8 1 2
o.w. knitted 8.307 7.792 - 6.2 133 188 41.5 2 2
Swimwear 728 1.069 46.8 74 25 - 66.1 10 2
Tracksuits 3.515 6.391 81.8 28 77 175.2 1 1
Women’s Clothing (knittedand woven)
435.715 406.364 - 6.7 17.656 22.260 26.1 4 5
Overcoats 107.205 95.119 - 11.3 608 1.019 67.7 1 1
o.w. woven 75.613 74.211 - 1.9 562 927 65.1 1 1
Suits 575 529 - 8.0 238 112 - 52.9 41 21
o.w. woven 506 454 - 10.3 48 108 126.2 9 24
Ensembles 807 504 - 37.5 9 76 748.9 1 15
o.w. woven 462 201 - 56.5 9 76 741.8 2 38
Jackets 15.368 12.086 - 21.4 1.264 1.732 37.1 8 14
o.w. woven 12.526 9.909 - 20.9 1.140 1.605 40.7 9 16
Skirts and dresses 60.489 56.030 - 7.4 5.966 6.474 8.5 10 12
o.w. woven 38.042 35.181 - 7.5 4.325 4.525 4.6 11 13Trousers 104.654 107.462 2.7 3.872 5.325 37.5 4 5
o.w. woven 68.033 65.999 - 3.0 3.386 4.741 40.0 5 7
Blouses 95.807 87.672 - 8.5 5.005 6.021 20.3 5 7
o.w. woven 84.691 77.560 - 8.4 4.308 4.847 12.5 5 6
Slips, petticoats, etc. 33.811 30.275 - 10.5 141 222 57.9 0 1
o.w. knitted 26.239 26.419 0.7 128 212 65.1 0 1
Swimwear 3.095 4.711 52.2 19 33 73.0 1 1
Tracksuits 8.170 9.318 14.0 235 274 16.7 3 3
Others (knitted and woven) 446.442 440.725 - 1.3 14.583 16.211 11.2 3 4
Babies’ garments 20.867 18.636 - 10.7 416 427 2.4 2 2
o.w. knitted or crocheted 17.316 14.771 - 14.7 333 304 - 8.9 2 2
T-shirts 81.368 90.324 11.0 6.949 6.992 0.6 9 8
Jerseys, pullovers, cardigans 130.678 103.349 - 20.9 3.076 3.803 23.6 2 4Special garments 65.666 64.386 - 1.9 888 1.295 45.8 1 2
o.w. woven 64.578 63.532 - 1.6 405 730 80.1 1 1

8/13/2019 Euratex nr 2
http://slidepdf.com/reader/full/euratex-nr-2 110/214
BULLETIN 2013/2
110
EU27 (External Trade) Textile and Clothing Trade 2011 - 2012 (continued)Country :
IndonesiaIMPORTS EXPORTS Coverage E/I
Unit : 1000 € 2011 2012 Evol. % 2011 2012 Evol. % 2011 2012
Other garments, knitted orcrocheted
6.805 7.043 3.5 262 326 24.2 4 5
Gloves 16.595 16.048 - 3.3 74 57 - 23.3 0 0
Ties, bow ties, and cravats 292 179 - 38.5 177 178 0.4 61 99
Shawls, scarves, mufflers,mantillas, etc
6.057 5.094 - 15.9 184 276 50.2 3 5
Pantyhose, tights, stockings,socks, etc
59.416 63.277 6.5 450 353 - 21.5 1 1
Brassières, girdles, corsets,etc,
46.373 48.397 4.4 95 179 88.2 0 0
Other accessories 1.187 3.781 218.4 2.020 2.310 14.4 170 61
TOTAL Chapter 61 KnittedGarments
510.694 499.426 - 2.2 16.125 18.476 14.6 3 4
TOTAL Chapter 62 Woven
Garments739.480 690.109 - 6.7 24.963 31.243 25.2 3 5
Total Clothing 1.253.709 1.191.620 - 5.0 41.088 49.719 21.0 3 4
Total Textile 472.591 407.850 - 13.7 147.367 171.615 16.5 31 42
Total 1.726.300 1.599.470 - 7.3 188.455 221.334 17.4 11 14

8/13/2019 Euratex nr 2
http://slidepdf.com/reader/full/euratex-nr-2 111/214

8/13/2019 Euratex nr 2
http://slidepdf.com/reader/full/euratex-nr-2 112/214
BULLETIN 2013/2
112
EU27 (External Trade) Textile and Clothing Trade 2011 - 2012 (continued)Country :
JapanIMPORTS EXPORTS Coverage E/I
Unit : 1000 € 2011 2012 Evol. % 2011 2012 Evol. % 2011 2012
o.w. containing < 85% syn-thetic mixed natural fibres
531 551 3.6 560 892 59.3 105 162
o.w. other synthetics 2.678 2.429 - 9.3 3.607 3.896 8.0 135 160
o.w. artificial staple fibres 2.350 2.438 3.7 3.818 5.510 44.3 162 226
Special woven fabrics 7.642 7.707 0.8 16.525 19.276 16.6 216 250
o.w. pile fabrics 783 767 - 2.0 5.272 6.443 22.2 673 840
o.w. narrow woven fabrics 5.387 5.341 - 0.9 3.594 3.721 3.6 67 70
o.w. labels, badges 409 370 - 9.5 994 957 - 3.7 243 259
o.w. embroidery 258 361 40.0 2.895 3.674 26.9 1,124 1,019
Knitted fabrics 10.348 11.269 8.9 26.612 34.672 30.3 257 308
Pile fabrics 597 2.258 278.3 5.902 8.117 37.5 989 359
< 30 cm; w 5% or moreelastome
415 523 26.1 475 393 - 17.3 115 75
> 30 cm; w 5% or moreelastome
425 292 - 31.3 1.992 3.889 95.2 469 1,332
Curtain fabrics and raschellace
3.796 2.560 - 32.6 10.196 11.138 9.2 269 435
Other fabrics 5.115 5.634 10.2 8.047 11.136 38.4 157 198
Carpets 370 535 44.6 30.945 35.180 13.7 8,373 6,582
Knotted carpets 16 30 88.8 929 1.020 9.8 5,775 3,358
Woven carpets 57 257 352.0 19.471 19.779 1.6 34,19 7,684
Tufted carpets 162 132 - 18.6 7.878 11.772 49.4 4,865 8,931
Carpets of felt 17 13 - 22.8 1.008 992 - 1.6 5,815 7,406
Other textiles 183.634 185.704 1.1 167.967 183.185 9.1 91 99
Wadding, felt, nonwovens,rubber thread, twine, cor-dage, etc.
79.121 85.539 8.1 96.302 110.838 15.1 122 130
o.w. felt 861 1.326 53.9 1.665 1.955 17.4 193 147o.w. nonwovens 45.376 55.129 21.5 51.386 59.932 16.6 113 109
o.w. special yarn 7.788 6.914 - 11.2 317 740 133.8 4 11
o.w. twine, rope 2.517 2.481 - 1.4 2.426 2.872 18.4 96 116
o.w. nets 720 895 24.4 2.612 2.783 6.5 363 311
Handwoven tapestries &quilted products
10 51 389.1 251 309 22.9 2,399 603
Impregnated, coated, etc,,textile fabrics
50.271 51.243 1.9 30.894 35.380 14.5 61 69
o.w. tyre cord fabric 4.989 6.290 26.1 8 51 522.1 0 1
o.w. fabrics impregnated,coated etc,
17.657 18.756 6.2 10.188 10.173 - 0.1 58 54
o.w. textile products, articlesfor technical uses
16.508 14.768 - 10.5 14.950 17.474 16.9 91 118
Other made up textilearticles 13.662 13.999 2.5 25.048 22.934 - 8.4 183 164
o.w. sacks and bags 238 85 - 64.2 1.641 2.292 39.7 688 2,682
o.w. tarpaulins, sunblinds& alike
389 629 61.6 2.005 2.672 33.3 515 425
o.w. other : floorcloths,dishcloths etc
11.902 12.072 1.4 14.857 8.913 - 40.0 125 74
Worn clothing and otherworn articles
1.069 1.156 8.2 5.161 7.725 49.7 483 668
Home textiles 1.109 1.393 25.6 24.359 27.775 14.0 2,196 1,994
Bedlinen, table, toilet andkitchen linen
694 687 - 0.9 17.493 19.078 9.1 2,522 2,776
o.w. Bedlinen, woven 35 85 142.9 3.246 4.397 35.4 9,27 5,169
o.w. toilet linen 599 541 - 9.8 11.562 11.512 - 0.4 1,93 2,129
o.w. table linen, woven 34 46 35.4 2.068 2.469 19.4 6,098 5,375
Curtains 76 170 125.0 1.756 2.390 36.1 2,317 1,402
Other furnishing articles 260 387 48.7 2.316 2.600 12.2 891 672
Garments 53.682 56.340 5.0 1.097.829 1.289.513 17.5 2,045 2,289

8/13/2019 Euratex nr 2
http://slidepdf.com/reader/full/euratex-nr-2 113/214
BULLETIN 2013/2
113
EU27 (External Trade) Textile and Clothing Trade 2011 - 2012 (continued)Country :
JapanIMPORTS EXPORTS Coverage E/I
Unit : 1000 € 2011 2012 Evol. % 2011 2012 Evol. % 2011 2012
Occupationals (woven) 467 399 - 14.6 2.737 3.194 16.7 586 800
Men's ensembles 34 21 - 38.6 283 37 - 87.1 825 174
Men's jackets 71 63 - 10.1 195 345 76.4 277 543
Men's trousers 41 62 50.0 411 624 52.0 993 1,006
Men's overalls 0 0 50 84 67.7 25,397
Other men's occupationals 170 88 - 48.5 394 344 - 12.5 231 393
Women's ensembles 0 65 155 66 - 57.7 101
Women's jackets 22 13 - 38.3 389 146 - 62.6 1,798 1,09
Women's trousers 18 7 - 63.0 70 411 489.8 391 6,234
Women's overalls 7 0 - 100.0 45 112 148.0 662
Other women's occupation-nals
105 80 - 24.0 746 1.026 37.6 713 1,29
Men’s Clothing (knitted and
woven)15.441 15.190 - 1.6 199.723 242.029 21.2 1,293 1,593
Overcoats 2.181 2.086 - 4.4 44.452 57.648 29.7 2,038 2,763
o.w. woven 1.900 1.874 - 1.4 39.860 49.757 24.8 2,098 2,655
Suits 245 204 - 16.9 16.893 22.531 33.4 6,896 11,062
o.w. woven 227 192 - 15.5 16.475 21.756 32.1 7,253 11,33
Ensembles 489 482 - 1.4 15.010 14.935 - 0.5 3,07 3,099
o.w. woven 453 431 - 4.7 13.785 14.717 6.8 3,046 3,411
Jackets and blazers 2.913 2.802 - 3.8 22.254 24.915 12.0 764 889
o.w. woven 2.579 2.501 - 3.0 19.179 20.542 7.1 744 821
Trousers 6.602 6.765 2.5 56.723 68.956 21.6 859 1,019
o.w. woven 6.255 6.365 1.8 54.018 65.632 21.5 864 1,031
Shirts 2.177 2.021 - 7.2 23.474 32.199 37.2 1,078 1,593
o.w. woven 1.423 1.230 - 13.6 17.914 24.771 38.3 1,259 2,015
Underpants, briefs, etc. 118 132 12.0 1.996 1.988 - 0.4 1,694 1,507o.w. knitted 43 28 - 33.7 1.361 1.068 - 21.6 3,187 3,769
Swimwear 68 55 - 19.3 849 1.303 53.5 1,247 2,372
Tracksuits 331 317 - 4.2 3.338 2.588 - 22.5 1,009 817
Women’s Clothing (knittedand woven)
19.963 21.379 7.1 449.521 482.362 7.3 2,252 2,256
Overcoats 3.266 2.637 - 19.2 52.355 54.918 4.9 1,603 2,082
o.w. woven 2.786 2.158 - 22.6 47.794 50.239 5.1 1,716 2,329
Suits 126 145 14.9 9.660 5.733 - 40.7 7,677 3,966
o.w. woven 107 144 34.6 8.908 4.592 - 48.5 8,348 3,198
Ensembles 736 1.145 55.5 38.601 31.151 - 19.3 5,243 2,721
o.w. woven 719 1.122 56.0 38.255 30.638 - 19.9 5,317 2,73
Jackets 3.082 4.651 50.9 28.585 28.967 1.3 927 623
o.w. woven 2.858 3.444 20.5 23.728 23.919 0.8 830 694
Skirts and dresses 5.852 5.086 - 13.1 76.779 90.884 18.4 1,312 1,787
o.w. woven 4.454 3.903 - 12.4 61.712 70.976 15.0 1,386 1,818
Trousers 2.719 3.047 12.1 36.779 44.858 22.0 1,353 1,472
o.w. woven 1.940 2.505 29.1 33.133 40.968 23.6 1,708 1,636
Blouses 1.572 2.030 29.1 34.631 34.444 - 0.5 2,203 1,697
o.w. woven 1.237 1.795 45.1 29.455 29.720 0.9 2,38 1,656
Slips, petticoats, etc. 417 322 - 22.8 4.123 4.033 - 2.2 988 1,252
o.w. knitted 146 115 - 20.8 2.474 2.304 - 6.9 1,7 1,998
Swimwear 29 122 315.7 650 499 - 23.1 2,212 409
Tracksuits 517 799 54.5 33.139 39.199 18.3 6,404 4,904
Others (knitted and woven) 18.267 19.750 8.1 448.319 564.886 26.0 2,454 2,86
Babies’ garments 273 1.863 583.2 8.984 11.525 28.3 3,295 619
o.w. knitted or crocheted 228 1.786 684.5 6.695 9.130 36.4 2,941 511
T-shirts 4.690 4.639 - 1.1 49.287 53.744 9.0 1,051 1,159
Jerseys, pullovers, cardigans 3.932 3.542 - 9.9 91.609 110.348 20.5 2,33 3,116
Special garments 2.744 2.269 - 17.3 131.396 189.420 44.2 4,788 8,349
o.w. woven 2.528 2.140 - 15.4 108.177 143.020 32.2 4,279 6,684

8/13/2019 Euratex nr 2
http://slidepdf.com/reader/full/euratex-nr-2 114/214
BULLETIN 2013/2
114
EU27 (External Trade) Textile and Clothing Trade 2011 - 2012 (continued)Country :
JapanIMPORTS EXPORTS Coverage E/I
Unit : 1000 € 2011 2012 Evol. % 2011 2012 Evol. % 2011 2012
Other garments, knitted orcrocheted
701 1.121 59.9 44.886 56.637 26.2 6,399 5,051
Gloves 1.119 1.262 12.7 2.859 3.292 15.1 255 261
Ties, bow ties, and cravats 235 258 9.5 32.110 32.266 0.5 13,651 12,524
Shawls, scarves, mufflers,mantillas, etc
1.682 2.260 34.4 63.798 78.761 23.5 3,793 3,485
Pantyhose, tights, stockings,socks, etc
1.740 1.466 - 15.8 10.054 12.777 27.1 578 872
Brassières, girdles, corsets,etc,
170 249 46.5 2.994 3.609 20.5 1,76 1,448
Other accessories 873 690 - 20.9 11.507 14.600 26.9 1,319 2,116
TOTAL Chapter 61 KnittedGarments
18.172 19.992 10.0 297.995 378.789 27.1 164 1895
TOTAL Chapter 62 Woven
Garments35.510 36.347 2.4 799.837 910.103 13.8 2252 2504
Total Clothing - (CH 61+62) 53.684 56.340 4.9 1.097.832 1.288.892 17.4 2045 2288
Total Textile - (CH 50-60+ 63)
673.483 634.733 - 5.8 542.593 598.951 10.4 81 94
Total 727.167 691.072 - 5.0 1.640.425 1.887.843 15.1 226 273

8/13/2019 Euratex nr 2
http://slidepdf.com/reader/full/euratex-nr-2 115/214
BULLETIN 2013/2
115
EU27 (External Trade) Textile and Clothing Trade 2011 - 2012Country :
LaosIMPORTS EXPORTS Coverage E/I
Unit : 1000 € 2011 2012 Evol. % 2011 2012 Evol. % 2011 2012
Natural fibers 0 0 - 100.0 0 0 0
Silk 0 0 - 100.0 0 0 0
Yarns and Threads 0 0 - 100.0 90 71 - 20.8 26,559
Silk 0 0 - 100.0 0 0 0
Other - Vegetable yarns 0 0 0 0 - 100.0
Man-made filaments yarns 0 0 19 7 - 60.9
o.w. synthetic filament yarn 0 0 19 7 - 60.9
Man made staple yarns 0 0 72 64 - 10.5
o.w. man made staple yarns,p.r.s.
0 0 72 64 - 10.5
Woven fabrics 14 7 - 50.5 4.030 4.078 1.2 28,52 58,256
Silk 1 3 146.0 0 0 0 0
Wool 0 0 17 664 3870.1
o.w. carded wool 0 0 0 42
o.w. combed wool 0 0 17 622 3619.2
Cotton 5 4 - 20.4 1.277 1.020 - 20.2 27,117 27,189
o.w. cotton, unbleached 0 0 0 1
o.w. cotton, dyed 3 1 - 54.7 9 0 - 97.8 290 14
o.w. denim fabric 0 2 0 0 0
Other fabrics 0 0 1 0 - 100.0
o.w. flax 0 0 1 0 - 100.0
Synthetic and artificial fila-ment yarn
6 0 - 100.0 2 0 - 82.6 32
o.w. synthetic filament yarn 6 0 - 100.0 2 0 - 100.0 32
o.w. artificial filament yarn 0 0 0 0
Synthetic and artificials
staple fibres
0 0 1.858 1.496 - 19.5
o.w. containing > 85% ofsynthetic
0 0 0 40
o.w. containing < 85% syn-thetic mixed natural fibres
0 0 1.850 1.448 - 21.8
o.w. other synthetics 0 0 1 3 252.1
o.w. artificial staple fibres 0 0 7 6 - 11.0
Special woven fabrics 2 0 - 93.0 875 898 2.6 40,704 598,733
o.w. narrow woven fabrics 0 0 349 67 - 81.0
o.w. labels, badges 0 0 48 58 20.5
o.w. embroidery 2 0 - 93.0 402 244 - 39.3 18,709 162,673
Knitted fabrics 0 0 238 322 35.5
< 30 cm; w 5% or moreelastome
0 0 0 16
> 30 cm; w 5% or moreelastome
0 0 111 77 - 30.4
Curtain fabrics and raschellace
0 0 123 219 77.7
Other fabrics 0 0 3 10 191.0
Carpets 3 8 186.2 8 162 2039.6 267 1,997
Knotted carpets 0 8 0 162 1,997
Woven carpets 2 0 - 100.0 0 0 0
Other textiles 133 165 23.7 164 416 153.3 123 253
Wadding, felt, nonwovens,rubber thread, twine, cor-dage, etc.
0 0 3 10 211.7 25,25
o.w. nonwovens 0 0 0 2 843.8 3,775
o.w. twine, rope 0 0 0 2
o.w. nets 0 0 0 5Handwoven tapestries &quilted products
0 0 0 42

8/13/2019 Euratex nr 2
http://slidepdf.com/reader/full/euratex-nr-2 116/214
BULLETIN 2013/2
116
EU27 (External Trade) Textile and Clothing Trade 2011 - 2012 (continued)Country :
LaosIMPORTS EXPORTS Coverage E/I
Unit : 1000 € 2011 2012 Evol. % 2011 2012 Evol. % 2011 2012
Impregnated, coated, etc,,textile fabrics
0 0 83 153 84.9
o.w. fabrics impregnated,coated etc,
0 0 24 118 389.0
o.w. textile products, articlesfor technical uses
0 0 0 1 16.3
Other made up textilearticles
133 165 23.6 70 208 198.7 52 126
o.w. sacks and bags 0 0 0 2
o.w. other : floorcloths,dishcloths etc
133 164 22.9 3 0 - 98.0 2 0
Worn clothing and otherworn articles
0 0 67 206 208.6
Home textiles 1 133 12345.8 0 0 0 0
Bedlinen, table, toilet andkitchen linen
0 5 0 0 0
o.w. Bedlinen, woven 0 5 0 0 0
o.w. toilet linen 0 0 0 0
Curtains 0 128 0 0 0
Other furnishing articles 1 0 - 49.5 0 0 0 26
Garments 135.971 145.401 6.9 44 51 15.1 0 0
Occupationals (woven) 28.435 30.345 6.7 2 24 1103.5 0 0
Men’s jackets 3.171 3.815 20.3 2 0 - 100.0 0 0
Men’s trousers 16.336 16.071 - 1.6 0 24 0 0
Men’s overalls 3.504 3.727 6.4 0 0 0 0
Other men’s occupationals 5.006 5.580 11.5 0 0 0 0
Women’s ensembles 1 0 - 100.0 0 0 0
Women’s jackets 49 77 58.4 0 0 0 0Women’s trousers 120 414 245.5 0 0 0 0
Women’s overalls 0 337 0 0 0
Other women’s occupation-nals
249 323 29.6 0 0 0 0
Men’s Clothing (knitted andwoven)
89.198 94.843 6.3 4 30 693.4 0 0
Overcoats 1.213 740 - 39.0 0 0 0 0
o.w. woven 1.085 568 - 47.6 0 0 0 0
Suits 66 63 - 4.2 0 0 0 0
o.w. woven 57 7 - 88.0 0 0 0 0
Ensembles 0 57 0 0 0
o.w. woven 0 57 0 0 0
Jackets and blazers 3.472 4.164 19.9 2 0 - 100.0 0 0
o.w. woven 3.320 3.880 16.9 2 0 - 100.0 0 0
Trousers 52.642 57.593 9.4 0 24 0 0
o.w. woven 43.792 50.027 14.2 0 24 0 0
Shirts 23.707 22.280 - 6.0 2 6 228.4 0 0
o.w. woven 14.375 10.526 - 26.8 1 0 - 100.0 0 0
Underpants, briefs, etc. 1.292 2.947 128.1 0 0 0 0
o.w. knitted 1.292 2.947 128.1 0 0 0 0
Swimwear 237 0 - 100.0 0 0 0
Tracksuits 1.564 1.418 - 9.4 0 0 0 0
Women’s Clothing (knittedand woven)
15.534 17.859 15.0 0 6 0 0
Overcoats 690 696 0.8 0 0 0 0
o.w. woven 291 492 69.1 0 0 0 0
Suits 98 0 - 100.0 0 0 0Ensembles 1 0 - 100.0 0 0 0
o.w. woven 1 0 - 100.0 0 0 0

8/13/2019 Euratex nr 2
http://slidepdf.com/reader/full/euratex-nr-2 117/214
BULLETIN 2013/2
117
EU27 (External Trade) Textile and Clothing Trade 2011 - 2012 (continued)Country :
LaosIMPORTS EXPORTS Coverage E/I
Unit : 1000 € 2011 2012 Evol. % 2011 2012 Evol. % 2011 2012
Jackets 99 362 265.5 0 0 0 0
o.w. woven 51 253 394.4 0 0 0 0
Skirts and dresses 839 1.587 89.3 0 2 0 0
o.w. woven 398 467 17.3 0 2 0 0
Trousers 10.397 11.408 9.7 0 0 0 0
o.w. woven 2.524 3.432 35.9 0 0 0 0
Blouses 1.554 1.330 - 14.4 0 2 0 0
o.w. woven 127 16 - 87.6 0 0 0 0
Slips, petticoats, etc. 1.299 2.091 61.0 0 0 0 0
o.w. knitted 1.299 2.091 61.0 0 0 0 0
Swimwear 0 0 0 0 0
Tracksuits 309 62 - 80.0 0 0 0 0
Others (knitted and woven) 31.239 32.699 4.7 40 15 - 63.6 0 0
Babies’ garments 1.297 1.149 - 11.4 0 0 0 0
o.w. knitted or crocheted 1.244 1.096 - 11.9 0 0 0 0
T-shirts 10.837 9.032 - 16.7 2 0 - 88.3 0 0
Jerseys, pullovers, cardigans 16.081 19.713 22.6 3 0 - 98.1 0 0
Special garments 0 15 6295.8 13 8 - 37.8 5,313 52
o.w. woven 0 15 6295.8 13 8 - 37.8 5,313 52
Other garments, knitted orcrocheted
189 323 70.6 0 1 0 0
Gloves 42 0 - 100.0 1 0 - 100.0 3
Ties, bow ties, and cravats 2 0 - 100.0 0 0 0
Shawls, scarves, mufflers,mantillas, etc
95 113 19.0 0 0 0 0
Pantyhose, tights, stockings,
socks, etc
44 346 691.2 0 0 0 0
Brassières, girdles, corsets,etc,
2.387 1.994 - 16.5 7 2 - 75.9 0 0
Other accessories 3 0 - 100.0 15 3 - 77.3 514
TOTAL Chapter 61 KnittedGarments
60.053 66.119 10.1 6 10 63.3 0 0
TOTAL Chapter 62 WovenGarments
75.918 79.283 4.4 38 41 7.4 0 0
Total Clothing 135.971 145.402 6.9 44 51 15.1 0 0
Total Textile 152 313 106.5 4.530 5.050 11.5 2988 1613
Total 136.122 145.715 7.0 4.574 5.101 11.5 3 4

8/13/2019 Euratex nr 2
http://slidepdf.com/reader/full/euratex-nr-2 118/214
BULLETIN 2013/2
118
EU27 (External Trade) Textile and Clothing Trade 2011 - 2012Country :
MalaysiaIMPORTS EXPORTS Coverage E/I
Unit : 1000 € 2011 2012 Evol. % 2011 2012 Evol. % 2011 2012
Natural fibers 1.780 1.402 - 21.3 1.798 20.159 1021.1 101 1,438
Silk 0 0 1 0 - 100.0
Wool, fine or coarse animalhair
1.389 1.035 - 25.5 112 663 490.3 8 64
o.w. wool, not carded orcombed
0 0 103 663 546.6
o.w. wool and fine or coarseanimal hair
1.389 1.035 - 25.5 10 0 - 100.0 1 0
Cotton 361 365 1.3 1.681 19.492 1059.2 466 5,335
Other vegetable fibres 30 1 - 96.0 3 3 21.6 10 288
Man-made fibres 11.700 9.233 - 21.1 1.147 1.852 61.5 10 20
Synthetic filament tow 0 1 235.3 555 1 - 99.8 163,206 101
Artificial filament tow 11.692 9.220 - 21.1 582 1.851 218.0 5 20
Synthetic staple fibres 0 0 2 0 - 100.0Artificial staple fibres 33.806 28.876 - 14.6 3.851 3.494 - 9.3 11 12
Yarns and Threads 2 2 15.8 5 0 - 100.0 288 0
Silk 1.446 953 - 34.1 17 10 - 41.1 1 1
Wool 0 0 0 9
o.w. combed wool, n.p.r.s. 1.446 953 - 34.1 9 0 - 100.0 1 0
Cotton 181 181 - 0.1 89 153 73.0 49 85
o.w. cotton yarn, n.p.r.s. 181 181 - 0.2 41 124 198.8 23 69
o.w. cotton yarn, p.r.s. 0 0 47 29 - 37.8 48,8
Other - Vegetable yarns 0 0 18 13 - 28.0
Man-made filaments yarns 29.400 25.574 - 13.0 3.576 3.223 - 9.9 12 13
o.w. sewing thread 17 45 162.3 149 179 20.0 864 395
o.w. synthetic filament yarn 28.755 25.329 - 11.9 887 949 6.9 3 4
o.w. artificial filament yarn 0 0 240 162 - 32.3o.w. synthetic monofilament 627 172 - 72.6 2.297 1.931 - 15.9 366 1,126
Man made staple yarns 2.778 2.166 - 22.0 147 95 - 35.6 5 4
o.w. man made staple yarns,n.p.r.s.
2.277 1.599 - 29.8 134 72 - 46.2 6 4
o.w. man made staple yarns,p.r.s.
500 566 13.2 13 23 70.7 3 4
Woven fabrics 25.073 18.615 - 25.8 6.929 10.834 56.4 28 58
Silk 4 54 1243.0 573 951 66.0 14,14 1,748
Wool 0 4 736 724 - 1.7 19,41
o.w. carded wool 0 0 324 220 - 32.2
o.w. combed wool 0 4 411 502 21.9 13,449
Cotton 4.183 4.572 9.3 1.186 2.827 138.4 28 62
o.w. cotton, unbleached 3.135 3.071 - 2.0 123 30 - 75.6 4 1
o.w. cotton, dyed 345 718 108.0 55 643 1066.1 16 90
o.w. denim fabric 0 0 14 0 - 100.0
Other fabrics 0 0 - 22.6 65 125 93.9 20,839 52,196
o.w. flax 0 0 - 4.0 40 98 143.6 16,06 40,758
Synthetic and artificial fila-ment yarn
14.136 9.879 - 30.1 2.080 3.027 45.6 15 31
o.w. synthetic filament yarn 14.003 9.879 - 29.4 1.946 2.782 43.0 14 28
o.w. artificial filament yarn 134 0 - 100.0 134 245 82.9 100
Synthetic and artificialsstaple fibres
5.451 3.091 - 43.3 833 839 0.8 15 27
o.w. containing > 85% ofsynthetic
1.248 1.229 - 1.5 443 360 - 18.7 35 29
o.w. containing < 85% ofsynthetic
1.375 791 - 42.5 62 39 - 37.2 4 5
o.w. containing < 85% syn-thetic mixed natural fibres
2.114 735 - 65.2 34 21 - 39.8 2 3
o.w. other synthetics 711 327 - 54.1 137 91 - 33.6 19 28

8/13/2019 Euratex nr 2
http://slidepdf.com/reader/full/euratex-nr-2 119/214
BULLETIN 2013/2
119
EU27 (External Trade) Textile and Clothing Trade 2011 - 2012 (continued)Country :
MalaysiaIMPORTS EXPORTS Coverage E/I
Unit : 1000 € 2011 2012 Evol. % 2011 2012 Evol. % 2011 2012
o.w. artificial staple fibres 3 10 187.7 158 329 108.9 4,624 3,357
Special woven fabrics 1.298 1.014 - 21.8 1.457 2.340 60.7 112 231
o.w. pile fabrics 2 0 - 97.7 322 429 33.2 18,526
o.w. narrow woven fabrics 921 521 - 43.5 714 976 36.7 78 187
o.w. labels, badges 30 40 31.9 128 56 - 56.5 422 139
o.w. embroidery 42 7 - 83.2 164 125 - 23.6 393 1,791
Knitted fabrics 507 483 - 4.8 441 703 59.4 87 146
Pile fabrics 25 85 245.9 89 47 - 46.8 363 56
< 30 cm; w 5% or moreelastome
457 390 - 14.6 17 9 - 46.4 4 2
> 30 cm; w 5% or moreelastome
15 1 - 91.6 151 371 145.2 1,01 29,466
Curtain fabrics and raschel
lace
7 4 - 38.2 97 119 21.7 1,487 2,926
Other fabrics 4 3 - 39.0 86 156 82.5 2,01 6,009
Carpets 84 93 10.4 3.105 4.624 49.0 3,699 4,991
Knotted carpets 3 1 - 77.4 45 70 54.3 1,62 11,07
Woven carpets 8 5 - 41.6 646 896 38.7 8,126 19,316
Tufted carpets 25 73 194.1 2.087 3.151 50.9 8,461 4,342
Carpets of felt 0 2 156 185 19.1 11,958
Other textiles 113293 81031 - 28.5 33726 38766 14.9 30 48
Wadding, felt, nonwovens,rubber thread, twine, cor-dage, etc.
3993 4488 12.4 14023 17379 23.9 351 387
o.w. felt 0 0 - 85.7 1033 680 - 34.1
o.w. nonwovens 1358 1889 39.1 7023 9623 37.0 517 509
o.w. special yarn 0 0 638 395 - 38.0
o.w. twine, rope 548 446 - 18.6 717 686 - 4.4 131 154
o.w. nets 699 1127 61.2 148 271 82.9 21 24
Handwoven tapestries &quilted products
0 8 0 12 147
Impregnated, coated, etc,,textile fabrics
7169 6006 - 16.2 12253 12107 - 1.2 171 202
o.w. tyre cord fabric 0 0 926 836 - 9.7 321,35
o.w. fabrics impregnated,coated etc,
342 385 12.5 2591 1838 - 29.1 758 478
o.w. textile products, articlesfor technical uses
6795 5535 - 18.5 6539 6748 3.2 96 122
Other made up textilearticles
6309 7748 22.8 2420 2621 8.3 38 34
o.w. sacks and bags 97 203 109.8 76 212 177.9 79 105
o.w. tarpaulins, sunblinds& alike 120 100 - 16.0 266 286 7.5 222 284
o.w. other : floorcloths,dishcloths etc
6040 7371 22.0 1634 1784 9.2 27 24
Worn clothing and otherworn articles
52 73 40.4 426 308 - 27.5 818 422
Home textiles 1.251 1.559 24.5 1.525 1.434 - 6.0 122 92
Bedlinen, table, toilet andkitchen linen
747 734 - 1.7 264 194 - 26.5 35 26
o.w. Bedlinen, woven 396 390 - 1.4 87 90 3.5 22 23
o.w. toilet linen 13 20 50.0 134 64 - 52.1 1,008 322
o.w. table linen, woven 298 315 6.0 22 22 - 2.5 7 7
Curtains 420 688 63.9 1.158 1.071 - 7.5 276 156
Other furnishing articles 16 85 414.5 89 116 30.8 537 137
Garments 142.847 147.317 3.1 35.523 39.846 12.2 25 27Occupationals (woven) 50 179 261.4 122 596 388.0 247 333
Men’s ensembles 0 0 7 5 - 31.8

8/13/2019 Euratex nr 2
http://slidepdf.com/reader/full/euratex-nr-2 120/214
BULLETIN 2013/2
120
EU27 (External Trade) Textile and Clothing Trade 2011 - 2012 (continued)Country :
MalaysiaIMPORTS EXPORTS Coverage E/I
Unit : 1000 € 2011 2012 Evol. % 2011 2012 Evol. % 2011 2012
Men’s jackets 1 0 - 100.0 17 15 - 13.8 2,733
Men’s trousers 27 0 - 98.9 27 28 5.4 99 9,437
Men’s overalls 0 0 - 100.0 6 2 - 56.0 2,76
Other men’s occupationals 4 152 3755.6 39 492 1149.7 999 324
Women’s ensembles 0 1 1 8 1216.4 1,115
Women’s jackets 0 0 10 17 63.2 83,4
Women’s trousers 7 0 - 100.0 3 8 175.2 45
Women’s overalls 0 0 0 15
Other women’s occupation-nals
11 26 139.3 12 5 - 58.9 110 19
Men’s Clothing (knitted andwoven)
35.873 40.708 13.5 8.692 11.538 32.8 24 28
Overcoats 3.087 7.046 128.2 379 486 28.1 12 7
o.w. woven 1.681 1.702 1.2 300 404 34.7 18 24
Suits 13 16 28.2 708 1.191 68.1 5,522 7,241
o.w. woven 5 16 238.7 696 1.082 55.5 15,126 6,944
Ensembles 9 9 - 1.0 34 17 - 49.7 385 196
o.w. woven 1 8 521.4 34 13 - 63.5 2,618 154
Jackets and blazers 42 49 18.4 718 1.214 69.0 1,73 2,469
o.w. woven 13 23 82.3 652 1.014 55.4 5,217 4,448
Trousers 9.445 11.731 24.2 2.746 3.760 36.9 29 32
o.w. woven 3.412 2.684 - 21.3 2.549 3.667 43.9 75 137
Shirts 14.210 16.687 17.4 3.159 3.626 14.8 22 22
o.w. woven 12.268 13.088 6.7 2.283 2.721 19.2 19 21
Underpants, briefs, etc. 1.786 404 - 77.4 135 150 10.8 8 37
o.w. knitted 1.756 352 - 79.9 108 113 4.7 6 32
Swimwear 814 64 - 92.2 74 63 - 14.5 9 100Tracksuits 5.965 4.545 - 23.8 477 110 - 76.9 8 2
Women’s Clothing (knittedand woven)
31.695 30.572 - 3.5 14.070 15.485 10.1 44 51
Overcoats 5.848 7.529 28.7 702 505 - 28.0 12 7
o.w. woven 2.184 3.229 47.9 432 431 - 0.1 20 13
Suits 2 3 49.2 120 214 78.2 6,406 7,653
o.w. woven 2 1 - 19.8 117 208 77.5 6,624 14,654
Ensembles 374 202 - 45.9 872 646 - 25.9 233 319
o.w. woven 6 10 72.8 756 530 - 29.9 12,564 5,1
Jackets 391 687 75.8 617 851 37.9 158 124
o.w. woven 141 361 156.6 584 807 38.3 414 223
Skirts and dresses 1.273 941 - 26.1 2.818 3.069 8.9 221 326
o.w. woven 262 462 76.2 2.007 2.190 9.1 766 474
Trousers 11.388 10.872 - 4.5 2.590 3.283 26.7 23 30
o.w. woven 2.256 1.952 - 13.5 2.187 2.872 31.4 97 147
Blouses 3.543 4.615 30.2 3.363 3.210 - 4.5 95 70
o.w. woven 689 543 - 21.2 2.368 2.541 7.3 344 468
Slips, petticoats, etc. 8.451 5.331 - 36.9 134 136 1.4 2 3
o.w. knitted 8.191 5.268 - 35.7 120 109 - 8.9 1 2
Swimwear 89 74 - 16.5 8 51 567.2 9 69
Tracksuits 292 262 - 10.2 219 265 21.4 75 101
Others (knitted and woven) 75.273 76.030 1.0 12.759 12.704 - 0.4 17 17
Babies’ garments 1.476 2.197 48.9 922 353 - 61.7 62 16
o.w. knitted or crocheted 1.426 2.175 52.5 200 203 1.6 14 9
T-shirts 12.701 14.615 15.1 4.885 4.675 - 4.3 38 32
Jerseys, pullovers, cardigans 10.748 11.349 5.6 1.835 2.236 21.8 17 20
Special garments 157 467 197.1 967 1.549 60.2 616 332
o.w. woven 152 462 204.8 963 1.478 53.5 635 320

8/13/2019 Euratex nr 2
http://slidepdf.com/reader/full/euratex-nr-2 121/214
BULLETIN 2013/2
121
EU27 (External Trade) Textile and Clothing Trade 2011 - 2012 (continued)Country :
MalaysiaIMPORTS EXPORTS Coverage E/I
Unit : 1000 € 2011 2012 Evol. % 2011 2012 Evol. % 2011 2012
Other garments, knitted orcrocheted
236 349 48.0 1.045 1.365 30.6 442 391
Gloves 39.743 35.930 - 9.6 156 754 384.0 0 2
Ties, bow ties, and cravats 102 51 - 49.9 580 444 - 23.4 567 866
Shawls, scarves, mufflers,mantillas, etc
444 110 - 75.3 227 341 50.1 51 311
Pantyhose, tights, stockings,socks, etc
293 72 - 75.6 376 364 - 3.2 128 508
Brassières, girdles, corsets,etc,
3.436 3.605 4.9 77 140 80.3 2 4
Other accessories 1.346 1.143 - 15.1 1.745 522 - 70.1 130 46
TOTAL Chapter 61 KnittedGarments
107.103 112.586 5.1 12.687 13.491 6.3 12 12
TOTAL Chapter 62 Woven
Garments35.743 34.732 - 2.8 22.836 26.355 15.4 64 76
Total Clothing 143.000 147.318 3.0 35.523 39.846 12.2 25 27
Total Textile 187.502 141.455 - 24.6 53.218 82.157 54.4 28 58
Total 330.502 288.773 - 12.6 88.741 122.003 37.5 27 42

8/13/2019 Euratex nr 2
http://slidepdf.com/reader/full/euratex-nr-2 122/214
BULLETIN 2013/2
122
EU27 (External Trade) Textile and Clothing Trade 2011 - 2012Country :
MexicoIMPORTS EXPORTS Coverage E/I
Unit : 1000 € 2011 2012 Evol. % 2011 2012 Evol. % 2011 2012
Natural fibers 4.964 875 - 82.4 1.521 3.377 122.0 31 386
Silk 0 0 60 25 - 57.4
Wool, fine or coarse animalhair
650 662 1.9 1.096 2.984 172.2 169 451
o.w. wool, not carded orcombed
303 373 23.1 121 119 - 1.4 40 32
o.w. wool and fine or coarseanimal hair
0 0 - 100.0 972 2.787 186.8 694,129
Cotton 4.293 212 - 95.1 339 337 - 0.6 8 159
Other vegetable fibres 20 0 - 100.0 26 30 16.8 127
o.w. flax 3 0 - 100.0 21 21 - 0.2 730
Man-made fibres 7.358 14.073 91.3 28.527 29.834 4.6 388 212
Synthetic filament tow 1.165 1.554 33.3 11.898 11.445 - 3.8 1,021 737
Artificial filament tow 5.191 11.647 124.4 2 0 - 100.0 0 0Synthetic staple fibres 405 300 - 25.8 13.801 15.727 14.0 3,412 5,237
Artificial staple fibres 0 0 35 52 47.3
Yarns and Threads 11.754 10.115 - 13.9 57.605 57.217 - 0.7 490 566
Silk 0 0 72 63 - 12.5
Wool 0 4 447 415 - 7.3 9,802
o.w. carded wool, n.p.r.s. 0 0 28 48 74.2
o.w. combed wool, n.p.r.s. 0 4 226 186 - 17.5 5,065
Cotton 40 32 - 21.2 4.155 3.569 - 14.1 10,286 11,21
o.w. cotton yarn, n.p.r.s. 32 4 - 88.6 3.722 2.907 - 21.9 11,615 79,64
o.w. cotton yarn, p.r.s. 8 28 237.6 433 662 53.0 5,186 2,35
Other - Vegetable yarns 0 0 31 63 104.2 90,586
Man-made filaments yarns 11.700 10.076 - 13.9 48.430 48.730 0.6 414 484
o.w. sewing thread 139 22 - 84.1 2.083 2.505 20.3 1,501 11,375o.w. synthetic filament yarn 10.253 8.812 - 14.0 43.568 41.998 - 3.6 425 477
o.w. artificial filament yarn 16 0 - 100.0 615 408 - 33.7 3,87
o.w. synthetic monofilament 1.286 1.229 - 4.4 2.079 3.751 80.4 162 305
Man made staple yarns 13 3 - 75.9 4.470 4.377 - 2.1 33,993 138,063
o.w. man made staple yarns,n.p.r.s.
0 2 3.829 3.848 0.5 177,316
o.w. man made staple yarns,p.r.s.
13 1 - 92.4 641 529 - 17.4 4,871 52,885
Woven fabrics 2.113 3.769 78.4 76.557 70.392 - 8.1 3,623 1,868
Silk 0 5 1593.5 2.114 1.168 - 44.7 682,035 22,253
Wool 234 715 205.5 13.292 12.026 - 9.5 5,681 1,683
o.w. carded wool 176 386 119.0 1.495 821 - 45.1 847 213
o.w. combed wool 58 328 470.7 11.701 11.192 - 4.3 20,331 3,408
Cotton 510 1.034 102.6 23.130 18.374 - 20.6 4,534 1,777
o.w. cotton, unbleached 1 4 198.5 597 424 - 29.0 44,88 10,676
o.w. cotton, dyed 127 22 - 82.6 1.562 1.278 - 18.1 1,229 5,79
o.w. denim fabric 372 920 147.0 7.061 3.971 - 43.8 1,896 432
Other fabrics 23 101 339.3 2.798 2.402 - 14.2 12,185 2,381
o.w. flax 11 71 542.8 2.490 2.294 - 7.9 22,416 3,212
Synthetic and artificial fila-ment yarn
122 215 75.8 19.385 17.885 - 7.7 15,883 8,333
o.w. synthetic filament yarn 121 203 67.7 18.240 16.726 - 8.3 15,043 8,225
o.w. artificial filament yarn 1 11 1307.5 1.145 1.159 1.2 143,096 10,292
Synthetic and artificialsstaple fibres
404 630 56.1 9.046 10.147 12.2 2,24 1,61
o.w. containing > 85% ofsynthetic
342 496 44.9 2.320 3.319 43.1 678 669
o.w. containing < 85% ofsynthetic
1 22 1884.4 1.644 1.139 - 30.7 150,852 5,268
o.w. containing < 85% syn-thetic mixed natural fibres
5 20 283.9 603 563 - 6.6 11,867 2,888

8/13/2019 Euratex nr 2
http://slidepdf.com/reader/full/euratex-nr-2 123/214
BULLETIN 2013/2
123
EU27 (External Trade) Textile and Clothing Trade 2011 - 2012 (continued)Country :
MexicoIMPORTS EXPORTS Coverage E/I
Unit : 1000 € 2011 2012 Evol. % 2011 2012 Evol. % 2011 2012
o.w. other synthetics 48 73 51.9 2.517 2.833 12.5 5,272 3,907
o.w. artificial staple fibres 8 20 169.2 1.961 2.292 16.9 25,843 11,219
Special woven fabrics 820 1.069 30.4 6.792 8.382 23.4 829 784
o.w. pile fabrics 244 445 82.0 2.525 3.186 26.2 1,033 716
o.w. narrow woven fabrics 444 576 29.9 2.567 3.768 46.8 579 654
o.w. labels, badges 14 26 81.7 435 368 - 15.4 3,03 1,411
o.w. embroidery 7 14 100.3 449 289 - 35.7 6,402 2,057
Knitted fabrics 92 121 31.2 19.167 21.148 10.3 20,794 17,49
Pile fabrics 86 113 31.7 949 438 - 53.9 1,101 386
< 30 cm; w 5% or moreelastome
1 1 93.5 209 168 - 19.7 33,766 14,001
> 30 cm; w 5% or moreelastome
1 0 - 35.2 2.694 2.943 9.2 498,906 840,92
Curtain fabrics and raschellace
2 3 91.5 8.383 10.327 23.2 547,904 352,474
Other fabrics 3 3 - 10.6 6.932 7.271 4.9 209,43 245,644
Carpets 3.795 3.414 - 10.0 12.060 14.057 16.6 318 412
Knotted carpets 2 1 - 52.8 282 157 - 44.5 14,611 17,209
Woven carpets 15 10 - 32.2 2.977 2.896 - 2.7 19,624 28,144
Tufted carpets 3.730 3.380 - 9.4 7.397 9.863 33.3 198 292
Carpets of felt 2 0 - 92.1 750 319 - 57.5 49,347 265,633
Other textiles 39.391 42.144 7.0 111.570 120.157 7.7 283 285
Wadding, felt, nonwovens,rubber thread, twine, cor-dage, etc.
837 1.744 108.4 50.182 49.525 - 1.3 5,997 2,84
o.w. felt 29 177 521.7 2.409 2.561 6.3 8,451 1,445
o.w. nonwovens 341 828 143.1 29.617 30.050 1.5 8,691 3,627
o.w. special yarn 90 82 - 9.1 1.497 2.051 37.0 1,661 2,504
o.w. twine, rope 37 195 426.3 1.257 1.912 52.0 3,395 981
o.w. nets 106 180 70.0 3.033 2.897 - 4.5 2,865 1,609
Handwoven tapestries &quilted products
1 2 272.0 313 34 - 89.3 62,688 1,802
Impregnated, coated, etc,,textile fabrics
4.434 5.902 33.1 45.983 56.557 23.0 1,037 958
o.w. tyre cord fabric 0 0 96 300 213.1 136,377
o.w. fabrics impregnated,coated etc,
2.132 2.234 4.8 28.073 34.127 21.6 1,317 1,527
o.w. textile products, articlesfor technical uses
2.161 3.497 61.8 6.979 7.644 9.5 323 219
Other made up textilearticles
6.728 7.002 4.1 3.737 6.494 73.8 56 93
o.w. sacks and bags 226 368 62.4 841 1.004 19.3 372 273o.w. tarpaulins, sunblinds& alike
47 35 - 25.1 548 1.336 143.8 1,165 3,792
o.w. other : floorcloths,dishcloths etc
5.114 5.655 10.6 1.854 3.444 85.7 36 61
Worn clothing and otherworn articles
1.341 939 - 30.0 423 598 41.5 32 64
Home textiles 891 505 - 43.3 15.075 15.495 2.8 1,691 3,066
Bedlinen, table, toilet andkitchen linen
300 119 - 60.2 10.020 10.447 4.3 3,34 8,743
o.w. Bedlinen, woven 18 23 32.4 5.919 5.296 - 10.5 33,519 22,641
o.w. toilet linen 89 75 - 15.7 2.813 3.589 27.6 3,145 4,764
o.w. table linen, woven 190 17 - 91.2 964 1.034 7.2 507 6,188
Curtains 12 23 96.3 1.424 1.280 - 10.1 12,061 5,523
Other furnishing articles 377 315 - 16.4 3.013 3.159 4.8 800 1,003Garments 63.001 57.781 - 8.3 321.517 332.658 3.5 510 576
Occupationals (woven) 125 145 16.8 468 492 5.0 376 338
Men’s ensembles 14 6 - 54.2 7 4 - 48.6 51 58

8/13/2019 Euratex nr 2
http://slidepdf.com/reader/full/euratex-nr-2 124/214
BULLETIN 2013/2
124
EU27 (External Trade) Textile and Clothing Trade 2011 - 2012 (continued)Country :
MexicoIMPORTS EXPORTS Coverage E/I
Unit : 1000 € 2011 2012 Evol. % 2011 2012 Evol. % 2011 2012
Men's jackets 2 7 367.7 131 45 - 65.5 8,31 613
Men's trousers 35 38 7.6 200 2 - 99.2 572 4
Men's overalls 37 11 - 69.6 14 12 - 16.7 38 105
Other men's occupationals 9 63 580.9 49 330 575.6 531 526
Women's ensembles 0 0 - 57.9 0 16 0 9,813
Women's jackets 0 1 500.0 9 0 - 99.9 5,807 1
Women's trousers 1 2 51.4 26 6 - 75.6 2,39 385
Women's overalls 1 0 - 100.0 0 4 3854.5 16
Other women's occupation-nals
25 17 - 31.2 31 72 130.8 126 423
Men’s Clothing (knitted andwoven)
19.033 17.167 - 9.8 80.405 87.452 8.8 422 509
Overcoats 2.291 2.584 12.8 8.635 9.715 12.5 377 376
o.w. woven 2.089 2.282 9.2 7.683 8.390 9.2 368 368
Suits 5.199 1.905 - 63.4 6.194 6.581 6.2 119 345
o.w. woven 5.197 1.902 - 63.4 6.139 6.415 4.5 118 337
Ensembles 139 57 - 59.3 2.465 2.067 - 16.1 1,772 3,654
o.w. woven 131 52 - 60.5 2.313 2.026 - 12.4 1,76 3,908
Jackets and blazers 3.398 2.082 - 38.7 7.868 10.669 35.6 232 513
o.w. woven 3.386 2.062 - 39.1 7.216 9.378 30.0 213 455
Trousers 7.246 9.413 29.9 22.491 24.031 6.9 310 255
o.w. woven 7.046 9.308 32.1 20.831 23.201 11.4 296 249
Shirts 377 544 44.3 28.994 30.684 5.8 7,689 5,64
o.w. woven 280 288 2.9 20.070 19.486 - 2.9 7,168 6,761
Underpants, briefs, etc. 154 362 134.3 1.287 1.715 33.3 833 474
o.w. knitted 102 349 242.4 787 1.083 37.5 772 310
Swimwear 98 44 - 55.4 1.007 952 - 5.4 1,023 2,171Tracksuits 118 86 - 26.9 973 400 - 58.8 824 465
Women’s Clothing (knittedand woven)
12.596 11.011 - 12.6 119.659 121.165 1.3 950 1,1
Overcoats 916 165 - 82.0 11.619 11.043 - 5.0 1,269 6,703
o.w. woven 741 86 - 88.5 9.227 9.718 5.3 1,245 11,365
Suits 71 36 - 50.1 2.263 1.477 - 34.7 3,175 4,153
o.w. woven 71 29 - 59.3 1.520 629 - 58.6 2,141 2,178
Ensembles 36 22 - 37.6 2.705 1.752 - 35.2 7,613 7,9
o.w. woven 26 16 - 39.7 1.802 1.494 - 17.1 6,943 9,548
Jackets 216 120 - 44.5 8.006 8.143 1.7 3,699 6,782
o.w. woven 137 63 - 54.1 6.597 7.244 9.8 4,811 11,502
Skirts and dresses 3.284 3.991 21.5 28.423 30.231 6.4 865 757
o.w. woven 2.791 3.246 16.3 19.776 20.511 3.7 708 632
Trousers 6.447 4.524 - 29.8 34.259 31.494 - 8.1 531 696
o.w. woven 5.591 3.229 - 42.2 28.924 25.221 - 12.8 517 781
Blouses 559 672 20.2 22.023 26.593 20.8 3,939 3,957
o.w. woven 299 257 - 14.2 15.087 16.584 9.9 5,048 6,464
Slips, petticoats, etc. 292 597 104.7 3.085 2.754 - 10.7 1,058 461
o.w. knitted 265 534 101.1 2.535 2.266 - 10.6 955 425
Swimwear 615 643 4.4 2.158 1.737 - 19.5 351 270
Tracksuits 83 165 99.2 2.720 3.318 22.0 3,275 2,006
Others (knitted and woven) 31.372 29.602 - 5.6 121.430 124.027 2.1 387 419
Babies’ garments 237 222 - 6.5 9.715 8.532 - 12.2 4,093 3,846
o.w. knitted or crocheted 220 212 - 3.3 5.858 5.599 - 4.4 2,666 2,636
T-shirts 15.316 16.976 10.8 32.894 32.881 - 0.0 215 194
Jerseys, pullovers, cardigans 3.038 2.809 - 7.5 36.079 39.899 10.6 1,188 1,42
Special garments 238 342 43.7 12.043 12.727 5.7 5,058 3,72
o.w. woven 202 328 62.1 11.359 12.102 6.5 5,61 3,688
Other garments, knitted orcrocheted
629 453 - 28.1 3.944 5.302 34.4 627 1,172

8/13/2019 Euratex nr 2
http://slidepdf.com/reader/full/euratex-nr-2 125/214
BULLETIN 2013/2
125
EU27 (External Trade) Textile and Clothing Trade 2011 - 2012 (continued)Country :
MexicoIMPORTS EXPORTS Coverage E/I
Unit : 1000 € 2011 2012 Evol. % 2011 2012 Evol. % 2011 2012
Gloves 9.214 6.813 - 26.1 426 315 - 26.1 5 5
Ties, bow ties, and cravats 1.474 966 - 34.4 4.350 5.057 16.2 295 523
Shawls, scarves, mufflers,mantillas, etc
122 94 - 22.9 8.534 6.272 - 26.5 7,007 6,676
Pantyhose, tights, stockings,socks, etc
137 195 42.6 7.162 6.225 - 13.1 5,236 3,191
Brassières, girdles, corsets,etc,
826 523 - 36.6 4.280 4.191 - 2.1 518 801
Other accessories 1.565 1.150 - 26.5 1.896 3.022 59.4 121 263
TOTAL Chapter 61 KnittedGarments
33.354 33.279 - 0.2 133.946 142.421 6.3 402 428
TOTAL Chapter 62 WovenGarments
29.647 24.500 - 17.4 187.617 190.417 1.5 633 777
Total Clothing - (CH 61+62) 63.001 57.779 - 8.3 321.563 332.838 3.5 510 576
Total Textile - (CH 50-60+ 63)
70.359 75.040 6.7 322.763 332.034 2.9 459 442
Total 133.360 132.819 - 0.4 644.326 664.872 3.2 483 501

8/13/2019 Euratex nr 2
http://slidepdf.com/reader/full/euratex-nr-2 126/214
BULLETIN 2013/2
126
EU27 (External Trade) Textile and Clothing Trade 2011 - 2012Country :
MontenegroIMPORTS EXPORTS Coverage E/I
Unit : 1000 € 2011 2012 Evol. % 2011 2012 Evol. % 2011 2012
Natural fibers 21 23 6.6 1 1 100.0 3 6
Wool, fine or coarse animalhair
21 23 6.6 0 0 0 0
o.w. wool, not carded orcombed
21 23 6.6 0 0 0 0
Other vegetable fibres 0 0 1 1 100.0
o.w. flax 0 0 1 1 58.8
Man-made fibres 0 0 0 2
Synthetic staple fibres 0 0 0 2
Yarns and Threads 0 0 53 60 12.8
Cotton 0 0 0 1
o.w. cotton yarn, n.p.r.s. 0 0 0 0
o.w. cotton yarn, p.r.s. 0 0 0 1
Other - Vegetable yarns 0 0 0 1 158.3
Man-made filaments yarns 0 0 52 46 - 11.7
o.w. sewing thread 0 0 1 0 - 38.7
o.w. synthetic filament yarn 0 0 41 16 - 60.5
o.w. synthetic monofilament 0 0 10 29 186.4
Man made staple yarns 0 0 1 12 1110.0
o.w. man made staple yarns,n.p.r.s.
0 0 0 11
o.w. man made staple yarns,p.r.s.
0 0 1 1 - 27.0
Woven fabrics 2 16 673.9 822 907 10.3 39,722 5,659
Silk 0 0 13 12 - 7.9
Wool 0 0 15 1 - 92.7
o.w. carded wool 0 0 15 0 - 100.0
o.w. combed wool 0 0 0 1 535.3
Cotton 0 2 343 480 39.9 21,713
o.w. cotton, unbleached 0 0 46 10 - 77.5
o.w. cotton, dyed 0 0 52 8 - 84.3
Other fabrics 0 0 23 14 - 40.5
o.w. flax 0 0 20 14 - 30.7
Synthetic and artificial fila-ment yarn
2 1 - 45.4 102 137 34.9 4,912 12,142
o.w. synthetic filament yarn 2 1 - 45.4 101 136 34.7 4,863 12,004
o.w. artificial filament yarn 0 0 1 2 55.4
Synthetic and artificialsstaple fibres
0 0 248 185 - 25.6
o.w. containing > 85% ofsynthetic
0 0 153 80 - 47.6
o.w. containing < 85% ofsynthetic
0 0 15 16 5.2
o.w. containing < 85% syn-thetic mixed natural fibres
0 0 3 34 860.2
o.w. other synthetics 0 0 73 36 - 50.6
o.w. artificial staple fibres 0 0 3 19 454.9
Special woven fabrics 0 13 78 78 - 0.7 612
o.w. pile fabrics 0 13 21 50 139.5 397
o.w. narrow woven fabrics 0 0 26 11 - 58.4
o.w. labels, badges 0 0 5 1 - 82.0
o.w. embroidery 0 0 9 10 14.1
Knitted fabrics 0 0 35 41 17.5
Pile fabrics 0 0 6 2 - 68.6
< 30 cm; w 5% or moreelastome
0 0 1 3 168.2
> 30 cm; w 5% or moreelastome
0 0 0 4 40300.0

8/13/2019 Euratex nr 2
http://slidepdf.com/reader/full/euratex-nr-2 127/214
BULLETIN 2013/2
127
EU27 (External Trade) Textile and Clothing Trade 2011 - 2012 (continued)Country :
MontenegroIMPORTS EXPORTS Coverage E/I
Unit : 1000 € 2011 2012 Evol. % 2011 2012 Evol. % 2011 2012
Curtain fabrics and raschellace
0 0 27 30 12.2
Other fabrics 0 0 1 1 117.6
Carpets 0 0 - 100.0 662 417 - 37.0 1,324,880
Knotted carpets 0 0 54 16 - 70.0
Woven carpets 0 0 - 100.0 231 102 - 55.7 462,98
Tufted carpets 0 0 323 253 - 21.7
Carpets of felt 0 0 41 30 - 28.1
Other textiles 6 75 1145.5 2.306 2.544 10.3 38,182 3,382
Wadding, felt, nonwovens,rubber thread, twine, cor-dage, etc.
1 0 - 33.9 774 784 1.3 138,245 211,992
o.w. felt 0 0 15 8 - 47.5
o.w. nonwovens 0 0 230 337 46.7o.w. special yarn 0 0 0 0
o.w. twine, rope 0 0 39 87 120.2 23,422
o.w. nets 1 0 - 100.0 104 67 - 35.5 18,564
Handwoven tapestries &quilted products
0 0 0 0 - 100.0
Impregnated, coated, etc,,textile fabrics
0 1 135 307 127.9 34,111
o.w. fabrics impregnated,coated etc,
0 0 33 32 - 3.5
o.w. textile products, articlesfor technical uses
0 1 66 227 244.2 25,171
Other made up textilearticles
5 8 47.3 1.058 1.201 13.5 19,311 14,881
o.w. sacks and bags 5 0 - 100.0 42 13 - 69.7 761
o.w. tarpaulins, sunblinds& alike
0 6 604 363 - 39.9 5,73
o.w. other : floorcloths,dishcloths etc
0 1 282 348 23.3 45,142
Worn clothing and otherworn articles
0 1 130 478 267.2 49,231
Home textiles 1 1 4.2 848 713 - 15.9 70,681 57,069
Bedlinen, table, toilet andkitchen linen
1 0 - 100.0 466 447 - 4.1 38,858
o.w. Bedlinen, woven 1 0 - 100.0 238 188 - 21.2 37,784
o.w. toilet linen 0 0 - 100.0 182 230 26.6 56,828
o.w. table linen, woven 0 0 - 100.0 34 18 - 47.9 13,572
Curtains 0 0 161 105 - 34.9
Other furnishing articles 0 0 140 39 - 72.4
Garments 697 568 - 18.5 24.805 24.632 - 0.7 3,557 4,336
Occupationals (woven) 0 0 138 119 - 13.7
Men’s ensembles 0 0 9 4 - 58.1
Men’s jackets 0 0 6 15 155.5
Men’s trousers 0 0 7 37 412.6
Men’s overalls 0 0 28 3 - 89.0
Other men’s occupationals 0 0 65 22 - 66.6
Women’s ensembles 0 0 0 0
Women’s jackets 0 0 0 0
Women’s trousers 0 0 3 1 - 45.9
Women’s overalls 0 0 0 5
Other women’s occupation-nals
0 0 20 32 56.2
Men’s Clothing (knitted andwoven)
461 333 - 27.7 4.250 5.019 18.1 923 1,508
Overcoats 1 3 382.1 682 885 29.8 121,768 32,788
o.w. woven 1 3 382.1 600 672 11.9 107,193 24,88

8/13/2019 Euratex nr 2
http://slidepdf.com/reader/full/euratex-nr-2 128/214
BULLETIN 2013/2
128
EU27 (External Trade) Textile and Clothing Trade 2011 - 2012 (continued)Country :
MontenegroIMPORTS EXPORTS Coverage E/I
Unit : 1000 € 2011 2012 Evol. % 2011 2012 Evol. % 2011 2012
Suits 0 0 254 214 - 15.9 61,071
o.w. woven 0 0 253 205 - 19.1 58,463
Ensembles 0 0 42 104 148.8
o.w. woven 0 0 32 29 - 10.2
Jackets and blazers 4 0 - 94.6 190 408 114.8 4,443 177,196
o.w. woven 0 0 171 366 114.6 166,359
Trousers 3 3 7.8 1.576 1.733 9.9 48,957 49,938
o.w. woven 3 3 7.8 1.291 1.419 9.9 40,093 40,885
Shirts 451 324 - 28.2 1.023 1.130 10.4 227 349
o.w. woven 408 324 - 20.6 687 796 15.8 169 246
Underpants, briefs, etc. 0 0 135 106 - 21.4
o.w. knitted 0 0 54 86 58.3
Swimwear 1 2 113.5 128 250 95.0 12,336 11,27
Tracksuits 1 0 - 100.0 114 107 - 6.2 17,23Women’s Clothing (knittedand woven)
213 200 - 6.2 10.212 9.887 - 3.2 4,795 4,952
Overcoats 195 9 - 95.2 1.273 1.083 - 14.9 654 11,607
o.w. woven 195 2 - 99.2 1.017 958 - 5.8 523 59,906
Suits 0 0 137 133 - 2.7
o.w. woven 0 0 126 50 - 60.6
Ensembles 0 0 185 256 38.3
o.w. woven 0 0 149 184 24.2
Jackets 0 6 576 948 64.5 17,074
o.w. woven 0 6 506 841 66.2 15,15
Skirts and dresses 0 2 613.0 1.990 2.315 16.3 865,2 141,151
o.w. woven 0 1 473.9 1.439 1.397 - 2.9 625,448 105,799
Trousers 12 1 - 94.4 1.647 1.552 - 5.8 13,449 228,203
o.w. woven 10 1 - 93.7 1.278 1.231 - 3.7 12,836 195,349
Blouses 4 182 4306.1 882 752 - 14.8 21,411 414
o.w. woven 4 181 4296.6 579 502 - 13.4 14,054 277
Slips, petticoats, etc. 0 0 1.672 1.008 - 39.7
o.w. knitted 0 0 1.201 839 - 30.1
Swimwear 2 1 - 49.4 435 385 - 11.6 25,598 44,735
Tracksuits 0 0 124 142 15.0 203,171
Others (knitted and woven) 24 36 49.4 10.342 9.717 - 6.0 43,419 27,303
Babies’ garments 0 0 - 100.0 903 663 - 26.6 903,03
o.w. knitted or crocheted 0 0 744 539 - 27.6
T-shirts 3 19 457.4 2.072 2.100 1.4 60,062 10,922
Jerseys, pullovers, cardigans 0 13 4031.3 1.786 2.541 42.2 558,241 19,22
Special garments 0 0 - 100.0 1.854 1.278 - 31.1
o.w. woven 0 0 - 100.0 1.837 1.270 - 30.9
Other garments, knitted orcrocheted 7 1 - 92.4 2.133 1.563 - 26.7 32,37 312,568
Gloves 2 0 - 100.0 53 80 50.8 3,491
Ties, bow ties, and cravats 0 0 41 22 - 45.1 74,8
Shawls, scarves, mufflers,mantillas, etc
0 3 186 151 - 18.8 5,79
Pantyhose, tights, stockings,socks, etc
12 0 - 100.0 847 602 - 29.0 7,204
Brassières, girdles, corsets,etc,
0 0 173 290 68.0
Other accessories 0 0 197 220 11.6
TOTAL Chapter 61 KnittedGarments
72 42 - 42.1 11.754 11.831 0.7 16355 28454
TOTAL Chapter 62 WovenGarments
626 526 - 15.8 13.050 12.786 - 2.0 2086 2429
Total Clothing 697 568 - 18.5 24.804 24.617 - 0.8 3557 4334Total Textile 31 115 276.1 4.730 4.872 3.0 15446 4231
Total 728 683 - 6.2 29.534 29.489 - 0.2 4057 4316

8/13/2019 Euratex nr 2
http://slidepdf.com/reader/full/euratex-nr-2 129/214
BULLETIN 2013/2
129
EU27 (External Trade) Textile and Clothing Trade 2011 - 2012Country :
MoroccoIMPORTS EXPORTS Coverage E/I
Unit : 1000 € 2011 2012 Evol. % 2011 2012 Evol. % 2011 2012
Natural fibers 1.448 1.940 34.0 16.493 13.257 - 19.6 1,139 683
Silk 0 0 25 42 65.5
o.w. raw silk 0 0 21 36 67.2
Wool, fine or coarse animalhair
1.264 1.661 31.4 2.625 1.248 - 52.5 208 75
o.w. wool, not carded orcombed
1.216 1.661 36.6 469 478 1.8 39 29
o.w. wool and fine or coarseanimal hair
0 0 - 100.0 2.084 516 - 75.3 771,97
Cotton 184 266 44.9 13.442 11.663 - 13.2 7,308 4,377
Other vegetable fibres 0 12 60400.0 401 304 - 24.1 2,003,650 2,512
o.w. flax 0 0 152 150 - 1.1
Man-made fibres 3.945 2.548 - 35.4 26.974 28.176 4.5 684 1,106
Synthetic filament tow 29 0 - 100.0 17.059 14.178 - 16.9 58,987Artificial filament tow 0 3 12 5.415 43960.5 210,702
Synthetic staple fibres 1.173 993 - 15.4 5.046 4.131 - 18.1 430 416
Artificial staple fibres 0 0 131 44 - 66.3
Yarns and Threads 12.910 9.949 - 22.9 49.700 44.666 - 10.1 385 449
Silk 0 0 192 40 - 79.0
Wool 89 95 6.7 3.886 3.659 - 5.9 4,349 3,837
o.w. carded wool, n.p.r.s. 40 10 - 74.1 1.060 938 - 11.5 2,647 9,05
o.w. combed wool, n.p.r.s. 48 85 76.6 2.526 2.603 3.1 5,254 3,067
Cotton 2.340 1.205 - 48.5 20.163 14.017 - 30.5 862 1,163
o.w. cotton yarn, n.p.r.s. 2.275 1.141 - 49.8 18.412 11.282 - 38.7 809 989
o.w. cotton yarn, p.r.s. 65 64 - 2.0 1.751 2.736 56.2 2,69 4,288
Other - Vegetable yarns 190 212 11.9 473 432 - 8.7 249 203
Man-made filaments yarns 6.548 4.960 - 24.3 14.049 15.315 9.0 215 309o.w. sewing thread 219 71 - 67.5 4.029 4.388 8.9 1,84 6,168
o.w. synthetic filament yarn 6.264 4.888 - 22.0 7.743 8.963 15.8 124 183
o.w. artificial filament yarn 21 0 - 100.0 1.529 1.079 - 29.4 7,412
o.w. synthetic monofilament 1 0 - 100.0 741 870 17.4 93,816
Man made staple yarns 3.742 3.477 - 7.1 10.937 11.204 2.4 292 322
o.w. man made staple yarns,n.p.r.s.
3.671 3.424 - 6.7 8.616 9.093 5.5 235 266
o.w. man made staple yarns,p.r.s.
71 52 - 26.1 2.321 2.111 - 9.1 3,272 4,026
Woven fabrics 52.565 46.825 - 10.9 738.880 726.097 - 1.7 1,406 1,551
Silk 298 152 - 49.1 25.059 28.944 15.5 8,402 19,072
Wool 5.242 3.605 - 31.2 45.772 44.174 - 3.5 873 1,225
o.w. carded wool 359 455 26.6 18.534 24.080 29.9 5,16 5,297
o.w. combed wool 4.882 3.150 - 35.5 26.895 20.001 - 25.6 551 635
Cotton 31.357 24.183 - 22.9 290.893 269.088 - 7.5 928 1,113
o.w. cotton, unbleached 355 390 10.1 18.776 17.982 - 4.2 5,296 4,608
o.w. cotton, dyed 890 818 - 8.1 81.993 68.498 - 16.5 9,209 8,371
o.w. denim fabric 25.954 19.286 - 25.7 42.238 37.390 - 11.5 163 194
Other fabrics 102 83 - 19.4 15.588 13.986 - 10.3 15,226 16,942
o.w. flax 96 69 - 28.4 13.549 12.779 - 5.7 14,058 18,522
Synthetic and artificial fila-ment yarn
3.007 3.168 5.4 128.118 136.288 6.4 4,261 4,302
o.w. synthetic filament yarn 2.332 2.370 1.6 84.717 110.245 30.1 3,633 4,652
o.w. artificial filament yarn 675 798 18.3 43.401 26.043 - 40.0 6,431 3,263
Synthetic and artificialsstaple fibres
8.351 9.094 8.9 140.935 158.214 12.3 1,688 1,74
o.w. containing > 85% of
synthetic 837 1.974 135.9 18.728 25.351 35.4 2,239 1,284
o.w. containing < 85% ofsynthetic
133 95 - 28.9 9.437 6.537 - 30.7 7,077 6,89

8/13/2019 Euratex nr 2
http://slidepdf.com/reader/full/euratex-nr-2 130/214
BULLETIN 2013/2
130
EU27 (External Trade) Textile and Clothing Trade 2011 - 2012 (continued)Country :
MoroccoIMPORTS EXPORTS Coverage E/I
Unit : 1000 € 2011 2012 Evol. % 2011 2012 Evol. % 2011 2012
o.w. containing < 85% syn-thetic mixed natural fibres
169 125 - 26.1 24.470 19.719 - 19.4 14,446 15,761
o.w. other synthetics 6.405 6.134 - 4.2 46.017 52.903 15.0 719 862
o.w. artificial staple fibres 807 767 - 5.0 42.282 53.704 27.0 5,238 7,006
Special woven fabrics 4.208 6.541 55.4 92.489 75.353 - 18.5 2,198 1,152
o.w. pile fabrics 742 702 - 5.4 20.279 11.486 - 43.4 2,734 1,636
o.w. narrow woven fabrics 363 603 66.1 13.699 15.679 14.5 3,77 2,599
o.w. labels, badges 126 154 22.6 31.929 24.352 - 23.7 25,419 15,819
o.w. embroidery 1.017 1.253 23.2 8.535 7.052 - 17.4 839 563
Knitted fabrics 4.875 6.687 37.2 236.865 232.369 - 1.9 4,859 3,475
Pile fabrics 20 91 357.4 5.490 5.617 2.3 27,725 6,202
< 30 cm; w 5% or moreelastome
119 76 - 36.2 5.989 5.901 - 1.5 5,022 7,757
> 30 cm; w 5% or moreelastome
665 654 - 1.5 43.336 49.699 14.7 6,521 7,595
Curtain fabrics and raschellace
332 432 30.2 33.855 28.457 - 15.9 10,209 6,593
Other fabrics 3.740 5.434 45.3 148.196 142.695 - 3.7 3,963 2,626
Carpets 8.420 6.753 - 19.8 13.469 15.397 14.3 160 228
Knotted carpets 4.333 3.322 - 23.3 710 291 - 59.0 16 9
Woven carpets 3.451 3.027 - 12.3 1.629 3.015 85.0 47 100
Tufted carpets 423 164 - 61.1 6.352 8.019 26.2 1,503 4,876
Carpets of felt 4 14 227.2 873 747 - 14.4 19,933 5,213
Other textiles 50.227 24.178 - 51.9 159.804 164.230 2.8 318 679
Wadding, felt, nonwovens,rubber thread, twine, cor-dage, etc.
2.087 2.289 9.7 59.845 69.960 16.9 2,868 3,056
o.w. felt 25 1 - 95.5 1.901 3.962 108.4 7,65 353,764o.w. nonwovens 270 176 - 34.7 39.579 45.694 15.4 14,664 25,933
o.w. special yarn 102 16 - 84.6 2.669 2.553 - 4.4 2,61 16,198
o.w. twine, rope 19 28 49.4 4.224 4.548 7.7 22,185 15,985
o.w. nets 1.602 1.968 22.8 7.854 9.038 15.1 490 459
Handwoven tapestries &quilted products
340 71 - 79.0 3.986 2.240 - 43.8 1,174 3,135
Impregnated, coated, etc,,textile fabrics
2.717 4.590 68.9 63.528 58.866 - 7.3 2,338 1,282
o.w. tyre cord fabric 0 0 30 76 151.0
o.w. fabrics impregnated,coated etc,
2.161 3.381 56.5 40.354 39.625 - 1.8 1,867 1,172
o.w. textile products, articlesfor technical uses
502 1.166 132.5 11.330 6.272 - 44.6 2,259 538
Other made up textilearticles 44.942 17.051 - 62.1 22.322 22.985 3.0 50 135
o.w. sacks and bags 703 1.627 131.5 895 470 - 47.5 127 29
o.w. tarpaulins, sunblinds& alike
612 528 - 13.7 2.368 2.122 - 10.4 387 402
o.w. other : floorcloths,dishcloths etc
40.854 11.907 - 70.9 8.540 4.130 - 51.6 21 35
Worn clothing and otherworn articles
2.771 2.982 7.6 10.392 15.479 49.0 375 519
Home textiles 51.636 78.082 51.2 8.656 11.559 33.5 17 15
Bedlinen, table, toilet andkitchen linen
8.187 7.790 - 4.8 3.313 4.053 22.3 40 52
o.w. Bedlinen, woven 638 463 - 27.5 1.526 2.259 48.0 239 488
o.w. toilet linen 7.196 7.010 - 2.6 1.159 1.251 7.9 16 18
o.w. table linen, woven 153 213 39.0 467 470 0.6 305 221
Curtains 678 426 - 37.2 649 642 - 1.0 96 151
Other furnishing articles 42.721 69.819 63.4 3.871 5.981 54.5 9 9
Garments 2.196.422 2.039.114 - 7.2 180.883 184.792 2.2 8 9

8/13/2019 Euratex nr 2
http://slidepdf.com/reader/full/euratex-nr-2 131/214
BULLETIN 2013/2
131
EU27 (External Trade) Textile and Clothing Trade 2011 - 2012 (continued)Country :
MoroccoIMPORTS EXPORTS Coverage E/I
Unit : 1000 € 2011 2012 Evol. % 2011 2012 Evol. % 2011 2012
Occupationals (woven) 104.350 90.836 - 13.0 2.770 2.317 - 16.3 3 3
Men's ensembles 55 131 139.1 233 98 - 57.8 425 75
Men's jackets 9.548 11.218 17.5 278 61 - 77.9 3 1
Men's trousers 26.100 20.626 - 21.0 971 424 - 56.3 4 2
Men's overalls 875 305 - 65.2 52 21 - 59.6 6 7
Other men's occupationals 50.483 39.771 - 21.2 1.091 1.470 34.8 2 4
Women's ensembles 119 39 - 67.6 10 44 362.0 8 115
Women's jackets 1.206 1.126 - 6.6 29 8 - 74.3 2 1
Women's trousers 7.313 9.152 25.1 29 79 172.6 0 1
Women's overalls 8 52 584.6 0 2 0 4
Other women's occupation-nals
8.643 8.416 - 2.6 79 110 39.5 1 1
Men’s Clothing (knitted and
woven)504.976 479.418 - 5.1 26.447 26.982 2.0 5 6
Overcoats 17.078 19.000 11.3 919 1.257 36.8 5 7
o.w. woven 16.279 17.576 8.0 756 1.138 50.5 5 6
Suits 13.455 11.065 - 17.8 1.746 1.546 - 11.4 13 14
o.w. woven 13.429 10.847 - 19.2 1.734 1.530 - 11.8 13 14
Ensembles 875 1.484 69.7 987 716 - 27.5 113 48
o.w. woven 408 617 51.2 814 537 - 34.0 199 87
Jackets and blazers 47.856 47.805 - 0.1 2.386 1.753 - 26.5 5 4
o.w. woven 47.366 46.551 - 1.7 2.198 1.637 - 25.5 5 4
Trousers 242.812 233.750 - 3.7 6.157 5.638 - 8.4 3 2
o.w. woven 237.277 229.632 - 3.2 5.796 5.207 - 10.2 2 2
Shirts 88.656 89.407 0.8 5.374 6.052 12.6 6 7
o.w. woven 63.724 69.914 9.7 2.503 2.360 - 5.7 4 3
Underpants, briefs, etc. 33.739 27.352 - 18.9 5.333 5.214 - 2.2 16 19o.w. knitted 30.549 24.814 - 18.8 4.942 4.816 - 2.5 16 19
Swimwear 7.739 6.308 - 18.5 258 254 - 1.2 3 4
Tracksuits 2.187 3.357 53.5 335 770 129.6 15 23
Women’s Clothing (knittedand woven)
1.207.242 1.106.047 - 8.4 43.653 44.405 1.7 4 4
Overcoats 91.318 88.451 - 3.1 2.805 2.339 - 16.6 3 3
o.w. woven 85.893 86.136 0.3 2.539 2.037 - 19.8 3 2
Suits 1.269 1.529 20.5 267 221 - 17.4 21 14
o.w. woven 1.191 874 - 26.6 154 95 - 38.5 13 11
Ensembles 2.971 2.734 - 8.0 740 1.132 53.0 25 41
o.w. woven 1.786 1.911 6.9 649 789 21.5 36 41
Jackets 113.477 118.313 4.3 2.435 2.238 - 8.1 2 2
o.w. woven 99.066 104.233 5.2 2.012 1.565 - 22.2 2 2
Skirts and dresses 352.772 267.029 - 24.3 7.438 7.395 - 0.6 2 3
o.w. woven 278.270 198.960 - 28.5 4.617 4.783 3.6 2 2
Trousers 335.193 333.423 - 0.5 9.599 10.538 9.8 3 3
o.w. woven 307.297 305.398 - 0.6 8.317 8.977 7.9 3 3
Blouses 213.094 208.411 - 2.2 4.531 4.093 - 9.7 2 2
o.w. woven 167.394 159.737 - 4.6 3.132 2.501 - 20.2 2 2
Slips, petticoats, etc. 52.912 49.482 - 6.5 4.632 2.401 - 48.2 9 5
o.w. knitted 48.343 42.336 - 12.4 3.234 2.177 - 32.7 7 5
Swimwear 8.909 7.029 - 21.1 1.109 667 - 39.9 12 9
Tracksuits 25.386 20.315 - 20.0 6.040 7.995 32.4 24 39
Others (knitted and woven) 484.197 453.648 - 6.3 110.780 113.317 2.3 23 25
Babies’ garments 32.453 27.913 - 14.0 4.795 3.871 - 19.3 15 14
o.w. knitted or crocheted 17.299 16.055 - 7.2 2.021 2.248 11.2 12 14
T-shirts 215.595 211.939 - 1.7 8.301 10.026 20.8 4 5
Jerseys, pullovers, cardigans 121.350 102.127 - 15.8 10.819 7.824 - 27.7 9 8
Special garments 8.989 12.540 39.5 5.739 3.895 - 32.1 64 31
o.w. woven 8.158 12.168 49.2 5.581 3.732 - 33.1 68 31

8/13/2019 Euratex nr 2
http://slidepdf.com/reader/full/euratex-nr-2 132/214
BULLETIN 2013/2
132
EU27 (External Trade) Textile and Clothing Trade 2011 - 2012 (continued)Country :
MoroccoIMPORTS EXPORTS Coverage E/I
Unit : 1000 € 2011 2012 Evol. % 2011 2012 Evol. % 2011 2012
Other garments, knitted orcrocheted
12.321 9.078 - 26.3 3.118 4.158 33.3 25 46
Gloves 2.022 1.365 - 32.5 889 1.134 27.6 44 83
Ties, bow ties, and cravats 1.658 1.715 3.4 1.496 2.169 45.0 90 126
Shawls, scarves, mufflers,mantillas, etc
3.517 4.485 27.5 1.061 1.360 28.2 30 30
Pantyhose, tights, stockings,socks, etc
15.312 14.076 - 8.1 2.229 1.935 - 13.2 15 14
Brassières, girdles, corsets,etc,
68.492 65.748 - 4.0 7.447 7.218 - 3.1 11 11
Other accessories 2.064 1.975 - 4.3 65.841 71.204 8.1 3,19 3,604
TOTAL Chapter 61 KnittedGarments
676.868 621.050 - 8.2 51.021 52.982 3.8 8 9
TOTAL Chapter 62 Woven
Garments1.519.554 1.418.083 - 6.7 129.863 131.787 1.5 9 9
Total Clothing - (CH 61+62) 2.196.422 2.039.133 - 7.2 180.884 184.769 2.1 8 9
Total Textile - (CH 50-60+ 63)
186.026 176.962 - 4.9 1.252.595 1.241.081 - 0.9 673 701
Total 2.382.448 2.216.095 - 7.0 1.433.479 1.425.850 - 0.5 60 64

8/13/2019 Euratex nr 2
http://slidepdf.com/reader/full/euratex-nr-2 133/214
BULLETIN 2013/2
133
EU27 (External Trade) Textile and Clothing Trade 2011 - 2012Country :
NorwayIMPORTS EXPORTS Coverage E/I
Unit : 1000 € 2011 2012 Evol. % 2011 2012 Evol. % 2011 2012
Natural fibers 477 978 105.3 1.270 1.760 38.5 267 180
Silk 0 3 1215.8 21 12 - 41.6 11,079 492
o.w. raw silk 0 0 157.9 6 0 - 95.3 3,337 61
Wool, fine or coarse animalhair
395 879 122.5 708 786 10.9 179 89
o.w. wool, not carded orcombed
255 743 191.7 60 61 2.1 23 8
o.w. wool and fine or coarseanimal hair
81 78 - 3.6 632 711 12.5 781 912
Cotton 38 39 3.4 205 331 61.8 536 840
Other vegetable fibres 43 57 32.5 336 630 87.5 777 1,099
o.w. flax 1 0 - 100.0 148 116 - 21.9 14,684
Man-made fibres 158 217 37.6 3.651 6.435 76.3 2,317 2,968
Synthetic filament tow 0 11 189 79 - 58.3 693Artificial filament tow 0 0 2 17 976.1
Synthetic staple fibres 75 138 83.7 2.154 1.971 - 8.5 2,865 1,426
Artificial staple fibres 77 48 - 37.4 1 1 - 21.6 1 2
Yarns and Threads 9.013 10.223 13.4 45.623 50.218 10.1 506 491
Silk 1 1 - 47.5 289 115 - 60.3 29,192 22,065
Wool 7.430 8.195 10.3 18.300 17.632 - 3.6 246 215
o.w. carded wool, n.p.r.s. 748 837 11.8 2.475 4.186 69.1 331 500
o.w. combed wool, n.p.r.s. 407 442 8.5 11.719 6.628 - 43.4 2,878 1,5
Cotton 1.023 1.420 38.8 1.848 2.533 37.0 181 178
o.w. cotton yarn, n.p.r.s. 39 30 - 21.0 550 619 12.6 1,426 2,033
o.w. cotton yarn, p.r.s. 985 1.390 41.1 1.298 1.914 47.4 132 138
Other - Vegetable yarns 59 68 15.9 579 454 - 21.5 987 668
Man-made filaments yarns 230 384 66.6 21.756 26.071 19.8 9,439 6,788o.w. sewing thread 42 43 2.8 1.909 1.667 - 12.7 4,568 3,88
o.w. synthetic filament yarn 47 160 239.9 18.788 23.206 23.5 39,848 14,48
o.w. artificial filament yarn 0 2 4 2 - 44.2 102
o.w. synthetic monofilament 43 51 17.6 952 1.103 15.8 2,208 2,174
Man made staple yarns 269 155 - 42.5 2.851 3.413 19.7 1,059 2,205
o.w. man made staple yarns,n.p.r.s.
50 26 - 48.9 696 521 - 25.1 1,381 2,024
o.w. man made staple yarns,p.r.s.
219 129 - 41.1 2.156 2.892 34.2 984 2,241
Woven fabrics 13.330 13.713 2.9 44.795 43.541 - 2.8 336 318
Silk 27 28 2.7 486 489 0.7 1,782 1,746
Wool 8.900 10.483 17.8 3.187 3.515 10.3 36 34
o.w. carded wool 6.507 8.715 33.9 1.619 1.736 7.3 25 20
o.w. combed wool 2.390 1.767 - 26.1 1.563 1.757 12.4 65 99
Cotton 766 241 - 68.5 8.456 7.888 - 6.7 1,103 3,269
o.w. cotton, unbleached 58 29 - 49.8 497 501 0.8 864 1,735
o.w. cotton, dyed 58 24 - 58.8 1.353 1.815 34.2 2,342 7,63
o.w. denim fabric 46 0 - 99.8 53 48 - 10.0 116 53,444
Other fabrics 263 195 - 25.7 2.097 1.972 - 6.0 797 1,009
o.w. flax 259 191 - 26.5 1.995 1.885 - 5.5 769 988
Synthetic and artificial fila-ment yarn
1.795 1.511 - 15.8 8.265 7.138 - 13.6 460 472
o.w. synthetic filament yarn 1.759 1.494 - 15.1 7.627 6.790 - 11.0 433 454
o.w. artificial filament yarn 36 17 - 52.0 639 348 - 45.5 1,795 2,042
Synthetic and artificialsstaple fibres
658 526 - 20.1 10.862 12.026 10.7 1,65 2,286
o.w. containing > 85% of
synthetic 119 73 - 38.4 6.743 7.094 5.2 5,657 9,655
o.w. containing < 85% ofsynthetic
284 9 - 96.9 637 586 - 8.1 225 6,579

8/13/2019 Euratex nr 2
http://slidepdf.com/reader/full/euratex-nr-2 134/214
BULLETIN 2013/2
134
EU27 (External Trade) Textile and Clothing Trade 2011 - 2012 (continued)Country :
NorwayIMPORTS EXPORTS Coverage E/I
Unit : 1000 € 2011 2012 Evol. % 2011 2012 Evol. % 2011 2012
o.w. containing < 85% syn-thetic mixed natural fibres
62 55 - 12.4 356 458 28.7 570 838
o.w. other synthetics 91 256 180.5 1.622 1.579 - 2.7 1,776 616
o.w. artificial staple fibres 102 133 30.8 1.504 2.310 53.5 1,482 1,739
Special woven fabrics 920 728 - 20.9 11.353 10.479 - 7.7 1,234 1,44
o.w. pile fabrics 197 160 - 19.1 2.014 1.927 - 4.3 1,02 1,207
o.w. narrow woven fabrics 350 237 - 32.3 6.035 5.614 - 7.0 1,725 2,369
o.w. labels, badges 236 214 - 9.5 1.244 1.264 1.5 526 591
o.w. embroidery 81 68 - 16.8 589 360 - 38.9 725 533
Knitted fabrics 3.833 3.019 - 21.2 12.990 13.876 6.8 339 460
Pile fabrics 1.532 1.115 - 27.2 1.457 1.585 8.8 95 142
< 30 cm; w 5% or moreelastome
303 144 - 52.5 847 1.169 38.0 279 811
> 30 cm; w 5% or moreelastome
97 14 - 85.7 174 136 - 22.0 179 976
Curtain fabrics and raschellace
908 567 - 37.5 6.226 7.136 14.6 685 1,257
Other fabrics 992 1.179 18.8 4.286 3.850 - 10.2 432 327
Carpets 336 238 - 29.2 69.316 76.608 10.5 20,633 32,229
Knotted carpets 43 32 - 25.7 1.858 2.409 29.7 4,32 7,54
Woven carpets 111 51 - 53.8 23.105 25.329 9.6 20,796 49,383
Tufted carpets 126 109 - 13.5 35.273 39.175 11.1 28,035 35,993
Carpets of felt 3 9 184.4 1.882 1.938 3.0 62,31 22,558
Other textiles 82.742 77.027 - 6.9 243.112 243.211 0.0 294 316
Wadding, felt, nonwovens,rubber thread, twine, cor-dage, etc.
17.327 12.522 - 27.7 87.588 90.467 3.3 506 722
o.w. felt 36 39 9.8 3.309 4.246 28.3 9,216 10,769o.w. nonwovens 884 824 - 6.8 39.127 43.850 12.1 4,429 5,324
o.w. special yarn 3 25 711.7 320 373 16.4 10,365 1,486
o.w. twine, rope 7.018 3.223 - 54.1 18.233 19.280 5.7 260 598
o.w. nets 8.022 7.131 - 11.1 18.380 15.308 - 16.7 229 215
Handwoven tapestries &quilted products
27 18 - 33.9 98 51 - 47.9 368 290
Impregnated, coated, etc,,textile fabrics
6.968 7.431 6.6 44.715 40.801 - 8.8 642 549
o.w. tyre cord fabric 2 5 188.3 73 58 - 20.7 4,516 1,243
o.w. fabrics impregnated,coated etc,
1.633 1.021 - 37.5 11.217 9.656 - 13.9 687 946
o.w. textile products, articlesfor technical uses
3.173 3.356 5.8 22.927 19.987 - 12.8 722 596
Other made up textilearticles 15.156 17.740 17.0 71.564 69.786 - 2.5 472 393
o.w. sacks and bags 325 162 - 50.2 9.795 6.707 - 31.5 3,017 4,148
o.w. tarpaulins, sunblinds& alike
2.201 1.517 - 31.1 19.498 20.893 7.2 886 1,377
o.w. other : floorcloths,dishcloths etc
1.908 1.889 - 1.0 38.206 38.505 0.8 2,003 2,039
Worn clothing and otherworn articles
10.674 14.022 31.4 1.931 1.819 - 5.8 18 13
Home textiles 3.100 2.773 - 10.6 61.476 66.711 8.5 1,983 2,406
Bedlinen, table, toilet andkitchen linen
733 414 - 43.5 29.262 26.682 - 8.8 3,994 6,445
o.w. Bedlinen, woven 531 314 - 40.8 14.697 13.586 - 7.6 2,769 4,322
o.w. toilet linen 161 43 - 73.5 8.084 8.010 - 0.9 5,014 18,728
o.w. table linen, woven 33 51 54.8 4.568 3.456 - 24.3 13,779 6,737
Curtains 264 143 - 45.7 11.705 13.967 19.3 4,436 9,754
Other furnishing articles 1.615 1.663 3.0 12.826 18.683 45.7 794 1,123
Garments 37.406 33.341 - 10.9 724.180 763.536 5.4 1,936 2,29

8/13/2019 Euratex nr 2
http://slidepdf.com/reader/full/euratex-nr-2 135/214
BULLETIN 2013/2
135
EU27 (External Trade) Textile and Clothing Trade 2011 - 2012 (continued)Country :
NorwayIMPORTS EXPORTS Coverage E/I
Unit : 1000 € 2011 2012 Evol. % 2011 2012 Evol. % 2011 2012
Occupationals (woven) 1.747 811 - 53.6 29.235 26.552 - 9.2 1,673 3,274
Men's ensembles 152 305 100.0 381 448 17.5 250 147
Men's jackets 350 146 - 58.2 2.575 2.693 4.6 735 1,84
Men's trousers 222 125 - 43.9 9.020 8.075 - 10.5 4,061 6,478
Men's overalls 37 31 - 15.0 2.173 2.054 - 5.5 5,911 6,569
Other men's occupationals 705 71 - 89.9 8.856 7.218 - 18.5 1,256 10,16
Women's ensembles 132 6 - 95.7 117 149 27.4 88 2,628
Women's jackets 28 40 44.7 2.042 1.742 - 14.7 7,363 4,342
Women's trousers 55 23 - 57.8 2.571 2.249 - 12.5 4,669 9,691
Women's overalls 2 6 207.5 75 52 - 30.4 4,024 911
Other women's occupation-nals
64 58 - 9.2 1.424 1.872 31.4 2,226 3,223
Men’s Clothing (knitted and
woven)8.261 6.248 - 24.4 187.069 196.777 5.2 2,264 3,15
Overcoats 782 1.160 48.3 25.154 27.268 8.4 3,215 2,351
o.w. woven 614 663 8.0 22.497 24.416 8.5 3,665 3,683
Suits 181 99 - 45.6 7.569 8.379 10.7 4,179 8,506
o.w. woven 178 44 - 75.4 7.280 8.233 13.1 4,085 18,797
Ensembles 180 366 103.1 1.781 2.067 16.1 987 564
o.w. woven 166 328 97.6 1.537 1.748 13.7 926 533
Jackets and blazers 850 738 - 13.2 13.585 16.939 24.7 1,599 2,295
o.w. woven 704 512 - 27.2 12.006 15.623 30.1 1,706 3,049
Trousers 955 894 - 6.3 76.055 79.556 4.6 7,967 8,897
o.w. woven 869 713 - 18.0 72.060 75.412 4.7 8,29 10,581
Shirts 744 482 - 35.2 28.066 31.436 12.0 3,773 6,525
o.w. woven 621 331 - 46.7 21.649 25.169 16.3 3,487 7,602
Underpants, briefs, etc. 3.672 2.295 - 37.5 14.768 10.433 - 29.4 402 455o.w. knitted 3.595 2.240 - 37.7 11.402 7.939 - 30.4 317 354
Swimwear 23 12 - 49.6 805 1.024 27.3 3,453 8,726
Tracksuits 92 89 - 3.9 9.637 10.807 12.1 10,448 12,192
Women’s Clothing (knittedand woven)
6.794 6.430 - 5.4 247.386 267.984 8.3 3,641 4,168
Overcoats 937 1.178 25.8 28.356 28.698 1.2 3,026 2,435
o.w. woven 767 938 22.2 24.156 25.813 6.9 3,148 2,753
Suits 67 178 168.1 5.179 1.962 - 62.1 7,783 1,1
o.w. woven 62 7 - 88.3 4.529 1.472 - 67.5 7,349 20,503
Ensembles 160 35 - 78.2 2.132 2.676 25.5 1,331 7,662
o.w. woven 150 21 - 86.0 1.690 2.373 40.4 1,123 11,27
Jackets 265 431 62.5 15.542 18.248 17.4 5,865 4,237
o.w. woven 159 248 55.5 12.847 15.219 18.5 8,067 6,147
Skirts and dresses 1.044 1.109 6.2 53.432 60.170 12.6 5,116 5,423
o.w. woven 605 513 - 15.1 35.150 37.680 7.2 5,812 7,34
Trousers 1.341 1.096 - 18.3 63.001 72.709 15.4 4,698 6,637
o.w. woven 1.165 944 - 19.0 51.871 61.711 19.0 4,451 6,54
Blouses 589 443 - 24.8 39.450 46.136 16.9 6,694 10,405
o.w. woven 481 199 - 58.5 23.107 26.749 15.8 4,809 13,409
Slips, petticoats, etc. 1.861 1.506 - 19.1 20.748 19.180 - 7.6 1,115 1,274
o.w. knitted 1.751 1.469 - 16.1 19.155 16.601 - 13.3 1,094 1,13
Swimwear 98 68 - 30.3 4.623 5.143 11.3 4,728 7,543
Tracksuits 116 295 153.2 7.399 6.319 - 14.6 6,359 2,144
Others (knitted and woven) 22.346 20.657 - 7.6 289.629 298.670 3.1 1,296 1,446
Babies’ garments 1.400 1.239 - 11.5 13.525 14.179 4.8 966 1,145
o.w. knitted or crocheted 1.366 1.165 - 14.7 10.064 11.318 12.5 737 971
T-shirts 7.339 6.118 - 16.6 70.069 65.936 - 5.9 955 1,078
Jerseys, pullovers, cardigans 4.918 4.756 - 3.3 62.143 69.148 11.3 1,263 1,454
Special garments 2.865 2.339 - 18.4 32.722 36.660 12.0 1,142 1,568
o.w. woven 2.408 1.777 - 26.2 30.106 34.056 13.1 1,25 1,917

8/13/2019 Euratex nr 2
http://slidepdf.com/reader/full/euratex-nr-2 136/214
BULLETIN 2013/2
136
EU27 (External Trade) Textile and Clothing Trade 2011 - 2012 (continued)Country :
NorwayIMPORTS EXPORTS Coverage E/I
Unit : 1000 € 2011 2012 Evol. % 2011 2012 Evol. % 2011 2012
Other garments, knitted orcrocheted
394 655 66.3 13.127 13.751 4.8 3,331 2,098
Gloves 200 182 - 9.0 5.532 5.894 6.5 2,766 3,238
Ties, bow ties, and cravats 53 108 104.6 2.566 2.909 13.4 4,858 2,692
Shawls, scarves, mufflers,mantillas, etc
319 335 5.0 14.874 17.063 14.7 4,661 5,093
Pantyhose, tights, stockings,socks, etc
4.376 3.982 - 9.0 45.767 38.095 - 16.8 1,046 957
Brassières, girdles, corsets,etc,
167 364 118.1 21.826 27.275 25.0 13,095 7,501
Other accessories 240 526 119.3 6.074 6.573 8.2 2,535 1,251
TOTAL Chapter 61 KnittedGarments
26.241 24.335 - 7.3 318.064 314.382 - 1.2 1212 1292
TOTAL Chapter 62 Woven
Garments11.165 9.019 - 19.2 406.172 449.138 10.6 3638 498
Total Clothing - (CH 61+62) 37.419 33.354 - 10.9 724.238 763.546 5.4 1935 2289
Total Textile - (CH 50-60+ 63)
112.988 108.075 - 4.3 484.106 501.825 3.7 428 464
Total 150.408 141.430 - 6.0 1.208.344 1.265.371 4.7 803 895

8/13/2019 Euratex nr 2
http://slidepdf.com/reader/full/euratex-nr-2 137/214
BULLETIN 2013/2
137
EU27 (External Trade) Textile and Clothing Trade 2011 - 2012Country :
PakistanIMPORTS EXPORTS Coverage E/I
Unit : 1000 € 2011 2012 Evol. % 2011 2012 Evol. % 2011 2012
Natural fibers 87.498 47.097 - 46.2 5.189 41.160 693.3 6 87
Silk 0 0 8 4 - 53.9
Wool, fine or coarse animalhair
799 372 - 53.4 593 274 - 53.8 74 74
o.w. wool, not carded orcombed
646 263 - 59.2 593 144 - 75.7 92 55
o.w. wool and fine or coarseanimal hair
2 0 - 81.3 0 126 0 44,864
Cotton 86.623 46.648 - 46.1 4.513 40.747 803.0 5 87
Other vegetable fibres 77 77 - 0.5 75 135 81.3 97 177
o.w. flax 0 0 75 135 81.3
Man-made fibres 348 268 - 22.8 11.604 9.511 - 18.0 3,339 3,544
Synthetic filament tow 0 8 7.370 6.240 - 15.3 74,199
Artificial filament tow 0 0 104 82 - 20.7Synthetic staple fibres 293 168 - 42.7 3.342 2.437 - 27.1 1,14 1,452
Artificial staple fibres 0 8 221 49 - 77.8 583
Yarns and Threads 159.407 87.664 - 45.0 6.555 5.446 - 16.9 4 6
Silk 4 0 - 100.0 5 0 - 100.0 120
Wool 0 0 613 266 - 56.7 66,405
o.w. carded wool, n.p.r.s. 0 0 438 152 - 65.4 54,207
o.w. combed wool, n.p.r.s. 0 0 25 0 - 100.0 0
Cotton 136.718 69.809 - 48.9 62 113 83.1 0 0
o.w. cotton yarn, n.p.r.s. 136.452 69.246 - 49.3 58 110 90.6 0 0
o.w. cotton yarn, p.r.s. 266 563 111.4 4 2 - 35.9 1 0
Other - Vegetable yarns 0 251 26 27 2.4 11
Man-made filaments yarns 345 468 35.8 5.130 4.749 - 7.4 1,487 1,014
o.w. sewing thread 131 241 84.3 371 422 13.9 284 175o.w. synthetic filament yarn 144 197 37.0 3.632 3.071 - 15.5 2,527 1,559
o.w. artificial filament yarn 45 30 - 32.1 378 409 8.3 841 1,341
o.w. synthetic monofilament 0 0 689 846 22.7 445,042
Man made staple yarns 22.339 17.135 - 23.3 718 291 - 59.5 3 2
o.w. man made staple yarns,n.p.r.s.
22.217 17.099 - 23.0 710 281 - 60.5 3 2
o.w. man made staple yarns,p.r.s.
123 36 - 70.8 9 11 22.6 7 30
Woven fabrics 627.478 501.932 - 20.0 5.053 5.975 18.2 1 1
Silk 70 135 94.1 3 10 240.0 4 7
Wool 0 3 591 1.816 207.3 62,626
o.w. carded wool 0 3 66 268 305.0 9,328
o.w. combed wool 0 0 511 1.540 201.6
Cotton 441.154 356.238 - 19.2 1.739 1.771 1.8 0 0
o.w. cotton, unbleached 246.343 188.273 - 23.6 201 266 32.2 0 0
o.w. cotton, dyed 42.954 35.098 - 18.3 128 117 - 8.6 0 0
o.w. denim fabric 21.767 14.754 - 32.2 35 44 25.4 0 0
Other fabrics 326 179 - 45.0 14 24 75.8 4 14
o.w. flax 247 105 - 57.6 14 21 55.5 6 20
Synthetic and artificial fila-ment yarn
19.806 15.353 - 22.5 434 380 - 12.4 2 2
o.w. synthetic filament yarn 19.637 15.248 - 22.4 364 374 2.7 2 2
o.w. artificial filament yarn 169 105 - 37.8 71 7 - 90.6 42 6
Synthetic and artificialsstaple fibres
158.030 121.705 - 23.0 1.669 1.188 - 28.9 1 1
o.w. containing > 85% ofsynthetic
977 3.161 223.6 66 43 - 33.9 7 1
o.w. containing < 85% ofsynthetic
109.454 83.349 - 23.9 38 76 100.0 0 0
o.w. containing < 85% syn-thetic mixed natural fibres
46.708 34.501 - 26.1 1.451 960 - 33.8 3 3

8/13/2019 Euratex nr 2
http://slidepdf.com/reader/full/euratex-nr-2 138/214
BULLETIN 2013/2
138
EU27 (External Trade) Textile and Clothing Trade 2011 - 2012 (continued)Country :
PakistanIMPORTS EXPORTS Coverage E/I
Unit : 1000 € 2011 2012 Evol. % 2011 2012 Evol. % 2011 2012
o.w. other synthetics 252 360 42.7 33 93 181.6 13 26
o.w. artificial staple fibres 638 334 - 47.6 81 15 - 81.8 13 4
Special woven fabrics 6.073 6.662 9.7 603 786 30.3 10 12
o.w. pile fabrics 2.911 3.638 25.0 34 35 3.3 1 1
o.w. narrow woven fabrics 1.170 1.098 - 6.2 223 196 - 12.1 19 18
o.w. labels, badges 358 448 25.1 322 408 26.8 90 91
o.w. embroidery 1.251 1.219 - 2.6 3 4 47.2 0 0
Knitted fabrics 1.144 1.185 3.5 2.030 2.185 7.7 177 184
Pile fabrics 159 119 - 25.0 1.904 1.592 - 16.4 1,2 1,338
< 30 cm; w 5% or moreelastome
0 0 - 100.0 13 14 11.4 7,094
> 30 cm; w 5% or moreelastome
19 61 213.2 45 74 63.3 232 121
Curtain fabrics and raschellace
231 432 87.3 56 96 69.9 24 22
Other fabrics 735 573 - 22.1 12 410 3362.7 2 71
Carpets 45.825 35.498 - 22.5 625 919 47.0 1 3
Knotted carpets 40.822 31.279 - 23.4 129 377 193.5 0 1
Woven carpets 3.913 3.723 - 4.9 91 142 55.4 2 4
Tufted carpets 428 139 - 67.6 356 333 - 6.3 83 240
Carpets of felt 2 1 - 55.0 0 7 0 752
Other textiles 55.320 55.891 1.0 44.903 73.224 63.1 81 131
Wadding, felt, nonwovens,rubber thread, twine, cor-dage, etc.
3.251 4.035 24.1 2.930 2.561 - 12.6 90 63
o.w. felt 5 16 229.5 28 18 - 34.7 566 112
o.w. nonwovens 1.104 1.240 12.3 1.609 1.285 - 20.1 146 104
o.w. special yarn 5 12 138.8 847 664 - 21.6 16,782 5,51
o.w. twine, rope 1.076 703 - 34.7 99 236 138.7 9 34
o.w. nets 104 105 1.5 130 35 - 72.6 125 34
Handwoven tapestries &quilted products
12 11 - 5.4 0 1 0 10
Impregnated, coated, etc,,textile fabrics
2.519 2.782 10.4 4.771 4.954 3.8 189 178
o.w. tyre cord fabric 6 0 - 100.0 99 209 111.4 1,611
o.w. fabrics impregnated,coated etc,
2.365 2.452 3.7 853 1.089 27.7 36 44
o.w. textile products, articlesfor technical uses
89 169 89.8 2.632 2.075 - 21.2 2,954 1,226
Other made up textilearticles
49.532 49.048 - 1.0 36.436 64.902 78.1 74 132
o.w. sacks and bags 4.128 3.282 - 20.5 52 5 - 89.6 1 0o.w. tarpaulins, sunblinds& alike
929 1.027 10.6 635 2 - 99.6 68 0
o.w. other : floorcloths,dishcloths etc
38.844 39.551 1.8 393 272 - 30.9 1 1
Worn clothing and otherworn articles
5.611 5.105 - 9.0 35.323 64.619 82.9 630 1,266
Home textiles 1.013.570 848.427 - 16.3 1.453 1.315 - 9.5 0 0
Bedlinen, table, toilet andkitchen linen
948.322 791.225 - 16.6 330 557 68.7 0 0
o.w. Bedlinen, woven 667.944 544.135 - 18.5 279 440 57.9 0 0
o.w. toilet linen 159.737 155.138 - 2.9 30 73 141.9 0 0
o.w. table linen, woven 11.953 9.957 - 16.7 0 1 3366.7 0 0
Curtains 50.034 45.018 - 10.0 4 78 1986.6 0 0
Other furnishing articles 15.804 12.624 - 20.1 58 0 - 100.0 0 0Garments 1.272.026 1.248.683 - 1.8 3.072 4.153 35.2 0 0
Occupationals (woven) 36.538 31.628 - 13.4 47 50 5.3 0 0
Men’s ensembles 205 277 35.5 0 2 1169.2 0 1

8/13/2019 Euratex nr 2
http://slidepdf.com/reader/full/euratex-nr-2 139/214
BULLETIN 2013/2
139
EU27 (External Trade) Textile and Clothing Trade 2011 - 2012 (continued)Country :
PakistanIMPORTS EXPORTS Coverage E/I
Unit : 1000 € 2011 2012 Evol. % 2011 2012 Evol. % 2011 2012
Men's jackets 3.098 2.554 - 17.5 3 5 67.2 0 0
Men's trousers 12.494 10.973 - 12.2 6 2 - 58.7 0 0
Men's overalls 2.020 1.578 - 21.9 0 6 15250.0 0 0
Other men's occupationals 5.272 5.233 - 0.7 35 32 - 9.9 1 1
Women's ensembles 143 35 - 75.3 0 0 0 0
Women's jackets 1.277 601 - 52.9 0 0 0 0
Women's trousers 2.861 1.675 - 41.5 0 0 0 0
Women's overalls 8 6 - 16.9 0 0 0 0
Other women's occupation-nals
9.160 8.694 - 5.1 3 2 - 24.5 0 0
Men’s Clothing (knitted andwoven)
599.095 589.955 - 1.5 1.180 1.241 5.2 0 0
Overcoats 22.656 17.993 - 20.6 123 43 - 64.7 1 0
o.w. woven 11.773 11.343 - 3.7 115 36 - 68.6 1 0Suits 1.494 2.331 56.0 60 33 - 44.9 4 1
o.w. woven 1.121 1.692 51.0 60 27 - 54.9 5 2
Ensembles 5.711 4.756 - 16.7 68 82 20.5 1 2
o.w. woven 3.397 3.495 2.9 0 82 0 2
Jackets and blazers 22.383 22.959 2.6 79 156 98.4 0 1
o.w. woven 11.322 9.236 - 18.4 45 115 155.2 0 1
Trousers 439.530 440.842 0.3 487 359 - 26.3 0 0
o.w. woven 412.580 412.977 0.1 482 353 - 26.7 0 0
Shirts 59.634 58.396 - 2.1 259 490 89.5 0 1
o.w. woven 7.693 6.030 - 21.6 167 160 - 4.3 2 3
Underpants, briefs, etc. 33.673 28.013 - 16.8 19 20 6.7 0 0
o.w. knitted 17.936 16.419 - 8.5 10 12 28.4 0 0
Swimwear 268 134 - 49.8 0 0 - 100.0 0 0Tracksuits 8.089 8.735 8.0 18 11 - 40.6 0 0
Women’s Clothing (knittedand woven)
307.384 305.495 - 0.6 458 1.144 149.9 0 0
Overcoats 11.162 15.031 34.7 74 4 - 94.7 1 0
o.w. woven 5.949 5.715 - 3.9 45 0 - 99.3 1 0
Suits 3.108 5.565 79.1 25 95 273.9 1 2
o.w. woven 2.394 2.288 - 4.5 17 95 468.7 1 4
Ensembles 10.014 9.576 - 4.4 18 11 - 36.7 0 0
o.w. woven 7.912 8.688 9.8 18 0 - 100.0 0 0
Jackets 10.873 9.544 - 12.2 5 111 2221.5 0 1
o.w. woven 7.428 5.889 - 20.7 0 99 0 2
Skirts and dresses 21.472 13.560 - 36.8 115 163 42.2 1 1
o.w. woven 17.376 10.502 - 39.6 94 155 64.7 1 1
Trousers 195.019 208.407 6.9 140 684 387.3 0 0
o.w. woven 161.560 178.519 10.5 140 370 163.6 0 0
Blouses 9.766 7.541 - 22.8 44 51 16.1 0 1
o.w. woven 2.140 1.932 - 9.7 32 29 - 10.0 1 1
Slips, petticoats, etc. 26.795 19.020 - 29.0 5 5 - 5.8 0 0
o.w. knitted 13.933 10.404 - 25.3 3 5 66.2 0 0
Swimwear 76 83 9.4 0 0 0 0
Tracksuits 9.683 8.133 - 16.0 19 4 - 79.3 0 0
Others (knitted and woven) 365.326 352.950 - 3.4 1.434 1.768 23.3 0 1
Babies’ garments 17.208 16.242 - 5.6 98 31 - 68.9 1 0
o.w. knitted or crocheted 6.639 9.414 41.8 28 25 - 8.9 0 0
T-shirts 80.388 69.439 - 13.6 238 222 - 6.9 0 0
Jerseys, pullovers, cardigans 100.031 100.000 - 0.0 109 168 53.6 0 0
Special garments 6.596 5.682 - 13.9 207 583 182.1 3 10
o.w. woven 6.496 5.468 - 15.8 176 296 68.3 3 5
Other garments, knitted orcrocheted
5.758 5.001 - 13.1 66 73 9.4 1 1

8/13/2019 Euratex nr 2
http://slidepdf.com/reader/full/euratex-nr-2 140/214
BULLETIN 2013/2
140
EU27 (External Trade) Textile and Clothing Trade 2011 - 2012 (continued)Country :
PakistanIMPORTS EXPORTS Coverage E/I
Unit : 1000 € 2011 2012 Evol. % 2011 2012 Evol. % 2011 2012
Gloves 90.072 80.250 - 10.9 163 148 - 8.8 0 0
Ties, bow ties, and cravats 529 405 - 23.6 67 109 62.9 13 27
Shawls, scarves, mufflers,mantillas, etc
1.000 1.023 2.3 17 31 87.9 2 3
Pantyhose, tights, stockings,socks, etc
53.064 62.532 17.8 120 168 40.5 0 0
Brassières, girdles, corsets,etc,
509 436 - 14.4 98 10 - 90.1 19 2
Other accessories 4.721 5.070 7.4 252 299 18.8 5 6
TOTAL Chapter 61 KnittedGarments
524.798 509.440 - 2.9 1.066 1.970 84.8 0 0
TOTAL Chapter 62 WovenGarments
747.229 739.301 - 1.1 2.006 2.183 8.8 0 0
Total Clothing - (CH 61+62) 1.272.027 1.248.741 - 1.8 3.072 4.153 35.2 0 0
Total Textile - (CH 50-60+ 63)
1.990.680 1.578.027 - 20.7 103.843 156.435 50.6 5 10
Total 3.262.707 2.826.768 - 13.4 106.915 160.588 50.2 3 6

8/13/2019 Euratex nr 2
http://slidepdf.com/reader/full/euratex-nr-2 141/214
BULLETIN 2013/2
141
EU27 (External Trade) Textile and Clothing Trade 2011 - 2012Country :
PhilippinesIMPORTS EXPORTS Coverage E/I
Unit : 1000 € 2011 2012 Evol. % 2011 2012 Evol. % 2011 2012
Natural fibers 10.734 9.764 - 9.0 118 614 419.6 1 6
Silk 0 0 2 0 - 100.0
Wool, fine or coarse animalhair
1 0 - 100.0 2 0 - 100.0 190
o.w. wool and fine or coarseanimal hair
1 0 - 100.0 2 0 - 100.0 190
Cotton 0 0 0 589 1,177,400
Other vegetable fibres 10.733 9.764 - 9.0 114 26 - 77.4 1 0
o.w. flax 6 0 - 100.0 105 26 - 75.4 1,693
Man-made fibres 155 0 - 100.0 93 122 31.0 60
Synthetic filament tow 0 0 19 0 - 100.0
Synthetic staple fibres 0 0 69 122 78.2
Yarns and Threads 3.996 2.978 - 25.5 2.070 755 - 63.5 52 25
Silk 0 0 - 100.0 1 0 - 100.0 5,55
Wool 30 0 - 100.0 1.383 218 - 84.2 4,662
o.w. carded wool, n.p.r.s. 0 0 186 100 - 46.3
o.w. combed wool, n.p.r.s. 2 0 - 100.0 75 90 19.7 3,924
Cotton 421 18 - 95.6 187 136 - 26.8 44 744
o.w. cotton yarn, n.p.r.s. 411 0 - 100.0 84 33 - 60.3 20 20,694
o.w. cotton yarn, p.r.s. 9 18 96.9 103 103 0.3 1,116 569
Other - Vegetable yarns 116 53 - 54.2 0 1 2520.0 0 2
Man-made filaments yarns 53 98 85.3 273 284 4.1 516 290
o.w. sewing thread 1 6 311.3 187 122 - 34.9 13,233 2,096
o.w. synthetic filament yarn 13 2 - 86.2 12 142 1110.4 90 7,851
o.w. artificial filament yarn 0 1 2150.0 36 0 - 100.0 89,275 0
o.w. synthetic monofilament 37 25 - 33.5 28 20 - 28.7 75 80
Man made staple yarns 3.377 2.809 - 16.8 226 115 - 49.1 7 4o.w. man made staple yarns,n.p.r.s.
3.363 2.809 - 16.5 225 106 - 52.9 7 4
o.w. man made staple yarns,p.r.s.
14 0 - 99.3 1 9 598.5 10 9,22
Woven fabrics 2.510 2.785 11.0 15.209 20.703 36.1 606 743
Silk 46 7 - 84.5 23 77 241.9 49 1,079
Wool 2 21 941.7 6.691 7.172 7.2 327,968 33,749
o.w. carded wool 0 21 6.356 6.642 4.5 31,254
o.w. combed wool 2 0 - 100.0 327 530 62.2 16,021
Cotton 30 57 91.1 2.775 3.866 39.3 9,228 6,726
o.w. cotton, unbleached 0 3 8766.7 13 15 21.8 42,4 582
o.w. cotton, dyed 0 4 1256.7 1.027 1.481 44.2 342,417 36,392
o.w. denim fabric 0 0 193 51 - 73.7
Other fabrics 687 667 - 3.0 1.670 1.934 15.8 243 290
o.w. flax 19 1 - 92.8 1.668 1.931 15.8 8,887 142,001
Synthetic and artificial fila-ment yarn
27 54 101.6 1.285 2.894 125.3 4,777 5,337
o.w. synthetic filament yarn 27 54 100.6 1.229 2.069 68.4 4,568 3,834
o.w. artificial filament yarn 0 0 56 825 1366.5 317,323
Synthetic and artificialsstaple fibres
81 28 - 65.0 873 2.364 170.7 1,079 8,339
o.w. containing > 85% ofsynthetic
71 5 - 93.1 326 479 47.0 458 9,737
o.w. containing < 85% ofsynthetic
0 21 30 81 171.3 390
o.w. containing < 85% syn-thetic mixed natural fibres
0 0 42 57 34.7 26,905
o.w. other synthetics 1 2 169.0 369 1.614 337.8 63,547 103,447o.w. artificial staple fibres 9 1 - 90.0 107 134 25.0 1,167 14,558

8/13/2019 Euratex nr 2
http://slidepdf.com/reader/full/euratex-nr-2 142/214
BULLETIN 2013/2
142
EU27 (External Trade) Textile and Clothing Trade 2011 - 2012 (continued)Country :
PhilippinesIMPORTS EXPORTS Coverage E/I
Unit : 1000 € 2011 2012 Evol. % 2011 2012 Evol. % 2011 2012
Special woven fabrics 1.636 1.950 19.2 1.879 2.395 27.5 115 123
o.w. pile fabrics 5 5 4.7 458 459 0.2 8,9 8,521
o.w. narrow woven fabrics 1.178 1.449 23.0 362 417 15.2 31 29
o.w. labels, badges 4 11 162.1 24 42 77.8 585 397
o.w. embroidery 300 298 - 0.5 17 54 212.0 6 18
Knitted fabrics 31 21 - 33.7 3.088 4.106 33.0 9,844 19,749
Pile fabrics 3 0 - 91.2 1.253 1.824 45.6 48,201 793,222
< 30 cm; w 5% or moreelastome
1 0 - 100.0 35 19 - 47.6 2,856
> 30 cm; w 5% or moreelastome
2 6 190.1 927 511 - 44.9 41,57 7,895
Curtain fabrics and raschellace
16 5 - 68.1 361 765 112.2 2,234 14,853
Other fabrics 9 9 - 2.4 512 987 92.9 5,587 11,042Carpets 134 635 373.0 616 908 47.4 459 143
Knotted carpets 23 1 - 96.0 15 87 467.2 66 9,404
Woven carpets 17 39 127.0 475 491 3.5 2,759 1,258
Tufted carpets 85 574 577.6 28 204 639.1 33 36
Carpets of felt 0 0 - 100.0 0 3 1828.6 74
Other textiles 14.187 15.570 9.7 9.279 9.896 6.7 65 64
Wadding, felt, nonwovens,rubber thread, twine, cor-dage, etc.
4.265 4.551 6.7 1.002 4.065 305.6 23 89
o.w. felt 12 10 - 13.7 19 20 2.9 159 189
o.w. nonwovens 114 92 - 18.8 635 1.944 206.2 558 2,104
o.w. special yarn 0 0 3 5 46.8 5,963
o.w. twine, rope 885 1.144 29.2 179 144 - 19.3 20 13
o.w. nets 2.614 2.743 4.9 15 18 25.7 1 1
Handwoven tapestries &quilted products
1 2 69.6 53 53 1.4 4,577 2,736
Impregnated, coated, etc,,textile fabrics
92 200 115.9 5.028 3.764 - 25.1 5,436 1,885
o.w. tyre cord fabric 2 18 964.1 1.664 547 - 67.2 99,656 3,076
o.w. fabrics impregnated,coated etc,
89 12 - 86.4 1.169 1.394 19.3 1,31 11,503
o.w. textile products, articlesfor technical uses
9.764 10.708 9.7 2.081 1.321 - 36.5 21 12
Other made up textilearticles
5.997 6.730 12.2 67 6 - 90.4 1 0
o.w. sacks and bags 2.111 1.759 - 16.7 88 149 68.9 4 8
o.w. tarpaulins, sunblinds& alike
1.620 2.187 35.0 270 376 39.2 17 17
o.w. other : floorcloths,dishcloths etc
20 31 53.2 1.641 764 - 53.4 8,023 2,439
Worn clothing and otherworn articles
640 489 - 23.5 138 115 - 17.2 22 23
Home textiles 169 191 12.7 79 45 - 43.2 47 24
Bedlinen, table, toilet andkitchen linen
82 74 - 9.8 28 9 - 67.6 34 12
o.w. Bedlinen, woven 5 10 90.1 34 19 - 44.6 646 188
o.w. toilet linen 83 107 29.7 16 16 - 2.2 20 15
o.w. table linen, woven 420 143 - 66.0 31 50 61.2 7 35
Curtains 47 91 93.6 14 17 26.2 29 19
Other furnishing articles 171.963 188.220 9.5 21.220 21.426 1.0 12 11
Garments 226 419 85.5 17 26 54.6 7 6
Occupationals (woven) 3 4 13.9 8 2 - 78.2 258 49Men’s ensembles 0 0 0 3
Men’s trousers 0 33 1 5 423.2 3,3 16

8/13/2019 Euratex nr 2
http://slidepdf.com/reader/full/euratex-nr-2 143/214
BULLETIN 2013/2
143
EU27 (External Trade) Textile and Clothing Trade 2011 - 2012 (continued)Country :
PhilippinesIMPORTS EXPORTS Coverage E/I
Unit : 1000 € 2011 2012 Evol. % 2011 2012 Evol. % 2011 2012
Men’s overalls 0 30 0 0 0
Other men’s occupationals 6 26 314.2 1 4 194.1 21 15
Women’s ensembles 5 18 244.6 1 0 - 72.4 20 2
o.w. jackets 0 49 48580.0 0 0 0 0
Women’s trousers 0 20 0 0 0
Other women’s occupation-nals
211 239 13.4 5 11 123.3 2 5
Men’s Clothing (knitted andwoven)
55.430 65.332 17.9 3.897 5.221 34.0 7 8
Overcoats 5.342 6.081 13.8 176 249 41.1 3 4
o.w. woven 3.172 4.435 39.8 123 203 64.9 4 5
Suits 26 45 72.4 27 40 46.9 106 90
o.w. woven 19 17 - 11.4 22 34 55.1 113 197
Ensembles 78 109 38.9 8 3 - 61.2 11 3o.w. woven 6 13 127.1 8 3 - 61.2 142 24
Jackets and blazers 392 2.140 445.5 611 773 26.5 156 36
o.w. woven 328 2.001 509.5 565 658 16.5 172 33
Trousers 13.942 17.329 24.3 1.454 1.910 31.4 10 11
o.w. woven 11.535 13.055 13.2 1.434 1.810 26.3 12 14
Shirts 24.288 32.690 34.6 1.432 2.054 43.4 6 6
o.w. woven 15.443 18.257 18.2 839 1.024 22.1 5 6
Underpants, briefs, etc. 6.971 3.816 - 45.3 52 74 42.8 1 2
o.w. knitted 6.786 3.680 - 45.8 43 69 61.6 1 2
Swimwear 2.532 2.767 9.3 21 21 - 1.1 1 1
Tracksuits 1.849 313 - 83.0 82 59 - 27.9 4 19
Women’s Clothing (knitted
and woven)
58.119 64.634 11.2 10.430 9.412 - 9.8 18 15
Overcoats 21.899 21.541 - 1.6 180 274 51.6 1 1
o.w. woven 2.687 4.082 51.9 164 254 54.4 6 6
Suits 39 32 - 17.4 14 10 - 25.6 36 32
o.w. woven 31 13 - 57.4 2 2 9.1 7 17
Ensembles 161 29 - 82.2 83 89 7.1 52 312
o.w. woven 49 19 - 61.5 83 88 5.7 172 471
Jackets 2.274 2.841 24.9 478 654 36.8 21 23
o.w. woven 2.211 2.493 12.7 458 587 28.2 21 24
Skirts and dresses 6.171 6.003 - 2.7 1.971 1.833 - 7.0 32 31
o.w. woven 4.155 3.449 - 17.0 1.244 1.199 - 3.6 30 35
Trousers 20.745 27.877 34.4 4.758 2.938 - 38.3 23 11
o.w. woven 11.123 13.146 18.2 4.501 2.670 - 40.7 40 20
Blouses 2.719 2.607 - 4.1 2.458 3.001 22.1 90 115
o.w. woven 1.240 1.141 - 8.0 1.889 2.104 11.4 152 184
Slips, petticoats, etc. 2.272 1.599 - 29.6 286 213 - 25.4 13 13
o.w. knitted 1.994 1.419 - 28.8 282 201 - 28.8 14 14
Swimwear 586 124 - 78.9 31 20 - 33.9 5 16
Tracksuits 1.030 1.702 65.2 124 252 102.6 12 15
Others (knitted and woven) 58.412 58.253 - 0.3 6.892 6.793 - 1.4 12 12
Babies’ garments 4.126 4.444 7.7 105 165 57.9 3 4
o.w. knitted or crocheted 1.622 2.247 38.5 74 123 66.2 5 5
T-shirts 13.122 15.584 18.8 3.523 2.943 - 16.5 27 19
Jerseys, pullovers, cardigans 10.316 11.576 12.2 1.229 1.403 14.2 12 12
Special garments 1.897 1.964 3.5 566 652 15.2 30 33
o.w. woven 1.473 1.509 2.5 160 345 115.1 11 23
Other garments, knitted orcrocheted 444 623 40.2 174 156 - 10.2 39 25
Gloves 1.769 1.693 - 4.3 20 26 31.0 1 2
Ties, bow ties, and cravats 36 13 - 64.0 305 137 - 55.0 844 1,056

8/13/2019 Euratex nr 2
http://slidepdf.com/reader/full/euratex-nr-2 144/214
BULLETIN 2013/2
144
EU27 (External Trade) Textile and Clothing Trade 2011 - 2012 (continued)Country :
PhilippinesIMPORTS EXPORTS Coverage E/I
Unit : 1000 € 2011 2012 Evol. % 2011 2012 Evol. % 2011 2012
Shawls, scarves, mufflers,mantillas, etc
629 555 - 11.7 181 113 - 37.5 29 20
Pantyhose, tights, stockings,socks, etc
4.046 3.397 - 16.0 240 236 - 1.9 6 7
Brassières, girdles, corsets,etc,
16.835 15.041 - 10.7 119 28 - 76.1 1 0
Other accessories 174 185 6.5 657 947 44.2 377 510
TOTAL Chapter 61 KnittedGarments
92.694 103.441 11.6 8.647 8.745 1.1 9 8
TOTAL Chapter 62 WovenGarments
79.269 84.791 7.0 12.573 12.678 0.8 16 15
Total Clothing 171.963 188.232 9.5 21.220 21.423 1.0 12 11
Total Textile 32.395 32.243 - 0.5 33.793 44.094 30.5 104 137
Total 204.358 220.475 7.9 55.014 65.517 19.1 27 30

8/13/2019 Euratex nr 2
http://slidepdf.com/reader/full/euratex-nr-2 145/214
BULLETIN 2013/2
145
EU27 (External Trade) Textile and Clothing Trade 2011 - 2012Country :
RussiaIMPORTS EXPORTS Coverage E/I
Unit : 1000 € 2011 2012 Evol. % 2011 2012 Evol. % 2011 2012
Natural fibers 4.131 2.953 - 28.5 3.465 4.024 16.1 84 136
Silk 0 0 5 5 - 2.7
o.w. raw silk 0 0 0 4
Wool, fine or coarse animalhair
2.082 1.383 - 33.6 1.823 1.474 - 19.1 88 107
o.w. wool, not carded orcombed
1.050 495 - 52.9 906 1.134 25.2 86 229
o.w. wool and fine or coarseanimal hair
216 614 184.4 886 301 - 66.0 410 49
Cotton 1.958 1.525 - 22.1 1.036 581 - 43.9 53 38
Other vegetable fibres 91 45 - 50.4 601 1.964 226.8 662 4,358
o.w. flax 50 6 - 88.5 379 1.625 328.9 762 28,36
Man-made fibres 4.081 2.021 - 50.5 20.487 27.740 35.4 502 1,373
Synthetic filament tow 0 0 - 100.0 49 73 49.4 40,95Artificial filament tow 657 12 - 98.1 14.458 21.498 48.7 2,2 173,37
Synthetic staple fibres 3.169 1.527 - 51.8 5.428 5.483 1.0 171 359
Artificial staple fibres 0 1 349 535 53.5 81,117
Yarns and Threads 14.202 11.519 - 18.9 96.873 98.125 1.3 682 852
Silk 0 0 28.6 162 156 - 3.5 230,957 173,411
Wool 135 76 - 43.9 8.426 8.988 6.7 6,234 11,856
o.w. carded wool, n.p.r.s. 2 0 - 100.0 4.177 4.218 1.0 221,011
o.w. combed wool, n.p.r.s. 0 0 2.626 2.839 8.1 1,419,635
Cotton 4.173 2.963 - 29.0 9.439 7.157 - 24.2 226 242
o.w. cotton yarn, n.p.r.s. 4.116 2.915 - 29.2 7.606 5.820 - 23.5 185 200
o.w. cotton yarn, p.r.s. 57 48 - 14.6 1.833 1.337 - 27.1 3,236 2,764
Other - Vegetable yarns 46 7 - 84.1 2.188 2.259 3.2 4,777 30,984
Man-made filaments yarns 9.806 8.443 - 13.9 51.333 55.434 8.0 524 657o.w. sewing thread 125 117 - 6.0 5.141 6.006 16.8 4,122 5,124
o.w. synthetic filament yarn 9.658 8.325 - 13.8 38.241 39.512 3.3 396 475
o.w. artificial filament yarn 23 0 - 100.0 296 227 - 23.4 1,296
o.w. synthetic monofilament 0 1 7.502 9.407 25.4 1,133,322
Man made staple yarns 42 30 - 28.6 25.325 24.132 - 4.7 60,026 80,066
o.w. man made staple yarns,n.p.r.s.
0 12 2372.3 22.846 20.746 - 9.2 4,860,923 178,536
o.w. man made staple yarns,p.r.s.
42 19 - 55.6 2.479 3.386 36.6 5,941 18,282
Woven fabrics 10.549 6.359 - 39.7 242.408 262.742 8.4 2,298 4,132
Silk 9 7 - 25.7 14.003 15.740 12.4 160,035 242,146
Wool 5 84 1674.0 42.385 47.060 11.0 896,097 56,084
o.w. carded wool 0 82 58235.7 25.385 27.769 9.4 18,132,393 34,001
o.w. combed wool 5 2 - 51.2 16.994 19.284 13.5 370,242 860,888
Cotton 3.896 998 - 74.4 32.554 35.198 8.1 836 3,526
o.w. cotton, unbleached 2.759 94 - 96.6 899 704 - 21.7 33 747
o.w. cotton, dyed 29 37 26.8 6.491 7.351 13.3 22,358 19,974
o.w. denim fabric 0 0 316 395 24.7
Other fabrics 6.324 4.864 - 23.1 3.954 3.714 - 6.1 63 76
o.w. flax 6.324 4.862 - 23.1 3.786 3.428 - 9.5 60 70
Synthetic and artificial fila-ment yarn
86 122 41.8 50.178 57.763 15.1 58,462 47,467
o.w. synthetic filament yarn 85 121 42.3 44.870 51.600 15.0 52,633 42,529
o.w. artificial filament yarn 1 0 - 37.9 5.308 6.162 16.1 915,138 1,711,731
Synthetic and artificialsstaple fibres
36 33 - 10.5 55.174 58.009 5.1 151,453 177,996
o.w. containing > 85% ofsynthetic 4 5 35.6 20.327 18.195 - 10.5 556,904 367,566
o.w. containing < 85% ofsynthetic
0 0 193.3 4.172 4.100 - 1.7 2,781,080 931,823

8/13/2019 Euratex nr 2
http://slidepdf.com/reader/full/euratex-nr-2 146/214
BULLETIN 2013/2
146
EU27 (External Trade) Textile and Clothing Trade 2011 - 2012 (continued)Country :
RussiaIMPORTS EXPORTS Coverage E/I
Unit : 1000 € 2011 2012 Evol. % 2011 2012 Evol. % 2011 2012
o.w. containing < 85% syn-thetic mixed natural fibres
0 6 9.297 11.311 21.7 175,908
o.w. other synthetics 26 15 - 41.4 10.616 13.610 28.2 40,243 88,033
o.w. artificial staple fibres 6 5 - 15.0 10.763 10.794 0.3 172,203 203,271
Special woven fabrics 193 252 30.8 44.124 45.234 2.5 22,864 17,917
o.w. pile fabrics 2 7 288.4 15.044 11.673 - 22.4 831,176 166,052
o.w. narrow woven fabrics 109 87 - 20.4 11.113 12.010 8.1 10,204 13,855
o.w. labels, badges 60 111 84.5 991 1.468 48.2 1,652 1,327
o.w. embroidery 6 2 - 75.0 3.433 3.967 15.6 57,12 264,492
Knitted fabrics 98 48 - 51.6 40.937 46.716 14.1 41,636 98,144
Pile fabrics 2 4 56.2 6.339 7.672 21.0 254,564 197,215
< 30 cm; w 5% or moreelastome
1 1 - 49.1 635 804 26.7 58,783 146,207
> 30 cm; w 5% or moreelastome
0 3 672.1 8.227 8.867 7.8 1,913,165 267,087
Curtain fabrics and raschellace
20 25 25.0 8.284 9.079 9.6 40,648 35,634
Other fabrics 74 14 - 80.6 17.452 20.294 16.3 23,604 141,322
Carpets 161 291 80.0 96.621 104.709 8.4 59,868 36,041
Knotted carpets 78 128 63.5 2.742 3.230 17.8 3,51 2,529
Woven carpets 18 12 - 32.0 21.955 21.099 - 3.9 123,828 175,096
Tufted carpets 52 45 - 14.5 52.110 63.615 22.1 99,885 142,539
Carpets of felt 1 1 11.8 12.976 8.524 - 34.3 1,395,249 819,583
Other textiles 42.379 36.848 - 13.1 535.204 645.013 20.5 1,263 1,75
Wadding, felt, nonwovens,rubber thread, twine, cor-dage, etc.
12.928 5.898 - 54.4 201.991 241.922 19.8 1,562 4,101
o.w. felt 46 50 7.6 9.139 9.830 7.6 19,802 19,803o.w. nonwovens 4.317 2.647 - 38.7 96.555 116.570 20.7 2,237 4,404
o.w. special yarn 0 15 5.255 5.830 10.9 38,709
o.w. twine, rope 969 602 - 37.9 6.701 8.393 25.2 692 1,394
o.w. nets 313 339 8.6 5.087 5.697 12.0 1,627 1,678
Handwoven tapestries &quilted products
0 9 29133.3 1.177 1.029 - 12.5 3,922,000 11,739
Impregnated, coated, etc,,textile fabrics
2.835 2.305 - 18.7 152.651 167.544 9.8 5,384 7,267
o.w. tyre cord fabric 434 79 - 81.9 18.893 19.547 3.5 4,349 24,854
o.w. fabrics impregnated,coated etc,
112 66 - 41.1 51.786 64.480 24.5 46,296 97,919
o.w. textile products, articlesfor technical uses
2.077 1.990 - 4.2 55.134 55.176 0.1 2,654 2,772
Other made up textilearticles 2.616 3.946 50.8 136.622 182.545 33.6 5,223 4,627
o.w. sacks and bags 802 1.845 130.0 6.852 5.725 - 16.4 854 310
o.w. tarpaulins, sunblinds& alike
50 113 128.2 10.529 30.005 185.0 21,189 26,459
o.w. other : floorcloths,dishcloths etc
1.250 1.547 23.7 27.872 35.860 28.7 2,229 2,318
Worn clothing and otherworn articles
262 161 - 38.5 89.178 109.105 22.3 33,992 67,578
Home textiles 7.202 7.112 - 1.3 57.207 65.705 14.9 794 924
Bedlinen, table, toilet andkitchen linen
3.971 3.071 - 22.7 26.715 32.484 21.6 673 1,058
o.w. Bedlinen, woven 136 115 - 15.3 12.496 13.933 11.5 9,222 12,143
o.w. toilet linen 1.338 1.275 - 4.7 9.736 12.879 32.3 728 1,01
o.w. table linen, woven 2.497 1.680 - 32.7 3.101 3.560 14.8 124 212
Curtains 3.202 3.979 24.3 18.412 16.650 - 9.6 575 418
Other furnishing articles 23 20 - 14.6 5.536 8.424 52.2 24,04 42,827
Garments 15.121 18.315 21.1 2.731.416 3.017.122 10.5 18,064 16,474

8/13/2019 Euratex nr 2
http://slidepdf.com/reader/full/euratex-nr-2 147/214
BULLETIN 2013/2
147
EU27 (External Trade) Textile and Clothing Trade 2011 - 2012 (continued)Country :
RussiaIMPORTS EXPORTS Coverage E/I
Unit : 1000 € 2011 2012 Evol. % 2011 2012 Evol. % 2011 2012
Occupationals (woven) 6.404 6.674 4.2 8.565 10.177 18.8 134 152
Men’s ensembles 11 9 - 17.9 497 352 - 29.1 4,586 3,962
Men’s jackets 626 769 22.8 1.216 1.641 35.0 194 213
Men’s trousers 3.721 3.861 3.8 1.156 1.952 68.8 31 51
Men’s overalls 381 336 - 11.8 1.114 1.239 11.2 293 369
Other men’s occupationals 1.210 758 - 37.4 2.161 2.243 3.8 179 296
Women’s ensembles 12 1 - 90.6 182 124 - 31.9 1,469 10,676
Women’s jackets 35 54 55.4 440 367 - 16.6 1,256 674
Women’s trousers 237 529 123.1 933 1.139 22.1 394 216
Women’s overalls 0 0 43 41 - 5.7
Other women’s occupation-nals
170 358 109.8 823 1.077 30.9 483 301
Men’s Clothing (knitted and
woven)8.377 8.742 4.4 500.005 563.604 12.7 5,969 6,447
Overcoats 1.683 1.239 - 26.4 95.823 106.897 11.6 5,692 8,626
o.w. woven 1.682 1.220 - 27.5 88.198 99.504 12.8 5,243 8,156
Suits 128 297 131.4 77.332 54.031 - 30.1 60,326 18,213
o.w. woven 128 297 131.9 76.360 52.728 - 30.9 59,68 17,773
Ensembles 48 107 124.8 23.195 29.021 25.1 48,647 27,074
o.w. woven 39 52 32.8 22.123 26.100 18.0 56,279 49,991
Jackets and blazers 769 1.048 36.3 32.088 45.317 41.2 4,173 4,324
o.w. woven 645 958 48.5 29.665 41.145 38.7 4,601 4,297
Trousers 4.314 4.609 6.8 163.001 196.139 20.3 3,778 4,255
o.w. woven 4.311 4.444 3.1 151.199 177.492 17.4 3,507 3,994
Shirts 201 364 81.1 74.366 92.456 24.3 36,991 25,393
o.w. woven 193 340 76.0 59.429 72.940 22.7 30,782 21,471
Underpants, briefs, etc. 17 32 86.7 22.064 26.172 18.6 129,41 82,224o.w. knitted 5 3 - 36.1 18.878 22.837 21.0 395,76 748,75
Swimwear 3 12 252.1 4.409 5.035 14.2 131,216 42,558
Tracksuits 2 128 8320.4 5.099 5.457 7.0 335,457 4,264
Women’s Clothing (knittedand woven)
4.790 7.010 46.3 1.281.285 1.474.891 15.1 26,748 21,04
Overcoats 1.323 1.858 40.4 141.412 161.635 14.3 10,691 8,701
o.w. woven 1.312 1.813 38.3 127.946 147.990 15.7 9,755 8,161
Suits 9 12 30.2 32.824 37.278 13.6 363,898 317,534
o.w. woven 8 10 14.5 26.819 34.108 27.2 319,278 354,551
Ensembles 34 49 44.4 199.207 207.887 4.4 587,111 424,347
o.w. woven 32 49 53.7 197.091 205.409 4.2 622,719 422,131
Jackets 226 344 52.5 56.507 76.760 35.8 25,055 22,318
o.w. woven 177 302 70.8 45.288 62.332 37.6 25,627 20,646
Skirts and dresses 725 1.391 91.8 295.002 360.517 22.2 40,68 25,926
o.w. woven 638 1.098 72.0 215.746 256.707 19.0 33,804 23,385
Trousers 1.487 1.875 26.1 207.347 229.289 10.6 13,943 12,227
o.w. woven 1.225 1.584 29.4 175.342 190.887 8.9 14,319 12,05
Blouses 90 304 237.2 103.306 120.434 16.6 114,53 39,602
o.w. woven 82 276 235.4 71.587 85.197 19.0 86,92 30,838
Slips, petticoats, etc. 18 29 60.1 69.577 81.182 16.7 384,831 280,421
o.w. knitted 8 10 29.9 50.051 64.256 28.4 623,297 616,069
Swimwear 6 17 165.5 34.072 35.798 5.1 529,891 209,713
Tracksuits 567 641 13.1 29.770 43.870 47.4 5,25 6,839
Others (knitted and woven) 1.954 2.562 31.2 949.894 978.139 3.0 48,622 38,173
Babies’ garments 4 11 192.9 58.479 65.289 11.6 1,534,877 585,03
o.w. knitted or crocheted 1 3 199.1 33.113 39.140 18.2 2,904,614 1,147,807
T-shirts 572 584 2.1 154.970 173.229 11.8 27,116 29,687
Jerseys, pullovers, cardigans 176 408 131.6 253.996 287.956 13.4 144,25 70,607

8/13/2019 Euratex nr 2
http://slidepdf.com/reader/full/euratex-nr-2 148/214
BULLETIN 2013/2
148
EU27 (External Trade) Textile and Clothing Trade 2011 - 2012 (continued)Country :
RussiaIMPORTS EXPORTS Coverage E/I
Unit : 1000 € 2011 2012 Evol. % 2011 2012 Evol. % 2011 2012
Special garments 114 105 - 7.4 77.087 62.976 - 18.3 67,715 59,721
o.w. woven 114 105 - 7.6 74.181 58.484 - 21.2 65,163 55,619
Other garments, knitted orcrocheted
401 142 - 64.6 52.368 49.372 - 5.7 13,066 34,774
Gloves 8 8 2.1 11.958 13.361 11.7 145,126 158,87
Ties, bow ties, and cravats 10 28 179.4 8.514 9.466 11.2 86,176 34,298
Shawls, scarves, mufflers,mantillas, etc
207 165 - 20.3 33.966 36.889 8.6 16,414 22,382
Pantyhose, tights, stockings,socks, etc
20 621 2995.9 202.567 168.267 - 16.9 1,009,807 27,094
Brassières, girdles, corsets,etc,
37 69 86.9 82.756 93.855 13.4 224,575 136,239
Other accessories 401 432 7.9 9.832 13.217 34.4 2,454 3,058
TOTAL Chapter 61 Knitted
Garments 1.821 2.895 59.0 1.041.546 1.134.664 8.9 57203 39193
TOTAL Chapter 62 WovenGarments
13.300 15.420 15.9 1.689.903 1.881.049 11.3 12706 12199
Total Clothing 15.163 18.315 20.8 2.731.450 3.015.713 10.4 18014 16466
Total Textile 82.804 67.150 - 18.9 1.127.743 1.291.898 14.6 1362 1924
Total 97.967 85.465 - 12.8 3.859.193 4.307.611 11.6 3939 5040

8/13/2019 Euratex nr 2
http://slidepdf.com/reader/full/euratex-nr-2 149/214
BULLETIN 2013/2
149
EU27 (External Trade) Textile and Clothing Trade 2011 - 2012Country :
SerbiaIMPORTS EXPORTS Coverage E/I
Unit : 1000 € 2011 2012 Evol. % 2011 2012 Evol. % 2011 2012
Natural fibers 3.718 1.943 - 47.7 1.698 1.299 - 23.5 46 67
Silk 0 0 0 1
Wool, fine or coarse animalhair
3.653 1.906 - 47.8 364 409 12.4 10 21
o.w. wool, not carded orcombed
3.636 1.882 - 48.3 325 347 6.6 9 18
o.w. wool and fine or coarseanimal hair
7 2 - 75.4 3 31 843.4 45 1,721
Cotton 65 36 - 44.1 1.320 870 - 34.1 2,029 2,393
Other vegetable fibres 0 1 13 19 41.0 2,047
o.w. flax 0 0 8 10 21.6
Man-made fibres 278 342 23.1 5.295 13.406 153.2 1,906 3,921
Synthetic filament tow 13 8 - 40.8 28 17 - 40.6 219 219
Artificial filament tow 0 3 4.012 12.512 211.9 417,072Synthetic staple fibres 218 285 30.9 842 783 - 7.0 387 275
Artificial staple fibres 0 0 353 73 - 79.4
Yarns and Threads 5.689 6.033 6.0 59.903 62.060 3.6 1,053 1,029
Silk 0 3 15 11 - 27.3 352
Wool 73 110 51.9 2.111 4.593 117.5 2,91 4,168
o.w. carded wool, n.p.r.s. 44 38 - 14.8 1.170 3.049 160.7 2,653 8,117
o.w. combed wool, n.p.r.s. 27 73 168.7 660 1.201 81.8 2,443 1,653
Cotton 1.133 1.432 26.5 2.737 3.378 23.4 242 236
o.w. cotton yarn, n.p.r.s. 101 154 52.3 2.541 3.250 27.9 2,512 2,109
o.w. cotton yarn, p.r.s. 1.031 1.278 23.9 196 127 - 35.0 19 10
Other - Vegetable yarns 24 2 - 90.8 163 264 62.2 690 12,118
Man-made filaments yarns 4.306 4.342 0.8 49.780 48.318 - 2.9 1,156 1,113
o.w. sewing thread 6 6 9.6 2.395 2.608 8.9 42,763 42,478o.w. synthetic filament yarn 4.284 4.302 0.4 41.850 41.826 - 0.1 977 972
o.w. artificial filament yarn 1 2 70.8 136 154 13.1 12,832 8,502
o.w. synthetic monofilament 15 29 89.8 5.308 3.709 - 30.1 34,627 12,747
Man made staple yarns 155 143 - 7.7 5.096 5.497 7.9 3,287 3,841
o.w. man made staple yarns,n.p.r.s.
122 115 - 5.9 4.243 4.674 10.2 3,471 4,064
o.w. man made staple yarns,p.r.s.
33 28 - 14.4 854 823 - 3.6 2,601 2,928
Woven fabrics 1.524 4.420 190.1 66.773 69.082 3.5 4,382 1,563
Silk 0 10 2.173 2.438 12.2 24,257
Wool 61 80 31.5 7.594 6.858 - 9.7 12,41 8,523
o.w. carded wool 17 69 296.7 2.734 3.024 10.6 15,693 4,377
o.w. combed wool 44 11 - 74.0 4.860 3.827 - 21.3 11,104 33,69
Cotton 322 1.428 344.0 19.662 18.091 - 8.0 6,111 1,266
o.w. cotton, unbleached 9 0 - 100.0 989 1.090 10.2 11,555
o.w. cotton, dyed 95 48 - 49.7 5.561 4.937 - 11.2 5,836 10,305
o.w. denim fabric 0 0 2.424 1.930 - 20.4
Other fabrics 0 2 2127.3 1.496 1.026 - 31.4 1,359,836 41,867
o.w. flax 0 2 2063.6 1.481 961 - 35.1 1,346,655 40,392
Synthetic and artificial fila-ment yarn
507 885 74.7 17.536 17.159 - 2.1 3,462 1,939
o.w. synthetic filament yarn 464 826 78.1 13.294 13.874 4.4 2,865 1,679
o.w. artificial filament yarn 42 58 37.7 4.242 3.285 - 22.5 9,992 5,619
Synthetic and artificialsstaple fibres
418 1.711 309.4 10.006 11.082 10.8 2,394 648
o.w. containing > 85% ofsynthetic
42 36 - 15.1 1.892 2.604 37.7 4,469 7,245
o.w. containing < 85% ofsynthetic
4 0 - 100.0 809 717 - 11.5 19,176

8/13/2019 Euratex nr 2
http://slidepdf.com/reader/full/euratex-nr-2 150/214
BULLETIN 2013/2
150
EU27 (External Trade) Textile and Clothing Trade 2011 - 2012 (continued)Country :
SerbiaIMPORTS EXPORTS Coverage E/I
Unit : 1000 € 2011 2012 Evol. % 2011 2012 Evol. % 2011 2012
o.w. containing < 85% syn-thetic mixed natural fibres
1 753 2.860 3.068 7.2 407
o.w. other synthetics 17 36 105.3 2.799 2.797 - 0.1 16,19 7,879
o.w. artificial staple fibres 353 887 151.1 1.646 1.897 15.3 466 214
Special woven fabrics 216 302 39.8 8.261 12.361 49.6 3,823 4,091
o.w. pile fabrics 34 121 259.2 928 886 - 4.5 2,754 732
o.w. narrow woven fabrics 90 88 - 1.9 3.656 4.530 23.9 4,055 5,122
o.w. labels, badges 50 45 - 8.7 1.423 1.257 - 11.6 2,861 2,771
o.w. embroidery 10 13 29.1 517 501 - 3.2 5,105 3,827
Knitted fabrics 2.244 2.391 6.6 13.177 13.169 - 0.1 587 551
Pile fabrics 1.832 2.075 13.2 868 818 - 5.7 47 39
< 30 cm; w 5% or moreelastome
96 86 - 10.9 492 212 - 56.9 511 247
> 30 cm; w 5% or moreelastome
184 68 - 63.2 3.932 2.812 - 28.5 2,143 4,161
Curtain fabrics and raschellace
5 42 768.9 2.029 3.499 72.5 41,835 8,304
Other fabrics 127 121 - 4.9 5.856 5.827 - 0.5 4,609 4,822
Carpets 2.381 2.625 10.3 7.260 7.304 0.6 305 278
Knotted carpets 0 20 7192.9 173 206 18.9 61,882 1,009
Woven carpets 924 777 - 15.9 2.762 2.573 - 6.8 299 331
Tufted carpets 1.315 1.629 24.0 2.971 3.665 23.4 226 225
Carpets of felt 136 183 34.7 898 512 - 43.0 659 279
Other textiles 35.618 40.716 14.3 71.215 78.831 10.7 200 194
Wadding, felt, nonwovens,rubber thread, twine, cor-dage, etc.
13.358 15.441 15.6 23.441 33.288 42.0 175 216
o.w. felt 707 896 26.8 631 989 56.8 89 110o.w. nonwovens 74 92 23.2 10.712 11.756 9.7 14,403 12,832
o.w. special yarn 7.966 8.704 9.3 4.631 12.845 177.4 58 148
o.w. twine, rope 4.022 5.474 36.1 972 913 - 6.1 24 17
o.w. nets 242 77 - 68.2 323 373 15.5 133 483
Handwoven tapestries &quilted products
8 2 - 68.2 491 215 - 56.2 6,532 8,985
Impregnated, coated, etc,,textile fabrics
8.002 9.023 12.8 32.302 30.904 - 4.3 404 343
o.w. tyre cord fabric 10 92 827.6 1.385 2.865 106.8 13,935 3,107
o.w. fabrics impregnated,coated etc,
366 553 51.1 22.805 20.601 - 9.7 6,23 3,724
o.w. textile products, articlesfor technical uses
461 470 2.0 5.266 4.452 - 15.4 1,143 948
Other made up textilearticles 13.577 15.630 15.1 6.011 6.726 11.9 44 43
o.w. sacks and bags 12.511 12.129 - 3.1 1.535 1.887 22.9 12 16
o.w. tarpaulins, sunblinds& alike
142 107 - 24.7 407 555 36.3 287 520
o.w. other : floorcloths,dishcloths etc
804 3.204 298.5 2.272 2.657 17.0 283 83
Worn clothing and otherworn articles
118 191 61.1 1.704 1.602 - 6.0 1,439 839
Home textiles 771 1.144 48.4 3.813 5.210 36.6 495 456
Bedlinen, table, toilet andkitchen linen
486 773 59.0 2.085 3.387 62.4 429 438
o.w. Bedlinen, woven 398 631 58.7 688 1.676 143.4 173 265
o.w. toilet linen 70 134 93.3 1.046 1.256 20.1 1,504 934
o.w. table linen, woven 18 1 - 93.5 132 231 74.7 753 20,288
Curtains 53 133 147.9 702 548 - 21.9 1,312 413
Other furnishing articles 211 203 - 3.8 246 447 81.5 117 220
Garments 272.898 273.889 0.4 185.140 187.548 1.3 68 68

8/13/2019 Euratex nr 2
http://slidepdf.com/reader/full/euratex-nr-2 151/214
BULLETIN 2013/2
151
EU27 (External Trade) Textile and Clothing Trade 2011 - 2012 (continued)Country :
SerbiaIMPORTS EXPORTS Coverage E/I
Unit : 1000 € 2011 2012 Evol. % 2011 2012 Evol. % 2011 2012
Occupationals (woven) 8.096 8.072 - 0.3 1.100 1.219 10.8 14 15
Men’s ensembles 18 28 56.7 81 92 14.0 449 327
Men’s jackets 1.620 1.485 - 8.3 406 376 - 7.2 25 25
Men’s trousers 1.368 1.606 17.4 147 231 57.5 11 14
Men’s overalls 225 426 89.3 265 258 - 2.8 118 61
Other men’s occupationals 335 327 - 2.6 136 176 29.4 40 54
Women’s ensembles 0 0 - 100.0 5 2 - 55.3 1,389
Women’s jackets 101 85 - 15.6 3 13 360.4 3 15
Women’s trousers 54 54 1.1 13 17 34.6 24 31
Women’s overalls 177 277 57.0 1 0 - 98.1 0 0
Other women’s occupation-nals
4.198 3.783 - 9.9 45 54 19.7 1 1
Men’s Clothing (knitted and
woven)32.357 33.271 2.8 26.524 31.586 19.1 82 95
Overcoats 4.281 3.401 - 20.5 5.377 4.250 - 21.0 126 125
o.w. woven 3.980 3.262 - 18.0 3.740 3.790 1.3 94 116
Suits 2.517 2.119 - 15.8 1.295 1.323 2.2 51 62
o.w. woven 2.499 2.119 - 15.2 1.253 1.294 3.2 50 61
Ensembles 201 51 - 74.6 221 241 8.8 110 471
o.w. woven 193 50 - 74.3 134 207 54.3 69 416
Jackets and blazers 10.541 11.899 12.9 3.578 4.008 12.0 34 34
o.w. woven 10.528 11.743 11.5 3.492 3.878 11.1 33 33
Trousers 5.734 6.760 17.9 7.961 10.517 32.1 139 156
o.w. woven 5.703 6.709 17.6 7.377 9.863 33.7 129 147
Shirts 5.047 4.394 - 12.9 4.079 7.144 75.2 81 163
o.w. woven 3.745 2.669 - 28.7 2.740 5.160 88.3 73 193
Underpants, briefs, etc. 3.333 3.600 8.0 2.084 1.900 - 8.8 63 53o.w. knitted 3.244 3.580 10.3 1.694 1.669 - 1.5 52 47
Swimwear 192 554 188.2 528 574 8.8 275 104
Tracksuits 119 113 - 4.4 964 1.146 18.9 813 1,011
Women’s Clothing (knittedand woven)
57.055 63.886 12.0 45.538 44.325 - 2.7 80 69
Overcoats 9.625 6.142 - 36.2 5.496 5.436 - 1.1 57 89
o.w. woven 9.339 5.699 - 39.0 4.560 4.589 0.7 49 81
Suits 41 0 - 99.2 2.171 1.151 - 47.0 5,329 338,594
o.w. woven 35 0 - 99.0 2.079 1.136 - 45.4 5,942 334,162
Ensembles 355 593 67.0 8.483 5.976 - 29.6 2,389 1,008
o.w. woven 337 407 20.7 8.387 5.914 - 29.5 2,49 1,454
Jackets 6.228 7.713 23.8 1.643 2.114 28.7 26 27
o.w. woven 4.847 5.864 21.0 1.378 1.793 30.1 28 31
Skirts and dresses 8.840 14.242 61.1 6.295 7.423 17.9 71 52
o.w. woven 7.838 10.786 37.6 4.039 4.514 11.8 52 42
Trousers 8.332 7.595 - 8.9 7.635 7.756 1.6 92 102
o.w. woven 5.351 3.880 - 27.5 5.511 5.962 8.2 103 154
Blouses 5.931 6.135 3.5 3.823 3.838 0.4 64 63
o.w. woven 5.438 5.659 4.1 2.466 2.613 5.9 45 46
Slips, petticoats, etc. 10.436 12.534 20.1 4.976 4.343 - 12.7 48 35
o.w. knitted 9.968 11.901 19.4 4.624 4.004 - 13.4 46 34
Swimwear 2.048 2.800 36.7 1.859 2.605 40.1 91 93
Tracksuits 910 2.200 141.7 579 844 45.8 64 38
Others (knitted and woven) 183.487 176.731 - 3.7 113.060 111.628 - 1.3 62 63
Babies’ garments 389 400 2.8 2.805 2.845 1.4 722 712
o.w. knitted or crocheted 281 379 35.3 2.191 2.206 0.7 781 581
T-shirts 12.237 9.772 - 20.1 15.603 17.801 14.1 128 182
Jerseys, pullovers, cardigans 11.064 13.994 26.5 9.255 13.361 44.4 84 95

8/13/2019 Euratex nr 2
http://slidepdf.com/reader/full/euratex-nr-2 152/214
BULLETIN 2013/2
152
EU27 (External Trade) Textile and Clothing Trade 2011 - 2012 (continued)Country :
SerbiaIMPORTS EXPORTS Coverage E/I
Unit : 1000 € 2011 2012 Evol. % 2011 2012 Evol. % 2011 2012
Special garments 3.104 2.233 - 28.1 2.608 2.590 - 0.7 84 116
o.w. woven 3.029 2.137 - 29.5 2.528 2.554 1.0 83 120
Other garments, knitted orcrocheted
65 85 30.4 2.618 1.330 - 49.2 4,031 1,571
Gloves 106 81 - 23.8 659 786 19.2 623 974
Ties, bow ties, and cravats 1.749 1.461 - 16.5 1.739 1.380 - 20.6 99 94
Shawls, scarves, mufflers,mantillas, etc
6.756 6.733 - 0.3 1.284 1.084 - 15.6 19 16
Pantyhose, tights, stockings,socks, etc
135.625 124.511 - 8.2 41.316 38.379 - 7.1 30 31
Brassières, girdles, corsets,etc,
11.694 16.885 44.4 9.322 12.363 32.6 80 73
Other accessories 675 574 - 14.9 25.292 18.814 - 25.6 3,747 3,276
TOTAL Chapter 61 Knitted
Garments 183.286 180.521 - 1.5 110.391 108.971 - 1.3 60 60
TOTAL Chapter 62 WovenGarments
89.612 93.368 4.2 74.815 78.587 5.0 83 84
Total Clothing 272.898 273.889 0.4 185.206 187.558 1.3 68 68
Total Textile 52.223 59.614 14.2 234.478 252.407 7.6 449 423
Total 325.121 333.503 2.6 419.683 439.965 4.8 129 132

8/13/2019 Euratex nr 2
http://slidepdf.com/reader/full/euratex-nr-2 153/214
BULLETIN 2013/2
153
EU27 (External Trade) Textile and Clothing Trade 2011 - 2012Country :
SingaporeIMPORTS EXPORTS Coverage E/I
Unit : 1000 € 2011 2012 Evol. % 2011 2012 Evol. % 2011 2012
Natural fibers 0 0 55 67 21.5 66,7
Silk 0 0 4 33 778.4 111,267
Wool, fine or coarse animalhair
0 0 32 28 - 13.1 39,686
o.w. wool, not carded orcombed
0 0 0 0
o.w. wool and fine or coarseanimal hair
0 0 19 28 47.9 39,586
Cotton 0 0 14 2 - 83.6
Other vegetable fibres 0 0 5 3 - 33.4
o.w. flax 0 0 2 1 - 51.5
Man-made fibres 0 0 - 28.3 293 687 134.4 63,704 208,185
Synthetic filament tow 0 0 - 78.6 2 0 - 96.1 1,479 267
Artificial filament tow 0 0 22 0 - 100.0 0Synthetic staple fibres 0 0 219 686 213.0 623,318
Yarns and Threads 553 1.377 149.0 4.958 3.239 - 34.7 897 235
Silk 0 0 5 22 341.5 6,816
Wool 0 50 41658.3 402 454 13.0 335,133 907
o.w. carded wool, n.p.r.s. 0 0 163 126 - 23.1
o.w. combed wool, n.p.r.s. 0 0 168 170 1.2
Cotton 30 140 364.0 3.043 2.130 - 30.0 10,081 1,521
o.w. cotton yarn, n.p.r.s. 0 140 128 178 39.4 127
o.w. cotton yarn, p.r.s. 30 0 - 99.9 2.916 1.952 - 33.0 9,658
Other - Vegetable yarns 0 0 28 22 - 23.8 43,12
Man-made filaments yarns 522 1.043 99.7 1.336 530 - 60.3 256 51
o.w. sewing thread 30 17 - 44.9 354 211 - 40.5 1,168 1,262
o.w. synthetic filament yarn 492 1.012 105.7 858 230 - 73.2 174 23o.w. artificial filament yarn 0 0 1 0 - 100.0
o.w. synthetic monofilament 0 15 86 52 - 39.3 354
Man made staple yarns 0 143 142 81 - 43.1 109,546 57
o.w. man made staple yarns,n.p.r.s.
0 143 92 7 - 92.6 5
o.w. man made staple yarns,p.r.s.
0 0 30.8 51 74 46.6 38,938 43,647
Woven fabrics 590 634 7.4 25.128 27.586 9.8 4,258 4,351
Silk 7 6 - 14.4 2.475 1.265 - 48.9 36,075 21,553
Wool 48 98 105.5 4.737 7.399 56.2 9,888 7,515
o.w. carded wool 0 3 1.164 1.402 20.5 42,109
o.w. combed wool 48 95 98.5 3.571 5.962 67.0 7,453 6,268
Cotton 90 145 61.5 3.441 3.491 1.4 3,84 2,412
o.w. cotton, unbleached 0 1 74 89 20.1 6,31
o.w. cotton, dyed 16 57 267.2 314 368 17.0 2,015 642
o.w. denim fabric 0 0 0 6 1812.9
Other fabrics 8 1 - 93.1 387 433 11.9 4,946 80,25
o.w. flax 8 1 - 93.1 354 336 - 5.1 4,519 62,196
Synthetic and artificial fila-ment yarn
63 109 71.6 2.345 2.608 11.2 3,706 2,401
o.w. synthetic filament yarn 55 99 79.2 1.807 2.157 19.4 3,277 2,183
o.w. artificial filament yarn 8 10 20.2 538 450 - 16.3 6,618 4,608
Synthetic and artificialsstaple fibres
170 145 - 14.4 2.983 3.374 13.1 1,76 2,324
o.w. containing > 85% ofsynthetic
66 9 - 86.2 2.129 2.090 - 1.8 3,25 23,175
o.w. containing < 85% of
synthetic0 0 53 10 - 80.4
o.w. containing < 85% syn-thetic mixed natural fibres
0 0 40 68 70.4

8/13/2019 Euratex nr 2
http://slidepdf.com/reader/full/euratex-nr-2 154/214
BULLETIN 2013/2
154
EU27 (External Trade) Textile and Clothing Trade 2011 - 2012 (continued)Country :
SingaporeIMPORTS EXPORTS Coverage E/I
Unit : 1000 € 2011 2012 Evol. % 2011 2012 Evol. % 2011 2012
o.w. other synthetics 102 128 25.2 285 400 40.4 279 313
o.w. artificial staple fibres 2 8 375.4 476 805 69.3 27,825 9,906
Special woven fabrics 205 128 - 37.4 8.758 9.013 2.9 4,271 7,027
o.w. pile fabrics 16 3 - 78.6 1.204 1.382 14.8 7,393 39,597
o.w. narrow woven fabrics 89 58 - 34.9 903 1.292 43.0 1,018 2,235
o.w. labels, badges 31 8 - 75.5 101 180 77.6 324 2,344
o.w. embroidery 67 51 - 24.4 489 885 81.0 730 1,749
Knitted fabrics 2 9 499.3 928 871 - 6.1 61,436 9,625
Pile fabrics 0 0 142 118 - 16.7 236,02
< 30 cm; w 5% or moreelastome
0 0 18 13 - 29.4
> 30 cm; w 5% or moreelastome
1 0 - 100.0 270 357 32.5 20,287
Curtain fabrics and raschellace
0 9 4888.9 166 189 14.0 92,044 2,103
Other fabrics 0 0 332 194 - 41.7 968,8
Carpets 278 84 - 69.8 8.129 14.245 75.2 2,923 16,965
Knotted carpets 9 29 225.0 417 3.861 826.2 4,648 13,247
Woven carpets 80 1 - 98.8 2.735 2.939 7.5 3,425 309,347
Tufted carpets 77 11 - 85.4 3.426 5.335 55.7 4,46 47,42
Carpets of felt 3 0 - 97.5 1.101 1.624 47.5 39,465 2,319,586
Other textiles 2.865 2.247 - 21.6 61.943 65.096 5.1 2,162 2,897
Wadding, felt, nonwovens,rubber thread, twine, cor-dage, etc.
179 255 42.7 23.973 20.266 - 15.5 13,423 7,952
o.w. felt 91 102 11.8 13.400 6.786 - 49.4 14,738 6,677
o.w. nonwovens 42 29 - 30.8 5.292 6.886 30.1 12,588 23,654
o.w. special yarn 3 6 86.1 85 90 6.2 2,56 1,46
o.w. twine, rope 22 34 54.0 3.710 5.099 37.4 16,855 15,044
o.w. nets 1 61 3999.3 503 370 - 26.5 34,002 610
Handwoven tapestries &quilted products
0 0 9 272 2911.7 79,988
Impregnated, coated, etc,,textile fabrics
266 414 55.4 27.059 32.031 18.4 10,159 7,739
o.w. tyre cord fabric 0 0 - 100.0 3 14 350.7 3,04
o.w. fabrics impregnated,coated etc,
6 34 500.2 5.361 6.023 12.3 93,721 17,544
o.w. textile products, articlesfor technical uses
199 265 32.9 11.415 17.458 52.9 5,722 6,583
Other made up textilearticles
2.391 374 - 84.4 5.870 6.101 3.9 245 1,63
o.w. sacks and bags 27 24 - 11.8 559 770 37.7 2,048 3,196o.w. tarpaulins, sunblinds& alike
17 69 307.1 666 530 - 20.5 3,927 767
o.w. other : floorcloths,dishcloths etc
2.319 251 - 89.2 3.926 4.039 2.9 169 1,61
Worn clothing and otherworn articles
27 29 6.0 537 717 33.5 1,974 2,486
Home textiles 123 327 165.4 2.695 4.013 48.9 2,189 1,228
Bedlinen, table, toilet andkitchen linen
27 284 967.8 1.343 2.012 49.8 5,048 708
o.w. Bedlinen, woven 10 131 1218.2 537 1.035 92.5 5,418 791
o.w. toilet linen 8 127 1413.0 479 692 44.5 5,705 545
o.w. table linen, woven 8 11 45.5 214 214 - 0.0 2,783 1,912
Curtains 32 5 - 85.6 749 1.409 88.1 2,364 30,895
Other furnishing articles 33 10 - 70.7 280 355 26.5 842 3,634
Garments 8.601 9.168 6.6 154.806 167.966 8.5 1,8 1,832
Occupationals (woven) 22 28 26.0 2.817 1.976 - 29.8 12,832 7,144
Men’s ensembles 1 1 - 14.5 405 416 2.7 27,908 33,518

8/13/2019 Euratex nr 2
http://slidepdf.com/reader/full/euratex-nr-2 155/214
BULLETIN 2013/2
155
EU27 (External Trade) Textile and Clothing Trade 2011 - 2012 (continued)Country :
SingaporeIMPORTS EXPORTS Coverage E/I
Unit : 1000 € 2011 2012 Evol. % 2011 2012 Evol. % 2011 2012
Men’s jackets 1 10 1821.2 123 145 17.4 23,729 1,45
Men’s trousers 0 0 - 100.0 111 248 122.6 111,38
Men’s overalls 0 0 403 130 - 67.7
Other men’s occupationals 9 15 73.4 1.546 767 - 50.4 17,545 5,017
Women’s ensembles 0 0 71 13 - 81.8
Women’s jackets 4 0 - 95.3 46 60 29.2 1,081 29,8
Women’s trousers 1 0 - 80.2 30 86 188.6 3,455 50,435
Women’s overalls 0 0 13 9 - 34.9
Other women’s occupation-nals
6 1 - 86.9 69 104 50.6 1,167 13,377
Men’s Clothing (knitted andwoven)
1.363 1.427 4.7 31.009 39.491 27.4 2,276 2,768
Overcoats 387 407 5.2 2.710 5.768 112.9 701 1,418
o.w. woven 371 366 - 1.3 2.320 5.484 136.4 625 1,497Suits 61 79 28.8 2.668 3.891 45.8 4,341 4,915
o.w. woven 60 74 22.5 2.604 3.833 47.2 4,325 5,196
Ensembles 11 23 101.3 1.013 1.139 12.4 9,006 5,029
o.w. woven 10 18 77.4 995 1.100 10.5 9,688 6,037
Jackets and blazers 195 106 - 45.5 2.434 3.818 56.8 1,251 3,598
o.w. woven 173 96 - 44.7 2.281 3.420 49.9 1,32 3,579
Trousers 341 411 20.7 8.298 10.429 25.7 2,437 2,538
o.w. woven 239 357 49.8 7.977 9.904 24.2 3,343 2,771
Shirts 180 318 76.1 10.730 11.720 9.2 5,947 3,687
o.w. woven 121 257 111.5 8.228 9.223 12.1 6,776 3,592
Underpants, briefs, etc. 152 39 - 74.3 425 507 19.5 280 1,303
o.w. knitted 151 22 - 85.5 362 352 - 2.7 239 1,604
Swimwear 7 6 - 16.0 135 191 41.8 1,923 3,243Tracksuits 11 20 86.2 649 628 - 3.3 6,144 3,192
Women’s Clothing (knittedand woven)
3.761 4.239 12.7 63.152 70.690 11.9 1,679 1,668
Overcoats 708 462 - 34.8 3.192 2.991 - 6.3 451 648
o.w. woven 583 333 - 42.8 2.936 2.701 - 8.0 504 811
Suits 5 3 - 31.4 635 1.299 104.8 13,387 39,977
o.w. woven 3 3 0.8 565 1.065 88.7 21,226 39,75
Ensembles 92 35 - 62.0 1.958 1.749 - 10.7 2,132 5,018
o.w. woven 53 27 - 48.2 1.932 1.728 - 10.5 3,675 6,343
Jackets 128 54 - 57.9 3.602 3.852 6.9 2,824 7,164
o.w. woven 108 37 - 65.4 3.362 3.507 4.3 3,115 9,401
Skirts and dresses 918 1.044 13.7 18.501 21.743 17.5 2,015 2,082
o.w. woven 684 751 9.8 13.760 15.544 13.0 2,011 2,069
Trousers 1.485 2.007 35.2 10.442 9.384 - 10.1 703 467
o.w. woven 221 787 255.8 9.227 8.474 - 8.2 4,171 1,076
Blouses 228 254 11.4 10.603 11.665 10.0 4,642 4,586
o.w. woven 129 193 49.3 8.622 9.222 7.0 6,661 4,773
Slips, petticoats, etc. 18 138 668.8 1.057 1.050 - 0.7 5,893 761
o.w. knitted 8 116 1305.0 834 723 - 13.3 10,087 623
Swimwear 6 3 - 52.7 242 250 3.4 4,205 9,19
Tracksuits 74 51 - 30.7 3.686 3.617 - 1.9 4,965 7,031
Others (knitted and woven) 3.476 3.503 0.8 60.589 57.725 - 4.7 1,743 1,648
Babies’ garments 143 163 14.1 993 1.212 22.1 693 742
o.w. knitted or crocheted 68 72 6.1 673 856 27.1 997 1,195
T-shirts 1.098 995 - 9.4 15.400 14.897 - 3.3 1,403 1,498
Jerseys, pullovers, cardigans 1.348 543 - 59.7 7.650 9.098 18.9 568 1,675
Special garments 189 231 22.1 15.072 10.654 - 29.3 7,982 4,621
o.w. woven 179 199 10.8 14.482 10.035 - 30.7 8,079 5,055

8/13/2019 Euratex nr 2
http://slidepdf.com/reader/full/euratex-nr-2 156/214
BULLETIN 2013/2
156
EU27 (External Trade) Textile and Clothing Trade 2011 - 2012 (continued)Country :
SingaporeIMPORTS EXPORTS Coverage E/I
Unit : 1000 € 2011 2012 Evol. % 2011 2012 Evol. % 2011 2012
Other garments, knitted orcrocheted
363 332 - 8.5 7.490 6.001 - 19.9 2,065 1,807
Gloves 67 662 887.5 431 453 5.0 643 68
Ties, bow ties, and cravats 23 25 8.8 2.417 2.961 22.5 10,602 11,935
Shawls, scarves, mufflers,mantillas, etc
78 84 8.7 6.987 7.471 6.9 8,995 8,845
Pantyhose, tights, stockings,socks, etc
26 31 20.0 1.071 1.478 38.0 4,192 4,818
Brassières, girdles, corsets,etc,
118 365 207.9 1.088 1.200 10.3 918 329
Other accessories 19 40 111.4 2.030 2.220 9.3 10,736 5,553
TOTAL Chapter 61 KnittedGarments
5.134 4.257 - 17.1 47.337 49.707 5.0 922 1168
TOTAL Chapter 62 Woven
Garments3.467 4.911 41.7 107.524 118.121 9.9 3101 2405
Total Clothing 8.830 9.168 3.8 154.861 167.828 8.4 1754 1831
Total Textile 4.419 4.678 5.9 112.174 121.658 8.5 2539 2601
Total 13.248 13.846 4.5 267.034 289.485 8.4 2016 2091

8/13/2019 Euratex nr 2
http://slidepdf.com/reader/full/euratex-nr-2 157/214
BULLETIN 2013/2
157
EU27 (External Trade) Textile and Clothing Trade 2011 - 2012Country :
South AfricaIMPORTS EXPORTS Coverage E/I
Unit : 1000 € 2011 2012 Evol. % 2011 2012 Evol. % 2011 2012
Natural fibers 109.247 85.354 - 21.9 2.593 2.366 - 8.8 2 3
Silk 0 0 6 42 628.6
o.w. raw silk 0 0 2 0 - 100.0
Wool, fine or coarse animalhair
108.423 83.805 - 22.7 1.222 948 - 22.4 1 1
o.w. wool, not carded orcombed
70.463 54.543 - 22.6 641 469 - 26.9 1 1
o.w. wool and fine or coarseanimal hair
32.630 24.417 - 25.2 235 253 7.8 1 1
Cotton 824 1.549 88.1 188 401 113.2 23 26
Other vegetable fibres 0 0 1.177 975 - 17.2
o.w. flax 0 0 1.165 936 - 19.6
Man-made fibres 2.367 1.909 - 19.3 7.420 7.339 - 1.1 313 384
Synthetic filament tow 0 0 938 1.434 52.9Artificial filament tow 0 34 110 554 403.4 1,623
Synthetic staple fibres 2.345 1.815 - 22.6 4.727 3.489 - 26.2 202 192
Artificial staple fibres 0 0 3 17 422.1
Yarns and Threads 4.461 5.214 16.9 18.155 20.205 11.3 407 388
Silk 38 2 - 94.4 46 13 - 71.4 122 625
Wool 3.246 3.287 1.3 361 206 - 42.9 11 6
o.w. carded wool, n.p.r.s. 3 48 1356.9 91 37 - 58.8 2,735 77
o.w. combed wool, n.p.r.s. 90 47 - 47.6 177 75 - 57.9 196 158
Cotton 449 1.597 255.4 550 522 - 5.0 122 33
o.w. cotton yarn, n.p.r.s. 446 1.587 256.0 310 222 - 28.2 69 14
o.w. cotton yarn, p.r.s. 4 10 189.3 241 300 24.8 6,794 2,931
Other - Vegetable yarns 77 108 40.7 58 141 143.0 75 130
Man-made filaments yarns 647 220 - 66.0 15.361 17.059 11.1 2,376 7,763o.w. sewing thread 11 10 - 11.1 1.565 1.523 - 2.7 14,075 15,403
o.w. synthetic filament yarn 628 195 - 68.9 11.706 13.697 17.0 1,865 7,017
o.w. artificial filament yarn 0 0 3 33 909.1
o.w. synthetic monofilament 7 9 20.8 2.039 1.801 - 11.7 28,682 20,968
Man made staple yarns 4 0 - 100.0 1.780 2.264 27.2 39,914
o.w. man made staple yarns,n.p.r.s.
4 0 - 100.0 1.535 1.917 24.9 36,64
o.w. man made staple yarns,p.r.s.
0 0 - 100.0 245 347 41.6 90,722
Woven fabrics 2.953 4.432 50.1 27.072 24.486 - 9.6 917 553
Silk 1 1 - 25.4 322 393 22.0 27,269 44,618
Wool 53 254 380.4 1.717 1.247 - 27.3 3,244 491
o.w. carded wool 53 225 326.8 209 257 22.9 397 114
o.w. combed wool 0 29 1.507 988 - 34.5 717,852 3,375
Cotton 351 993 183.1 7.350 6.957 - 5.3 2,095 700
o.w. cotton, unbleached 0 0 718 269 - 62.5 141,526
o.w. cotton, dyed 104 847 715.5 1.879 1.225 - 34.8 1,808 145
o.w. denim fabric 0 0 125 62 - 50.1
Other fabrics 5 5 7.4 1.053 1.065 1.1 21,15 19,909
o.w. flax 5 5 7.4 1.008 1.033 2.4 20,249 19,307
Synthetic and artificial fila-ment yarn
574 1.185 106.5 6.970 5.582 - 19.9 1,215 471
o.w. synthetic filament yarn 570 1.164 104.1 6.771 5.414 - 20.0 1,187 465
o.w. artificial filament yarn 3 21 527.9 199 168 - 15.4 6,033 813
Synthetic and artificialsstaple fibres
105 140 34.0 4.961 4.197 - 15.4 4,739 2,991
o.w. containing > 85% ofsynthetic 83 51 - 38.6 2.134 1.906 - 10.7 2,581 3,758
o.w. containing < 85% ofsynthetic
1 2 107.4 266 256 - 3.9 32,823 15,216
o.w. containing < 85% syn-thetic mixed natural fibres
0 0 251 199 - 20.8

8/13/2019 Euratex nr 2
http://slidepdf.com/reader/full/euratex-nr-2 158/214
BULLETIN 2013/2
158
EU27 (External Trade) Textile and Clothing Trade 2011 - 2012 (continued)Country :
South AfricaIMPORTS EXPORTS Coverage E/I
Unit : 1000 € 2011 2012 Evol. % 2011 2012 Evol. % 2011 2012
o.w. other synthetics 21 87 311.2 1.577 1.087 - 31.1 7,437 1,246
o.w. artificial staple fibres 0 1 733 750 2.4 107,114
Special woven fabrics 1.865 1.853 - 0.6 4.699 5.044 7.4 252 272
o.w. pile fabrics 10 24 142.6 2.152 1.774 - 17.5 21,845 7,424
o.w. narrow woven fabrics 1.636 1.652 1.0 1.636 2.172 32.8 100 132
o.w. labels, badges 53 66 24.2 417 488 17.0 783 738
o.w. embroidery 120 87 - 27.4 99 121 22.3 83 139
Knitted fabrics 338 280 - 17.2 7.539 6.375 - 15.4 2,228 2,276
Pile fabrics 3 0 - 100.0 1.208 1.083 - 10.4 45,585
< 30 cm; w 5% or moreelastome
5 7 39.0 107 77 - 28.1 2,075 1,074
> 30 cm; w 5% or moreelastome
0 0 - 100.0 341 211 - 37.9 340,6
Curtain fabrics and raschellace
269 179 - 33.5 4.906 3.967 - 19.1 1,821 2,214
Other fabrics 61 94 53.3 978 1.037 6.0 1,599 1,105
Carpets 3.369 4.500 33.6 12.261 11.670 - 4.8 364 259
Knotted carpets 6 8 22.0 201 140 - 30.6 3,101 1,763
Woven carpets 1.037 2.047 97.3 2.413 2.251 - 6.7 233 110
Tufted carpets 2.169 2.274 4.9 8.003 8.191 2.3 369 360
Carpets of felt 119 89 - 25.6 662 642 - 3.0 555 724
Other textiles 32.241 26.938 - 16.4 117.358 123.340 5.1 364 458
Wadding, felt, nonwovens,rubber thread, twine, cor-dage, etc.
18.807 16.663 - 11.4 41.573 39.980 - 3.8 221 240
o.w. felt 6 4 - 36.8 1.929 1.823 - 5.5 30,866 46,158
o.w. nonwovens 17.926 15.442 - 13.9 33.230 30.097 - 9.4 185 195
o.w. special yarn 0 0 390 1.137 191.6
o.w. twine, rope 818 977 19.4 968 1.577 62.9 118 161
o.w. nets 14 40 192.0 1.025 1.325 29.2 7,452 3,298
Handwoven tapestries &quilted products
301 30 - 90.2 3 50 1641.1 1 169
Impregnated, coated, etc,,textile fabrics
2.920 1.837 - 37.1 55.173 55.832 1.2 1,89 3,039
o.w. tyre cord fabric 0 13 3356.8 3.367 2.304 - 31.6 910,016 18,012
o.w. fabrics impregnated,coated etc,
2.266 1.422 - 37.3 15.361 15.967 3.9 678 1,123
o.w. textile products, articlesfor technical uses
551 397 - 28.0 30.194 28.452 - 5.8 5,476 7,165
Other made up textilearticles
7.808 6.750 - 13.5 14.185 19.715 39.0 182 292
o.w. sacks and bags 37 27 - 26.6 766 728 - 5.0 2,095 2,712o.w. tarpaulins, sunblinds& alike
4.368 4.263 - 2.4 1.131 1.247 10.3 26 29
o.w. other : floorcloths,dishcloths etc
3.312 2.241 - 32.4 4.720 6.991 48.1 142 312
Worn clothing and otherworn articles
90 65 - 27.5 7.495 10.683 42.5 8,342 16,395
Home textiles 1.191 1.096 - 8.0 2.218 3.225 45.4 186 294
Bedlinen, table, toilet andkitchen linen
262 231 - 12.0 1.404 2.153 53.3 535 932
o.w. Bedlinen, woven 164 98 - 40.4 381 792 107.9 232 810
o.w. toilet linen 80 102 27.1 479 1.055 120.5 595 1,032
o.w. table linen, woven 8 23 189.8 459 233 - 49.4 5,703 997
Curtains 341 229 - 33.0 225 196 - 12.8 66 86
Other furnishing articles 73 86 16.9 234 482 105.7 320 562Garments 9.279 9.347 0.7 47.142 61.568 30.6 508 659
Occupationals (woven) 1.511 1.263 - 16.4 694 723 4.3 46 57
Men’s ensembles 0 34 16745.0 61 33 - 45.4 30,565 99

8/13/2019 Euratex nr 2
http://slidepdf.com/reader/full/euratex-nr-2 159/214
BULLETIN 2013/2
159
EU27 (External Trade) Textile and Clothing Trade 2011 - 2012 (continued)Country :
South AfricaIMPORTS EXPORTS Coverage E/I
Unit : 1000 € 2011 2012 Evol. % 2011 2012 Evol. % 2011 2012
Men's jackets 292 156 - 46.7 115 57 - 50.1 39 37
Men's trousers 217 104 - 52.0 200 146 - 27.0 92 140
Men's overalls 54 16 - 69.7 19 93 386.3 36 572
Other men's occupationals 938 931 - 0.7 165 148 - 10.6 18 16
Women's ensembles 1 1 - 30.0 1 3 261.6 91 471
Women's jackets 0 0 3 17 390.6 15,164
Women's trousers 2 1 - 60.5 68 55 - 18.7 3,586 7,384
Women's overalls 0 0 11 6 - 45.2
Other women's occupation-nals
7 20 209.9 50 165 231.0 757 808
Men’s Clothing (knitted andwoven)
5.078 4.897 - 3.6 12.776 19.147 49.9 252 391
Overcoats 11 13 18.7 1.198 2.273 89.7 10,641 17,002
o.w. woven 6 4 - 42.6 1.030 2.014 95.6 15,892 54,145
Suits 1 4 203.5 1.362 2.024 48.6 95,268 46,635
o.w. woven 1 4 243.7 1.193 1.988 66.6 100,254 48,606
Ensembles 6 49 658.4 279 234 - 16.2 4,351 481
o.w. woven 3 47 1591.8 259 189 - 26.9 9,235 399
Jackets and blazers 1.487 1.465 - 1.4 900 1.424 58.3 61 97
o.w. woven 1.486 1.464 - 1.5 841 1.296 54.2 57 89
Trousers 1.594 1.325 - 16.9 4.280 6.927 61.9 268 523
o.w. woven 1.578 1.321 - 16.3 3.965 6.420 61.9 251 486
Shirts 892 1.046 17.2 3.861 5.317 37.7 433 508
o.w. woven 708 378 - 46.6 1.835 2.834 54.4 259 750
Underpants, briefs, etc. 6 11 71.4 272 131 - 52.0 4,423 1,238
o.w. knitted 3 8 186.4 242 108 - 55.2 8,627 1,349
Swimwear 15 4 - 71.2 104 103 - 0.7 701 2,412Tracksuits 16 11 - 31.3 214 283 32.3 1,354 2,605
Women’s Clothing (knittedand woven)
2.081 1.978 - 4.9 13.125 16.561 26.2 631 837
Overcoats 155 12 - 92.1 1.005 1.276 27.0 651 10,454
o.w. woven 146 4 - 97.3 764 1.018 33.4 523 25,848
Suits 0 1 259.4 1.148 188 - 83.7 358,763 16,31
o.w. woven 0 1 259.4 1.143 83 - 92.8 357,05 7,198
Ensembles 57 23 - 59.0 371 352 - 5.1 655 1,519
o.w. woven 21 18 - 16.8 286 283 - 0.9 1,333 1,587
Jackets 784 744 - 5.1 955 1.775 85.8 122 239
o.w. woven 777 738 - 5.0 807 1.541 91.0 104 209
Skirts and dresses 288 315 9.5 2.880 4.390 52.4 1 1,392
o.w. woven 255 269 5.4 2.251 3.672 63.1 883 1,367Trousers 126 108 - 14.2 2.406 3.327 38.3 1,914 3,084
o.w. woven 106 63 - 41.0 2.135 2.813 31.8 2,012 4,496
Blouses 113 89 - 21.6 1.524 2.127 39.6 1,348 2,4
o.w. woven 63 35 - 45.1 1.155 1.755 52.0 1,837 5,082
Slips, petticoats, etc. 11 1 - 91.4 509 522 2.6 4,62 54,934
o.w. knitted 5 0 - 94.7 416 443 6.4 8,754 177,044
Swimwear 524 627 19.6 358 469 31.1 68 75
Tracksuits 1 10 843.2 1.020 1.091 7.0 91,914 10,422
Others (knitted and woven) 2.118 2.473 16.7 21.065 25.810 22.5 994 1,044
Babies’ garments 170 106 - 37.8 263 439 66.9 155 416
o.w. knitted or crocheted 113 94 - 16.3 94 153 62.3 84 163
T-shirts 558 712 27.6 4.068 5.570 36.9 729 783
Jerseys, pullovers, cardigans 141 82 - 41.6 3.574 4.105 14.8 2,531 4,978
Special garments 66 136 105.3 4.588 5.135 11.9 6,91 3,768
o.w. woven 65 127 94.0 4.389 4.606 4.9 6,731 3,641

8/13/2019 Euratex nr 2
http://slidepdf.com/reader/full/euratex-nr-2 160/214
BULLETIN 2013/2
160
EU27 (External Trade) Textile and Clothing Trade 2011 - 2012 (continued)Country :
South AfricaIMPORTS EXPORTS Coverage E/I
Unit : 1000€
2011 2012 Evol. % 2011 2012 Evol. % 2011 2012Other garments, knitted orcrocheted
26 43 61.8 1.041 3.002 188.5 3,929 7,006
Gloves 10 2 - 84.4 582 937 61.0 5,868 60,479
Ties, bow ties, and cravats 2 3 41.1 587 404 - 31.2 27,443 13,378
Shawls, scarves, mufflers,mantillas, etc
173 179 3.6 685 921 34.6 396 515
Pantyhose, tights, stockings,socks, etc
902 1.013 12.3 2.648 2.496 - 5.7 294 246
Brassières, girdles, corsets,etc,
28 92 230.8 2.091 1.451 - 30.6 7,539 1,581
Other accessories 43 105 144.9 988 1.160 17.4 2,304 1,104
TOTAL Chapter 61 KnittedGarments
2.610 3.462 32.6 18.419 23.868 29.6 706 689
TOTAL Chapter 62 Woven
Garments 6.669 5.885 - 11.8 28.736 37.682 31.1 431 640
Total Clothing - (CH 61+62) 9.293 9.347 0.6 47.155 61.550 30.5 507 658
Total Textile - (CH 50-60+ 63)
156.193 129.853 - 16.9 201.637 205.973 2.2 129 159
Total 165.486 139.200 - 15.9 248.792 267.523 7.5 150 192

8/13/2019 Euratex nr 2
http://slidepdf.com/reader/full/euratex-nr-2 161/214

8/13/2019 Euratex nr 2
http://slidepdf.com/reader/full/euratex-nr-2 162/214
BULLETIN 2013/2
162
EU27 (External Trade) Textile and Clothing Trade 2011 - 2012 (continued)Country :
Korea, SouthIMPORTS EXPORTS Coverage E/I
Unit : 1000 € 2011 2012 Evol. % 2011 2012 Evol. % 2011 2012
o.w. containing < 85% syn-thetic mixed natural fibres
1.576 1.890 19.9 255 170 - 33.3 16 9
o.w. other synthetics 4.414 7.126 61.5 2.212 2.616 18.3 50 37
o.w. artificial staple fibres 3.819 3.382 - 11.4 2.417 2.355 - 2.5 63 70
Special woven fabrics 12.503 16.249 30.0 4.771 4.955 3.9 38 30
o.w. pile fabrics 2.056 2.776 35.0 1.340 1.161 - 13.3 65 42
o.w. narrow woven fabrics 1.965 2.191 11.5 1.047 1.353 29.2 53 62
o.w. labels, badges 116 245 111.2 312 501 60.4 269 204
o.w. embroidery 4.317 4.692 8.7 809 692 - 14.4 19 15
Knitted fabrics 136.567 177.636 30.1 23.272 22.291 - 4.2 17 13
Pile fabrics 11.171 12.906 15.5 826 923 11.7 7 7
< 30 cm; w 5% or moreelastome
967 515 - 46.8 111 135 21.3 12 26
> 30 cm; w 5% or moreelastome
66.714 88.554 32.7 4.971 3.634 - 26.9 7 4
Curtain fabrics and raschellace
15.740 24.037 52.7 12.509 12.880 3.0 79 54
Other fabrics 41.975 51.625 23.0 4.854 4.720 - 2.8 12 9
Carpets 1.116 2.130 90.9 7.615 7.860 3.2 682 369
Knotted carpets 1 3 110.8 120 314 161.8 8,629 10,719
Woven carpets 158 169 7.1 3.799 4.854 27.8 2,407 2,872
Tufted carpets 776 1.523 96.2 2.510 1.831 - 27.1 323 120
Carpets of felt 0 52 55 32 - 42.8 61
Other textiles 172.171 182.445 6.0 97.142 106.149 9.3 56 58
Wadding, felt, nonwovens,rubber thread, twine, cor-dage, etc.
30.284 29.475 - 2.7 33.383 37.094 11.1 110 126
o.w. felt 1.315 1.150 - 12.5 1.354 1.404 3.7 103 122o.w. nonwovens 16.113 15.758 - 2.2 14.840 14.586 - 1.7 92 93
o.w. special yarn 1.658 1.390 - 16.2 573 1.233 115.0 35 89
o.w. twine, rope 4.416 5.778 30.8 2.832 3.233 14.2 64 56
o.w. nets 2.797 2.570 - 8.1 2.324 1.249 - 46.3 83 49
Handwoven tapestries &quilted products
33 80 144.4 247 247 - 0.3 755 308
Impregnated, coated, etc,,textile fabrics
101.993 113.840 11.6 44.400 38.096 - 14.2 44 33
o.w. tyre cord fabric 49.642 47.036 - 5.2 1.620 1.494 - 7.8 3 3
o.w. fabrics impregnated,coated etc,
39.482 51.311 30.0 14.575 13.311 - 8.7 37 26
o.w. textile products, articlesfor technical uses
4.017 4.507 12.2 21.275 16.891 - 20.6 530 375
Other made up textilearticles 28.545 26.111 - 8.5 9.138 11.492 25.8 32 44
o.w. sacks and bags 191 344 80.5 184 356 93.0 97 103
o.w. tarpaulins, sunblinds& alike
1.726 1.059 - 38.6 842 2.758 227.7 49 260
o.w. other : floorcloths,dishcloths etc
26.214 23.978 - 8.5 5.081 6.786 33.5 19 28
Worn clothing and otherworn articles
363 648 78.7 1.785 1.494 - 16.3 493 231
Home textiles 6.662 5.554 - 16.6 5.876 8.066 37.3 88 145
Bedlinen, table, toilet andkitchen linen
5.186 3.718 - 28.3 4.752 6.537 37.6 92 176
o.w. Bedlinen, woven 178 31 - 82.6 2.416 3.491 44.5 1,355 11,283
o.w. toilet linen 4.869 3.543 - 27.2 495 580 17.1 10 16
o.w. table linen, woven 2 45 1718.2 1.708 2.224 30.3 69,131 4,953
Curtains 957 892 - 6.8 331 220 - 33.5 35 25
Other furnishing articles 114 215 89.3 407 662 62.8 359 308
Garments 126.927 109.396 - 13.8 327.855 395.303 20.6 258 361

8/13/2019 Euratex nr 2
http://slidepdf.com/reader/full/euratex-nr-2 163/214
BULLETIN 2013/2
163
EU27 (External Trade) Textile and Clothing Trade 2011 - 2012 (continued)Country :
Korea, SouthIMPORTS EXPORTS Coverage E/I
Unit : 1000 € 2011 2012 Evol. % 2011 2012 Evol. % 2011 2012
Occupationals (woven) 566 470 - 16.9 898 1.240 38.2 159 264
Men's ensembles 16 40 142.8 166 179 7.4 1,021 451
Men's jackets 11 31 174.3 40 126 218.3 346 401
Men's trousers 62 43 - 31.5 110 120 9.1 177 282
Men's overalls 0 13 21933.3 10 48 362.5 17,283 363
Other men's occupationals 289 86 - 70.2 314 401 27.7 109 466
Women's ensembles 6 3 - 53.9 8 11 27.9 148 409
Women's jackets 19 17 - 10.8 121 91 - 24.5 643 544
Women's trousers 27 56 103.6 72 104 44.5 263 187
Women's overalls 0 0 0 4 922.5
Other women's occupation-nals
135 183 35.3 56 157 179.4 42 86
Men’s Clothing (knitted and
woven)8.049 7.166 - 11.0 57.853 70.373 21.6 719 982
Overcoats 2.826 2.398 - 15.1 12.912 18.674 44.6 457 779
o.w. woven 2.703 1.946 - 28.0 11.755 16.276 38.5 435 837
Suits 141 55 - 60.9 8.574 5.255 - 38.7 6,075 9,523
o.w. woven 141 51 - 63.6 8.511 5.146 - 39.5 6,038 10,024
Ensembles 51 76 48.5 2.904 2.653 - 8.6 5,668 3,487
o.w. woven 45 73 62.1 2.860 2.371 - 17.1 6,383 3,266
Jackets and blazers 493 836 69.7 6.577 7.374 12.1 1,335 882
o.w. woven 342 556 62.3 5.901 5.748 - 2.6 1,723 1,034
Trousers 1.396 1.060 - 24.0 17.043 21.950 28.8 1,221 2,07
o.w. woven 1.240 969 - 21.8 15.514 20.425 31.7 1,251 2,108
Shirts 1.942 1.974 1.6 7.422 9.932 33.8 382 503
o.w. woven 1.076 1.373 27.7 4.288 6.638 54.8 399 483
Underpants, briefs, etc. 542 448 - 17.5 423 623 47.3 78 139o.w. knitted 214 3 - 98.6 341 397 16.3 160 13,452
Swimwear 50 5 - 90.7 90 201 123.5 181 4,345
Tracksuits 285 208 - 27.2 915 1.951 113.4 321 940
Women’s Clothing (knittedand woven)
17.495 17.321 - 1.0 129.755 168.465 29.8 742 973
Overcoats 2.301 1.715 - 25.5 25.430 36.264 42.6 1,105 2,114
o.w. woven 1.905 1.566 - 17.8 22.726 32.364 42.4 1,193 2,066
Suits 325 469 44.3 10.358 8.089 - 21.9 3,188 1,725
o.w. woven 175 462 164.4 10.085 7.567 - 25.0 5,777 1,639
Ensembles 317 474 49.6 6.090 7.859 29.0 1,922 1,657
o.w. woven 278 372 33.7 6.078 7.781 28.0 2,184 2,092
Jackets 777 797 2.6 13.078 16.208 23.9 1,684 2,035
o.w. woven 603 633 5.1 11.629 14.029 20.6 1,929 2,215
Skirts and dresses 6.488 6.726 3.7 18.648 24.801 33.0 287 369
o.w. woven 3.440 4.120 19.8 14.301 18.808 31.5 416 457
Trousers 3.124 1.847 - 40.9 13.026 17.408 33.6 417 942
o.w. woven 912 884 - 3.0 11.644 15.226 30.8 1,277 1,722
Blouses 2.660 3.286 23.5 9.062 13.414 48.0 341 408
o.w. woven 1.305 1.412 8.2 6.867 9.786 42.5 526 693
Slips, petticoats, etc. 716 806 12.6 1.060 1.028 - 2.9 148 128
o.w. knitted 688 736 7.0 910 874 - 4.0 132 119
Swimwear 24 19 - 22.0 416 143 - 65.8 1,71 750
Tracksuits 423 480 13.5 6.751 8.068 19.5 1,597 1,681
Others (knitted and woven) 101.383 84.909 - 16.2 139.915 156.329 11.7 138 184
Babies’ garments 4.002 2.895 - 27.7 979 2.074 111.9 24 72
o.w. knitted or crocheted 3.905 2.723 - 30.3 644 1.634 153.7 16 60
T-shirts 11.848 4.856 - 59.0 11.720 14.238 21.5 99 293
Jerseys, pullovers, cardigans 2.118 2.617 23.6 26.861 35.472 32.1 1,268 1,355
Special garments 3.312 6.496 96.1 40.608 42.857 5.5 1,226 660
o.w. woven 3.268 6.399 95.8 27.058 27.951 3.3 828 437

8/13/2019 Euratex nr 2
http://slidepdf.com/reader/full/euratex-nr-2 164/214
BULLETIN 2013/2
164
EU27 (External Trade) Textile and Clothing Trade 2011 - 2012 (continued)Country :
Korea, SouthIMPORTS EXPORTS Coverage E/I
Unit : 1000 € 2011 2012 Evol. % 2011 2012 Evol. % 2011 2012
Other garments, knitted orcrocheted
433 993 129.2 21.794 22.337 2.5 5,028 2,249
Gloves 58.413 48.463 - 17.0 764 731 - 4.4 1 2
Ties, bow ties, and cravats 442 334 - 24.6 10.843 9.091 - 16.2 2,451 2,726
Shawls, scarves, mufflers,mantillas, etc
1.635 2.291 40.1 16.043 19.605 22.2 981 856
Pantyhose, tights, stockings,socks, etc
18.096 14.809 - 18.2 2.735 2.846 4.1 15 19
Brassières, girdles, corsets,etc,
373 141 - 62.1 1.521 1.407 - 7.5 408 996
Other accessories 897 1.050 17.0 6.192 5.347 - 13.6 690 509
TOTAL Chapter 61 KnittedGarments
104.537 82.463 - 21.1 101.616 125.561 23.6 97 152
TOTAL Chapter 62 Woven
Garments22.391 26.933 20.3 226.239 269.744 19.2 1010 1002
Total Clothing - (CH 61+62) 126.935 109.396 - 13.8 327.855 395.304 20.6 258 361
Total Textile - (CH 50-60+ 63)
883.750 943.340 6.7 378.951 357.764 - 5.6 43 38
Total 1.010.685 1.052.736 4.2 706.807 753.069 6.5 70 72

8/13/2019 Euratex nr 2
http://slidepdf.com/reader/full/euratex-nr-2 165/214
BULLETIN 2013/2
165
EU27 (External Trade) Textile and Clothing Trade 2011 - 2012Country :
Korea, SouthIMPORTS EXPORTS Coverage E/I
Unit : Tons 2011 2012 Evol. % 2011 2012 Evol. % 2011 2012
Natural fibers 3.209 1.999 - 37.7 888 1.125 26.7 28 56
Silk 0 7 0 8 7800.0 108
o.w. raw silk 0 0 0 0 0.0
Wool, fine or coarse animalhair
0 0 359 497 38.4
o.w. wool, not carded orcombed
0 0 282 292 3.5
o.w. wool and fine or coarseanimal hair
0 0 50 176 250.0
Cotton 3.206 1.988 - 38.0 431 589 36.7 13 30
Other vegetable fibres 3 3 10.0 99 32 - 67.5 3,293 973
o.w. flax 0 0 99 32 - 68.1
Man-made fibres 170.245 168.963 - 0.8 3.134 2.301 - 26.6 2 1
Synthetic filament tow 376 74 - 80.3 188 196 4.0 50 265Artificial filament tow 67 21 - 68.2 376 397 5.4 559 1,853
Synthetic staple fibres 167.509 165.956 - 0.9 887 1.114 25.5 1 1
Artificial staple fibres 0 58 1.206 297 - 75.3 513
Yarns and Threads 62.644 55.173 - 11.9 8.677 5.592 - 35.6 14 10
Silk 0 0 50.0 1 1 - 33.3 600 267
Wool 32 19 - 41.6 293 197 - 32.6 908 1,048
o.w. carded wool, n.p.r.s. 32 18 - 41.8 118 48 - 59.3 374 261
o.w. combed wool, n.p.r.s. 1 0 - 83.3 117 103 - 12.2 19,483 102,6
Cotton 903 746 - 17.4 73 73 0.1 8 10
o.w. cotton yarn, n.p.r.s. 881 746 - 15.3 55 42 - 22.9 6 6
o.w. cotton yarn, p.r.s. 22 0 - 100.0 19 31 67.7 85
Other - Vegetable yarns 0 0 100.0 12 19 53.3 12,2 9,35
Man-made filaments yarns 61.234 53.941 - 11.9 7.532 4.622 - 38.6 12 9o.w. sewing thread 116 104 - 10.7 96 105 9.4 83 101
o.w. synthetic filament yarn 60.980 53.635 - 12.0 2.926 2.194 - 25.0 5 4
o.w. artificial filament yarn 41 41 - 0.7 4.139 2.078 - 49.8 10,119 5,118
o.w. synthetic monofilament 74 71 - 4.3 370 242 - 34.7 500 341
Man made staple yarns 474 466 - 1.7 766 680 - 11.2 162 146
o.w. man made staple yarns,n.p.r.s.
455 368 - 19.2 735 659 - 10.3 161 179
o.w. man made staple yarns,p.r.s.
19 98 428.0 31 22 - 31.0 168 22
Woven fabrics 16.526 16.790 1.6 2.212 2.043 - 7.6 13 12
Silk 30 56 84.8 14 10 - 29.9 48 18
Wool 8 6 - 29.1 771 575 - 25.4 9,757 10,264
o.w. carded wool 3 1 - 67.6 337 238 - 29.2 9,906 21,673
o.w. combed wool 5 5 0.0 433 336 - 22.4 9,624 7,473
Cotton 1.278 1.252 - 2.0 377 311 - 17.5 29 25
o.w. cotton, unbleached 17 15 - 12.1 11 7 - 34.8 65 48
o.w. cotton, dyed 137 64 - 53.2 88 83 - 5.8 64 129
o.w. denim fabric 3 1 - 72.0 26 21 - 19.6 1,04 2,986
Other fabrics 59 93 58.4 110 70 - 36.0 188 76
o.w. flax 30 52 71.1 96 63 - 34.4 317 122
Synthetic and artificial fila-ment yarn
12.349 12.210 - 1.1 378 458 21.1 3 4
o.w. synthetic filament yarn 9.948 10.195 2.5 329 307 - 6.9 3 3
o.w. artificial filament yarn 2.401 2.015 - 16.1 49 152 209.0 2 8
Synthetic and artificialsstaple fibres
1.506 1.837 22.0 437 459 4.8 29 25
o.w. containing > 85% of
synthetic 426 446 4.9 258 262 1.7 61 59
o.w. containing < 85% ofsynthetic
23 268 1065.2 3 3 - 3.1 14 1

8/13/2019 Euratex nr 2
http://slidepdf.com/reader/full/euratex-nr-2 166/214
BULLETIN 2013/2
166
EU27 (External Trade) Textile and Clothing Trade 2011 - 2012 (continued)Country :
Korea, SouthIMPORTS EXPORTS Coverage E/I
Unit : Tons 2011 2012 Evol. % 2011 2012 Evol. % 2011 2012
o.w. containing < 85% syn-thetic mixed natural fibres
151 169 11.8 10 4 - 59.6 7 2
o.w. other synthetics 544 693 27.4 71 92 29.4 13 13
o.w. artificial staple fibres 362 261 - 27.8 96 98 1.9 27 37
Special woven fabrics 1.297 1.336 3.0 124 160 28.9 10 12
o.w. pile fabrics 209 234 11.9 44 42 - 5.4 21 18
o.w. narrow woven fabrics 401 343 - 14.6 50 87 73.6 13 25
o.w. labels, badges 2 12 547.4 3 3 - 3.6 147 22
o.w. embroidery 301 273 - 9.1 8 6 - 29.3 3 2
Knitted fabrics 20.245 24.136 19.2 665 685 3.0 3 3
Pile fabrics 1.291 1.301 0.8 31 78 149.7 2 6
< 30 cm; w 5% or moreelastome
109 34 - 68.8 3 3 0.0 2 8
> 30 cm; w 5% or moreelastome
9.731 12.217 25.6 122 111 - 9.1 1 1
Curtain fabrics and raschellace
2.560 3.157 23.3 253 247 - 2.3 10 8
Other fabrics 6.556 7.427 13.3 256 246 - 4.1 4 3
Carpets 270 302 12.1 1.507 1.165 - 22.7 559 386
Knotted carpets 0 0 0.0 2 3 35.0 2 2,7
Woven carpets 39 22 - 42.4 575 624 8.6 1,477 2,784
Tufted carpets 185 223 20.5 375 247 - 34.3 203 111
Carpets of felt 0 4 15 8 - 44.8 213
Other textiles 36.576 35.543 - 2.8 10.302 13.936 35.3 28 39
Wadding, felt, nonwovens,rubber thread, twine, cor-dage, etc.
4.863 4.554 - 6.3 4.796 4.810 0.3 99 106
o.w. felt 203 156 - 23.2 296 263 - 11.1 146 169o.w. nonwovens 2.133 2.067 - 3.1 3.004 2.855 - 5.0 141 138
o.w. special yarn 131 79 - 40.0 22 58 158.3 17 73
o.w. twine, rope 1.052 1.233 17.2 415 432 4.0 39 35
o.w. nets 795 606 - 23.7 192 220 14.6 24 36
Handwoven tapestries &quilted products
2 6 145.8 12 3 - 73.4 517 56
Impregnated, coated, etc,,textile fabrics
23.215 22.950 - 1.1 1.854 1.739 - 6.2 8 8
o.w. tyre cord fabric 14.542 13.731 - 5.6 228 232 1.7 2 2
o.w. fabrics impregnated,coated etc,
5.764 6.309 9.5 599 723 20.8 10 11
o.w. textile products, articlesfor technical uses
253 300 18.6 528 392 - 25.8 209 131
Other made up textilearticles 2.683 2.084 - 22.3 1.585 2.573 62.3 59 123
o.w. sacks and bags 53 91 71.7 21 24 12.9 40 26
o.w. tarpaulins, sunblinds& alike
262 92 - 65.0 178 956 436.9 68 1,043
o.w. other : floorcloths,dishcloths etc
2.162 1.793 - 17.1 864 1.088 25.8 40 61
Worn clothing and otherworn articles
204 102 - 49.7 482 503 4.5 236 491
Home textiles 494 412 - 16.5 209 264 26.0 42 64
Bedlinen, table, toilet andkitchen linen
343 220 - 35.9 177 226 27.9 52 103
o.w. Bedlinen, woven 20 3 - 83.7 86 114 32.9 423 3,461
o.w. toilet linen 311 207 - 33.6 22 25 13.0 7 12
o.w. table linen, woven 0 2 1000.0 64 78 21.8 31,95 3,536
Curtains 79 85 7.9 8 5 - 37.2 10 6
Other furnishing articles 16 14 - 12.7 17 20 15.4 107 141
Garments 6.830 4.777 - 30.1 2.899 2.931 1.1 42 61

8/13/2019 Euratex nr 2
http://slidepdf.com/reader/full/euratex-nr-2 167/214
BULLETIN 2013/2
167
EU27 (External Trade) Textile and Clothing Trade 2011 - 2012 (continued)Country :
Korea, SouthIMPORTS EXPORTS Coverage E/I
Unit : Tons 2011 2012 Evol. % 2011 2012 Evol. % 2011 2012
Occupationals (woven) 18 12 - 36.4 16 22 42.0 85 191
Men’s ensembles 1 0 - 42.9 6 4 - 27.9 871 1,1
Men’s jackets 0 1 75.0 0 1 0 114
Men’s trousers 2 1 - 55.6 2 2 - 5.9 94 200
Men’s overalls 0 0 0 2 475
Other men’s occupationals 12 2 - 85.1 5 9 86.0 41 517
Women’s ensembles 0 0 - 33.3 0 0 0 0
Women’s jackets 0 0 - 100.0 1 1 - 33.3 300
Women’s trousers 0 3 933.3 1 0 - 71.4 233 6
Women’s overalls 0 0 0 0
Other women’s occupation-nals
3 4 72.0 1 4 169.2 52 81
Men’s Clothing (knitted and
woven)302 185 - 38.6 532 691 29.9 176 373
Overcoats 88 39 - 56.2 87 120 38.2 99 311
o.w. woven 83 33 - 60.2 73 93 28.0 88 282
Suits 2 1 - 12.5 35 26 - 25.2 2,181 1,864
o.w. woven 2 1 - 25.0 35 26 - 26.1 2,175 2,142
Ensembles 2 1 - 20.0 30 14 - 54.1 2,033 1,167
o.w. woven 1 1 - 14.3 30 13 - 57.6 2,157 1,067
Jackets and blazers 13 10 - 16.8 47 83 75.5 379 800
o.w. woven 8 7 - 12.2 38 39 5.1 457 547
Trousers 71 34 - 53.0 218 287 31.6 305 855
o.w. woven 66 32 - 51.9 205 274 33.9 312 868
Shirts 78 60 - 22.8 83 95 14.7 107 159
o.w. woven 53 51 - 3.0 44 67 51.8 83 130
Underpants, briefs, etc. 23 29 24.5 6 7 20.7 25 25o.w. knitted 4 0 - 100.0 4 4 - 6.8 116
Swimwear 1 0 - 90.0 4 2 - 62.5 400 1,5
Tracksuits 12 10 - 20.8 10 30 193.2 86 318
Women’s Clothing (knittedand woven)
921 595 - 35.4 1.057 980 - 7.3 115 165
Overcoats 92 39 - 58.1 138 184 33.1 150 477
o.w. woven 47 36 - 22.5 122 165 35.0 262 456
Suits 6 5 - 15.5 54 35 - 34.8 936 722
o.w. woven 3 2 - 11.5 54 35 - 35.7 2,069 1,504
Ensembles 20 18 - 7.6 23 29 26.3 116 158
o.w. woven 19 15 - 17.8 23 28 24.2 123 186
Jackets 24 14 - 39.1 67 83 24.8 280 573
o.w. woven 20 10 - 47.2 60 68 13.4 305 655
Skirts and dresses 250 204 - 18.2 153 129 - 15.6 61 63
o.w. woven 80 75 - 6.5 109 85 - 22.5 136 113
Trousers 330 105 - 68.2 170 241 42.0 51 230
o.w. woven 54 36 - 33.7 143 206 43.8 264 572
Blouses 107 130 21.8 92 119 28.8 86 91
o.w. woven 41 30 - 27.3 55 67 20.8 135 224
Slips, petticoats, etc. 72 59 - 18.0 7 6 - 14.3 10 10
o.w. knitted 58 55 - 4.5 6 5 - 13.1 11 10
Swimwear 0 0 0.0 8 1 - 87.0 2,567 333
Tracksuits 14 11 - 20.6 218 30 - 86.3 1,545 266
Others (knitted and woven) 5.607 3.997 - 28.7 1.304 1.258 - 3.5 23 31
Babies’ garments 210 160 - 23.5 18 40 123.8 9 25
o.w. knitted or crocheted 208 155 - 25.4 13 36 176.3 6 23
T-shirts 943 312 - 67.0 220 230 4.6 23 74
Jerseys, pullovers, cardigans 89 93 4.7 263 326 24.2 295 350

8/13/2019 Euratex nr 2
http://slidepdf.com/reader/full/euratex-nr-2 168/214
BULLETIN 2013/2
168
EU27 (External Trade) Textile and Clothing Trade 2011 - 2012 (continued)Country :
Korea, SouthIMPORTS EXPORTS Coverage E/I
Unit : Tons 2011 2012 Evol. % 2011 2012 Evol. % 2011 2012
Special garments 152 235 54.2 211 264 25.1 138 112
o.w. woven 151 233 54.6 135 178 31.7 90 76
Other garments, knitted orcrocheted
15 48 216.3 159 143 - 9.5 1,037 296
Gloves 2.761 2.019 - 26.9 10 10 1.0 0 0
Ties, bow ties, and cravats 10 5 - 52.0 46 37 - 19.7 448 749
Shawls, scarves, mufflers,mantillas, etc
61 57 - 6.3 90 98 9.2 148 172
Pantyhose, tights, stockings,socks, etc
1.327 1.024 - 22.8 51 53 3.7 4 5
Brassières, girdles, corsets,etc,
17 5 - 73.2 10 12 19.8 60 269
Other accessories 27 30 10.7 228 34 - 85.3 844 112
TOTAL Chapter 61 Knitted
Garments 6.010 4.025 - 33.0 1.055 1.227 16.3 18 30
TOTAL Chapter 62 WovenGarments
821 752 - 8.4 1.844 1.703 - 7.7 225 226
Total Clothing 6.831 4.777 - 30.1 2.899 2.930 1.1 42 61
Total Textile 310.196 303.341 - 2.2 59.603 58.183 - 2.4 19 19
Total 317.027 308.118 - 2.8 62.502 61.113 - 2.2 20 20

8/13/2019 Euratex nr 2
http://slidepdf.com/reader/full/euratex-nr-2 169/214
BULLETIN 2013/2
169
EU27 (External Trade) Textile and Clothing Trade 2011 - 2012Country :
SwitzerlandIMPORTS EXPORTS Coverage E/I
Unit : 1000 € 2011 2012 Evol. % 2011 2012 Evol. % 2011 2012
Natural fibers 4.462 4.161 - 6.8 13.201 12.212 - 7.5 296 293
Silk 1 44 4682.8 454 89 - 80.4 48,817 200
o.w. raw silk 1 0 - 100.0 95 26 - 72.2 10,196
Wool, fine or coarse animalhair
1.520 974 - 36.0 2.890 2.506 - 13.3 190 257
o.w. wool, not carded orcombed
1.248 671 - 46.2 374 699 87.1 30 104
o.w. wool and fine or coarseanimal hair
188 189 0.7 2.303 1.467 - 36.3 1,225 775
Cotton 2.616 2.153 - 17.7 8.966 8.421 - 6.1 343 391
Other vegetable fibres 325 990 204.5 890 1.195 34.3 274 121
o.w. flax 319 988 209.3 335 555 65.6 105 56
Man-made fibres 26.712 23.215 - 13.1 23.479 18.804 - 19.9 88 81
Synthetic filament tow 574 658 14.5 134 914 584.6 23 139Artificial filament tow 14 123 758.4 12.226 8.402 - 31.3 85,375 6,835
Synthetic staple fibres 24.406 21.032 - 13.8 8.751 6.400 - 26.9 36 30
Artificial staple fibres 35 89 154.1 282 300 6.4 804 337
Yarns and Threads 115.711 98.550 - 14.8 124.643 115.854 - 7.1 108 118
Silk 1.820 1.718 - 5.7 1.349 806 - 40.2 74 47
Wool 9.608 9.739 1.4 17.748 18.378 3.5 185 189
o.w. carded wool, n.p.r.s. 59 46 - 22.2 1.840 1.783 - 3.1 3,11 3,871
o.w. combed wool, n.p.r.s. 4.464 3.081 - 31.0 5.762 3.932 - 31.8 129 128
Cotton 21.160 19.855 - 6.2 25.134 21.225 - 15.6 119 107
o.w. cotton yarn, n.p.r.s. 20.327 18.948 - 6.8 21.211 17.207 - 18.9 104 91
o.w. cotton yarn, p.r.s. 834 907 8.8 3.923 4.018 2.4 471 443
Other - Vegetable yarns 82 108 32.2 1.369 1.091 - 20.3 1,671 1,008
Man-made filaments yarns 72.780 58.524 - 19.6 64.976 60.524 - 6.9 89 103o.w. sewing thread 3.668 3.001 - 18.2 5.887 5.297 - 10.0 160 177
o.w. synthetic filament yarn 63.990 51.672 - 19.3 38.699 36.766 - 5.0 60 71
o.w. artificial filament yarn 1.400 1.215 - 13.2 446 357 - 20.0 32 29
o.w. synthetic monofilament 3.659 2.578 - 29.6 19.698 17.626 - 10.5 538 684
Man made staple yarns 10.261 8.607 - 16.1 14.066 13.830 - 1.7 137 161
o.w. man made staple yarns,n.p.r.s.
9.600 7.979 - 16.9 10.593 10.429 - 1.5 110 131
o.w. man made staple yarns,p.r.s.
661 628 - 4.9 3.473 3.401 - 2.1 526 541
Woven fabrics 303.784 273.764 - 9.9 326.070 296.299 - 9.1 107 108
Silk 3.803 4.190 10.2 9.431 9.331 - 1.1 248 223
Wool 25.273 20.446 - 19.1 52.738 47.008 - 10.9 209 230
o.w. carded wool 3.335 3.642 9.2 8.861 10.993 24.1 266 302
o.w. combed wool 21.919 16.773 - 23.5 43.821 35.988 - 17.9 200 215
Cotton 114.386 102.048 - 10.8 85.300 77.293 - 9.4 75 76
o.w. cotton, unbleached 8.298 8.245 - 0.6 8.934 9.660 8.1 108 117
o.w. cotton, dyed 15.402 14.448 - 6.2 10.513 11.260 7.1 68 78
o.w. denim fabric 504 279 - 44.7 615 468 - 23.9 122 168
Other fabrics 2.702 2.103 - 22.2 7.151 6.986 - 2.3 265 332
o.w. flax 2.677 2.089 - 22.0 6.438 6.460 0.3 241 309
Synthetic and artificial fila-
ment yarn80.175 71.500 - 10.8 95.578 85.568 - 10.5 119 120
o.w. synthetic filament yarn 73.369 66.365 - 9.5 85.377 76.271 - 10.7 116 115
o.w. artificial filament yarn 6.806 5.135 - 24.5 10.201 9.297 - 8.9 150 181
Synthetic and artificialsstaple fibres
21.190 19.223 - 9.3 34.898 31.203 - 10.6 165 162
o.w. containing > 85% of
synthetic 12.037 10.707 - 11.1 16.980 16.795 - 1.1 141 157
o.w. containing < 85% ofsynthetic
949 728 - 23.2 3.274 2.216 - 32.3 345 304

8/13/2019 Euratex nr 2
http://slidepdf.com/reader/full/euratex-nr-2 170/214
BULLETIN 2013/2
170
EU27 (External Trade) Textile and Clothing Trade 2011 - 2012 (continued)Country :
SwitzerlandIMPORTS EXPORTS Coverage E/I
Unit : 1000 € 2011 2012 Evol. % 2011 2012 Evol. % 2011 2012
o.w. containing < 85% syn-thetic mixed natural fibres
2.932 3.906 33.2 6.555 5.353 - 18.3 224 137
o.w. other synthetics 3.490 2.756 - 21.0 4.573 3.967 - 13.3 131 144
o.w. artificial staple fibres 1.782 1.127 - 36.8 3.516 2.873 - 18.3 197 255
Special woven fabrics 54.848 53.336 - 2.8 39.037 37.620 - 3.6 71 71
o.w. pile fabrics 8.062 7.369 - 8.6 5.747 5.421 - 5.7 71 74
o.w. narrow woven fabrics 16.448 15.090 - 8.3 17.949 17.581 - 2.0 109 117
o.w. labels, badges 1.392 1.313 - 5.7 3.920 3.817 - 2.6 282 291
o.w. embroidery 23.142 23.940 3.4 5.440 5.282 - 2.9 24 22
Knitted fabrics 39.342 33.549 - 14.7 53.027 50.182 - 5.4 135 150
Pile fabrics 744 778 4.7 3.414 2.654 - 22.3 459 341
< 30 cm; w 5% or moreelastome
1.328 1.045 - 21.3 1.783 1.704 - 4.4 134 163
> 30 cm; w 5% or moreelastome
13.550 12.882 - 4.9 11.114 9.936 - 10.6 82 77
Curtain fabrics and raschellace
5.940 4.887 - 17.7 17.408 18.495 6.2 293 378
Other fabrics 17.780 13.957 - 21.5 19.308 17.393 - 9.9 109 125
Carpets 66.309 67.444 1.7 142.633 136.100 - 4.6 215 202
Knotted carpets 363 339 - 6.6 6.871 7.345 6.9 1,893 2,165
Woven carpets 10.280 8.012 - 22.1 35.460 32.534 - 8.3 345 406
Tufted carpets 12.417 15.502 24.8 76.424 73.948 - 3.2 615 477
Carpets of felt 41.823 42.815 2.4 10.508 9.509 - 9.5 25 22
Other textiles 322.952 319.809 - 1.0 551.073 535.287 - 2.9 171 167
Wadding, felt, nonwovens,rubber thread, twine, cor-dage, etc.
73.573 76.479 3.9 208.553 204.901 - 1.8 283 268
o.w. felt 2.771 2.650 - 4.4 9.148 8.824 - 3.5 330 333o.w. nonwovens 31.325 32.287 3.1 118.616 121.736 2.6 379 377
o.w. special yarn 19.357 19.625 1.4 7.388 5.851 - 20.8 38 30
o.w. twine, rope 6.591 5.380 - 18.4 7.088 6.787 - 4.2 108 126
o.w. nets 622 742 19.3 6.258 6.191 - 1.1 1,006 834
Handwoven tapestries &quilted products
133 711 433.7 1.208 941 - 22.1 907 132
Impregnated, coated, etc,,textile fabrics
151.524 134.683 - 11.1 113.145 100.326 - 11.3 75 74
o.w. tyre cord fabric 36 128 260.3 193 187 - 3.3 542 146
o.w. fabrics impregnated,coated etc,
59.068 49.038 - 17.0 35.870 32.531 - 9.3 61 66
o.w. textile products, articlesfor technical uses
87.363 81.965 - 6.2 49.939 41.503 - 16.9 57 51
Other made up textilearticles
57.265 69.701 21.7 150.940 160.032 6.0 264 230
o.w. sacks and bags 1.361 1.475 8.3 12.261 12.065 - 1.6 901 818
o.w. tarpaulins, sunblinds& alike
3.381 9.666 185.9 56.297 64.271 14.2 1,665 665
o.w. other : floorcloths,dishcloths etc
19.954 19.357 - 3.0 75.312 76.922 2.1 377 397
Worn clothing and otherworn articles
32.420 39.084 20.6 5.039 5.182 2.9 16 13
Home textiles 37.866 38.402 1.4 219.013 233.165 6.5 578 607
Bedlinen, table, toilet andkitchen linen
31.313 32.195 2.8 143.749 148.517 3.3 459 461
o.w. Bedlinen, woven 22.865 24.245 6.0 76.356 84.993 11.3 334 351
o.w. toilet linen 4.903 4.447 - 9.3 35.540 34.102 - 4.0 725 767
o.w. table linen, woven 1.082 1.176 8.7 15.009 14.119 - 5.9 1,387 1,2
Curtains 6.326 5.509 - 12.9 47.053 53.833 14.4 744 977
Other furnishing articles 842 1.119 32.8 19.512 19.839 1.7 2,316 1,773
Garments 536.218 527.753 - 1.6 3.296.168 3.291.017 - 0.2 615 624

8/13/2019 Euratex nr 2
http://slidepdf.com/reader/full/euratex-nr-2 171/214
BULLETIN 2013/2
171
EU27 (External Trade) Textile and Clothing Trade 2011 - 2012 (continued)Country :
SwitzerlandIMPORTS EXPORTS Coverage E/I
Unit : 1000 € 2011 2012 Evol. % 2011 2012 Evol. % 2011 2012
Occupationals (woven) 10.548 9.639 - 8.6 58.322 59.633 2.2 553 619
Men's ensembles 538 449 - 16.6 1.046 1.311 25.3 195 292
Men's jackets 2.723 3.333 22.4 6.947 7.579 9.1 255 227
Men's trousers 2.351 2.638 12.2 21.753 23.698 8.9 925 898
Men's overalls 1.007 881 - 12.6 3.136 3.568 13.8 311 405
Other men's occupationals 3.356 1.740 - 48.2 13.842 11.550 - 16.6 412 664
Women's ensembles 3 2 - 45.4 189 174 - 8.1 5,614 9,453
Women's jackets 113 104 - 7.9 1.524 1.718 12.7 1,352 1,655
Women's trousers 71 15 - 79.1 2.141 1.647 - 23.1 3,025 11,151
Women's overalls 3 1 - 75.7 159 256 61.2 4,635 30,783
Other women's occupation-nals
384 479 24.8 7.586 8.134 7.2 1,978 1,7
Men’s Clothing (knitted and
woven) 222.608 208.262 - 6.4 839.119 869.566 3.6 377 418
Overcoats 23.988 23.660 - 1.4 101.548 111.815 10.1 423 473
o.w. woven 21.672 21.426 - 1.1 93.125 102.260 9.8 430 477
Suits 60.735 54.757 - 9.8 112.434 133.892 19.1 185 245
o.w. woven 60.591 54.711 - 9.7 110.088 130.714 18.7 182 239
Ensembles 785 689 - 12.3 60.301 30.022 - 50.2 7,68 4,358
o.w. woven 743 645 - 13.3 59.846 29.024 - 51.5 8,051 4,503
Jackets and blazers 62.479 58.232 - 6.8 109.791 127.978 16.6 176 220
o.w. woven 62.120 57.882 - 6.8 91.779 105.752 15.2 148 183
Trousers 36.676 38.161 4.0 262.216 274.888 4.8 715 720
o.w. woven 34.966 37.660 7.7 252.652 263.710 4.4 723 700
Shirts 21.563 18.873 - 12.5 131.454 128.182 - 2.5 610 679
o.w. woven 15.483 12.686 - 18.1 96.060 92.113 - 4.1 620 726
Underpants, briefs, etc. 10.699 9.998 - 6.6 30.029 27.992 - 6.8 281 280o.w. knitted 9.993 9.523 - 4.7 26.390 24.093 - 8.7 264 253
Swimwear 587 1.056 79.8 3.942 4.556 15.6 671 431
Tracksuits 811 580 - 28.5 10.013 12.691 26.7 1,234 2,188
Women’s Clothing (knittedand woven)
138.300 140.572 1.6 1.278.285 1.247.876 - 2.4 924 888
Overcoats 18.143 17.883 - 1.4 167.087 160.631 - 3.9 921 898
o.w. woven 15.743 14.837 - 5.8 146.588 141.698 - 3.3 931 955
Suits 288 357 24.1 11.474 11.610 1.2 3,986 3,251
o.w. woven 234 211 - 9.8 9.800 9.418 - 3.9 4,184 4,457
Ensembles 243 456 87.5 24.306 16.027 - 34.1 9,991 3,514
o.w. woven 145 388 168.1 22.064 13.777 - 37.6 15,228 3,547
Jackets 16.110 17.232 7.0 127.595 123.648 - 3.1 792 718
o.w. woven 15.312 16.364 6.9 107.223 101.024 - 5.8 700 617Skirts and dresses 47.638 52.496 10.2 340.601 346.965 1.9 715 661
o.w. woven 33.373 34.262 2.7 256.644 256.672 0.0 769 749
Trousers 23.273 17.117 - 26.5 260.014 262.518 1.0 1,117 1,534
o.w. woven 20.812 14.778 - 29.0 222.389 225.364 1.3 1,069 1,525
Blouses 8.301 10.260 23.6 158.524 157.368 - 0.7 1,91 1,534
o.w. woven 7.046 8.984 27.5 117.764 117.690 - 0.1 1,671 1,31
Slips, petticoats, etc. 18.217 18.354 0.8 80.466 76.458 - 5.0 442 417
o.w. knitted 17.811 17.926 0.6 73.721 63.931 - 13.3 414 357
Swimwear 1.551 1.771 14.2 45.184 45.296 0.2 2,913 2,558
Tracksuits 1.557 1.606 3.2 25.530 16.694 - 34.6 1,64 1,04
Others (knitted and woven) 175.310 178.912 2.1 1.177.971 1.172.757 - 0.4 672 655
Babies’ garments 5.346 7.890 47.6 27.546 26.108 - 5.2 515 331
o.w. knitted or crocheted 4.358 6.212 42.5 18.920 17.233 - 8.9 434 277
T-shirts 20.149 18.687 - 7.3 259.527 264.870 2.1 1,288 1,417
Jerseys, pullovers, cardigans 32.825 39.555 20.5 348.370 342.973 - 1.5 1,061 867
Special garments 4.879 4.030 - 17.4 105.313 108.580 3.1 2,159 2,694
o.w. woven 2.307 2.577 11.7 95.623 99.641 4.2 4,146 3,867

8/13/2019 Euratex nr 2
http://slidepdf.com/reader/full/euratex-nr-2 172/214
BULLETIN 2013/2
172
EU27 (External Trade) Textile and Clothing Trade 2011 - 2012 (continued)Country :
SwitzerlandIMPORTS EXPORTS Coverage E/I
Unit : 1000 € 2011 2012 Evol. % 2011 2012 Evol. % 2011 2012
Other garments, knitted orcrocheted
11.539 14.873 28.9 81.613 77.458 - 5.1 707 521
Gloves 998 1.015 1.7 13.044 14.225 9.1 1,307 1,401
Ties, bow ties, and cravats 11.950 10.255 - 14.2 39.044 36.980 - 5.3 327 361
Shawls, scarves, mufflers,mantillas, etc
38.954 37.627 - 3.4 93.491 103.734 11.0 240 276
Pantyhose, tights, stockings,socks, etc
32.534 27.771 - 14.6 85.969 82.191 - 4.4 264 296
Brassières, girdles, corsets,etc,
2.215 2.077 - 6.2 84.043 76.682 - 8.8 3,795 3,693
Other accessories 13.478 13.648 1.3 32.400 30.146 - 7.0 240 221
TOTAL Chapter 61 KnittedGarments
175.695 181.642 3.4 1.268.468 1.261.254 - 0.6 722 694
TOTAL Chapter 62 Woven
Garments360.524 346.011 - 4.0 2.028.016 2.028.775 0.0 563 586
Total Clothing - (CH 61+62) 536.225 527.654 - 1.6 3.296.506 3.290.170 - 0.2 615 624
Total Textile - (CH 50-60+ 63)
917.210 858.439 - 6.4 1.466.670 1.405.173 - 4.2 160 164
Total 1.453.435 1.386.092 - 4.6 4.763.176 4.695.343 - 1.4 328 339

8/13/2019 Euratex nr 2
http://slidepdf.com/reader/full/euratex-nr-2 173/214
BULLETIN 2013/2
173
EU27 (External Trade) Textile and Clothing Trade 2011 - 2012Country :
TaiwanIMPORTS EXPORTS Coverage E/I
Unit : 1000 € 2011 2012 Evol. % 2011 2012 Evol. % 2011 2012
Natural fibers 798 269 - 66.3 5.063 7.028 38.8 634 2,615
Silk 80 0 - 100.0 0 9 0
o.w. raw silk 79 0 - 100.0 0 0 0
Wool, fine or coarse animalhair
647 231 - 64.2 263 361 36.9 41 156
o.w. wool, not carded orcombed
0 0 184 191 3.5
o.w. wool and fine or coarseanimal hair
16 143 796.4 53 168 214.4 335 118
Cotton 35 26 - 24.9 3.825 5.834 52.5 11,087 22,524
Other vegetable fibres 37 12 - 69.0 974 825 - 15.3 2,6 7,104
o.w. flax 0 0 971 787 - 19.0
Man-made fibres 165.111 148.463 - 10.1 2.760 3.533 28.0 2 2
Synthetic filament tow 460 318 - 30.9 370 232 - 37.3 80 73Artificial filament tow 24 34 39.4 195 100 - 48.6 800 295
Synthetic staple fibres 162.904 146.619 - 10.0 1.214 2.363 94.6 1 2
Artificial staple fibres 20 324 1513.8 572 543 - 5.1 2,852 168
Yarns and Threads 85.001 75.493 - 11.2 20.211 10.687 - 47.1 24 14
Silk 2 57 3655.0 50 37 - 26.1 3,338 66
Wool 60 6 - 89.5 1.428 1.275 - 10.7 2,362 20,171
o.w. carded wool, n.p.r.s. 0 2 251 249 - 0.7 15,988
o.w. combed wool, n.p.r.s. 1 1 - 4.6 435 469 7.8 40,274 45,54
Cotton 104 82 - 20.6 528 319 - 39.6 510 388
o.w. cotton yarn, n.p.r.s. 85 64 - 24.3 305 116 - 62.0 359 181
o.w. cotton yarn, p.r.s. 19 18 - 3.8 223 203 - 9.0 1,191 1,126
Other - Vegetable yarns 21 84 291.8 98 281 186.3 459 335
Man-made filaments yarns 83.145 74.100 - 10.9 17.423 8.198 - 52.9 21 11o.w. sewing thread 505 409 - 19.1 196 210 7.4 39 51
o.w. synthetic filament yarn 79.463 70.662 - 11.1 16.458 7.040 - 57.2 21 10
o.w. artificial filament yarn 142 48 - 66.3 79 168 112.4 56 352
o.w. synthetic monofilament 2.761 2.807 1.7 683 764 11.8 25 27
Man made staple yarns 1.669 1.164 - 30.2 684 577 - 15.6 41 50
o.w. man made staple yarns,n.p.r.s.
875 756 - 13.6 587 460 - 21.6 67 61
o.w. man made staple yarns,p.r.s.
795 408 - 48.6 97 117 20.3 12 29
Woven fabrics 102.670 100.456 - 2.2 20.916 18.336 - 12.3 20 18
Silk 225 49 - 78.1 1.891 1.416 - 25.1 840 2,871
Wool 17 43 149.7 2.829 2.634 - 6.9 16,306 6,08
o.w. carded wool 1 9 992.6 1.354 1.296 - 4.3 167,142 14,64
o.w. combed wool 17 34 108.7 1.463 1.320 - 9.8 8,857 3,83
Cotton 5.571 3.305 - 40.7 4.267 3.925 - 8.0 77 119
o.w. cotton, unbleached 622 368 - 40.8 155 215 38.3 25 58
o.w. cotton, dyed 1.945 669 - 65.6 869 568 - 34.6 45 85
o.w. denim fabric 274 109 - 60.1 23 97 318.3 8 89
Other fabrics 1.178 869 - 26.3 531 525 - 1.0 45 60
o.w. flax 61 46 - 24.3 470 488 3.8 775 1,063
Synthetic and artificial fila-ment yarn
60.477 61.070 1.0 5.843 5.203 - 11.0 10 9
o.w. synthetic filament yarn 59.678 60.518 1.4 4.452 4.158 - 6.6 7 7
o.w. artificial filament yarn 799 552 - 31.0 1.390 1.044 - 24.9 174 189
Synthetic and artificialsstaple fibres
10.631 12.819 20.6 2.715 1.989 - 26.7 26 16
o.w. containing > 85% ofsynthetic 2.335 2.093 - 10.3 528 447 - 15.2 23 21
o.w. containing < 85% ofsynthetic
494 988 99.9 73 39 - 47.1 15 4
o.w. containing < 85% syn-thetic mixed natural fibres
646 846 31.0 321 91 - 71.7 50 11

8/13/2019 Euratex nr 2
http://slidepdf.com/reader/full/euratex-nr-2 174/214
BULLETIN 2013/2
174
EU27 (External Trade) Textile and Clothing Trade 2011 - 2012 (continued)Country :
TaiwanIMPORTS EXPORTS Coverage E/I
Unit : 1000 € 2011 2012 Evol. % 2011 2012 Evol. % 2011 2012
o.w. other synthetics 3.890 5.022 29.1 833 502 - 39.7 21 10
o.w. artificial staple fibres 3.267 3.869 18.4 961 911 - 5.3 29 24
Special woven fabrics 24.565 22.299 - 9.2 2.840 2.644 - 6.9 12 12
o.w. pile fabrics 461 294 - 36.2 1.119 884 - 21.0 243 301
o.w. narrow woven fabrics 11.873 11.160 - 6.0 302 478 58.0 3 4
o.w. labels, badges 2.751 2.614 - 5.0 85 87 2.0 3 3
o.w. embroidery 6.259 5.304 - 15.3 416 363 - 12.5 7 7
Knitted fabrics 26.625 26.420 - 0.8 4.401 3.305 - 24.9 17 13
Pile fabrics 2.904 3.849 32.5 210 76 - 64.1 7 2
< 30 cm; w 5% or moreelastome
267 460 72.3 173 55 - 67.9 65 12
> 30 cm; w 5% or moreelastome
4.068 4.544 11.7 1.430 1.058 - 26.0 35 23
Curtain fabrics and raschellace
3.630 3.299 - 9.1 1.543 1.300 - 15.8 43 39
Other fabrics 15.756 14.268 - 9.4 1.044 816 - 21.9 7 6
Carpets 1.393 758 - 45.6 4.178 3.068 - 26.6 300 405
Knotted carpets 15 0 - 100.0 118 117 - 0.9 770
Woven carpets 48 70 46.2 2.974 1.855 - 37.6 6,218 2,653
Tufted carpets 859 422 - 50.8 755 702 - 7.0 88 166
Carpets of felt 146 154 5.5 68 44 - 34.8 46 29
Other textiles 114.606 103.098 - 10.0 34.550 25.973 - 24.8 30 25
Wadding, felt, nonwovens,rubber thread, twine, cor-dage, etc.
12.982 15.843 22.0 12.140 6.605 - 45.6 94 42
o.w. felt 314 515 64.0 604 584 - 3.3 192 113
o.w. nonwovens 7.388 9.881 33.7 9.249 4.125 - 55.4 125 42
o.w. special yarn 632 673 6.5 99 175 76.7 16 26
o.w. twine, rope 2.121 1.807 - 14.8 500 357 - 28.5 24 20
o.w. nets 1.376 1.788 29.9 33 181 452.0 2 10
Handwoven tapestries &quilted products
51 38 - 26.3 61 10 - 83.1 119 27
Impregnated, coated, etc,,textile fabrics
27.301 27.037 - 1.0 15.729 14.571 - 7.4 58 54
o.w. tyre cord fabric 923 964 4.5 117 107 - 7.9 13 11
o.w. fabrics impregnated,coated etc,
18.033 19.825 9.9 4.068 3.769 - 7.4 23 19
o.w. textile products, articlesfor technical uses
3.302 1.934 - 41.4 9.504 8.499 - 10.6 288 439
Other made up textilearticles
25.746 25.224 - 2.0 2.661 2.186 - 17.9 10 9
o.w. sacks and bags 1.177 398 - 66.2 68 282 314.9 6 71o.w. tarpaulins, sunblinds& alike
2.416 2.682 11.0 76 117 53.9 3 4
o.w. other : floorcloths,dishcloths etc
20.663 21.842 5.7 1.513 1.264 - 16.4 7 6
Worn clothing and otherworn articles
140 60 - 56.9 661 433 - 34.4 472 717
Home textiles 17.347 16.464 - 5.1 5.051 5.065 0.3 29 31
Bedlinen, table, toilet andkitchen linen
1.819 2.132 17.2 3.956 4.068 2.8 218 191
o.w. Bedlinen, woven 437 601 37.6 3.279 3.331 1.6 751 555
o.w. toilet linen 932 1.014 8.8 489 611 24.9 52 60
o.w. table linen, woven 176 283 60.6 89 86 - 2.7 50 31
Curtains 13.158 13.052 - 0.8 428 550 28.5 3 4
Other furnishing articles 893 692 - 22.5 173 226 30.4 19 33Garments 72.530 67.830 - 6.5 121.865 144.331 18.4 168 213
Occupationals (woven) 473 647 36.7 348 729 109.6 73 113
Men’s ensembles 49 4 - 92.3 12 23 90.8 24 598
Men’s jackets 1 0 - 40.0 22 96 333.6 4,44 32,09

8/13/2019 Euratex nr 2
http://slidepdf.com/reader/full/euratex-nr-2 175/214
BULLETIN 2013/2
175
EU27 (External Trade) Textile and Clothing Trade 2011 - 2012 (continued)Country :
TaiwanIMPORTS EXPORTS Coverage E/I
Unit : 1000 € 2011 2012 Evol. % 2011 2012 Evol. % 2011 2012
Men's trousers 0 3 873.5 42 118 182.8 12,25 3,559
Men's overalls 22 36 63.0 7 13 98.8 29 36
Other men's occupationals 91 116 28.0 164 292 78.2 180 251
Women's ensembles 0 0 - 100.0 0 1 806.3 133
Women's jackets 0 0 - 83.3 30 141 364.8 50,667
Women's trousers 0 23 31 6 - 79.6 13,895 27
Women's overalls 0 0 - 100.0 2 3 107.9 3,3
Other women's occupation-nals
309 463 49.8 38 34 - 12.1 12 7
Men’s Clothing (knitted andwoven)
9.439 9.666 2.4 14.080 18.140 28.8 149 188
Overcoats 2.629 2.383 - 9.3 2.609 5.143 97.2 99 216
o.w. woven 1.737 1.585 - 8.8 2.337 4.804 105.6 135 303
Suits 40 20 - 49.6 1.501 777 - 48.2 3,795 3,902
o.w. woven 34 18 - 48.2 1.452 749 - 48.4 4,224 4,205
Ensembles 381 210 - 44.9 1.216 610 - 49.8 319 291
o.w. woven 345 176 - 48.9 1.203 606 - 49.6 349 344
Jackets and blazers 118 299 152.0 1.286 2.226 73.1 1,085 745
o.w. woven 87 156 80.4 1.114 1.913 71.6 1,286 1,224
Trousers 1.582 1.576 - 0.4 3.701 5.116 38.2 234 324
o.w. woven 737 584 - 20.7 3.534 4.964 40.5 480 850
Shirts 1.813 2.189 20.7 2.791 3.187 14.2 154 146
o.w. woven 719 1.207 67.8 1.913 2.502 30.8 266 207
Underpants, briefs, etc. 202 454 125.2 415 345 - 16.8 206 76
o.w. knitted 169 349 106.8 384 313 - 18.5 228 90
Swimwear 2.144 1.901 - 11.3 8 40 426.2 0 2
Tracksuits 388 465 19.8 193 187 - 3.0 50 40Women’s Clothing (knittedand woven)
13.005 13.159 1.2 50.401 58.995 17.1 388 448
Overcoats 1.804 1.510 - 16.3 4.319 4.942 14.4 239 327
o.w. woven 1.042 761 - 27.0 3.985 4.650 16.7 382 611
Suits 34 71 105.5 1.055 771 - 26.9 3,067 1,09
o.w. woven 25 28 15.0 1.009 703 - 30.4 4,097 2,481
Ensembles 781 596 - 23.6 6.280 4.785 - 23.8 804 802
o.w. woven 711 529 - 25.5 6.145 4.712 - 23.3 864 890
Jackets 171 212 24.2 2.341 3.776 61.2 1,371 1,78
o.w. woven 88 128 44.9 1.925 3.287 70.7 2,176 2,563
Skirts and dresses 2.816 3.721 32.2 7.519 10.786 43.4 267 290
o.w. woven 2.281 2.972 30.3 6.339 8.611 35.8 278 290
Trousers 1.837 1.983 7.9 4.968 6.730 35.5 270 339
o.w. woven 1.117 816 - 26.9 4.214 5.933 40.8 377 727
Blouses 1.047 1.121 7.1 3.684 4.683 27.1 352 418
o.w. woven 204 412 102.1 3.155 4.157 31.8 1,549 1,01
Slips, petticoats, etc. 3.113 1.844 - 40.8 424 437 2.9 14 24
o.w. knitted 2.850 1.697 - 40.4 357 386 8.2 13 23
Swimwear 538 800 48.8 65 65 0.3 12 8
Tracksuits 461 657 42.4 2.195 2.831 29.0 476 431
Others (knitted and woven) 50.048 45.002 - 10.1 57.371 67.163 17.1 115 149
Babies’ garments 500 397 - 20.5 861 1.233 43.3 172 310
o.w. knitted or crocheted 406 237 - 41.6 343 604 76.4 84 255
T-shirts 4.834 5.299 9.6 6.483 7.366 13.6 134 139
Jerseys, pullovers, cardigans 12.128 8.483 - 30.1 9.542 11.717 22.8 79 138
Special garments 4.135 3.769 - 8.9 20.845 27.200 30.5 504 722
o.w. woven 2.711 2.586 - 4.6 19.699 24.690 25.3 727 955
Other garments, knitted orcrocheted
2.537 3.051 20.2 11.285 7.725 - 31.5 445 253
Gloves 2.738 3.281 19.8 187 366 96.0 7 11

8/13/2019 Euratex nr 2
http://slidepdf.com/reader/full/euratex-nr-2 176/214
BULLETIN 2013/2
176
EU27 (External Trade) Textile and Clothing Trade 2011 - 2012 (continued)Country :
TaiwanIMPORTS EXPORTS Coverage E/I
Unit : 1000 € 2011 2012 Evol. % 2011 2012 Evol. % 2011 2012
Ties, bow ties, and cravats 833 709 - 14.8 1.444 2.176 50.7 173 307
Shawls, scarves, mufflers,mantillas, etc
1.111 1.351 21.6 2.024 2.763 36.5 182 204
Pantyhose, tights, stockings,socks, etc
10.243 9.210 - 10.1 1.030 1.447 40.4 10 16
Brassières, girdles, corsets,etc,
6.779 5.360 - 20.9 2.500 2.887 15.4 37 54
Other accessories 4.864 4.598 - 5.5 1.215 2.339 92.5 25 51
TOTAL Chapter 61 KnittedGarments
46.347 42.542 - 8.2 36.358 39.046 7.4 78 92
TOTAL Chapter 62 WovenGarments
26.184 25.331 - 3.3 85.528 104.896 22.6 327 414
Total Clothing - (CH 61+62) 72.639 67.953 - 6.5 121.886 143.941 18.1 168 212
Total Textile - (CH 50-60+ 63)
513.603 471.519 - 8.2 117.291 91.275 - 22.2 23 19
Total 586.242 539.472 - 8.0 239.177 235.216 - 1.7 41 44

8/13/2019 Euratex nr 2
http://slidepdf.com/reader/full/euratex-nr-2 177/214
BULLETIN 2013/2
177
EU27 (External Trade) Textile and Clothing Trade 2011 - 2012Country :
TaiwanIMPORTS EXPORTS Coverage E/I
Unit : Tons 2011 2012 Evol. % 2011 2012 Evol. % 2011 2012
Natural fibers 195 39 - 79.9 3.548 5.234 47.5 1,817 13,318
Silk 2 0 - 100.0 0 0 0
o.w. raw silk 2 0 - 100.0 0 0 0
Wool, fine or coarse animalhair
164 32 - 80.3 130 101 - 22.6 79 313
o.w. wool, not carded orcombed
0 0 81 68 - 16.2
o.w. wool and fine or coarseanimal hair
2 11 445.0 2 33 2066.7 75 298
Cotton 25 6 - 76.2 2.670 4.573 71.3 10,767 77,507
Other vegetable fibres 5 1 - 76.0 748 560 - 25.1 14,96 46,692
o.w. flax 0 0 748 559 - 25.2
Man-made fibres 112.321 103.614 - 7.8 823 1.036 25.9 1 1
Synthetic filament tow 135 133 - 1.3 77 44 - 42.8 57 33Artificial filament tow 1 21 2900.0 146 79 - 45.9 20,914 377
Synthetic staple fibres 111.134 102.548 - 7.7 272 623 129.2 0 1
Artificial staple fibres 4 235 6251.4 66 92 38.8 1,781 39
Yarns and Threads 40.337 37.833 - 6.2 4.720 1.601 - 66.1 12 4
Silk 0 2 1 0 - 72.7 20
Wool 23 0 - 99.1 52 48 - 9.0 225 23,8
o.w. carded wool, n.p.r.s. 0 0 10 14 41.8 13,9
o.w. combed wool, n.p.r.s. 0 0 20 16 - 20.2
Cotton 40 21 - 48.4 31 14 - 55.6 78 67
o.w. cotton yarn, n.p.r.s. 39 20 - 49.0 24 7 - 71.0 62 35
o.w. cotton yarn, p.r.s. 1 1 - 30.8 7 7 - 4.2 554 767
Other - Vegetable yarns 3 11 318.5 11 3 - 69.4 411 30
Man-made filaments yarns 39.761 37.453 - 5.8 4.483 1.500 - 66.5 11 4o.w. sewing thread 171 158 - 8.0 7 30 304.0 4 19
o.w. synthetic filament yarn 38.906 36.604 - 5.9 4.377 1.345 - 69.3 11 4
o.w. artificial filament yarn 66 10 - 84.3 8 27 228.4 12 258
o.w. synthetic monofilament 603 672 11.4 89 98 9.3 15 15
Man made staple yarns 510 346 - 32.3 142 37 - 74.2 28 11
o.w. man made staple yarns,n.p.r.s.
285 248 - 13.0 137 30 - 78.2 48 12
o.w. man made staple yarns,p.r.s.
226 98 - 56.7 5 7 45.7 2 7
Woven fabrics 15.693 15.514 - 1.1 590 549 - 6.9 4 4
Silk 4 4 5.1 10 9 - 12.6 264 220
Wool 1 4 225.0 90 74 - 18.2 7,5 1,887
o.w. carded wool 0 3 2700.0 56 48 - 14.9 56,3 1,711
o.w. combed wool 1 1 0.0 34 26 - 23.3 3,045 2,336
Cotton 507 282 - 44.4 138 112 - 18.8 27 40
o.w. cotton, unbleached 117 51 - 57.0 6 4 - 40.3 5 7
o.w. cotton, dyed 134 49 - 63.3 30 16 - 47.0 22 32
o.w. denim fabric 37 17 - 52.3 2 4 105.6 5 21
Other fabrics 91 91 - 0.1 14 8 - 39.3 15 9
o.w. flax 11 5 - 54.3 13 7 - 40.9 121 156
Synthetic and artificial fila-ment yarn
11.414 11.265 - 1.3 173 165 - 4.4 2 1
o.w. synthetic filament yarn 11.289 11.185 - 0.9 144 146 1.0 1 1
o.w. artificial filament yarn 125 79 - 36.3 29 20 - 31.4 23 25
Synthetic and artificialsstaple fibres
1.823 2.434 33.5 85 108 28.0 5 4
o.w. containing > 85% ofsynthetic 371 357 - 3.8 19 14 - 30.4 5 4
o.w. containing < 85% ofsynthetic
56 141 153.6 4 1 - 67.5 7 1
o.w. containing < 85% syn-thetic mixed natural fibres
117 139 18.4 5 3 - 28.9 4 2

8/13/2019 Euratex nr 2
http://slidepdf.com/reader/full/euratex-nr-2 178/214
BULLETIN 2013/2
178
EU27 (External Trade) Textile and Clothing Trade 2011 - 2012 (continued)Country :
TaiwanIMPORTS EXPORTS Coverage E/I
Unit : Tons 2011 2012 Evol. % 2011 2012 Evol. % 2011 2012
o.w. other synthetics 740 1.201 62.3 35 16 - 53.7 5 1
o.w. artificial staple fibres 540 596 10.5 22 74 240.4 4 12
Special woven fabrics 1.852 1.434 - 22.6 80 72 - 10.0 4 5
o.w. pile fabrics 82 48 - 41.8 44 33 - 25.1 53 68
o.w. narrow woven fabrics 1.257 1.007 - 19.9 19 17 - 8.5 2 2
o.w. labels, badges 218 138 - 36.9 0 2 700.0 0 1
o.w. embroidery 94 65 - 31.5 5 5 - 0.0 5 8
Knitted fabrics 4.584 3.876 - 15.5 188 133 - 29.0 4 3
Pile fabrics 568 761 34.1 9 3 - 68.5 2 0
< 30 cm; w 5% or moreelastome
46 74 59.5 23 1 - 94.8 50 2
> 30 cm; w 5% or moreelastome
485 545 12.4 46 31 - 31.6 9 6
Curtain fabrics and raschellace
507 424 - 16.4 65 57 - 11.7 13 13
Other fabrics 2.979 2.072 - 30.4 45 41 - 9.2 1 2
Carpets 555 233 - 57.9 675 435 - 35.6 122 186
Knotted carpets 2 0 - 100.0 2 1 - 35.0 91
Woven carpets 8 17 112.5 471 277 - 41.3 5,884 1,626
Tufted carpets 367 152 - 58.5 107 79 - 26.1 29 52
Carpets of felt 39 40 3.4 12 11 - 10.2 31 27
Other textiles 50.953 40.788 - 19.9 4.387 2.310 - 47.3 9 6
Wadding, felt, nonwovens,rubber thread, twine, cor-dage, etc.
2.305 2.556 10.9 1.997 811 - 59.4 87 32
o.w. felt 39 76 95.6 66 44 - 34.1 169 57
o.w. nonwovens 1.484 1.821 22.7 1.626 544 - 66.6 110 30
o.w. special yarn 69 58 - 15.0 2 5 160.0 3 9
o.w. twine, rope 183 177 - 3.3 51 36 - 30.4 28 20
o.w. nets 332 289 - 12.9 23 95 312.7 7 33
Handwoven tapestries &quilted products
5 2 - 58.3 2 0 - 95.7 48 5
Impregnated, coated, etc,,textile fabrics
5.566 4.349 - 21.9 896 734 - 18.1 16 17
o.w. tyre cord fabric 215 199 - 7.6 23 2 - 91.8 11 1
o.w. fabrics impregnated,coated etc,
3.484 2.987 - 14.3 384 350 - 8.8 11 12
o.w. textile products, articlesfor technical uses
1.070 515 - 51.9 328 233 - 29.1 31 45
Other made up textilearticles
4.168 2.891 - 30.6 892 187 - 79.0 21 6
o.w. sacks and bags 319 76 - 76.2 25 10 - 60.7 8 13o.w. tarpaulins, sunblinds& alike
335 226 - 32.5 5 8 78.3 1 4
o.w. other : floorcloths,dishcloths etc
3.341 2.553 - 23.6 38 31 - 17.3 1 1
Worn clothing and otherworn articles
20 12 - 39.7 814 137 - 83.2 4,089 1,143
Home textiles 2.492 2.085 - 16.3 137 127 - 7.4 5 6
Bedlinen, table, toilet andkitchen linen
199 201 0.9 92 97 5.0 46 48
o.w. Bedlinen, woven 51 57 11.0 61 61 0.8 118 108
o.w. toilet linen 84 77 - 8.1 28 33 19.6 33 43
o.w. table linen, woven 36 44 22.7 3 2 - 36.0 7 4
Curtains 2.036 1.767 - 13.2 14 22 61.2 1 1
Other furnishing articles 7461 - 17.2 14 5 - 67.8 19 8
Garments 3.713 3.016 - 18.8 994 1.203 21.0 27 40
Occupationals (woven) 24 33 39.2 5 7 30.8 22 21
Men’s ensembles 1 0 - 88.9 0 0 300.0 11 400

8/13/2019 Euratex nr 2
http://slidepdf.com/reader/full/euratex-nr-2 179/214
BULLETIN 2013/2
179
EU27 (External Trade) Textile and Clothing Trade 2011 - 2012 (continued)Country :
TaiwanIMPORTS EXPORTS Coverage E/I
Unit : Tons 2011 2012 Evol. % 2011 2012 Evol. % 2011 2012
Men's jackets 0 0 - 100.0 1 1 180.0 500
Men's trousers 0 0 1 1 12.5
Men's overalls 1 2 112.5 0 0 0 6
Other men's occupationals 5 10 102.0 3 3 - 10.3 58 26
Women's ensembles 0 0 0 0
Women's jackets 0 0 0 0 100.0
Women's trousers 0 1 1100.0 0 0 - 100.0 200 0
Women's overalls 0 0 0 0
Other women's occupation-nals
17 20 18.5 1 1 80.0 3 5
Men’s Clothing (knitted andwoven)
492 394 - 20.1 169 265 56.6 34 67
Overcoats 109 80 - 26.8 42 64 52.9 38 80
o.w. woven 75 51 - 32.0 37 59 57.2 50 116Suits 4 0 - 100.0 7 3 - 64.8 161
o.w. woven 4 0 - 100.0 7 3 - 63.2 162
Ensembles 24 13 - 43.9 5 4 - 18.8 20 29
o.w. woven 22 11 - 52.7 5 4 - 15.2 21 37
Jackets and blazers 3 10 255.6 13 29 121.5 481 300
o.w. woven 1 4 192.3 11 24 109.8 862 618
Trousers 59 49 - 18.0 56 108 94.8 94 223
o.w. woven 30 19 - 37.0 54 105 94.6 180 557
Shirts 157 95 - 39.1 35 47 33.2 22 49
o.w. woven 30 55 82.5 23 37 63.4 75 67
Underpants, briefs, etc. 9 38 344.7 6 5 - 14.3 74 14
o.w. knitted 8 35 364.5 6 4 - 35.7 74 10
Swimwear 102 79 - 23.0 0 0 0 1Tracksuits 19 19 - 1.6 2 1 - 55.6 9 4
Women’s Clothing (knittedand woven)
507 495 - 2.5 331 409 23.6 65 83
Overcoats 71 53 - 26.4 38 41 7.9 53 78
o.w. woven 35 20 - 43.2 34 38 10.3 98 190
Suits 1 4 171.4 8 4 - 53.2 564 97
o.w. woven 1 1 - 50.0 7 4 - 51.4 617 600
Ensembles 38 31 - 17.5 33 24 - 28.0 87 76
o.w. woven 36 29 - 19.9 32 24 - 27.5 90 81
Jackets 7 4 - 50.7 16 25 57.5 219 700
o.w. woven 3 1 - 51.7 14 23 64.5 476 1,621
Skirts and dresses 80 85 5.9 32 68 109.0 40 80
o.w. woven 55 56 2.6 25 48 95.5 45 86
Trousers 83 90 7.4 82 111 34.5 99 123
o.w. woven 51 32 - 36.5 69 96 38.8 136 297
Blouses 47 39 - 17.3 18 35 99.4 38 90
o.w. woven 6 12 106.9 16 29 87.3 271 245
Slips, petticoats, etc. 97 61 - 36.8 6 4 - 26.8 6 7
o.w. knitted 89 57 - 36.0 4 4 - 18.2 5 6
Swimwear 27 53 99.3 0 0 33.3 1 1
Tracksuits 37 52 39.9 11 13 16.8 29 24
Others (knitted and woven) 2.711 2.128 - 21.5 494 529 7.0 18 25
Babies’ garments 23 20 - 12.5 18 14 - 24.2 77 67
o.w. knitted or crocheted 18 14 - 25.1 9 10 6.7 49 70
T-shirts 209 214 2.8 89 126 41.0 43 59
Jerseys, pullovers, cardigans 650 377 - 41.9 87 127 46.4 13 34
Special garments 234 220 - 5.8 113 127 12.2 48 58
o.w. woven 160 177 10.6 105 118 12.5 66 67
Other garments, knitted orcrocheted
126 125 - 0.7 112 46 - 58.7 89 37

8/13/2019 Euratex nr 2
http://slidepdf.com/reader/full/euratex-nr-2 180/214
BULLETIN 2013/2
180
EU27 (External Trade) Textile and Clothing Trade 2011 - 2012 (continued)Country :
TaiwanIMPORTS EXPORTS Coverage E/I
Unit : Tons 2011 2012 Evol. % 2011 2012 Evol. % 2011 2012
Gloves 298 234 - 21.6 2 4 105.3 1 2
Ties, bow ties, and cravats 38 25 - 35.7 6 5 - 5.5 14 21
Shawls, scarves, mufflers,mantillas, etc
50 62 23.8 16 19 20.4 31 30
Pantyhose, tights, stockings,socks, etc
644 485 - 24.7 16 23 44.6 2 5
Brassières, girdles, corsets,etc,
197 157 - 20.3 25 23 - 8.1 13 15
Other accessories 274 225 - 18.2 12 17 36.3 5 8
TOTAL Chapter 61 KnittedGarments
2.614 2.018 - 22.8 390 427 9.5 15 21
TOTAL Chapter 62 WovenGarments
1.100 1.001 - 9.0 604 773 27.9 55 77
Total Clothing - (CH 61+62) 3.714 3.019 - 18.7 995 1.200 20.7 27 40
Total Textile - (CH 50-60+ 63)
227.130 203.982 - 10.2 21.886 16.019 - 26.8 10 8
Total 230.843 207.001 - 10.3 22.881 17.220 - 24.7 10 8

8/13/2019 Euratex nr 2
http://slidepdf.com/reader/full/euratex-nr-2 181/214
BULLETIN 2013/2
181
EU27 (External Trade) Textile and Clothing Trade 2011 - 2012Country :
ThailandIMPORTS EXPORTS Coverage E/I
Unit : 1000 € 2011 2012 Evol. % 2011 2012 Evol. % 2011 2012
Natural fibers 7.661 3.739 - 51.2 2.295 3.286 43.2 30 88
Silk 1 0 - 86.2 0 3 0 1,678
o.w. raw silk 1 0 - 95.4 0 0 0 0
Wool, fine or coarse animalhair
1.002 206 - 79.5 1.107 598 - 46.0 111 291
o.w. wool, not carded orcombed
0 0 66 58 - 12.8
o.w. wool and fine or coarseanimal hair
235 177 - 24.8 1.041 540 - 48.1 442 305
Cotton 6.570 3.480 - 47.0 1.082 2.597 140.0 16 75
Other vegetable fibres 87 53 - 38.7 106 88 - 16.9 122 165
o.w. flax 0 0 98 88 - 9.7
Man-made fibres 46.420 33.445 - 28.0 912 816 - 10.5 2 2
Synthetic filament tow 101 239 137.5 8 87 961.7 8 36
Artificial filament tow 0 8 0 20 258
Synthetic staple fibres 34.291 22.548 - 34.2 647 611 - 5.5 2 3
Artificial staple fibres 11.998 10.577 - 11.8 140 0 - 100.0 1 0
Yarns and Threads 101.809 51.498 - 49.4 18.790 20.568 9.5 18 40
Silk 74 68 - 8.4 8 3 - 66.3 10 4
Wool 31.950 4.543 - 85.8 3.013 3.135 4.1 9 69
o.w. carded wool, n.p.r.s. 105 0 - 100.0 2.459 2.696 9.6 2,343
o.w. combed wool, n.p.r.s. 31.840 4.543 - 85.7 332 100 - 69.9 1 2
Cotton 6.961 2.939 - 57.8 1.002 1.072 7.1 14 36
o.w. cotton yarn, n.p.r.s. 6.829 2.826 - 58.6 877 948 8.1 13 34
o.w. cotton yarn, p.r.s. 132 113 - 14.5 125 124 - 0.5 95 110
Other - Vegetable yarns 81 33 - 59.1 39 54 39.8 48 164
Man-made filaments yarns 48.133 37.048 - 23.0 14.115 15.605 10.6 29 42
o.w. sewing thread 568 271 - 52.3 1.017 901 - 11.4 179 333
o.w. synthetic filament yarn 46.052 35.601 - 22.7 12.217 13.775 12.8 27 39
o.w. artificial filament yarn 404 157 - 61.1 136 123 - 9.6 34 78
o.w. synthetic monofilament 1.103 1.014 - 8.1 717 777 8.3 65 77
Man made staple yarns 14.610 6.868 - 53.0 615 700 13.9 4 10
o.w. man made staple yarns,n.p.r.s.
12.804 5.727 - 55.3 348 437 25.6 3 8
o.w. man made staple yarns,p.r.s.
1.806 1.140 - 36.9 266 262 - 1.5 15 23
Woven fabrics 110.772 94.455 - 14.7 46.900 48.966 4.4 42 52
Silk 2.272 1.891 - 16.8 665 642 - 3.5 29 34
Wool 9 67 648.9 14.848 15.435 4.0 166,089 23,055
o.w. carded wool 5 38 713.0 10.766 9.718 - 9.7 232,532 25,818
o.w. combed wool 4 29 580.0 4.075 5.715 40.2 94,555 19,5Cotton 49.215 42.965 - 12.7 8.369 8.269 - 1.2 17 19
o.w. cotton, unbleached 17.560 12.148 - 30.8 502 754 50.2 3 6
o.w. cotton, dyed 6.368 5.609 - 11.9 1.150 926 - 19.5 18 17
o.w. denim fabric 855 524 - 38.7 31 63 105.9 4 12
Other fabrics 1.298 1.280 - 1.4 1.714 1.680 - 2.0 132 131
o.w. flax 1.265 1.218 - 3.8 1.674 1.640 - 2.0 132 135
Synthetic and artificial fila-ment yarn
16.765 11.406 - 32.0 6.317 7.031 11.3 38 62
o.w. synthetic filament yarn 16.638 11.352 - 31.8 5.352 6.218 16.2 32 55
o.w. artificial filament yarn 127 54 - 57.7 965 812 - 15.8 760 1,511
Synthetic and artificialsstaple fibres
23.751 20.407 - 14.1 5.394 5.133 - 4.8 23 25
o.w. containing > 85% of
synthetic 781 559 - 28.5 1.295 1.164 - 10.1 166 208
o.w. containing < 85% ofsynthetic
10.147 8.575 - 15.5 148 127 - 14.7 1 1

8/13/2019 Euratex nr 2
http://slidepdf.com/reader/full/euratex-nr-2 182/214
BULLETIN 2013/2
182
EU27 (External Trade) Textile and Clothing Trade 2011 - 2012 (continued)Country :
ThailandIMPORTS EXPORTS Coverage E/I
Unit : 1000 € 2011 2012 Evol. % 2011 2012 Evol. % 2011 2012
o.w. containing < 85% syn-thetic mixed natural fibres
11.956 10.286 - 14.0 2.486 2.329 - 6.3 21 23
o.w. other synthetics 443 538 21.5 295 567 92.3 67 105
o.w. artificial staple fibres 424 449 5.9 1.169 947 - 19.0 276 211
Special woven fabrics 17.460 16.410 - 6.0 9.591 10.777 12.4 55 66
o.w. pile fabrics 35 54 52.7 1.065 1.011 - 5.0 3,011 1,873
o.w. narrow woven fabrics 6.278 5.570 - 11.3 4.091 4.212 2.9 65 76
o.w. labels, badges 1.678 1.757 4.7 1.238 1.158 - 6.5 74 66
o.w. embroidery 4.761 4.138 - 13.1 915 800 - 12.5 19 19
Knitted fabrics 4.030 5.487 36.2 8.671 9.985 15.1 215 182
Pile fabrics 1.126 1.072 - 4.8 731 1.682 130.0 65 157
< 30 cm; w 5% or moreelastome
145 253 74.2 496 119 - 76.1 341 47
> 30 cm; w 5% or moreelastome
134 432 222.7 3.165 4.072 28.7 2,363 942
Curtain fabrics and raschellace
1.248 2.485 99.0 2.563 2.731 6.6 205 110
Other fabrics 1.376 1.246 - 9.5 1.716 1.380 - 19.6 125 111
Carpets 7.884 7.808 - 1.0 1.825 2.853 56.3 23 37
Knotted carpets 371 315 - 15.1 27 107 301.2 7 34
Woven carpets 443 296 - 33.2 862 1.775 105.9 195 600
Tufted carpets 6.734 7.027 4.4 865 887 2.5 13 13
Carpets of felt 147 3 - 97.9 0 2 0 59
Other textiles 58.366 64.091 9.8 59.646 60.906 2.1 102 95
Wadding, felt, nonwovens,rubber thread, twine, cor-dage, etc.
13.545 11.934 - 11.9 22.648 24.138 6.6 167 202
o.w. felt 1.168 453 - 61.2 395 380 - 3.7 34 84o.w. nonwovens 4.441 3.657 - 17.6 8.853 9.903 11.9 199 271
o.w. special yarn 60 30 - 50.3 316 403 27.4 526 1,349
o.w. twine, rope 215 232 7.9 577 897 55.5 268 387
o.w. nets 4.992 5.238 4.9 58 200 247.6 1 4
Handwoven tapestries &quilted products
4 0 - 91.2 32 65 102.9 903 20,923
Impregnated, coated, etc,,textile fabrics
7.054 7.212 2.3 28.253 27.001 - 4.4 401 374
o.w. tyre cord fabric 86 22 - 74.7 1.950 2.337 19.9 2,277 10,789
o.w. fabrics impregnated,coated etc,
4.738 5.703 20.4 6.516 7.320 12.3 138 128
o.w. textile products, articlesfor technical uses
1.890 988 - 47.7 10.562 10.436 - 1.2 559 1,056
Other made up textilearticles 34.796 36.269 4.2 3.587 3.211 - 10.5 10 9
o.w. sacks and bags 12.674 11.560 - 8.8 1.266 891 - 29.6 10 8
o.w. tarpaulins, sunblinds& alike
724 604 - 16.6 373 278 - 25.5 51 46
o.w. other : floorcloths,dishcloths etc
21.065 23.922 13.6 1.302 1.268 - 2.7 6 5
Worn clothing and otherworn articles
316 134 - 57.7 619 695 12.2 196 519
Home textiles 15.244 14.899 - 2.3 1.397 1.498 7.3 9 10
Bedlinen, table, toilet andkitchen linen
2.108 1.407 - 33.3 406 383 - 5.5 19 27
o.w. Bedlinen, woven 727 576 - 20.7 246 266 8.0 34 46
o.w. toilet linen 1.107 597 - 46.1 59 70 18.6 5 12
o.w. table linen, woven 151 177 17.5 47 21 - 54.5 31 12
Curtains 352 272 - 22.8 798 813 1.9 227 300
Other furnishing articles 1.550 1.426 - 8.0 118 180 52.7 8 13
Garments 691.000 616.006 - 10.9 44.235 52.941 19.7 6 9

8/13/2019 Euratex nr 2
http://slidepdf.com/reader/full/euratex-nr-2 183/214
BULLETIN 2013/2
183
EU27 (External Trade) Textile and Clothing Trade 2011 - 2012 (continued)Country :
ThailandIMPORTS EXPORTS Coverage E/I
Unit : 1000 € 2011 2012 Evol. % 2011 2012 Evol. % 2011 2012
Occupationals (woven) 10.915 11.605 6.3 677 667 - 1.4 6 6
Men's ensembles 444 550 24.0 3 51 1445.6 1 9
Men's jackets 532 580 8.9 7 5 - 33.7 1 1
Men's trousers 2.584 2.925 13.2 32 10 - 70.2 1 0
Men's overalls 66 151 129.1 1 7 905.7 1 5
Other men's occupationals 5.126 4.950 - 3.4 137 46 - 66.7 3 1
Women's ensembles 182 3 - 98.6 22 56 152.9 12 2,162
Women's jackets 102 115 12.3 2 0 - 72.4 2 0
Women's trousers 416 658 58.0 17 0 - 100.0 4 0
Women's overalls 0 6 1 0 - 100.0 0
Other women's occupation-nals
1.463 1.667 14.0 456 493 8.2 31 30
Men’s Clothing (knitted and
woven)149.657 139.546 - 6.8 9.314 11.009 18.2 6 8
Overcoats 17.075 13.428 - 21.4 598 454 - 24.0 3 3
o.w. woven 13.633 9.878 - 27.5 546 403 - 26.3 4 4
Suits 1.215 1.615 32.9 505 516 2.1 42 32
o.w. woven 1.156 1.573 36.1 502 516 2.7 43 33
Ensembles 917 1.417 54.5 107 187 74.8 12 13
o.w. woven 616 800 29.8 104 178 70.8 17 22
Jackets and blazers 2.968 2.676 - 9.8 735 1.135 54.4 25 42
o.w. woven 2.503 1.886 - 24.6 645 990 53.5 26 52
Trousers 54.345 51.220 - 5.8 4.418 4.357 - 1.4 8 9
o.w. woven 47.968 43.047 - 10.3 4.180 4.178 - 0.0 9 10
Shirts 48.356 43.997 - 9.0 2.231 3.730 67.2 5 8
o.w. woven 21.386 18.062 - 15.5 1.585 2.694 69.9 7 15
Underpants, briefs, etc. 15.921 17.771 11.6 263 280 6.4 2 2o.w. knitted 14.246 15.909 11.7 252 251 - 0.4 2 2
Swimwear 2.248 1.350 - 40.0 135 109 - 19.2 6 8
Tracksuits 1.418 858 - 39.5 40 129 222.2 3 15
Women’s Clothing (knittedand woven)
173.132 148.123 - 14.4 19.911 24.347 22.3 12 16
Overcoats 18.524 11.488 - 38.0 563 831 47.6 3 7
o.w. woven 10.496 6.052 - 42.3 482 750 55.7 5 12
Suits 440 328 - 25.4 78 66 - 15.3 18 20
o.w. woven 306 200 - 34.9 69 55 - 20.4 22 27
Ensembles 1.522 1.072 - 29.6 1.158 1.067 - 7.8 76 100
o.w. woven 1.186 594 - 49.9 946 1.065 12.5 80 179
Jackets 1.258 1.905 51.5 911 1.140 25.1 72 60
o.w. woven 870 1.471 69.0 861 1.038 20.5 99 71
Skirts and dresses 24.441 21.134 - 13.5 4.850 5.658 16.7 20 27
o.w. woven 15.155 13.939 - 8.0 3.648 4.036 10.6 24 29
Trousers 58.760 58.918 0.3 4.065 5.731 41.0 7 10
o.w. woven 30.511 38.475 26.1 3.692 5.194 40.7 12 13
Blouses 24.193 19.574 - 19.1 3.826 5.264 37.6 16 27
o.w. woven 7.215 5.864 - 18.7 3.399 4.478 31.7 47 76
Slips, petticoats, etc. 33.318 25.492 - 23.5 966 148 - 84.7 3 1
o.w. knitted 32.371 24.826 - 23.3 131 102 - 22.5 0 0
Swimwear 4.985 3.909 - 21.6 85 63 - 26.2 2 2
Tracksuits 4.064 2.319 - 42.9 643 1.341 108.5 16 58
Others (knitted and woven) 368.210 328.331 - 10.8 15.005 17.572 17.1 4 5
Babies’ garments 32.718 25.587 - 21.8 109 224 105.0 0 1
o.w. knitted or crocheted 23.932 18.173 - 24.1 74 136 83.3 0 1
T-shirts 94.295 102.044 8.2 4.752 5.214 9.7 5 5
Jerseys, pullovers, cardigans 109.893 90.939 - 17.2 2.629 3.003 14.2 2 3
Special garments 41.870 37.060 - 11.5 1.864 2.106 13.0 4 6
o.w. woven 19.755 21.641 9.5 1.809 2.034 12.4 9 9

8/13/2019 Euratex nr 2
http://slidepdf.com/reader/full/euratex-nr-2 184/214
BULLETIN 2013/2
184
EU27 (External Trade) Textile and Clothing Trade 2011 - 2012 (continued)Country :
ThailandIMPORTS EXPORTS Coverage E/I
Unit : 1000€
2011 2012 Evol. % 2011 2012 Evol. % 2011 2012Other garments, knitted orcrocheted
3.803 5.034 32.4 319 641 101.0 8 13
Gloves 1.789 1.425 - 20.4 62 82 33.3 3 6
Ties, bow ties, and cravats 460 1.029 123.7 839 875 4.3 182 85
Shawls, scarves, mufflers,mantillas, etc
1.518 1.176 - 22.5 510 716 40.4 34 61
Pantyhose, tights, stockings,socks, etc
6.653 7.448 12.0 311 388 24.8 5 5
Brassières, girdles, corsets,etc,
68.320 51.783 - 24.2 1.223 1.881 53.8 2 4
Other accessories 2.309 3.530 52.9 2.707 2.713 0.2 117 77
TOTAL Chapter 61 KnittedGarments
422.371 377.455 - 10.6 12.875 14.958 16.2 3 4
TOTAL Chapter 62 Woven
Garments 268.656 238.931 - 11.1 31.360 37.982 21.1 12 16
Total Clothing - (CH 61+62) 692.587 617.194 - 10.9 44.235 52.941 19.7 6 9
Total Textile - (CH 50-60+ 63)
354.143 280.799 - 20.7 150.417 161.885 7.6 42 58
Total 1.046.729 897.993 - 14.2 194.652 214.825 10.4 19 24

8/13/2019 Euratex nr 2
http://slidepdf.com/reader/full/euratex-nr-2 185/214
BULLETIN 2013/2
185
EU27 (External Trade) Textile and Clothing Trade 2011 - 2012Country :
ThailandIMPORTS EXPORTS Coverage E/I
Unit : Tons 2011 2012 Evol. % 2011 2012 Evol. % 2011 2012
Natural fibers 4.465 2.887 - 35.4 683 1.970 188.4 15 68
Silk 0 0 0 0
o.w. raw silk 0 0 0 0
Wool, fine or coarse animalhair
200 22 - 89.2 107 76 - 29.1 54 350
o.w. wool, not carded orcombed
0 0 24 24 0.0
o.w. wool and fine or coarseanimal hair
30 14 - 52.7 83 52 - 37.5 280 371
Cotton 4.095 2.751 - 32.8 529 1.858 251.5 13 68
Other vegetable fibres 171 114 - 33.1 48 36 - 24.0 28 32
o.w. flax 0 0 44 36 - 17.0
Man-made fibres 29.362 23.609 - 19.6 259 194 - 25.0 1 1
Synthetic filament tow 40 64 60.3 0 26 12950.0 1 41Artificial filament tow 0 1 0 1 38
Synthetic staple fibres 23.577 17.142 - 27.3 187 136 - 27.5 1 1
Artificial staple fibres 5.724 6.372 11.3 39 0 - 100.0 1 0
Yarns and Threads 30.301 20.584 - 32.1 3.767 3.955 5.0 12 19
Silk 2 2 - 6.3 0 0 - 100.0 25 0
Wool 1.844 249 - 86.5 580 516 - 11.0 31 208
o.w. carded wool, n.p.r.s. 13 0 - 100.0 509 496 - 2.5 4,07
o.w. combed wool, n.p.r.s. 1.831 249 - 86.4 63 4 - 93.5 3 2
Cotton 1.529 686 - 55.1 71 71 0.7 5 10
o.w. cotton yarn, n.p.r.s. 1.522 667 - 56.2 63 67 5.0 4 10
o.w. cotton yarn, p.r.s. 7 19 192.4 7 5 - 36.5 112 24
Other - Vegetable yarns 48 15 - 69.6 3 2 - 27.6 6 14
Man-made filaments yarns 22.206 17.351 - 21.9 3.059 3.311 8.3 14 19o.w. sewing thread 97 43 - 55.1 55 45 - 18.5 57 104
o.w. synthetic filament yarn 21.715 17.112 - 21.2 2.783 3.033 9.0 13 18
o.w. artificial filament yarn 132 23 - 83.0 7 6 - 16.9 5 26
o.w. synthetic monofilament 261 173 - 33.7 211 225 6.9 81 130
Man made staple yarns 4.672 2.282 - 51.2 54 54 0.6 1 2
o.w. man made staple yarns,n.p.r.s.
4.200 2.007 - 52.2 33 36 9.5 1 2
o.w. man made staple yarns,p.r.s.
472 275 - 41.8 21 19 - 13.1 5 7
Woven fabrics 17.808 14.740 - 17.2 3.098 2.885 - 6.9 17 20
Silk 34 26 - 23.2 7 9 27.1 21 34
Wool 0 2 700.0 1.185 1.005 - 15.2 592,65 62,838
o.w. carded wool 0 1 1.084 875 - 19.3 67,3
o.w. combed wool 0 0 50.0 101 130 28.9 50,6 43,467
Cotton 7.854 6.648 - 15.4 386 417 8.1 5 6
o.w. cotton, unbleached 3.661 2.625 - 28.3 28 66 132.6 1 2
o.w. cotton, dyed 711 652 - 8.2 49 40 - 18.9 7 6
o.w. denim fabric 129 74 - 42.8 3 12 396.0 2 17
Other fabrics 84 81 - 2.6 127 79 - 37.8 152 97
o.w. flax 67 57 - 16.0 126 78 - 37.8 187 138
Synthetic and artificial fila-ment yarn
3.104 1.913 - 38.4 407 473 16.1 13 25
o.w. synthetic filament yarn 3.088 1.910 - 38.2 358 431 20.2 12 23
o.w. artificial filament yarn 16 3 - 81.8 49 42 - 13.7 308 1,455
Synthetic and artificialsstaple fibres
5.460 5.104 - 6.5 702 577 - 17.9 13 11
o.w. containing > 85% of
synthetic 124 110 - 10.8 143 61 - 57.4 116 55
o.w. containing < 85% ofsynthetic
1.955 1.618 - 17.2 6 15 159.3 0 1

8/13/2019 Euratex nr 2
http://slidepdf.com/reader/full/euratex-nr-2 186/214
BULLETIN 2013/2
186
EU27 (External Trade) Textile and Clothing Trade 2011 - 2012 (continued)Country :
ThailandIMPORTS EXPORTS Coverage E/I
Unit : Tons 2011 2012 Evol. % 2011 2012 Evol. % 2011 2012
o.w. containing < 85% syn-thetic mixed natural fibres
3.282 3.276 - 0.2 447 406 - 9.0 14 12
o.w. other synthetics 34 35 4.5 14 32 138.2 40 92
o.w. artificial staple fibres 65 65 - 1.1 93 62 - 33.5 143 96
Special woven fabrics 1.272 964 - 24.2 283 325 14.6 22 34
o.w. pile fabrics 1 2 130.0 48 36 - 25.7 4,83 1,561
o.w. narrow woven fabrics 841 632 - 24.8 194 214 10.5 23 34
o.w. labels, badges 23 30 30.5 9 8 - 7.0 38 27
o.w. embroidery 185 158 - 14.8 14 3 - 79.6 8 2
Knitted fabrics 1.316 822 - 37.6 394 438 11.2 30 53
Pile fabrics 953 274 - 71.2 53 89 67.2 6 32
< 30 cm; w 5% or moreelastome
5 11 145.7 10 2 - 76.9 226 21
> 30 cm; w 5% or moreelastome
9 24 175.9 94 118 25.9 1,08 493
Curtain fabrics and raschellace
115 350 204.1 109 148 36.0 95 42
Other fabrics 234 162 - 30.8 127 80 - 36.9 54 50
Carpets 576 439 - 23.7 235 267 13.5 41 61
Knotted carpets 32 21 - 34.3 1 1 9.1 3 6
Woven carpets 28 13 - 53.5 106 135 27.3 372 1,02
Tufted carpets 423 394 - 6.7 104 117 12.3 25 30
Carpets of felt 65 0 - 99.5 0 0 0 0
Other textiles 13.353 14.997 12.3 5.651 6.096 7.9 42 41
Wadding, felt, nonwovens,rubber thread, twine, cor-dage, etc.
2.682 2.007 - 25.2 2.636 2.778 5.4 98 138
o.w. felt 201 55 - 72.9 29 40 39.9 14 73o.w. nonwovens 1.201 832 - 30.7 1.510 1.633 8.1 126 196
o.w. special yarn 14 4 - 71.1 22 30 38.5 154 737
o.w. twine, rope 29 28 - 3.4 65 99 53.2 221 351
o.w. nets 667 615 - 7.8 5 15 206.3 1 2
Handwoven tapestries &quilted products
0 0 - 100.0 2 3 47.8 767
Impregnated, coated, etc,,textile fabrics
709 789 11.3 1.475 1.676 13.6 208 213
o.w. tyre cord fabric 4 1 - 77.8 217 233 7.5 6,028 29,163
o.w. fabrics impregnated,coated etc,
645 732 13.5 332 691 108.2 51 94
o.w. textile products, articlesfor technical uses
30 28 - 6.0 345 343 - 0.3 1,145 1,213
Other made up textilearticles 8.410 7.622 - 9.4 469 376 - 19.8 6 5
o.w. sacks and bags 5.169 4.268 - 17.4 192 118 - 38.4 4 3
o.w. tarpaulins, sunblinds& alike
38 23 - 41.0 24 20 - 18.1 62 86
o.w. other : floorcloths,dishcloths etc
2.951 3.204 8.6 78 85 9.9 3 3
Worn clothing and otherworn articles
251 126 - 49.9 175 149 - 14.6 70 119
Home textiles 2.945 2.854 - 3.1 41 38 - 6.9 1 1
Bedlinen, table, toilet andkitchen linen
276 158 - 42.6 10 10 - 5.0 4 6
o.w. Bedlinen, woven 69 44 - 36.7 3 5 66.7 4 11
o.w. toilet linen 165 74 - 54.8 2 2 5.6 1 3
o.w. table linen, woven 15 27 76.8 3 1 - 54.8 21 5
Curtains 20 18 - 8.2 23 19 - 17.9 117 105
Other furnishing articles 149 135 - 9.4 6 3 - 47.5 4 2
Garments 31.579 25.507 - 19.2 683 747 9.4 2 3

8/13/2019 Euratex nr 2
http://slidepdf.com/reader/full/euratex-nr-2 187/214
BULLETIN 2013/2
187
EU27 (External Trade) Textile and Clothing Trade 2011 - 2012 (continued)Country :
ThailandIMPORTS EXPORTS Coverage E/I
Unit : Tons 2011 2012 Evol. % 2011 2012 Evol. % 2011 2012
Occupationals (woven) 797 787 - 1.3 23 21 - 9.4 3 3
Men's ensembles 15 15 - 0.6 0 2 1800.0 1 12
Men's jackets 43 55 26.2 0 0 - 50.0 0 0
Men's trousers 221 213 - 3.4 1 0 - 90.9 0 0
Men's overalls 3 7 148.3 0 0 0 3
Other men's occupationals 373 326 - 12.5 2 0 - 82.6 1 0
Women's ensembles 9 1 - 93.4 0 0 0 0
Women's jackets 4 6 43.2 0 0 0 0
Women's trousers 34 53 55.1 0 0 - 100.0 0 0
Women's overalls 0 0 0 0 0
Other women's occupation-nals
93 109 17.2 20 19 - 5.6 21 17
Men’s Clothing (knitted and
woven)7.478 6.044 - 19.2 127 147 16.0 2 2
Overcoats 474 378 - 20.3 11 4 - 58.5 2 1
o.w. woven 327 227 - 30.4 10 4 - 60.4 3 2
Suits 30 26 - 14.1 5 11 140.0 15 42
o.w. woven 29 25 - 13.1 5 11 140.0 16 43
Ensembles 70 97 38.4 2 4 118.8 2 4
o.w. woven 33 51 52.9 2 3 126.7 5 7
Jackets and blazers 103 110 6.7 7 9 18.9 7 8
o.w. woven 82 81 - 2.2 5 7 37.3 6 9
Trousers 3.505 2.660 - 24.1 63 72 14.4 2 3
o.w. woven 2.994 2.219 - 25.9 61 71 15.9 2 3
Shirts 1.988 1.529 - 23.1 30 40 34.1 2 3
o.w. woven 814 578 - 29.0 19 27 42.8 2 5
Underpants, briefs, etc. 787 842 7.1 4 4 10.3 0 1o.w. knitted 692 738 6.7 4 4 0.0 1 1
Swimwear 77 36 - 52.9 1 1 - 35.7 2 2
Tracksuits 71 35 - 50.4 1 2 100.0 1 5
Women’s Clothing (knittedand woven)
7.451 5.811 - 22.0 257 280 8.9 3 5
Overcoats 671 390 - 41.8 6 8 25.4 1 2
o.w. woven 276 147 - 46.7 6 7 22.4 2 5
Suits 36 23 - 37.5 0 0 - 25.0 1 1
o.w. woven 19 13 - 31.3 0 0 50.0 1 2
Ensembles 93 68 - 26.5 8 5 - 41.0 9 7
o.w. woven 69 34 - 50.9 7 5 - 25.8 10 14
Jackets 49 59 22.1 10 12 24.0 20 20
o.w. woven 31 48 51.4 9 11 17.4 29 23
Skirts and dresses 1.162 901 - 22.5 57 58 2.7 5 6
o.w. woven 747 620 - 17.1 40 35 - 12.5 5 6
Trousers 2.857 2.376 - 16.8 70 95 35.8 2 4
o.w. woven 1.366 1.413 3.4 64 85 33.3 5 6
Blouses 942 708 - 24.9 34 53 56.2 4 7
o.w. woven 260 201 - 22.5 28 42 52.0 11 21
Slips, petticoats, etc. 1.248 983 - 21.3 32 5 - 85.8 3 0
o.w. knitted 1.210 959 - 20.8 14 4 - 74.3 1 0
Swimwear 129 90 - 30.5 1 1 - 46.2 1 1
Tracksuits 159 89 - 44.3 7 12 79.4 4 14
Others (knitted and woven) 16.651 13.652 - 18.0 300 320 6.9 2 2
Babies’ garments 1.425 925 - 35.1 3 4 35.7 0 0
o.w. knitted or crocheted 1.107 716 - 35.4 3 3 17.9 0 0
T-shirts 4.486 3.905 - 12.9 111 107 - 3.9 2 3
Jerseys, pullovers, cardigans 6.262 4.680 - 25.3 56 45 - 19.6 1 1
Special garments 1.678 1.761 5.0 18 20 13.1 1 1
o.w. woven 876 1.296 48.0 17 19 10.1 2 1

8/13/2019 Euratex nr 2
http://slidepdf.com/reader/full/euratex-nr-2 188/214
BULLETIN 2013/2
188
EU27 (External Trade) Textile and Clothing Trade 2011 - 2012 (continued)Country :
ThailandIMPORTS EXPORTS Coverage E/I
Unit : Tons 2011 2012 Evol. % 2011 2012 Evol. % 2011 2012
Other garments, knitted orcrocheted
133 218 64.4 11 25 122.7 8 11
Gloves 133 67 - 49.3 1 5 261.5 1 7
Ties, bow ties, and cravats 17 37 125.5 14 12 - 15.3 87 33
Shawls, scarves, mufflers,mantillas, etc
84 55 - 35.3 1 2 42.9 2 4
Pantyhose, tights, stockings,socks, etc
547 663 21.2 7 9 44.6 1 1
Brassières, girdles, corsets,etc,
1.402 1.082 - 22.8 27 48 75.2 2 4
Other accessories 156 180 15.4 59 51 - 14.0 38 28
TOTAL Chapter 61 KnittedGarments
20.901 16.425 - 21.4 278 277 - 0.2 1 2
TOTAL Chapter 62 Woven
Garments10.678 9.083 - 14.9 405 470 15.9 4 5
Total Clothing - (CH 61+62) 31.579 25.508 - 19.2 683 747 9.4 2 3
Total Textile - (CH 50-60+ 63)
100.125 80.929 - 19.2 16.883 19.286 14.2 17 24
Total 131.703 106.437 - 19.2 17.566 20.033 14.0 13 19
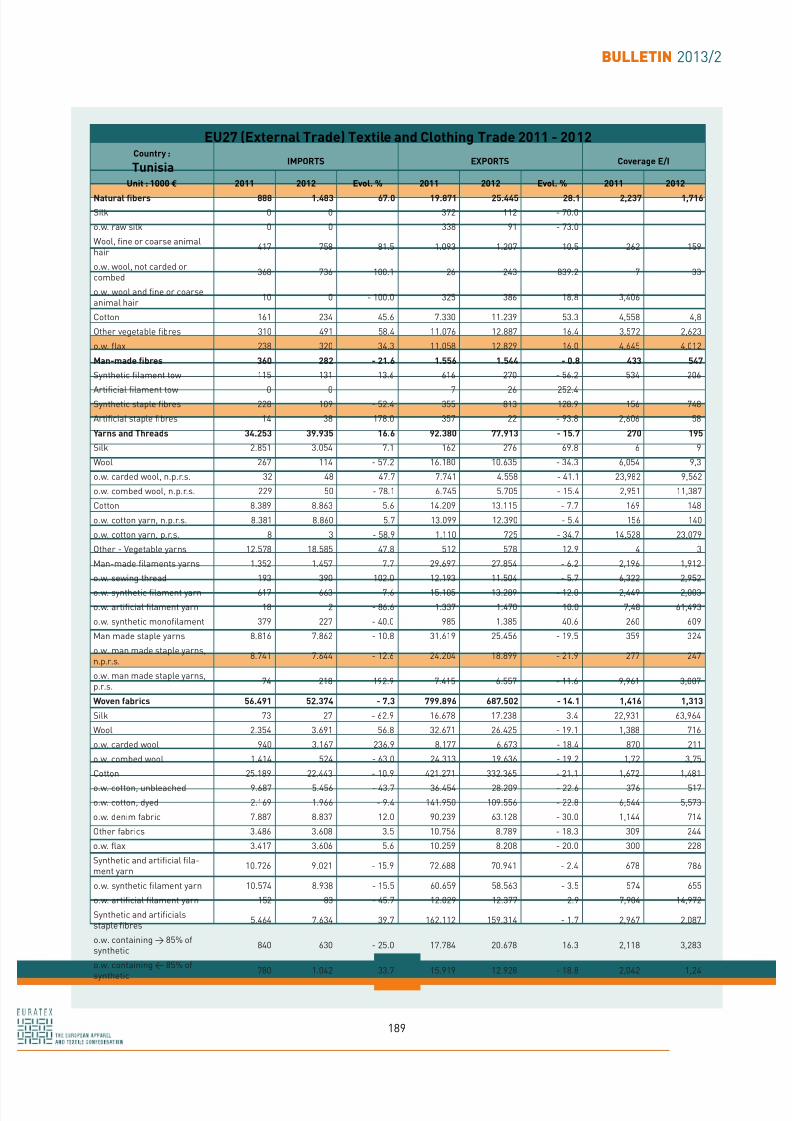
8/13/2019 Euratex nr 2
http://slidepdf.com/reader/full/euratex-nr-2 189/214
BULLETIN 2013/2
189
EU27 (External Trade) Textile and Clothing Trade 2011 - 2012Country :
TunisiaIMPORTS EXPORTS Coverage E/I
Unit : 1000 € 2011 2012 Evol. % 2011 2012 Evol. % 2011 2012
Natural fibers 888 1.483 67.0 19.871 25.445 28.1 2,237 1,716
Silk 0 0 372 112 - 70.0
o.w. raw silk 0 0 338 91 - 73.0
Wool, fine or coarse animalhair
417 758 81.5 1.093 1.207 10.5 262 159
o.w. wool, not carded orcombed
368 736 100.1 26 243 839.2 7 33
o.w. wool and fine or coarseanimal hair
10 0 - 100.0 325 386 18.8 3,406
Cotton 161 234 45.6 7.330 11.239 53.3 4,558 4,8
Other vegetable fibres 310 491 58.4 11.076 12.887 16.4 3,572 2,623
o.w. flax 238 320 34.3 11.058 12.829 16.0 4,645 4,012
Man-made fibres 360 282 - 21.6 1.556 1.544 - 0.8 433 547
Synthetic filament tow 115 131 13.6 616 270 - 56.2 534 206Artificial filament tow 0 0 7 26 252.4
Synthetic staple fibres 228 109 - 52.4 355 813 128.9 156 748
Artificial staple fibres 14 38 178.0 357 22 - 93.8 2,606 58
Yarns and Threads 34.253 39.935 16.6 92.380 77.913 - 15.7 270 195
Silk 2.851 3.054 7.1 162 276 69.8 6 9
Wool 267 114 - 57.2 16.180 10.635 - 34.3 6,054 9,3
o.w. carded wool, n.p.r.s. 32 48 47.7 7.741 4.558 - 41.1 23,982 9,562
o.w. combed wool, n.p.r.s. 229 50 - 78.1 6.745 5.705 - 15.4 2,951 11,387
Cotton 8.389 8.863 5.6 14.209 13.115 - 7.7 169 148
o.w. cotton yarn, n.p.r.s. 8.381 8.860 5.7 13.099 12.390 - 5.4 156 140
o.w. cotton yarn, p.r.s. 8 3 - 58.9 1.110 725 - 34.7 14,528 23,079
Other - Vegetable yarns 12.578 18.585 47.8 512 578 12.9 4 3
Man-made filaments yarns 1.352 1.457 7.7 29.697 27.854 - 6.2 2,196 1,912o.w. sewing thread 193 390 102.0 12.193 11.504 - 5.7 6,322 2,952
o.w. synthetic filament yarn 617 663 7.6 15.105 13.289 - 12.0 2,449 2,003
o.w. artificial filament yarn 18 2 - 86.6 1.337 1.470 10.0 7,48 61,493
o.w. synthetic monofilament 379 227 - 40.0 985 1.385 40.6 260 609
Man made staple yarns 8.816 7.862 - 10.8 31.619 25.456 - 19.5 359 324
o.w. man made staple yarns,n.p.r.s.
8.741 7.644 - 12.6 24.204 18.899 - 21.9 277 247
o.w. man made staple yarns,p.r.s.
74 218 192.9 7.415 6.557 - 11.6 9,961 3,007
Woven fabrics 56.491 52.374 - 7.3 799.896 687.502 - 14.1 1,416 1,313
Silk 73 27 - 62.9 16.678 17.238 3.4 22,931 63,964
Wool 2.354 3.691 56.8 32.671 26.425 - 19.1 1,388 716
o.w. carded wool 940 3.167 236.9 8.177 6.673 - 18.4 870 211
o.w. combed wool 1.414 524 - 63.0 24.313 19.636 - 19.2 1,72 3,75
Cotton 25.189 22.443 - 10.9 421.271 332.365 - 21.1 1,672 1,481
o.w. cotton, unbleached 9.687 5.456 - 43.7 36.454 28.209 - 22.6 376 517
o.w. cotton, dyed 2.169 1.966 - 9.4 141.950 109.556 - 22.8 6,544 5,573
o.w. denim fabric 7.887 8.837 12.0 90.239 63.128 - 30.0 1,144 714
Other fabrics 3.486 3.608 3.5 10.756 8.789 - 18.3 309 244
o.w. flax 3.417 3.606 5.6 10.259 8.208 - 20.0 300 228
Synthetic and artificial fila-ment yarn
10.726 9.021 - 15.9 72.688 70.941 - 2.4 678 786
o.w. synthetic filament yarn 10.574 8.938 - 15.5 60.659 58.563 - 3.5 574 655
o.w. artificial filament yarn 152 83 - 45.7 12.029 12.377 2.9 7,904 14,972
Synthetic and artificialsstaple fibres
5.464 7.634 39.7 162.112 159.314 - 1.7 2,967 2,087
o.w. containing > 85% of
synthetic 840 630 - 25.0 17.784 20.678 16.3 2,118 3,283
o.w. containing < 85% ofsynthetic
780 1.042 33.7 15.919 12.928 - 18.8 2,042 1,24

8/13/2019 Euratex nr 2
http://slidepdf.com/reader/full/euratex-nr-2 190/214
BULLETIN 2013/2
190
EU27 (External Trade) Textile and Clothing Trade 2011 - 2012 (continued)Country :
TunisiaIMPORTS EXPORTS Coverage E/I
Unit : 1000€
2011 2012 Evol. % 2011 2012 Evol. % 2011 2012o.w. containing < 85% syn-thetic mixed natural fibres
2.144 4.387 104.6 72.142 65.783 - 8.8 3,365 1,499
o.w. other synthetics 228 404 77.1 35.944 39.640 10.3 15,763 9,817
o.w. artificial staple fibres 1.473 1.171 - 20.5 20.324 20.285 - 0.2 1,38 1,732
Special woven fabrics 9.197 5.950 - 35.3 83.001 72.253 - 12.9 902 1,214
o.w. pile fabrics 343 431 25.5 11.563 12.139 5.0 3,37 2,818
o.w. narrow woven fabrics 2.237 1.383 - 38.1 20.737 20.646 - 0.4 927 1,492
o.w. labels, badges 717 793 10.5 17.896 16.219 - 9.4 2,496 2,046
o.w. embroidery 275 129 - 53.0 8.323 7.517 - 9.7 3,023 5,807
Knitted fabrics 11.985 8.686 - 27.5 241.083 207.459 - 13.9 2,012 2,388
Pile fabrics 103 34 - 67.3 5.859 4.177 - 28.7 5,713 12,451
< 30 cm; w 5% or moreelastome
43 18 - 58.6 53.040 35.457 - 33.1 123,377 199,423
> 30 cm; w 5% or moreelastome
4.525 3.374 - 25.4 54.205 55.511 2.4 1,198 1,645
Curtain fabrics and raschellace
4.721 1.939 - 58.9 12.368 12.653 2.3 262 653
Other fabrics 2.593 3.322 28.1 115.612 99.660 - 13.8 4,458 3
Carpets 1.574 1.153 - 26.7 2.030 1.872 - 7.8 129 162
Knotted carpets 706 417 - 41.0 52 26 - 51.1 7 6
Woven carpets 53 140 164.3 334 159 - 52.4 630 114
Tufted carpets 24 4 - 81.8 1.228 1.296 5.5 5,135 29,793
Carpets of felt 1 0 - 56.8 187 118 - 36.7 25,224 36,938
Other textiles 85.546 82.487 - 3.6 195.509 192.499 - 1.5 229 233
Wadding, felt, nonwovens,rubber thread, twine, cor-dage, etc.
11.238 8.709 - 22.5 39.136 42.463 8.5 348 488
o.w. felt 30 3 - 90.2 1.166 1.979 69.7 3,869 67,307o.w. nonwovens 228 60 - 73.7 30.253 33.173 9.7 13,268 55,372
o.w. special yarn 305 384 26.1 961 925 - 3.8 315 241
o.w. twine, rope 2.963 2.592 - 12.5 929 1.148 23.5 31 44
o.w. nets 5.282 3.518 - 33.4 3.634 2.923 - 19.6 69 83
Handwoven tapestries &quilted products
1.147 885 - 22.8 5.638 2.225 - 60.5 492 251
Impregnated, coated, etc,,textile fabrics
3.126 2.517 - 19.5 74.712 68.771 - 8.0 2,39 2,733
o.w. tyre cord fabric 26 54 106.5 190 226 19.3 721 416
o.w. fabrics impregnated,coated etc,
875 951 8.6 62.075 54.969 - 11.4 7,091 5,783
o.w. textile products, articlesfor technical uses
1.043 1.155 10.8 4.341 4.569 5.2 416 396
Other made up textilearticles
59.071 61.560 4.2 68.508 71.633 4.6 116 116
o.w. sacks and bags 3.004 2.887 - 3.9 3.360 3.290 - 2.1 112 114
o.w. tarpaulins, sunblinds& alike
7.289 6.416 - 12.0 2.005 547 - 72.7 28 9
o.w. other : floorcloths,dishcloths etc
43.979 46.592 5.9 15.646 14.181 - 9.4 36 30
Worn clothing and otherworn articles
4.299 5.385 25.3 47.429 51.847 9.3 1,103 963
Home textiles 113.268 109.803 - 3.1 16.183 14.372 - 11.2 14 13
Bedlinen, table, toilet andkitchen linen
46.012 38.496 - 16.3 5.402 2.682 - 50.3 12 7
o.w. Bedlinen, woven 26.290 21.850 - 16.9 1.647 1.134 - 31.1 6 5
o.w. toilet linen 7.161 8.243 15.1 3.133 1.240 - 60.4 44 15
o.w. table linen, woven 12.272 8.201 - 33.2 561 135 - 75.9 5 2
Curtains 12.633 15.131 19.8 3.494 3.168 - 9.3 28 21
Other furnishing articles 54.402 55.933 2.8 7.357 7.941 7.9 14 14
Garments 2.412.766 2.107.745 - 12.6 268.290 240.076 - 10.5 11 11

8/13/2019 Euratex nr 2
http://slidepdf.com/reader/full/euratex-nr-2 191/214
BULLETIN 2013/2
191
EU27 (External Trade) Textile and Clothing Trade 2011 - 2012 (continued)Country :
TunisiaIMPORTS EXPORTS Coverage E/I
Unit : 1000 € 2011 2012 Evol. % 2011 2012 Evol. % 2011 2012
Occupationals (woven) 204.045 190.815 - 6.5 4.722 2.561 - 45.8 2 1
Men's ensembles 2.372 3.462 46.0 101 25 - 75.4 4 1
Men's jackets 17.952 18.209 1.4 417 320 - 23.4 2 2
Men's trousers 36.871 29.198 - 20.8 116 185 58.7 0 1
Men's overalls 5.154 3.922 - 23.9 14 21 48.6 0 1
Other men's occupationals 92.403 101.663 10.0 3.710 1.561 - 57.9 4 2
Women's ensembles 56 44 - 22.4 0 10 0 23
Women's jackets 3.108 2.017 - 35.1 56 3 - 95.5 2 0
Women's trousers 4.505 2.072 - 54.0 5 38 679.6 0 2
Women's overalls 355 127 - 64.3 3 11 247.1 1 8
Other women's occupation-nals
41.267 30.103 - 27.1 299 389 30.0 1 1
Men’s Clothing (knitted and
woven)909.478 809.829 - 11.0 38.482 31.667 - 17.7 4 4
Overcoats 35.947 28.926 - 19.5 5.632 4.777 - 15.2 16 17
o.w. woven 32.245 25.335 - 21.4 5.545 4.696 - 15.3 17 19
Suits 16.873 18.819 11.5 930 2.206 137.1 6 12
o.w. woven 16.819 18.719 11.3 902 1.628 80.5 5 9
Ensembles 8.846 7.243 - 18.1 982 474 - 51.8 11 7
o.w. woven 6.380 6.619 3.8 464 319 - 31.2 7 5
Jackets and blazers 47.285 43.596 - 7.8 2.657 3.039 14.4 6 7
o.w. woven 46.408 41.956 - 9.6 2.261 2.468 9.2 5 6
Trousers 541.684 459.757 - 15.1 13.165 9.588 - 27.2 2 2
o.w. woven 536.473 455.543 - 15.1 10.303 7.289 - 29.3 2 2
Shirts 119.421 106.832 - 10.5 6.448 5.777 - 10.4 5 5
o.w. woven 92.220 80.975 - 12.2 4.750 3.845 - 19.1 5 5
Underpants, briefs, etc. 26.357 22.411 - 15.0 4.358 3.297 - 24.4 17 15o.w. knitted 15.504 13.932 - 10.1 1.981 848 - 57.2 13 6
Swimwear 12.079 11.887 - 1.6 122 74 - 39.3 1 1
Tracksuits 6.043 6.742 11.6 248 733 195.1 4 11
Women’s Clothing (knittedand woven)
895.653 782.735 - 12.6 50.179 38.861 - 22.6 6 5
Overcoats 20.360 18.000 - 11.6 1.073 1.241 15.6 5 7
o.w. woven 16.584 15.320 - 7.6 587 1.027 75.1 4 7
Suits 3.403 3.721 9.4 320 110 - 65.8 9 3
o.w. woven 2.423 3.049 25.8 279 108 - 61.2 12 4
Ensembles 9.828 6.828 - 30.5 1.851 586 - 68.3 19 9
o.w. woven 5.528 4.740 - 14.2 668 238 - 64.3 12 5
Jackets 30.107 28.036 - 6.9 961 864 - 10.1 3 3
o.w. woven 25.799 20.284 - 21.4 832 548 - 34.1 3 3
Skirts and dresses 137.465 111.101 - 19.2 5.712 5.787 1.3 4 5
o.w. woven 103.195 80.648 - 21.8 3.356 3.978 18.5 3 5
Trousers 394.292 361.614 - 8.3 10.375 7.238 - 30.2 3 2
o.w. woven 364.466 325.223 - 10.8 6.369 4.786 - 24.9 2 1
Blouses 79.007 67.036 - 15.2 5.879 5.044 - 14.2 7 8
o.w. woven 55.479 48.063 - 13.4 4.189 3.921 - 6.4 8 8
Slips, petticoats, etc. 74.675 66.560 - 10.9 11.055 8.725 - 21.1 15 13
o.w. knitted 64.044 57.992 - 9.5 9.959 7.665 - 23.0 16 13
Swimwear 86.733 77.377 - 10.8 8.780 5.917 - 32.6 10 8
Tracksuits 14.678 9.721 - 33.8 2.741 1.824 - 33.4 19 19
Others (knitted and woven) 607.497 514.723 - 15.3 179.561 169.517 - 5.6 30 33
Babies’ garments 41.912 38.499 - 8.1 2.176 2.647 21.6 5 7
o.w. knitted or crocheted 24.151 20.919 - 13.4 1.267 1.694 33.7 5 8
T-shirts 175.387 161.467 - 7.9 19.581 15.697 - 19.8 11 10
Jerseys, pullovers, cardigans 174.048 124.824 - 28.3 17.580 25.435 44.7 10 20
Special garments 38.796 40.489 4.4 2.304 1.669 - 27.6 6 4
o.w. woven 36.469 36.941 1.3 1.567 1.126 - 28.2 4 3

8/13/2019 Euratex nr 2
http://slidepdf.com/reader/full/euratex-nr-2 192/214
BULLETIN 2013/2
192
EU27 (External Trade) Textile and Clothing Trade 2011 - 2012 (continued)Country :
TunisiaIMPORTS EXPORTS Coverage E/I
Unit : 1000 € 2011 2012 Evol. % 2011 2012 Evol. % 2011 2012
Other garments, knitted orcrocheted
16.439 12.649 - 23.1 2.550 3.143 23.3 16 25
Gloves 782 707 - 9.6 886 731 - 17.5 113 103
Ties, bow ties, and cravats 1.329 1.150 - 13.5 4.859 959 - 80.3 366 83
Shawls, scarves, mufflers,mantillas, etc
19.171 19.682 2.7 891 700 - 21.4 5 4
Pantyhose, tights, stockings,socks, etc
18.065 16.782 - 7.1 13.707 11.890 - 13.3 76 71
Brassières, girdles, corsets,etc,
112.007 88.554 - 20.9 34.092 35.414 3.9 30 40
Other accessories 5.833 4.999 - 14.3 85.592 72.027 - 15.8 1,467 1,441
TOTAL Chapter 61 KnittedGarments
708.375 611.574 - 13.7 98.408 88.219 - 10.4 14 14
TOTAL Chapter 62 Woven
Garments1.704.396 1.496.203 - 12.2 169.881 151.718 - 10.7 10 10
Total Clothing - (CH 61+62) 2.412.772 2.107.782 - 12.6 268.290 239.937 - 10.6 11 11
Total Textile - (CH 50-60+ 63)
304.364 296.773 - 2.5 1.372.696 1.211.315 - 11.8 451 408
Total 2.717.137 2.404.554 - 11.5 1.640.985 1.451.252 - 11.6 60 60

8/13/2019 Euratex nr 2
http://slidepdf.com/reader/full/euratex-nr-2 193/214
BULLETIN 2013/2
193
EU27 (External Trade) Textile and Clothing Trade 2011 - 2012Country :
TurkeyIMPORTS EXPORTS Coverage E/I
Unit : 1000 € 2011 2012 Evol. % 2011 2012 Evol. % 2011 2012
Natural fibers 141.381 110.935 - 21.5 118.068 208.965 77.0 84 188
Silk 10 0 - 100.0 786 665 - 15.4 7,845
o.w. raw silk 10 0 - 100.0 334 189 - 43.4 3,332
Wool, fine or coarse animalhair
8.343 5.578 - 33.1 29.284 33.551 14.6 351 601
o.w. wool, not carded orcombed
6.670 4.685 - 29.8 7.810 8.282 6.0 117 177
o.w. wool and fine or coarseanimal hair
1.188 468 - 60.6 18.996 21.776 14.6 1,599 4,655
Cotton 132.998 105.322 - 20.8 85.345 172.441 102.1 64 164
Other vegetable fibres 29 34 16.8 2.652 2.308 - 13.0 9,002 6,71
o.w. flax 7 19 150.1 2.639 2.247 - 14.9 35,524 12,095
Man-made fibres 88.949 88.419 - 0.6 180.081 196.875 9.3 202 223
Synthetic filament tow 23.775 21.162 - 11.0 54.095 51.065 - 5.6 228 241Artificial filament tow 21 94 341.8 6.276 14.433 130.0 29,463 15,336
Synthetic staple fibres 57.181 58.093 1.6 72.082 80.458 11.6 126 139
Artificial staple fibres 176 266 51.0 28.607 31.508 10.1 16,225 11,837
Yarns and Threads 699.826 669.109 - 4.4 267.463 268.359 0.3 38 40
Silk 28 32 14.0 711 899 26.5 2,57 2,853
Wool 26.740 24.932 - 6.8 45.972 43.239 - 5.9 172 173
o.w. carded wool, n.p.r.s. 8.115 7.325 - 9.7 11.285 12.847 13.8 139 175
o.w. combed wool, n.p.r.s. 5.321 5.899 10.9 32.168 27.403 - 14.8 605 465
Cotton 256.901 233.166 - 9.2 13.598 7.925 - 41.7 5 3
o.w. cotton yarn, n.p.r.s. 250.814 228.366 - 9.0 11.258 6.894 - 38.8 4 3
o.w. cotton yarn, p.r.s. 6.087 4.800 - 21.1 2.340 1.031 - 55.9 38 21
Other - Vegetable yarns 766 922 20.2 2.235 2.072 - 7.3 292 225
Man-made filaments yarns 239.889 237.483 - 1.0 146.905 158.167 7.7 61 67o.w. sewing thread 11.334 11.446 1.0 6.557 6.752 3.0 58 59
o.w. synthetic filament yarn 219.114 217.442 - 0.8 121.088 130.808 8.0 55 60
o.w. artificial filament yarn 5.081 5.074 - 0.1 5.409 7.378 36.4 106 145
o.w. synthetic monofilament 1.562 1.913 22.5 13.764 13.129 - 4.6 881 686
Man made staple yarns 175.502 172.575 - 1.7 58.043 56.057 - 3.4 33 32
o.w. man made staple yarns,n.p.r.s.
122.340 108.698 - 11.2 55.265 53.146 - 3.8 45 49
o.w. man made staple yarns,p.r.s.
53.163 63.877 20.2 2.778 2.911 4.8 5 5
Woven fabrics 940.862 935.213 - 0.6 508.712 508.773 0.0 54 54
Silk 1.340 1.082 - 19.2 5.104 5.558 8.9 381 514
Wool 40.337 38.332 - 5.0 111.395 112.992 1.4 276 295
o.w. carded wool 7.173 5.895 - 17.8 22.282 25.950 16.5 311 440
o.w. combed wool 33.118 32.362 - 2.3 88.503 86.501 - 2.3 267 267
Cotton 397.853 381.553 - 4.1 201.455 176.328 - 12.5 51 46
o.w. cotton, unbleached 23.655 36.586 54.7 6.125 6.584 7.5 26 18
o.w. cotton, dyed 97.459 83.950 - 13.9 45.006 37.823 - 16.0 46 45
o.w. denim fabric 104.309 87.498 - 16.1 45.593 37.222 - 18.4 44 43
Other fabrics 6.877 7.706 12.1 8.932 9.196 3.0 130 119
o.w. flax 6.791 7.536 11.0 7.806 8.488 8.7 115 113
Synthetic and artificial fila-ment yarn
224.045 236.875 5.7 68.912 87.323 26.7 31 37
o.w. synthetic filament yarn 187.964 202.246 7.6 47.005 64.861 38.0 25 32
o.w. artificial filament yarn 36.081 34.628 - 4.0 21.907 22.462 2.5 61 65
Synthetic and artificialsstaple fibres
144.301 144.111 - 0.1 57.653 62.435 8.3 40 43
o.w. containing > 85% of
synthetic 24.362 20.047 - 17.7 15.321 15.284 - 0.2 63 76
o.w. containing < 85% ofsynthetic
3.926 3.678 - 6.3 4.331 2.406 - 44.4 110 65

8/13/2019 Euratex nr 2
http://slidepdf.com/reader/full/euratex-nr-2 194/214
BULLETIN 2013/2
194
EU27 (External Trade) Textile and Clothing Trade 2011 - 2012 (continued)Country :
TurkeyIMPORTS EXPORTS Coverage E/I
Unit : 1000 € 2011 2012 Evol. % 2011 2012 Evol. % 2011 2012
o.w. containing < 85% syn-thetic mixed natural fibres
2.151 3.343 55.4 2.857 2.730 - 4.4 133 82
o.w. other synthetics 73.538 72.741 - 1.1 20.036 28.026 39.9 27 39
o.w. artificial staple fibres 40.325 44.302 9.9 15.108 13.988 - 7.4 37 32
Special woven fabrics 123.145 121.889 - 1.0 55.031 54.880 - 0.3 45 45
o.w. pile fabrics 82.734 78.166 - 5.5 15.903 18.790 18.2 19 24
o.w. narrow woven fabrics 8.322 9.189 10.4 21.845 20.100 - 8.0 263 219
o.w. labels, badges 6.430 8.100 26.0 11.529 10.168 - 11.8 179 126
o.w. embroidery 8.577 9.049 5.5 1.025 982 - 4.2 12 11
Knitted fabrics 445.132 455.902 2.4 67.639 60.905 - 10.0 15 13
Pile fabrics 10.463 16.228 55.1 5.350 10.080 88.4 51 62
< 30 cm; w 5% or moreelastome
2.132 1.763 - 17.3 915 1.062 16.1 43 60
> 30 cm; w 5% or moreelastome
155.171 149.675 - 3.5 16.783 15.258 - 9.1 11 10
Curtain fabrics and raschellace
22.073 27.209 23.3 24.726 17.359 - 29.8 112 64
Other fabrics 255.293 261.027 2.2 19.865 17.146 - 13.7 8 7
Carpets 262.605 279.309 6.4 30.973 28.408 - 8.3 12 10
Knotted carpets 34.349 54.513 58.7 1.267 1.524 20.2 4 3
Woven carpets 154.322 172.579 11.8 4.934 4.774 - 3.2 3 3
Tufted carpets 34.269 33.926 - 1.0 17.845 16.020 - 10.2 52 47
Carpets of felt 377 419 11.1 3.650 3.097 - 15.2 967 738
Other textiles 553.345 538.451 - 2.7 446.420 409.517 - 8.3 81 76
Wadding, felt, nonwovens,rubber thread, twine, cor-dage, etc.
112.403 116.332 3.5 188.667 181.308 - 3.9 168 156
o.w. felt 6.438 7.485 16.3 8.748 8.835 1.0 136 118o.w. nonwovens 59.627 62.587 5.0 151.568 143.766 - 5.1 254 230
o.w. special yarn 19.892 22.180 11.5 5.409 3.962 - 26.7 27 18
o.w. twine, rope 2.250 3.870 72.0 1.986 2.677 34.8 88 69
o.w. nets 3.848 3.728 - 3.1 3.283 3.781 15.2 85 101
Handwoven tapestries &quilted products
1.486 1.376 - 7.4 607 552 - 9.1 41 40
Impregnated, coated, etc,,textile fabrics
150.454 135.719 - 9.8 158.709 144.629 - 8.9 105 107
o.w. tyre cord fabric 88.576 69.587 - 21.4 14.442 9.029 - 37.5 16 13
o.w. fabrics impregnated,coated etc,
52.570 55.983 6.5 89.854 84.171 - 6.3 171 150
o.w. textile products, articlesfor technical uses
5.651 6.863 21.5 34.582 31.756 - 8.2 612 463
Other made up textilearticles 242.907 235.056 - 3.2 36.454 41.490 13.8 15 18
o.w. sacks and bags 200.149 191.349 - 4.4 2.097 1.962 - 6.4 1 1
o.w. tarpaulins, sunblinds& alike
5.707 5.786 1.4 5.190 4.337 - 16.4 91 75
o.w. other : floorcloths,dishcloths etc
31.274 32.077 2.6 13.512 17.328 28.2 43 54
Worn clothing and otherworn articles
5.461 5.118 - 6.3 15.270 17.238 12.9 280 337
Home textiles 868.957 702.282 - 19.2 16.224 14.256 - 12.1 2 2
Bedlinen, table, toilet andkitchen linen
714.003 581.139 - 18.6 9.109 7.733 - 15.1 1 1
o.w. Bedlinen, woven 258.097 194.843 - 24.5 4.926 4.063 - 17.5 2 2
o.w. toilet linen 342.252 301.591 - 11.9 2.445 2.322 - 5.0 1 1
o.w. table linen, woven 26.431 17.061 - 35.5 1.432 1.056 - 26.3 5 6
Curtains 95.029 78.384 - 17.5 3.158 2.596 - 17.8 3 3
Other furnishing articles 51.607 34.178 - 33.8 2.234 1.933 - 13.5 4 6
Garments 8.308.415 8.206.571 - 1.2 773.125 740.102 - 4.3 9 9

8/13/2019 Euratex nr 2
http://slidepdf.com/reader/full/euratex-nr-2 195/214
BULLETIN 2013/2
195
EU27 (External Trade) Textile and Clothing Trade 2011 - 2012 (continued)Country :
TurkeyIMPORTS EXPORTS Coverage E/I
Unit : 1000 € 2011 2012 Evol. % 2011 2012 Evol. % 2011 2012
Occupationals (woven) 13.293 13.547 1.9 3.229 3.571 10.6 24 26
Men's ensembles 227 899 296.8 73 621 754.7 32 69
Men's jackets 805 974 20.9 547 380 - 30.6 68 39
Men's trousers 2.538 2.447 - 3.6 328 668 103.5 13 27
Men's overalls 1.178 709 - 39.8 681 552 - 19.0 58 78
Other men's occupationals 1.584 832 - 47.4 671 772 15.1 42 93
Women's ensembles 173 85 - 50.7 126 6 - 95.2 73 7
Women's jackets 835 1.771 112.1 293 66 - 77.6 35 4
Women's trousers 2.330 2.380 2.1 258 161 - 37.5 11 7
Women's overalls 13 60 345.9 34 61 82.7 249 102
Other women's occupation-nals
3.610 3.388 - 6.2 219 284 29.3 6 8
Men’s Clothing (knitted and
woven)1.654.253 1.698.899 2.7 195.214 199.457 2.2 12 12
Overcoats 59.532 53.253 - 10.5 37.556 39.285 4.6 63 74
o.w. woven 41.780 33.795 - 19.1 30.227 29.341 - 2.9 72 87
Suits 113.169 117.374 3.7 6.704 6.386 - 4.7 6 5
o.w. woven 106.781 112.121 5.0 6.622 6.371 - 3.8 6 6
Ensembles 6.062 10.968 80.9 4.822 5.708 18.4 80 52
o.w. woven 2.452 5.794 136.3 4.479 5.451 21.7 183 94
Jackets and blazers 126.931 161.165 27.0 12.983 15.194 17.0 10 9
o.w. woven 108.196 114.967 6.3 11.116 13.105 17.9 10 11
Trousers 790.852 802.100 1.4 74.480 78.868 5.9 9 10
o.w. woven 728.968 745.676 2.3 65.094 68.734 5.6 9 9
Shirts 461.004 464.764 0.8 40.611 39.183 - 3.5 9 8
o.w. woven 301.805 303.684 0.6 24.387 22.097 - 9.4 8 7
Underpants, briefs, etc. 81.572 75.113 - 7.9 5.859 4.455 - 24.0 7 6o.w. knitted 52.881 50.159 - 5.1 4.586 3.383 - 26.2 9 7
Swimwear 4.280 4.059 - 5.2 1.447 1.187 - 17.9 34 29
Tracksuits 8.240 7.904 - 4.1 9.305 6.230 - 33.0 113 79
Women’s Clothing (knittedand woven)
2.998.472 2.936.618 - 2.1 285.489 273.716 - 4.1 10 9
Overcoats 104.167 88.340 - 15.2 37.576 34.898 - 7.1 36 40
o.w. woven 49.432 52.182 5.6 31.491 28.526 - 9.4 64 55
Suits 8.553 8.437 - 1.4 2.710 1.699 - 37.3 32 20
o.w. woven 4.402 4.191 - 4.8 2.359 1.513 - 35.9 54 36
Ensembles 20.406 22.748 11.5 8.303 9.087 9.4 41 40
o.w. woven 8.348 9.982 19.6 7.933 7.012 - 11.6 95 70
Jackets 164.168 184.669 12.5 15.670 17.308 10.5 10 9
o.w. woven 109.964 107.102 - 2.6 11.418 11.074 - 3.0 10 10
Skirts and dresses 655.582 618.353 - 5.7 62.944 63.915 1.5 10 10
o.w. woven 312.098 284.930 - 8.7 43.264 38.108 - 11.9 14 13
Trousers 1.118.613 1.127.198 0.8 65.001 64.493 - 0.8 6 6
o.w. woven 807.621 828.885 2.6 49.216 49.417 0.4 6 6
Blouses 680.679 659.652 - 3.1 40.241 37.561 - 6.7 6 6
o.w. woven 338.918 306.172 - 9.7 28.309 26.484 - 6.4 8 9
Slips, petticoats, etc. 207.887 190.963 - 8.1 12.243 10.008 - 18.3 6 5
o.w. knitted 143.596 135.878 - 5.4 10.384 8.032 - 22.7 7 6
Swimwear 6.799 4.401 - 35.3 4.598 4.909 6.8 68 112
Tracksuits 22.508 25.675 14.1 11.482 6.736 - 41.3 51 26
Others (knitted and woven) 3.655.432 3.570.350 - 2.3 292.237 266.792 - 8.7 8 7
Babies’ garments 79.825 83.558 4.7 21.819 17.822 - 18.3 27 21
o.w. knitted or crocheted 62.061 64.557 4.0 14.505 12.761 - 12.0 23 20
T-shirts 1.866.064 1.854.271 - 0.6 73.390 67.839 - 7.6 4 4
Jerseys, pullovers, cardigans 918.185 916.067 - 0.2 80.920 76.911 - 5.0 9 8
Special garments 9.614 10.982 14.2 25.585 21.045 - 17.7 266 192
o.w. woven 7.085 8.764 23.7 24.365 19.882 - 18.4 344 227

8/13/2019 Euratex nr 2
http://slidepdf.com/reader/full/euratex-nr-2 196/214
BULLETIN 2013/2
196
EU27 (External Trade) Textile and Clothing Trade 2011 - 2012 (continued)Country :
TurkeyIMPORTS EXPORTS Coverage E/I
Unit : 1000€
2011 2012 Evol. % 2011 2012 Evol. % 2011 2012Other garments, knitted orcrocheted
88.361 86.118 - 2.5 13.380 8.517 - 36.3 15 10
Gloves 1.693 1.409 - 16.8 7.545 9.730 29.0 446 691
Ties, bow ties, and cravats 9.754 2.828 - 71.0 5.136 5.300 3.2 53 187
Shawls, scarves, mufflers,mantillas, etc
26.435 25.914 - 2.0 9.290 8.521 - 8.3 35 33
Pantyhose, tights, stockings,socks, etc
595.338 534.247 - 10.3 23.516 24.480 4.1 4 5
Brassières, girdles, corsets,etc,
38.500 32.782 - 14.9 12.160 10.576 - 13.0 32 32
Other accessories 16.933 9.630 - 43.1 15.878 12.823 - 19.2 94 133
TOTAL Chapter 61 KnittedGarments
5.164.988 5.090.314 - 1.4 335.703 330.679 - 1.5 6 6
TOTAL Chapter 62 Woven
Garments 3.143.427 3.116.257 - 0.9 437.422 409.423 - 6.4 14 13
Total Clothing - (CH 61+62) 8.310.944 8.211.706 - 1.2 773.125 740.102 - 4.3 9 9
Total Textile - (CH 50-60+ 63)
4.001.544 3.780.491 - 5.5 1.746.705 1.821.638 4.3 44 48
Total 12.312.488 11.992.196 - 2.6 2.519.830 2.561.740 1.7 20 21

8/13/2019 Euratex nr 2
http://slidepdf.com/reader/full/euratex-nr-2 197/214
BULLETIN 2013/2
197
EU27 (External Trade) Textile and Clothing Trade 2011 - 2012Country :
United StatesIMPORTS EXPORTS Coverage E/I
Unit : 1000 € 2011 2012 Evol. % 2011 2012 Evol. % 2011 2012
Natural fibers 66.966 34.571 - 48.4 9.483 12.584 32.7 14 36
Silk 27 8 - 69.4 329 77 - 76.6 1,198 916
o.w. raw silk 10 1 - 89.0 8 10 15.4 85 896
Wool, fine or coarse animalhair
2.716 2.652 - 2.4 4.468 5.145 15.2 164 194
o.w. wool, not carded orcombed
198 546 175.4 303 376 24.1 153 69
o.w. wool and fine or coarseanimal hair
42 45 5.4 2.242 2.218 - 1.1 5,296 4,972
Cotton 63.647 31.577 - 50.4 2.122 924 - 56.4 3 3
Other vegetable fibres 575 333 - 42.0 2.564 6.438 151.1 446 1,932
o.w. flax 319 98 - 69.3 2.401 5.440 126.6 752 5,554
Man-made fibres 116.420 109.396 - 6.0 145.611 129.931 - 10.8 125 119
Synthetic filament tow 2.865 3.493 21.9 27.925 21.366 - 23.5 975 612Artificial filament tow 47.556 54.844 15.3 5.544 1.737 - 68.7 12 3
Synthetic staple fibres 61.009 43.599 - 28.5 74.716 77.069 3.1 122 177
Artificial staple fibres 588 3.501 495.6 34.178 26.124 - 23.6 5,815 746
Yarns and Threads 166.260 151.186 - 9.1 259.165 275.802 6.4 156 182
Silk 118 119 0.6 1.329 1.422 7.0 1,123 1,195
Wool 363 904 149.2 27.714 32.527 17.4 7,64 3,598
o.w. carded wool, n.p.r.s. 16 15 - 6.0 5.384 8.667 61.0 33,071 56,648
o.w. combed wool, n.p.r.s. 35 525 1418.8 12.293 13.673 11.2 35,561 2,604
Cotton 1.667 1.771 6.3 26.677 30.683 15.0 1,601 1,732
o.w. cotton yarn, n.p.r.s. 1.301 1.572 20.8 6.693 7.262 8.5 515 462
o.w. cotton yarn, p.r.s. 366 200 - 45.5 19.984 23.421 17.2 5,461 11,733
Other - Vegetable yarns 70 47 - 33.7 2.137 2.723 27.4 3,047 5,855
Man-made filaments yarns 160.513 146.569 - 8.7 185.531 193.786 4.4 116 132o.w. sewing thread 1.343 1.789 33.2 12.990 14.688 13.1 967 821
o.w. synthetic filament yarn 109.690 100.857 - 8.1 127.165 121.852 - 4.2 116 121
o.w. artificial filament yarn 11.678 4.794 - 59.0 1.492 1.786 19.7 13 37
o.w. synthetic monofilament 36.489 37.154 1.8 43.364 54.240 25.1 119 146
Man made staple yarns 3.529 1.776 - 49.7 15.777 14.661 - 7.1 447 826
o.w. man made staple yarns,n.p.r.s.
2.823 1.238 - 56.1 12.961 10.963 - 15.4 459 885
o.w. man made staple yarns,p.r.s.
706 537 - 23.9 2.816 3.697 31.3 399 688
Woven fabrics 78.145 82.148 5.1 400.980 472.611 17.9 513 575
Silk 1.547 1.527 - 1.3 28.432 27.791 - 2.3 1,838 1,82
Wool 2.421 2.621 8.3 47.828 63.653 33.1 1,976 2,429
o.w. carded wool 1.099 797 - 27.5 10.061 12.006 19.3 915 1,506
o.w. combed wool 1.317 1.820 38.2 37.426 51.335 37.2 2,842 2,82
Cotton 21.970 23.467 6.8 99.811 101.878 2.1 454 434
o.w. cotton, unbleached 839 782 - 6.8 8.946 8.277 - 7.5 1,066 1,058
o.w. cotton, dyed 5.685 5.569 - 2.0 9.965 12.437 24.8 175 223
o.w. denim fabric 1.370 1.049 - 23.4 20.436 20.386 - 0.2 1,492 1,943
Other fabrics 1.373 1.329 - 3.2 31.772 35.988 13.3 2,314 2,707
o.w. flax 1.212 1.267 4.5 30.845 34.810 12.9 2,546 2,748
Synthetic and artificial fila-ment yarn
21.739 20.357 - 6.4 81.916 87.179 6.4 377 428
o.w. synthetic filament yarn 20.509 19.740 - 3.8 73.320 75.948 3.6 358 385
o.w. artificial filament yarn 1.230 617 - 49.8 8.596 11.231 30.7 699 1,82
Synthetic and artificialsstaple fibres
10.072 12.254 21.7 40.104 47.849 19.3 398 390
o.w. containing > 85% of
synthetic 4.819 5.212 8.2 14.894 16.226 8.9 309 311
o.w. containing < 85% ofsynthetic
1.229 1.856 51.0 900 660 - 26.6 73 36

8/13/2019 Euratex nr 2
http://slidepdf.com/reader/full/euratex-nr-2 198/214
BULLETIN 2013/2
198
EU27 (External Trade) Textile and Clothing Trade 2011 - 2012 (continued)Country :
United StatesIMPORTS EXPORTS Coverage E/I
Unit : 1000 € 2011 2012 Evol. % 2011 2012 Evol. % 2011 2012
o.w. containing < 85% syn-thetic mixed natural fibres
523 761 45.5 1.721 2.558 48.6 329 336
o.w. other synthetics 2.280 2.597 13.9 9.876 14.355 45.4 433 553
o.w. artificial staple fibres 1.220 1.827 49.8 12.713 14.050 10.5 1,042 769
Special woven fabrics 18.982 20.551 8.3 70.825 107.929 52.4 373 525
o.w. pile fabrics 2.028 2.292 13.0 28.778 63.584 120.9 1,419 2,774
o.w. narrow woven fabrics 13.076 13.746 5.1 17.939 18.985 5.8 137 138
o.w. labels, badges 1.431 1.168 - 18.4 3.335 2.827 - 15.2 233 242
o.w. embroidery 599 1.020 70.3 4.901 6.092 24.3 818 597
Knitted fabrics 22.605 19.735 - 12.7 63.850 67.448 5.6 282 342
Pile fabrics 12.636 9.655 - 23.6 3.222 2.129 - 33.9 25 22
< 30 cm; w 5% or moreelastome
706 456 - 35.4 775 629 - 18.8 110 138
> 30 cm; w 5% or moreelastome
2.160 1.214 - 43.8 12.953 16.823 29.9 600 1,385
Curtain fabrics and raschellace
4.283 5.905 37.9 32.009 33.823 5.7 747 573
Other fabrics 2.819 2.505 - 11.1 14.891 14.044 - 5.7 528 561
Carpets 37.574 39.129 4.1 206.072 196.075 - 4.9 548 501
Knotted carpets 1.773 2.095 18.2 6.279 4.627 - 26.3 354 221
Woven carpets 3.489 3.343 - 4.2 102.335 103.777 1.4 2,933 3,104
Tufted carpets 26.122 27.948 7.0 34.097 33.509 - 1.7 131 120
Carpets of felt 1.155 395 - 65.8 32.979 30.719 - 6.9 2,856 7,782
Other textiles 737.140 755.190 2.4 809.446 919.367 13.6 110 122
Wadding, felt, nonwovens,rubber thread, twine, cor-dage, etc.
268.443 284.430 6.0 309.159 374.780 21.2 115 132
o.w. felt 3.152 3.132 - 0.6 8.424 9.041 7.3 267 289o.w. nonwovens 229.881 240.718 4.7 216.088 256.693 18.8 94 107
o.w. special yarn 2.431 2.696 10.9 10.040 11.935 18.9 413 443
o.w. twine, rope 13.683 17.289 26.4 28.397 46.494 63.7 208 269
o.w. nets 3.250 1.704 - 47.6 8.527 11.245 31.9 262 660
Handwoven tapestries &quilted products
793 873 10.0 1.628 1.869 14.8 205 214
Impregnated, coated, etc,,textile fabrics
166.976 165.181 - 1.1 244.896 269.100 9.9 147 163
o.w. tyre cord fabric 8.902 7.310 - 17.9 3.289 2.627 - 20.1 37 36
o.w. fabrics impregnated,coated etc,
60.372 63.537 5.2 82.243 101.863 23.9 136 160
o.w. textile products, articlesfor technical uses
54.631 56.264 3.0 91.406 86.900 - 4.9 167 154
Other made up textilearticles 105.785 108.754 2.8 87.011 91.714 5.4 82 84
o.w. sacks and bags 2.073 2.465 18.9 4.604 5.586 21.3 222 227
o.w. tarpaulins, sunblinds& alike
17.687 10.976 - 37.9 29.596 31.178 5.3 167 284
o.w. other : floorcloths,dishcloths etc
58.353 64.785 11.0 39.083 41.284 5.6 67 64
Worn clothing and otherworn articles
26.592 29.793 12.0 11.585 11.182 - 3.5 44 38
Home textiles 11.116 11.924 7.3 151.407 158.611 4.8 1,362 1,33
Bedlinen, table, toilet andkitchen linen
3.556 4.845 36.2 108.548 118.389 9.1 3,052 2,443
o.w. Bedlinen, woven 1.144 2.134 86.5 78.696 81.175 3.2 6,877 3,804
o.w. toilet linen 1.218 1.396 14.6 14.737 19.313 31.1 1,21 1,384
o.w. table linen, woven 622 702 12.7 11.468 12.973 13.1 1,843 1,849
Curtains 2.494 2.478 - 0.7 8.580 10.231 19.2 344 413
Other furnishing articles 3.285 2.825 - 14.0 25.665 18.338 - 28.5 781 649
Garments 366.551 463.416 26.4 1.799.263 2.232.673 24.1 491 482

8/13/2019 Euratex nr 2
http://slidepdf.com/reader/full/euratex-nr-2 199/214
BULLETIN 2013/2
199
EU27 (External Trade) Textile and Clothing Trade 2011 - 2012 (continued)Country :
United StatesIMPORTS EXPORTS Coverage E/I
Unit : 1000 € 2011 2012 Evol. % 2011 2012 Evol. % 2011 2012
Occupationals (woven) 6.545 6.067 - 7.3 7.239 8.515 17.6 111 140
Men's ensembles 152 84 - 44.6 332 230 - 30.9 218 273
Men's jackets 313 163 - 47.9 549 1.192 117.2 175 730
Men's trousers 161 224 39.2 1.255 1.456 16.0 779 650
Men's overalls 73 176 142.6 623 556 - 10.7 857 315
Other men's occupationals 3.452 2.330 - 32.5 1.856 1.601 - 13.7 54 69
Women's ensembles 147 160 9.5 248 226 - 9.0 169 141
Women's jackets 180 352 95.2 554 766 38.3 307 217
Women's trousers 1.178 1.436 21.8 862 1.291 49.8 73 90
Women's overalls 52 118 124.9 181 262 45.1 345 222
Other women's occupation-nals
836 1.024 22.4 781 936 19.8 93 91
Men’s Clothing (knitted and
woven)51.647 56.212 8.8 419.974 550.191 31.0 813 979
Overcoats 6.202 9.189 48.2 46.841 85.443 82.4 755 930
o.w. woven 3.840 5.872 52.9 42.162 79.554 88.7 1,098 1,355
Suits 3.998 5.550 38.8 101.207 132.145 30.6 2,532 2,381
o.w. woven 3.794 5.364 41.4 97.800 128.632 31.5 2,578 2,398
Ensembles 2.355 1.337 - 43.2 26.202 16.840 - 35.7 1,113 1,259
o.w. woven 557 598 7.4 25.265 15.740 - 37.7 4,535 2,63
Jackets and blazers 2.338 2.999 28.2 48.845 71.321 46.0 2,089 2,378
o.w. woven 1.832 2.092 14.2 44.766 64.317 43.7 2,443 3,074
Trousers 18.489 16.936 - 8.4 101.200 134.218 32.6 547 792
o.w. woven 16.962 14.708 - 13.3 96.571 128.280 32.8 569 872
Shirts 9.082 10.682 17.6 70.540 84.013 19.1 777 787
o.w. woven 5.614 6.808 21.3 56.847 67.697 19.1 1,013 994
Underpants, briefs, etc. 2.176 2.215 1.8 4.818 5.625 16.8 221 254o.w. knitted 1.532 1.503 - 1.9 2.819 3.230 14.5 184 215
Swimwear 569 680 19.4 3.085 4.494 45.7 542 661
Tracksuits 2.576 3.397 31.9 10.415 7.845 - 24.7 404 231
Women’s Clothing (knittedand woven)
146.255 193.831 32.5 643.064 755.001 17.4 440 390
Overcoats 8.423 16.864 100.2 81.681 102.323 25.3 970 607
o.w. woven 4.960 11.430 130.4 75.572 94.037 24.4 1,523 823
Suits 1.574 1.520 - 3.4 26.738 17.596 - 34.2 1,699 1,158
o.w. woven 1.150 1.050 - 8.7 22.019 11.820 - 46.3 1,914 1,126
Ensembles 2.831 2.672 - 5.6 32.163 31.384 - 2.4 1,136 1,174
o.w. woven 1.915 1.900 - 0.7 30.702 30.160 - 1.8 1,604 1,587
Jackets 5.228 6.790 29.9 58.350 69.110 18.4 1,116 1,018
o.w. woven 3.971 5.443 37.1 50.393 58.887 16.9 1,269 1,082
Skirts and dresses 44.423 54.402 22.5 192.888 226.002 17.2 434 415
o.w. woven 31.932 40.308 26.2 152.204 172.315 13.2 477 427
Trousers 54.396 70.653 29.9 70.239 102.052 45.3 129 144
o.w. woven 46.385 61.623 32.9 59.850 84.028 40.4 129 136
Blouses 11.095 12.404 11.8 55.236 64.883 17.5 498 523
o.w. woven 7.912 8.340 5.4 46.334 54.013 16.6 586 648
Slips, petticoats, etc. 6.230 8.028 28.8 15.540 17.528 12.8 249 218
o.w. knitted 4.314 5.718 32.5 11.855 12.527 5.7 275 219
Swimwear 3.956 3.855 - 2.5 7.979 8.732 9.4 202 227
Tracksuits 4.295 6.769 57.6 19.335 24.830 28.4 450 367
Others (knitted and woven) 168.592 213.262 26.5 733.453 924.640 26.1 435 434
Babies’ garments 2.015 2.481 23.1 10.736 11.745 9.4 533 473
o.w. knitted or crocheted 1.022 1.544 51.1 6.347 7.061 11.2 621 457
T-shirts 56.780 67.321 18.6 65.894 72.047 9.3 116 107
Jerseys, pullovers, cardigans 19.271 36.321 88.5 170.049 201.633 18.6 882 555
Special garments 23.604 35.295 49.5 203.680 306.556 50.5 863 869
o.w. woven 23.123 34.744 50.3 157.962 221.318 40.1 683 637

8/13/2019 Euratex nr 2
http://slidepdf.com/reader/full/euratex-nr-2 200/214
BULLETIN 2013/2
200
EU27 (External Trade) Textile and Clothing Trade 2011 - 2012 (continued)Country :
United StatesIMPORTS EXPORTS Coverage E/I
Unit : 1000 € 2011 2012 Evol. % 2011 2012 Evol. % 2011 2012
Other garments, knitted orcrocheted
10.913 14.551 33.3 43.325 56.334 30.0 397 387
Gloves 11.957 10.559 - 11.7 4.781 4.306 - 9.9 40 41
Ties, bow ties, and cravats 1.367 1.654 21.0 44.787 51.736 15.5 3,276 3,128
Shawls, scarves, mufflers,mantillas, etc
2.956 2.443 - 17.3 73.757 81.775 10.9 2,495 3,347
Pantyhose, tights, stockings,socks, etc
25.775 27.093 5.1 37.629 46.125 22.6 146 170
Brassières, girdles, corsets,etc,
10.042 11.421 13.7 45.103 48.778 8.1 449 427
Other accessories 4.032 4.265 5.8 33.204 43.782 31.9 824 1,027
TOTAL Chapter 61 KnittedGarments
176.089 215.634 22.5 521.505 661.371 26.8 296 307
TOTAL Chapter 62 Woven
Garments190.507 247.780 30.1 1.277.754 1.571.303 23.0 671 634
Total Clothing - (CH 61+62) 366.980 465.083 26.7 1.799.260 2.232.699 24.1 490 480
Total Textile - (CH 50-60+ 63)
1.236.756 1.203.863 - 2.7 2.119.903 2.277.799 7.4 171 189
Total 1.603.736 1.668.946 4.1 3.919.162 4.510.498 15.1 244 270

8/13/2019 Euratex nr 2
http://slidepdf.com/reader/full/euratex-nr-2 201/214
BULLETIN 2013/2
201
EU27 (External Trade) Textile and Clothing Trade 2011 - 2012Country :
VietnamIMPORTS EXPORTS Coverage E/I
Unit : 1000 € 2011 2012 Evol. % 2011 2012 Evol. % 2011 2012
Natural fibers 1.805 666 - 63.1 2.829 9.000 218.2 157 1,351
Silk 242 88 - 63.5 0 1 0 1
o.w. raw silk 242 88 - 63.5 0 0 0 0
Wool, fine or coarse animalhair
70 0 - 100.0 97 234 140.0 140
o.w. wool, not carded orcombed
53 0 - 100.0 0 0 0
o.w. wool and fine or coarseanimal hair
0 0 1 95
Cotton 1.468 561 - 61.8 2.731 8.763 220.8 186 1,561
Other vegetable fibres 26 17 - 36.1 0 3 0 17
o.w. flax 13 0 - 100.0 0 3 0
Man-made fibres 31.343 31.895 1.8 1.183 1.928 63.0 4 6
Synthetic filament tow 0 4 9025.0 4 5 16.9 10,625 136Synthetic staple fibres 30.846 31.079 0.8 1.177 1.920 63.0 4 6
Artificial staple fibres 0 44 0 0 0
Yarns and Threads 17.981 23.435 30.3 4.302 4.782 11.2 24 20
Silk 8.186 9.908 21.0 0 7 0 0
Wool 0 0 961 1.582 64.7
o.w. carded wool, n.p.r.s. 0 0 267 321 20.1
o.w. combed wool, n.p.r.s. 0 0 464 948 104.4
Cotton 882 3.632 311.9 314 152 - 51.6 36 4
o.w. cotton yarn, n.p.r.s. 880 3.632 312.8 293 107 - 63.6 33 3
o.w. cotton yarn, p.r.s. 2 0 - 97.4 20 45 122.4 1,054 90,48
Other - Vegetable yarns 0 0 14 107 668.1
Man-made filaments yarns 2.708 4.625 70.8 2.277 2.539 11.5 84 55
o.w. sewing thread 97 35 - 64.2 565 557 - 1.4 584 1,608o.w. synthetic filament yarn 2.611 4.217 61.5 1.047 1.704 62.7 40 40
o.w. artificial filament yarn 0 367 331 157 - 52.7 43
o.w. synthetic monofilament 1 6 742.9 215 103 - 52.3 30,753 1,739
Man made staple yarns 6.205 5.270 - 15.1 737 396 - 46.3 12 8
o.w. man made staple yarns,n.p.r.s.
6.015 5.101 - 15.2 705 388 - 45.0 12 8
o.w. man made staple yarns,p.r.s.
190 169 - 11.1 32 8 - 74.9 17 5
Woven fabrics 9.168 9.519 3.8 54.182 52.518 - 3.1 591 552
Silk 170 43 - 74.5 4.226 3.103 - 26.6 2,49 7,178
Wool 25 11 - 55.9 8.007 9.224 15.2 31,672 82,723
o.w. carded wool 25 7 - 71.3 5.518 6.099 10.5 21,827 84,119
o.w. combed wool 0 4 2.485 3.123 25.7 80,088
Cotton 441 658 49.2 15.335 17.140 11.8 3,479 2,607
o.w. cotton, unbleached 2 10 425.7 297 349 17.7 15,858 3,55
o.w. cotton, dyed 265 314 18.7 5.411 6.253 15.6 2,044 1,99
o.w. denim fabric 1 20 1685.6 1.322 436 - 67.0 119,094 2,199
Other fabrics 494 173 - 65.0 1.445 1.095 - 24.2 293 633
o.w. flax 12 3 - 75.0 1.408 1.076 - 23.6 12,245 37,347
Synthetic and artificial fila-ment yarn
4.630 4.817 4.0 9.297 7.548 - 18.8 201 157
o.w. synthetic filament yarn 4.630 4.814 4.0 8.817 7.234 - 18.0 190 150
o.w. artificial filament yarn 0 4 7260.0 480 313 - 34.8 960,74 8,515
Synthetic and artificialsstaple fibres
1.206 943 - 21.8 10.782 10.142 - 5.9 894 1,075
o.w. containing > 85% ofsynthetic
215 109 - 49.2 749 1.675 123.5 349 1,534
o.w. containing < 85% ofsynthetic
153 21 - 86.2 584 211 - 63.9 381 998

8/13/2019 Euratex nr 2
http://slidepdf.com/reader/full/euratex-nr-2 202/214
BULLETIN 2013/2
202
EU27 (External Trade) Textile and Clothing Trade 2011 - 2012 (continued)Country :
VietnamIMPORTS EXPORTS Coverage E/I
Unit : 1000€
2011 2012 Evol. % 2011 2012 Evol. % 2011 2012o.w. containing < 85% syn-thetic mixed natural fibres
601 634 5.4 3.333 2.909 - 12.7 554 459
o.w. other synthetics 164 82 - 49.8 5.629 3.749 - 33.4 3,439 4,563
o.w. artificial staple fibres 73 96 32.3 487 1.599 228.4 668 1,658
Special woven fabrics 2.202 2.866 30.2 5.047 4.264 - 15.5 229 149
o.w. pile fabrics 8 2 - 79.0 739 695 - 6.0 8,793 39,464
o.w. narrow woven fabrics 1.285 2.072 61.2 2.516 2.210 - 12.2 196 107
o.w. labels, badges 378 382 1.0 1.125 795 - 29.3 298 208
o.w. embroidery 173 40 - 76.8 329 313 - 4.9 190 779
Knitted fabrics 10.279 14.062 36.8 36.244 32.485 - 10.4 353 231
Pile fabrics 37 12 - 68.8 9.230 6.663 - 27.8 24,811 57,341
< 30 cm; w 5% or moreelastome
254 316 24.3 366 349 - 4.5 144 111
> 30 cm; w 5% or moreelastome
8.578 12.367 44.2 6.257 7.706 23.2 73 62
Curtain fabrics and raschellace
336 322 - 4.1 17.976 14.016 - 22.0 5,35 4,351
Other fabrics 1.075 1.045 - 2.7 2.416 3.750 55.2 225 359
Carpets 1.085 631 - 41.8 956 1.123 17.5 88 178
Knotted carpets 64 202 216.9 15 107 618.0 23 53
Woven carpets 266 28 - 89.3 351 403 14.9 132 1,422
Tufted carpets 10 2 - 75.9 507 344 - 32.1 4,954 13,938
Carpets of felt 0 0 45 57 26.0
Other textiles 123.859 153.810 24.2 40.902 37.794 - 7.6 33 25
Wadding, felt, nonwovens,rubber thread, twine, cor-dage, etc.
6.039 7.526 24.6 9.657 11.211 16.1 160 149
o.w. felt 0 6 808 1.396 72.9 25,025o.w. nonwovens 1.603 1.933 20.6 4.968 5.835 17.4 310 302
o.w. special yarn 0 0 17 36 106.2
o.w. twine, rope 427 515 20.6 1.983 2.041 2.9 464 396
o.w. nets 2.958 3.395 14.8 34 73 116.6 1 2
Handwoven tapestries &quilted products
29 14 - 51.8 1.054 337 - 68.0 3,665 2,434
Impregnated, coated, etc,,textile fabrics
18.080 26.414 46.1 27.441 22.382 - 18.4 152 85
o.w. tyre cord fabric 17.031 22.834 34.1 0 158 0 1
o.w. fabrics impregnated,coated etc,
864 688 - 20.4 23.320 19.371 - 16.9 2,699 2,817
o.w. textile products, articlesfor technical uses
17 22 24.4 2.382 1.472 - 38.2 13,621 6,767
Other made up textilearticles
99.485 119.324 19.9 1.127 1.652 46.7 1 1
o.w. sacks and bags 16.305 13.998 - 14.2 66 45 - 32.2 0 0
o.w. tarpaulins, sunblinds& alike
19.197 16.139 - 15.9 18 60 230.9 0 0
o.w. other : floorcloths,dishcloths etc
63.929 89.078 39.3 480 949 97.9 1 1
Worn clothing and otherworn articles
30 106 253.3 524 574 9.6 1,743 541
Home textiles 38.881 23.284 - 40.1 285 379 32.9 1 2
Bedlinen, table, toilet andkitchen linen
8.224 8.642 5.1 67 248 270.2 1 3
o.w. Bedlinen, woven 3.923 4.072 3.8 9 49 437.6 0 1
o.w. toilet linen 1.302 2.178 67.2 56 153 174.9 4 7
o.w. table linen, woven 2.074 1.428 - 31.1 1 19 2979.0 0 1
Curtains 4.777 5.384 12.7 229 111 - 51.4 5 2
Other furnishing articles 25.769 8.983 - 65.1 7 17 147.8 0 0
Garments 1.687.764 1.732.064 2.6 19.079 19.059 - 0.1 1 1

8/13/2019 Euratex nr 2
http://slidepdf.com/reader/full/euratex-nr-2 203/214
BULLETIN 2013/2
203
EU27 (External Trade) Textile and Clothing Trade 2011 - 2012 (continued)Country :
VietnamIMPORTS EXPORTS Coverage E/I
Unit : 1000€
2011 2012 Evol. % 2011 2012 Evol. % 2011 2012Occupationals (woven) 82.701 80.545 - 2.6 97 144 49.2 0 0
Men’s ensembles 16.157 9.339 - 42.2 4 7 95.2 0 0
Men’s jackets 13.569 16.403 20.9 5 24 343.3 0 0
Men’s trousers 35.380 36.414 2.9 73 48 - 34.5 0 0
Men’s overalls 7.720 9.087 17.7 0 1 0 0
Other men’s occupationals 6.574 6.317 - 3.9 5 62 1235.3 0 1
Women’s ensembles 75 1 - 98.7 0 0 0 5
Women’s jackets 248 191 - 23.0 0 0 0 0
Women’s trousers 1.042 1.006 - 3.5 8 0 - 100.0 1 0
Women’s overalls 1 0 - 95.4 2 0 - 75.9 200 1,05
Other women’s occupation-nals
1.935 1.788 - 7.6 1 2 275.4 0 0
Men’s Clothing (knitted and
woven) 630.750 668.034 5.9 1.964 2.472 25.9 0 0
Overcoats 182.309 176.102 - 3.4 280 118 - 57.9 0 0
o.w. woven 170.917 164.188 - 3.9 252 112 - 55.6 0 0
Suits 1.254 2.130 69.9 54 137 153.6 4 6
o.w. woven 1.244 2.118 70.3 37 137 270.9 3 6
Ensembles 16.934 10.445 - 38.3 29 79 170.6 0 1
o.w. woven 16.731 10.275 - 38.6 26 78 197.4 0 1
Jackets and blazers 35.983 49.719 38.2 171 197 15.3 0 0
o.w. woven 33.400 48.408 44.9 168 155 - 7.4 1 0
Trousers 177.504 189.891 7.0 956 1.093 14.3 1 1
o.w. woven 169.186 182.363 7.8 848 988 16.5 1 1
Shirts 178.600 197.406 10.5 447 720 61.1 0 0
o.w. woven 148.293 149.864 1.1 367 499 36.1 0 0
Underpants, briefs, etc. 19.150 17.875 - 6.7 2 6 294.5 0 0
o.w. knitted 15.122 13.854 - 8.4 0 5 3883.3 0 0
Swimwear 2.280 3.048 33.7 0 3 9366.7 0 0
Tracksuits 9.843 14.739 49.7 5 9 75.0 0 0
Women’s Clothing (knittedand woven)
614.920 657.395 6.9 6.245 7.612 21.9 1 1
Overcoats 222.061 219.559 - 1.1 231 175 - 24.4 0 0
o.w. woven 196.844 196.375 - 0.2 173 168 - 2.6 0 0
Suits 352 329 - 6.7 258 164 - 36.3 73 50
o.w. woven 237 302 27.5 227 155 - 31.7 96 51
Ensembles 635 1.009 58.9 151 152 0.7 24 15
o.w. woven 450 743 65.3 139 152 9.2 31 20
Jackets 40.852 65.272 59.8 175 121 - 30.7 0 0
o.w. woven 37.394 59.202 58.3 170 115 - 32.6 0 0Skirts and dresses 61.450 80.971 31.8 1.991 2.269 13.9 3 3
o.w. woven 46.028 59.555 29.4 1.621 1.941 19.7 4 3
Trousers 184.919 175.717 - 5.0 1.152 1.915 66.3 1 1
o.w. woven 148.102 137.382 - 7.2 1.106 1.891 70.9 1 1
Blouses 51.040 60.117 17.8 469 660 40.6 1 1
o.w. woven 36.393 41.978 15.3 398 492 23.5 1 1
Slips, petticoats, etc. 22.370 25.277 13.0 8 26 212.7 0 0
o.w. knitted 20.238 23.350 15.4 8 19 136.7 0 0
Swimwear 12.726 8.207 - 35.5 56 34 - 39.9 0 0
Tracksuits 16.410 19.048 16.1 472 364 - 22.9 3 2
Others (knitted and woven) 442.003 406.576 - 8.0 10.861 8.975 - 17.4 2 2
Babies’ garments 14.758 17.886 21.2 36 26 - 28.5 0 0
o.w. knitted or crocheted 4.597 5.409 17.7 23 16 - 30.6 1 0
T-shirts 74.830 83.480 11.6 627 710 13.3 1 1
Jerseys, pullovers, cardigans 108.141 99.118 - 8.3 546 711 30.4 1 1

8/13/2019 Euratex nr 2
http://slidepdf.com/reader/full/euratex-nr-2 204/214
BULLETIN 2013/2
204
EU27 (External Trade) Textile and Clothing Trade 2011 - 2012 (continued)Country :
VietnamIMPORTS EXPORTS Coverage E/I
Unit : 1000 € 2011 2012 Evol. % 2011 2012 Evol. % 2011 2012
Special garments 111.199 105.756 - 4.9 3.152 2.107 - 33.2 3 2
o.w. woven 109.649 101.757 - 7.2 2.220 1.290 - 41.9 2 1
Other garments, knitted orcrocheted
3.692 4.283 16.0 2.080 1.290 - 38.0 56 30
Gloves 27.838 29.442 5.8 266 467 75.5 1 2
Ties, bow ties, and cravats 6.383 6.101 - 4.4 59 129 117.8 1 2
Shawls, scarves, mufflers,mantillas, etc
1.801 1.600 - 11.1 257 129 - 49.6 14 8
Pantyhose, tights, stockings,socks, etc
4.458 3.625 - 18.7 382 443 16.0 9 12
Brassières, girdles, corsets,etc,
45.678 32.820 - 28.2 407 449 10.1 1 1
Other accessories 1.191 1.436 20.5 3.095 2.063 - 33.3 260 144
TOTAL Chapter 61 Knitted
Garments 452.282 458.127 1.3 5.963 5.634 - 5.5 1 1
TOTAL Chapter 62 WovenGarments
1.235.484 1.273.937 3.1 13.116 13.425 2.4 1 1
Total Clothing 1.687.765 1.732.064 2.6 19.079 19.059 - 0.1 1 1
Total Textile 234.402 257.319 9.8 147.712 145.358 - 1.6 63 56
Total 1.922.167 1.989.383 3.5 166.791 164.417 - 1.4 9 8

8/13/2019 Euratex nr 2
http://slidepdf.com/reader/full/euratex-nr-2 205/214
BULLETIN 2013/2
205
› EVOLUTION DES EXPORTATIONS
TEXTILE-HABILLEMENT EN 2012En 2011, l’amélioration de +13.3% en valeur des exportations
extra-communautaires en produits textile & habillement del’UE peut en partie s’expliquer par la hausse des matières
premières textiles. De fait, l’évolution des exportations en
volume s’est avérée pratiquement nulle (-0.3%).
En 2012, l’envolée des prix des matières premières est retom-bée vers des cours plus normaux ce qui a permis le retour à
une situation non faussée par cette turbulence. Par la suite,
la situation économique mondiale s’est fortement altérée,en particulier dans l’Union Européenne.
De l’analyse des données statistiques de l’année 2012, nous
pouvons retenir que les exportations extra-communau-
taires ont permis à l’industrie textile-habillement de l’UEde « survivre » face à un contexte intra-communautaire en
grande difficulté. De ce fait, les exportations de textiles versdes pays transformateurs d’articles finaux, ont commencé
à subir les conséquences de la baisse des carnets d’ordre
du détail, d’une demande atone des consommateurs bienque les conditions climatiques de 2012 fussent considérées
comme excellentes. Cette situation s’est traduite par lesvariations suivantes :
› Exportations extra-communautaires
de textile-habillement de l‘UE-27 en valeur : + 6.2% › Exportations extra-communautaires
de textile-habillement de l‘UE-27 en volume : + 5.6%
Comparée à l’année précédente, il est évident que l’effethaussier des cours des matières premières n’a plus autant
d’influence et que la situation est redevenue normale. Par
contre, nous nous retrouvons dans une conjoncture économ-ique mondiale qui tend à rappeler la période 2008-2009. La
chaine textile-habillement de l’UE, une fois reconstituée, doit
faire face à un nouvel accès de crise économique internation-ale surtout concentré dans sa zone de prédilection, qui heu-
reusement s’accompagne d’une consommation en haussedans les pays émergeants non encore touchés.
L’industrie Textile-Habillement européenne s’est bien com-
portée, au niveau de ses exportations extra-communau-
taires, face à un taux de change USD/Euros variable et pastoujours en notre faveur ainsi qu’à des cours du pétrole tou-
jours élevés. Malgré tout, le prix unitaire moyen des expor-tations textile-habillement s’est accru très légèrement de +
0.7% par rapport à 2011.
Dans ce début de conjoncture morose, il apparait que la con-
sommation d’articles confectionnés en provenance de l’UE
par certains pays en voie de développement tend à augment-er, ce qui a produit les résultats suivants :
› Une hausse des exportations en textiles de +2.8% pour une
valeur de 21.77 Mds euros (hausse de +6% en volume). › Une hausse des exportations en habillement de +10% pour
une valeur de 20.26 Mds euros (hausse de +1.8% en volume).
Au cours de l’année 2012, l’ajustement des besoins de pro-
duits dans l’industrie textile s’est poursuivi lentement. Les
industriels ont dû s’adapter au fur et à mesure suite à l’atoniedu marché intra-communautaire liée à la gestion des budg-ets des ménages face à l’installation progressive de la crise
économique (l’habillement étant le premier poste touché par
la réduction).
Pour les stades de transformation textile situés en amont,la chute de la demande finale s’est répercutée sur leurs ac-
tivités respectives bien que les prix des matières premières
soient redevenus normaux. Ainsi la filature, le premier stadede transformation pris dans son intégralité (tous types de
filature confondus: coton, laine peignée, laine cardée, lin,
synthétique et artificielle), a vu ses exportations presquestagner avec une légère baisse de -0.6% en valeur mais de
-4.5% en volume (toutefois le prix moyen du kilogramme defil en 2012 reste supérieur).
L’étape de transformation suivante, le tissage, secteur tradi-
tionnellement très productif et très orienté à l’export, s’est
comporté de façon analogue à la filature. Ses exportationsont également stagné avec une légère baisse de -0.6% en
valeur mais -4.8% en volume.
Quant aux autres stades et produits textiles, leurs exporta-tions présentent plus ou moins un comportement similaire,
à savoir : › Tissus tricotés : - 3.9% en valeur et + 1.1% en volume. › Tapis et carpettes : + 5.1% en valeur et -0.6 % en volume.
› Autres produits textiles : + 6.0% en valeur et + 4.2% envolume.
Nous sommes ici loin des variations annuelles à deux chiffresobservées en 2011. L’embellie ne fut qu’éphémère et le retour
à la réalité difficile à supporter tant sur le plan économiqueque sur l’emploi.
Dans l’habillement, les exportations de l’UE-27 ont bénéficié
d’une demande extérieure inattendue et inespérée, ce qui apermis à l’industrie textile-habillement de l’UE de lisser enpartie la carence du marché intérieur.

8/13/2019 Euratex nr 2
http://slidepdf.com/reader/full/euratex-nr-2 206/214
BULLETIN 2013/2
206
Comme indiqué précédemment, exportations extra-commu-
nautaires en habillement ont augmenté en valeur. Avec une
hausse de +11.3% (+2.3% en volume), la demande en articles
confectionnés tissés fut nettement plus vigoureuse que la
demande en articles confectionnés tricotés avec +7.6% envaleur (+1.2% en volume).
En valeur relative, la demande en articles masculins (+13.5%
en valeur) fut supérieure à la demande de produits féminins
(+11.5% en valeur). Toutefois, les exportations d’articles
féminins restent prépondérantes ; elles représentent 38.7%
des exportations totales de l’habillement contre 22.6% pour
les exportations d’articles masculins.
Au niveau international, la demande de produits européens
en textile-habillement s’est accrue en valeur, dans de nom-
breux marchés plutôt consommateurs de produits finis quede produits intermédiaires. Certaines nations à fort pouvoir
d’achat et même certains pays en voie de développement dy-
namiques, enregistrent les plus fortes augmentations, crois-
sances à deux chiffres avec comme leaders les USA (+15.1%),
la Russie (+11.6%), le Japon (+15.1%), la Chine (+12.4%), les
Emirats Arabes Unis (+15.7%) ou l’Australie (+27.3%). Seule la
Suisse (-1.4%) n’est pas présente dans cette liste.
Les nations fortement transformatrices en articles confec-
tionnés souffrent de la faible demande du marché interne
de l’UE. Elles sont très souvent en recul comme la Tunisie
(-11.6%), l’Egypte (-1.2%) ou le Maroc (-0.6%).
EXPORTATIONS TEXTILES
Fibres naturelles. – L’UE-27 produit peu de fibres naturelles
en volume, comparée à la production mondiale, mais son
activité de négoce reste importante. Toutefois, la chute des
cours pendant l’année 2011, a entrainé une chute des prix uni-
taires moyens de -16% d’où cette année, une inversion entre
valeur et volume puisque les exportations ont progressé de
+25.5% en valeur mais de +49.2% en volume.
Bien qu’elle soit en net recul (-6.2%), la Chine reste le princi-
pal client avec plus d’un tiers des exportations totales de ce
secteur (34.6% en valeur alors qu’elle représentait 46.5% desexportations en 2011). Cette baisse provient d’une réduction
des achats en laine brute (-4.2%), de lin (-3.1%) et de coton
(-13.1%).
Idem pour l’Egypte dont la part de marché est passée d’une
année sur l’autre de 4.3% à 2.2% avec un recul des achats de
fibres naturelles de -34.3% imputable à la laine (-28.1%) et au
coton (-37.8%).
Par contre les exportations vers des pays gros consomma-
teurs comme la Turquie (+83.9%), l’Indonésie (+123.4%), le
Pakistan (+693%) ou la Malaisie (+1021%) affichent des taux
de croissance exceptionnels grâce au coton principalement.
On peut se demander si ces exportations de fibres textiles,
exportations exceptionnelles compte tenu de la conjoncture
actuelle, ne constituent pas des stocks prévisionnels pour
entrainer la chute des cours ultérieurement.
Fibres synthétiques & artificielles. - Les exportations ex-
tra-européennes de l’UE-27 ont profité de la situation descours des matières textiles (-1.5% du prix unitaire moyen)puisqu’elles ont augmenté de +2.2% en valeur et de +3.8%
en volume (+8% en valeur et -1.7% en volume en 2011).Trois grandes nations textiles, la Turquie (+9.3%), la Chine(+33.2%), l’Inde (+26.7%) ont accru leurs achats. On peut leur
adjoindre la Russie (+35.4%), le Bangladesh (+20.5%) tandisque les exportations ont chuté de façon importante aux USA
(-10.8%), en Iran (-35.6%) et en Suisse (-19.9%).Les exportations extra-communautaires ont surtout béné-
ficié aux câbles de fibres artificielles (+29.4% en valeur et+15.8% en volume) et à degré moindre, aux fibres synthé-
tiques discontinues (+1.1% en valeur et +6.6% en volume).
On ne peut s’empêcher de se demander si la remarque pré-cédente, sur les acquisitions de fibres par des pays transfor-mateurs dans le contexte actuel, peut être appliquée égale-
ment aux fibres synthétiques et artificielles.
Fils et filés. – A partir de ce stade de transformation, nousretrouvons une situation plus en phase avec la conjoncture
économique du moment, situation qui se traduit par desexportations de fils presque stables en valeur, malgré une
légère baisse (-0.6%), alors qu’en volume l’évolution est en
net retrait (-4.5%), ceci permettant de maintenir le prix uni-taire moyen du fil (+4.1% mais variable selon les matièrestextiles employées).Les exportations de filaments continus de fibres synthé-
tiques, partie la plus importante de ce stade de transforma-tion (59%) ont reculé légèrement (-0.8% en valeur et -4.4% en
volume). Les fils de coton (9% des exportations de ce stade)sont également en recul (-7.8% en valeur et -5.7 en volume).
Les fils de laine (17%) et de fibres synthétiques discontinues(14%) sont en progression respectivement de +1.1% en valeur
(mais -13% en volume) et +3.9% en valeur (+3.4% en volume). Parmi les principaux clients de fils, la Suisse, la Tunisie, le
Maroc et l’Egypte présentent une régression tant en valeurqu’en volume avec respectivement -7.1%, -15.7%, -10.1% et
-8.1%. Dans les autres cas, les hausses en valeur sont rela-tivement faibles et très souvent accompagnées de baisses
en volume comme aux USA (+6.3%), Hong-Kong (+4.3%), laChine (+2.4%), la Russie (+1.3%). La Turquie, notre principal
acheteur en volume, reste stable dans ses achats de fils eu-ropéens.
Tissus tissés. – Ce secteur de produits textiles continued’être l’un des pôles majeurs des exportations extra-euro-
péennes de l’UE-27 avec 28.1% des exportations totales tex-
tiles. En 2012, il s’est comporté comme la filature avec unelégère baisse des exportations (-0.6% en valeur et -4.8% envolume). Comme l’année précédente, qu’ils soient en soie, en

8/13/2019 Euratex nr 2
http://slidepdf.com/reader/full/euratex-nr-2 207/214
BULLETIN 2013/2
207
laine, en coton, en fibres synthétiques ou artificielles discon-
tinues, ils affichent une baisse des exportations en volumesauf les tissus réalisés avec des filaments continus de fibres
chimiques.
En valeur, la variation 2012/2011 est positive pour les tissus delaine (+2.4%), les tissus de fibres synthétiques ou artificiellesdiscontinues (+2.5%) ou continues (+4%). Les exportations
de tissus spéciaux (13% des exportations) sont également enhausse (+3.9% en valeur mais -7.2% en volume).
En tissus de laine (17% des exportations), la demande estmeilleure pour les tissus de laine cardée (+5.3% en valeur)
qu’en laine peignée (+1.2% en valeur).Les tissus en coton représentent toujours la part la plus im-
portante des exportations (33%) mais elles sont en retrait de-6.6% en valeur.
En ce qui concerne les principaux clients, on constate que lesexportations vers des pays gros acheteurs comme la Tunisie
et le Maroc sont, pour la seconde année consécutive en reculavec respectivement en valeur -14.1% (14.4% en volume) et
-1.7% (-6.7% en volume), ainsi qu’en Suisse avec -9.1% (-12.5%en volume). Par contre elles sont en nette progression tant en
valeur qu’en volume vers les USA (+17.9%), la Chine (+7.3%) laRussie (+8.4%), le Japon (+14%).
Tissus tricotés. – Conséquence de la faible demande de l’UE,
les exportations de tissus tricotés, surtout vers les principaux
pays acheteurs, ont enregistré une baisse très significativedu prix unitaire moyen (-4.9%) ce qui s’est traduit par une
baisse de -3.5% en valeur mais une hausse de +1.1% en vol-ume. Les tissus en velours se sont maintenus avec -0.2% en
valeur (+6.5% en volume), idem pour les rideaux et broderiestricotés sur métiers Chaine ou Raschel avec -3.4% en valeur
(+7% en volume).Les deux principaux acheteurs sont le Maroc (17% des expor-
tations) en recul de -1.9% en valeur (+10.7% en volume) et laTunisie (15% des exportations) en recul également de -13.9%en valeur (-10.5% en volume). La seule note positive de ce
secteur provient des exportations vers la Chine avec +3.7%en valeur (+4.3% en volume).
Tapis et carpettes. – Pour la troisième année consécutive, le
secteur des tapis et carpettes a continué sa progression enaugmentant à nouveau ses exportations de +5.1% en valeur
mais -0.6% en volume, ce qui lui a permis d’accroitre sonprix unitaire moyen de +5.6%. Les moquettes tuftées, qui
représentent la plus grande part des exportations (40%),ont accru leurs exportations de +11.4% en valeur (+6.6% envolume) ainsi que les moquettes et carpettes tissées (33%
des exportations) avec +4.1% en valeur (-2.2% en volume).Les exportations des moquettes aiguilletées sont en perte de
vitesse.
Si les deux principaux acheteurs que sont les USA (-4.9%)et la Suisse (-4.6%) sont en net retrait, les exportations ontexplosé vers la Russie (+8.4%), la Norvège (+10.5%), le Japon
(+13.7%), l’Australie (+12.8%) et surtout vers la Chine (+44.9%)et Singapour (+75.2%).
Autres textiles. – Ce secteur a représenté en 2012, 33.3% des
exportations totales de textiles de l’UE-27. C’est un secteurtrès important, très exportateur avec un montant total de
7.25 Mds Euros, soit un accroissement de +6% (+4.2% en vol-ume) qui tend à se substituer au leadership du secteur tis-sage grâce aux développements et à la valeur ajoutée qu’ilgénère surtout dans les tissus techniques.Les bons résultats ont été obtenus surtout dans les ventes
de non-tissés avec un accroissement de +6.8% à 1 492 Mioseuros et dans les tissus enduits, fils pour pneumatiques,etc. avec +1.5% à 2 065 Mios euros, ces deux sous secteursreprésentants 49% des exportations des autres textiles.
Cette évolution positive des ventes s’est surtout expriméeparmi les principaux acheteurs traditionnels que sont lesUSA (+13.6%), la Russie (+20.5%), la Norvège (+0%) et la Chine(+8.8%) alors que la Suisse (-2.9%) et la Turquie (-8.3 %) sont
en retrait.
Textiles de maison. – En 2012, tout ce qui concerne l’habitatétait en demande ce qui s’est traduit par un accroissement
constant des exportations depuis 2010. Elles ont progressé de+9.8% en valeur (+1.8% en volume). Tous les produits de lingede table, de literie, de toilette, réalisés en général en coton,ont retrouvé un second souffle suite à la baisse de cette mat-
ière ce qui leur permet d’afficher une progression de +7.5%en valeur (+5% en volume). Ces produits représentent 60%des exportations des textiles de maison.
Les ordres d’achats sont surtout venus de Suisse (+6.5%),
de Russie (+14.9%), du Japon (+14%) et d’Arabie Saoudite(+14.1%) et du Qatar (+84.7%).
EXPORTATIONS DE PRODUITSD’HABILLEMENT
Vêtements de travail. – Dans l’ensemble, on peut mention-ner que les exportations de vêtements de travail sont restéesstables en 2012 avec une légère baise de -0.4% en valeur(+0.6% en volume) sans toutefois oublier que ce secteur nereprésente que 1% des exportations d’habillement européen.
Parmi les sous rubriques de ce secteur, les exportations desarticles de travail masculins, tous types confondus, sont enbaisse de -4.3% (surtout les combinaisons de travail -37.1%)tandis que dans le secteur féminin, ils sont en hausse de
+16.5% en particulier les pantalons (+24.7%) et les salopettes(+70.7%).Parmi les deux principaux acheteurs de ces produits, la Nor-vège a diminué ses achats de -9.2% tandis que la Suisse, le
plus important, ne les a augmentés que de +2.2%. On peutégalement ajouter parmi les autres acheteurs, la Russie(+18.8%), les USA (+19.7%), les Emirats Arabes Unis (+48.5%),

8/13/2019 Euratex nr 2
http://slidepdf.com/reader/full/euratex-nr-2 208/214
BULLETIN 2013/2
208
l’Arabie Saoudite (+31.6%) et surtout l’Ukraine (+130.6%) et laChine (+101.2%).
Habillement masculin. - Les exportations extra-européennes
de l’UE-27 en habillement masculin ont représenté 22.6%du montant total des exportations du secteur habillement(21.8% en 2011) soient une progression en valeur de +13.5%(+24% en 2011). Cette hausse s’est réalisée dans un contexteinternational difficile mais encore demandeur surtout danscertains pays émergeants avides de consommation.
De l’analyse des articles masculins vendus, les manteaux(16% des exportations de l’habillement masculin) affichentla plus forte progression (+32.7%) tandis que les pantalons(30% des exportations et produit le plus exporté en valeur
absolue) enregistrent une augmentation de +13.3%. Les ex-portations de vestes et blazers sont aussi en hausse avec+27.7% ainsi que celles de costumes (+11%).
Dans la liste des principaux acheteurs d’articles masculins,les pays développés ont affiché très souvent une progression

8/13/2019 Euratex nr 2
http://slidepdf.com/reader/full/euratex-nr-2 209/214
BULLETIN 2013/2
209
à deux chiffres de leurs achats tels que la Russie (+12.7%), lesUSA (+31%), le Japon (+21.2%), l’Australie (+128.6%), la Chine(+20.2%) et la Corée du Sud (+21.6%), à l’exception du numéroun : la Suisse (+3.6%). De nombreux pays en voie de dével-
oppement affichent aussi une progression à deux chiffrescomme les Emirats Arabes Unis (+23.7%), l’Arabie Saoudite(+40.7%), le Kazakhstan (+27.4%) voire le Liban (+16.8%) mal-gré la situation politique et économique tendue.
Habillement féminin. – A l’image de l’habillement masculin,les exportations extra-européennes de l’UE-27 d’habillementféminin ont augmenté de +11.5% pour s’élever à 7.85 Mds Eu-ros (+19.4% en 2011). Comme ce secteur représente 39% desexportations totales d’habillement, l’augmentation 2012/2011en valeur absolue (807 Mio. Euros) est nettement supérieureà celle de son homologue masculin (542 Mio. Euros).
A l’exception des ensembles (-4.2%) et des tailleurs (-6.8%)qui ont été légèrement boudé par la clientèle étrangère, tous
les autres articles féminins ont été ont fait l’objet d’unecertaine demande. Les robes et jupes, articles les plus re-cherchés (24% des exportations féminines) ont affiché uneprogression de +16.6%, tandis que l’autre produit phare, lespantalons (17% des exportations féminines) une hausse de+12.7%.En accroissement relatif, la palme revient aux manteaux (11%des exportations féminines) avec + 15.8% (+27.3% en 2011). Leschemisiers sont également en nette demande avec +11.5% en2012 (+19.3% en 2011).
De façon similaire à l’habillement masculin, plusieurs paysprésentent un accroissement à deux chiffres de leurs achats
d’habillement féminin. Les marchés les plus demandeursen 2012 on été la Russie avec +15.1% (+24% en 2011), les USA
avec +17.4% (+14.3% en 2011), Hong-Kong avec +17.7% (+32.7%en 2011), la Chine avec +50.1% (+61.6% en 2011), auxquels onpeut ajouter la Corée du Sud (+29.8%), l’Australie (+93.9%) etmême certains pays du golfe persique comme les Emirats Ar-
abes Unis (+22.2%) ou l’Arabie Saoudite (+22.2%). Parmi lesgros clients, seule la Suisse est en léger recul (-2.4% comparéà 2011).
Autres articles d’habillement et accessoires. – Ce secteur ras-semble toute une série d’articles, colifichets et autres acces-soires pour habillement. Son poids est loin d’être négligeable.En 2012, ses exportations extra-européennes ont représentéen valeur 39% des exportations totales de l’habillement.
Les pulls et autres cardigans constituent la plus importantesous-catégorie de ce secteur (23% en valeur) ; leurs exporta-tions vers des pays tiers ont progressé de +8.9% à 1.78 Mds
euros. Les T-shirts constituent la seconde sous-catégorieimportante du secteur (18% en valeur) ; les exportations deT-shirts se sont accrues de +3.2% à 1.38 Mds euros. Les arti-cles spécifiques (18% en valeur du secteur) voient égalementcroître leurs exportations de +18.4% à 1.42 Mds euros.Parmi les accessoires, il faut remarquer les exportations à labaisse des bas et chaussettes (-4.1%), ainsi que la hausse deschâles, étoles et mantilles (+13.1%) et des autres brassières etcorsets (+3.8%).
Les zones d’exportation sont toujours constituées par les
mêmes pays que l’habillement masculin ou féminin. De cefait, on retrouve des exportations en hausse vers les USA(+26.1%), la Russie (+3%), Hong-Kong (+5.6%), la Chine(+29%), les Emirats Arabes Unis (+11.4%) auxquels on peutajouter la Corée du Sud (+11.8%). Les pays en recul sont prin-cipalement la Suisse (-0.4%) et la Turquie (-8.7%).

8/13/2019 Euratex nr 2
http://slidepdf.com/reader/full/euratex-nr-2 210/214
BULLETIN 2013/2
210
› EVOLUTIONS DES IMPORTATIONS
TEXTILE-HABILLEMENT EN 2012Comme déjà évoqué dans le paragraphe précédent sur les
exportations, l’année 2012 voit les importations textile-habillement chuter d’une façon significative. C’est le reflet
de la situation économique que doit affronter l’Union Euro-
péenne : depuis le second semestre 2011, la crise est de re-tour, les entreprises ferment ou licencient du personnel, le
chômage augmente, la croissance se réduit lentement danschaque Etat Membre, voire même la récession économique
qui s’invite. La charge des dettes suprêmes et le poids des
problèmes sociaux à résoudre entrainent les Etats Membresà resserrer leurs gestions budgétaires ce qui impliquent des
diminutions de pouvoir d’achat des consommateurs.Les carnets d’ordres des entreprises sont de plus en plus
courts, la pression sur les prix croît, ce qui entraine progres-
sivement, sur le plan international, des répercussions dansles pays en voie de développement qui voient leurs activités
aussi se réduire et sont dans l’attente d’ordres des pays con-sommateurs.
Seul point positif observé en 2012, les conditions climatiques
en Europe ont dans l’ensemble été satisfaisantes et bien dis-tinctes, ce qui fut idéal pour le détail.
Dans ce contexte de marché intérieur de l’UE en pleine diffi-culté, il n’est pas étonnant que les importations aient chuté
tant en valeur qu’en volume. L’effet hausse des matières
premières n’étant plus d’actualité, les importations extra-communautaires textiles se sont élevées à 24.4 Mds Euros
soit une baisse de -7.7% en valeur, similaire en volume de-7.4%. De leur coté, les importations d’habillement se sont
élevées à 65.2 Mds Euros soit une régression de -4.8% en
valeur et -11.3% en volume.Dans l’habillement, les baisses observées tant en articles tri-
cotés et en articles tissés sont pratiquement identiques envaleur comme en volume.
Au total, la filière textile-habillement voit ses importationsextra-communautaires baisser de -5.6% pour s’établir à
89.6 Mds Euros. Le coté positif de cette situation de criseest qu’au final, le déficit de la balance commerciale Textile-
Habillement s’est contracté de -55.3 Mds à -47.6 Mds Euros,
soit une réduction de -13.9%. De même, le taux de couver-ture Exports/Imports s’est amélioré, passant de 42% en 2011
à 47% en 2012.
Même si la Chine et la Turquie restent les deux principaux
fournisseurs de l’UE, ceux-ci prennent de plein fouet lemanque de stimulation du marché intérieur de l’Union Eu-
ropéenne en 2012. Cela se traduit par une baisse des impor-tations européennes de textile-habillement en provenance
de Chine de -7.8% (surtout en habillement avec -9.4%) et de
Turquie de -2.6% (surtout en textile -5.5%). En parts de mar-
ché, la Chine perd un point avec 39.2% (40.2% en 2011) tan-
dis que la Turquie accroît très légèrement avec 13.5% (13.1%
en 2011). Cette situation profite surtout au Bangladesh avec
9.7% (8.5% en 2011), l’Inde et le Pakistan sont plutôt en retrait
avec respectivement 7.1% et 3.2% (7.9%, 3.5% en 2011).
IMPORTATIONS TEXTILES
Fibres naturelles. – Bien que les cours des matières premières
naturelles soient revenus à des valeurs « normales », cela n’a
pas permis aux importations de croître à nouveau. Au contrai-
re, le manque de demande intérieure de la chaine de transfor-
mation textile s’est répercuté sur les importations qui ont subi
une chute drastique de -21.3% en valeur (-15.6% en volume), ce
qui illustre bien les effets de la crise économique de l’UE.
La laine, qui contribue à plus de 68% en valeur du montant
total des importations de ce secteur, maintient sa position
car son cours reste encore à un niveau élevé, malgré une
légère baisse ; elle n’échappe pas à la tourmente avec -14.3%
en valeur (-21.9% en volume).
Idem pour le coton qui ne représente plus que 22% du
montant total des importations avec une chute de -41.2%
en valeur et -19% en volume, situation déséquilibrée qui re-
devient normale avec le retour de meilleures récoltes, mais
qui n’épargne pas cette fibre très employée.
Les importations de lin restent toujours mineures par rap-
port aux exportations puisque l’UE est le premier producteur
mondial de cette fibre.
La soie reste un produit de luxe, très marginal. Ses impor-
tations subissent également le contre coup de la récession
mais plus faiblement.
Quant à la provenance de ces matières premières textiles,
la Chine avec 29% du marché, reste le premier fournisseur
de l’UE malgré une chute de -16.1% (-29.9% en volume),
suivie par l’Australie (13% du marché) avec un recul de -11.6%
(-15.4% en volume).
La baisse des importations chinoises est surtout le fait de
la laine qui recule de -17.8%. Toutefois, pour cette fibre, les
données statistiques chinoises incluent la laine semi-trans-
formée ou laine peignée qui provient, sous la forme de laine
en suint à 75% d’Australie. L’Australie reste un important
fournisseur de laine brute et de coton brut. La Turquie main-
tient sa position de 3ème fournisseur (6.5% des importa-tions) mais en retrait de -21.5%. La chute la plus spectaculaire
est au compte de l’Argentine avec un plongeon de -48.8%.

8/13/2019 Euratex nr 2
http://slidepdf.com/reader/full/euratex-nr-2 211/214
BULLETIN 2013/2
211
Fibres synthétiques et artificielles. – Pour les mêmes rai-
sons que les fibres naturelles, les importations de fibres syn-thétiques et artificielles ont suivi le même chemin. Au total,
elles sont en baisse de -7.5% en valeur (-4.3% en volume).
Dans la diminution des importations, seuls les câbles de fi-bres artificielles affichent un accroissement de +19.8% maiscela ne concerne que 8% du montant total des importations.Tous les gros fournisseurs asiatiques sont en retrait tels que
la Corée du Sud (-0.3%), Taiwan (-10.1%), le Japon (-17%),l’Indonésie (-21.5%), l’Inde (-9.1%) ou la Thaïlande (- 28%).
A ces pays, on peut ajouter les USA (-6.0%). Rares sont lespays qui ont vu les importations de l’UE augmenter en 2012
comme la Chine (+3.6%) ou le Belarus (+3.4%).
Fils et filés. – Quand le vent souffle du mauvais coté, toute lachaine tressaille et se recroqueville. Après les matières premi-
ères, les importations de fils et filés sont également atteintespar la récession. Au total, elles baissent de -13.4% en valeuret de -9.1% en volume, baisses justifiées par la diminution
du prix des matières premières et de la demande intérieure.Les importations de fils continus de fibres synthétiques et
artificielles, partie la plus importante de ce secteur avec49% de part de marché, enregistrent une baisse de -7.6% en
valeur (-7.1% en volume) mais la plus grande chute, tant envaleur qu’en volume est au compte des filés de coton avec
-23.9% (-9.1% en volume) qui ne représentent plus que 25%du montant total.Les importations de fils de laine et fils de fibres synthétiques
et artificielle discontinues sont dans la même mouvancede retraite avec respectivement -15.6% et -14.7% (-24.8% et
-12.7% en volume).
Les deux principaux fournisseurs de l’UE-27, la Chine et laTurquie sont en baisse avec respectivement en valeur -4.9%
et -4.4% (en volume -2.8% et +4.8%). De nombreux autresfournisseurs affichent un recul à deux chiffres tels que l’Inde(-24%), l’Indonésie (-18%), la Corée du Sud (-10.8%), l’Egypte
(-23.9%), le Pakistan (-45%), la Thaïlande (-49.4%), la Malai-sie (-14.6%).
Tissus tissés. – Les importations de tissus tissés sont aussi
touchées par la récession. Elles diminuent de -6.7% en valeur(-7.9% en volume) à 4 969 Mio Euros soit 21% du montant
total des importations textiles. L’explication sur cette baissedes importations est identique à celle mentionnée pour les
fils et filés (baisse des cours, baisse de la demande intérieure).Les importations de tissus de coton, le tiers du montant to-tal du secteur, constituent la plus grande régression tant en
valeur (-16.6%) qu’en volume (-11.6%). Les tissus de soie etde laine ont réussi à limiter la baisse avec respectivement
-7.3% et -4.1%. Dans les tissus de fibres synthétiques et ar-tificielles, les tissus de filaments continus ont contredit la
situation avec une hausse de +9% alors que ceux de fibres
discontinues ont chuté de -10.9%.Les importations de tissus spéciaux ont maintenu leur pro-gression régulière de +2.9%.
La Chine reste le principal fournisseur de l’UE-27 avec 36% du
marché malgré une diminution de -5.6% en valeur des im-portations (-6.3% en volume) suivie par la Turquie (19% dumarché) avec -0.6% en valeur et -1% en volume. Le Pakistan
(10% du marché) est le pays du top dix qui régresse le plusavec -20.% en valeur et -12.1% en volume.
Tissus tricotés. – Contrairement aux autres secteurs du
textile, les importations de tissus tricotés (5% du montanttotal des importations textiles) affichent une progression
de +5.1% en valeur et de +7% en volume et atteignent 1 172Mio d’Euros.
La Turquie avec 39% du montant total des importations detissus tricotés, est le principal fournisseur avec une progres-
sion de +2.4% en valeur (+14.7% en volume) suivie de la Chine
(31% du montant du secteur) en hausse de +4.2% (4% en vol-ume) et la Corée du Sud (15% du montant du secteur) suit lamême tendance avec +30.1% en valeur (+19.2% en volume).
Tapis et carpettes. – Dans l’UE, l’engouement pour
l’amélioration de l’habitat dans l’UE subit aussi les aléas dela crise économique ainsi que le secteur du bâtiment qui
tourne au ralenti, voire est à l’arrêt. Dans ces conditions, lesimportations de moquettes et carpettes ont baissé de -4.7%en valeur -7% en volume). Cette diminution est à attribuer
surtout aux tapis et moquettes tissés (-10.8%), produit plusonéreux que les tapis et moquettes tuftées (+7.3%).
L’Inde reste le premier fournisseur de l’UE-27 avec 26% du
marché mais avec des importations en baisse pour la secondeannée consécutive de -17.1% (-5.2% en 2011) et est talonné par
la Turquie (22% du marché) en progression de +6.4% (+20.3%en 2011). La Chine (20% du marché) suit avec +5.8% alors que
l’Egypte (9% du marché) confrontée à ses problèmes sociaux,chute de –11.7%.
Autres textiles. - Avec 25.2% du marché total des importa-tions textiles de l’UE, c’est le secteur qui pèse le plus et qui
s’est maintenu en valeur avec +0.8% à 6 156 Mio. Euros maispas en volume (-3.7%).
Les importations concernent principalement trois catégories
de produits, à savoir : › Les feutres et non-tissés (20% du montant de ce secteur) :
+ 4.5%. › Les tissus enduits (19% du montant de ce secteur) :
+ 0.1%.
› Les articles textiles confectionnés (47% du montant totalde ce secteur) : + 0.4%.
La Chine reste avec 41% du marché de ce secteur, le principal
fournisseur de l’UE-27 et affiche une progression de +4.4%.
Idem pour les USA (12%% du marché) avec une hausse de+2.4%. Par contre, la Turquie (9% du marché) est en recul de-2.7%.

8/13/2019 Euratex nr 2
http://slidepdf.com/reader/full/euratex-nr-2 212/214
BULLETIN 2013/2
212
Textiles de maison. – A l’image des tapis et moquettes, lesproduits textiles pour la maison ont vu aussi leurs importa-
tions diminuer de -12.2% en valeur à 4 506 Mio. Euros (-13%en volume). Ce secteur représente encore 19% des importa-
tions textiles totales de l’UE.Cette baisse des importations se retrouve dans tous les pro-
duits qui composent le secteur, à savoir : › Linge de lit : -18.8% › Linge de toilette : -10.4% › Linge de table : -10.6% › Rideaux : - 4.6%
› Autres articles d’ameublement : - 8.3%
La Chine, avec 35% du marché, reste le principal fournisseurde l’UE-27 malgré une baisse de -3.4% en valeur (-12.2% en
volume). Le Pakistan (19% du marché), la Turquie (16% du
marché), l’Inde (13% du marché) sont les trois autres plus im-portants fournisseurs avec respectivement -16.3%, 19.2% et-18.5% en valeur (mais en baisse en volume).
A noter parmi les autres fournisseurs, les importations en fortehausse en provenance Maroc avec +51.2% (+171% en 2011).
IMPORTATIONS DE PRODUITSD’HABILLEMENT
Vêtements de travail.- Les importations de l’UE-27 de vête-ments de travail ont diminué de façon importante en 2012 avec
une baisse de -13.9% en valeur. Il faut noter que ce secteur pèseà peine 2% du montant total des importations d’habillement.Tous les produits qui composent ce secteur sont en retraittant en valeur qu’en volume.
Avec 31% du marché (37% en 2011), la Chine est le premierfournisseur de l’UE-27 et présente une chute de -24.7% envaleur (+32.7% en 2011). La Tunisie (17% du marché) et le Ma-roc (8% du marché), les deux autres principaux fournisseurs,
affichent aussi des diminutions respectives de -6.5% et -13%.
Habillement masculin. – En 2012, ce secteur représente 25.1%des importations totales en habillement de l’UE-27. Il a enreg-
istré des importations en baisse de -3.7% à 16.3 Mds Euros. Al’exception des vestes et blazers (7% du marché masculin) dontles importations sont en hausse de +3.1%, toutes les autres ca-tégories de ce secteur affichent une régression. Les manteaux(14% du secteur) sont en diminution de -9%, les pantalons
(39% du secteur) de -1.4%, les chemises (24% du secteur) de-2.9% et les sous-vêtements (8% du secteur) de -5.8%.
Dans le classement des fournisseurs, la Chine avec 37% du
marché (40% en 2011) reste de très loin le principal fournis-seur malgré une baisse sérieuse de -12.5%. Par contre, leBangladesh confirme sa deuxième position avec une aug-
mentation de +17.5% (+40.3%, en 2011) soit plus de 15% dumarché. Avec une hausse modeste de +2.7% et 10% du mar-ché, la Turquie reste le troisième fournisseur.
Parmi les autres nations, on note des hausses du Vietnam(+5.9%) et surtout du Cambodge +83.6% (+74.3% en 2011).
Habillement féminin. - En 2012, ce secteur représente encore
34.8% des importations totales en habillement de l’UE-27. Ila enregistré des importations en baisse de -4% à 22.7 Mds
Euros. Comme dans l’habillement masculin,seules les vestes (6% du secteur féminin) enregistrent desimportations en hausse de +9.2%. Toutes les autres catégo-
ries d’habillement féminin affichent une diminution des im-portations comme on peut en juger :
› Manteaux (15% des importations féminines) : -9.3% › Robes et jupes (20% des importations féminines) : -7.8%
› Chemisiers (15% des importations féminines) : -4.0% › Sous-vêtements (9% des importations féminines) : -7.3%
Seules les importations de pantalons (30% des importationsféminines) restent inchangées.
Dans le classement des principaux fournisseurs d’habillement
féminin, on retrouve toujours comme leader la Chine avec 44%du marché (45% en 2011) et une diminution très significative des
importations de -7.3%. La Turquie avec 13% du marché main-tient sa seconde place avec également une baisse modeste de
-2.1%, suivie par l’Inde (8% du marché) en recul de -17.3%. Avecdes achats en hausse de +22.8% (+32.2% en 2011), le Bangladesh(8% du marché) supplante le Maroc (5% du marché) à la quat-rième place avec -8.4%. Parmi les autres fournisseurs, on note
des importations en hausse à deux chiffres des USA (+32.6%),de Hong-Kong (+16.8%) et du Cambodge (+53.2%).
Autres articles d’habillement et accessoires. – Les produitsde ce secteur représentent 40% des importations totales de
l’habillement. En 2012, ils ont enregistré une réduction desimportations de -6.1% à 26 Mds Euros comparée à +6.9% en
2011.Ce secteur a aussi souffert de la crise économique europée-
nne et presque toutes les catégories qui le composent ontenregistré une baisse des importations: › Pull-overs et cardigans (33% des importations de ce sect-
eur) : -7.1% › T-shirts (28% des importations de ce secteur) : -3.6%
› Articles pour bébés (8% des importations de ce secteur) :-8.3%
› Chaussettes, bas et collants (6.5% des importations de cesecteur) : -7.7%
› Brassières et corsets (6.3% des importations de ce sect-eur) : -1.2%
Dans le classement des principaux fournisseurs, la Chine estle premier de la liste avec 43% du marché (45% en 2011) avec
des importations en baisse de -9.5%. Au second rang, nousretrouvons le Bangladesh qui accapare plus de 15% du mar-
ché mais avec une diminution modeste de -1.2%. La Turquiereprésente plus de 13% du secteur et voit ses importations de
l’UE baisser de -2.3%.

8/13/2019 Euratex nr 2
http://slidepdf.com/reader/full/euratex-nr-2 213/214
213

8/13/2019 Euratex nr 2
http://slidepdf.com/reader/full/euratex-nr-2 214/214


