26
Dirk JACOBS Université Libre de Bruxelles SURVEY findings of the EURISLAM project (part 1) Wednesday 20 June 2012, 13h30-14h15 Plenary Session (studio 5, Flagey)
| Date post: | 04-Jul-2015 |
| Category: |
Technology |
| Upload: | dirk-jacobs |
| View: | 315 times |
| Download: | 3 times |

Dirk JACOBS
Université Libre de Bruxelles
SURVEY findings of the EURISLAM project (part 1)
Wednesday 20 June 2012, 13h30-14h15
Plenary Session (studio 5, Flagey)

Technical fiche (1)
• SURVEY Total N=7256 of which 4942 with Muslim background
• 6 Countries: Belgium (N=1197), UK (N=1185), the Netherlands (N=1188), France (N=1185), Switzerland (N=1184), Germany (N=1317)
• Standardized questionnaire focussing on socio-cultural attitudes
• Computer assisted telephone interviewing (CATI)
• In each country a control sample of the ethnic majority group (target n=385)
• In each country a targeted sample of people with Muslim background (Moroccan, Turkish, Pakistani or Ex-Yugoslav origin, target n per group 250 or 150)
• Goal: strike a balance between cost-effectiveness, minimal sample size requirements and information on all ethnic groups in our six participating countries

Technical fiche (2)
« Muslim » samples constituted through double procedure:
(1) Use of onomastic method (name recognition) of digital phone book records (both land lines as cellular phones) aimed at identifying people of Moroccan, Turkish, Pakistani and Ex-Yugoslav origin
(2) Polling agency contacts and screens constituted samples whether theyare of the aforementioned national origins and were themselves Muslimsor of Muslim descent
Use of trained multilingual interviewers (national languages plus Arabic, Turkish, Urdu, Bosnian & Albanian)
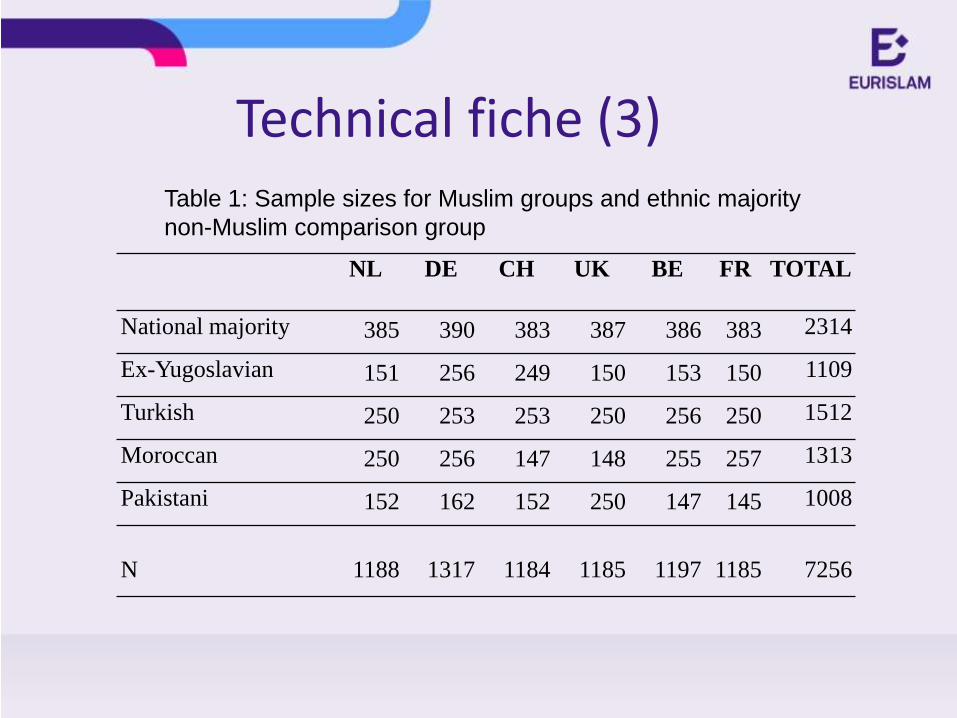
Technical fiche (3)
NL DE CH UK BE FR TOTAL
National majority 385 390 383 387 386 383 2314
Ex-Yugoslavian 151 256 249 150 153 150 1109
Turkish 250 253 253 250 256 250 1512
Moroccan 250 256 147 148 255 257 1313
Pakistani 152 162 152 250 147 145 1008
N 1188 1317 1184 1185 1197 1185 7256
Table 1: Sample sizes for Muslim groups and ethnic majority
non-Muslim comparison group

Technical fiche (4)Table 2: Response rates Belgium
BE
National majority
Numbers dialed 1946
Successful interview 19,8%
Refusal 32,2%
Incorrect number / Screened out / No contact 56,2%
Response rate (eligible contacts) 45,1%
Ex-Yugoslavian
Numbers dialed 749
Successful interview 15,6%
Refusal 32,2%
Incorrect number / Screened out / No contact 52,2%
Response rate (eligible contacts) 32,7%

Technical fiche (4)
Table 2:
Response
rates
Belgium
(continued)
BE
Turkish
Numbers dialed 1247
Successful interview 20,5%
Refusal 35,2%
Incorrect number / Screened out / No contact 44,3%
Response rate (eligible contacts) 36,8%
Moroccan
Numbers dialed 2247
Successful interview 11,4%
Refusal 29,8%
Incorrect number / Screened out / No contact 58,8%
Response rate (eligible contacts) 27,6%
Pakistani
Numbers dialed 1247
Successful interview 7,3%
Refusal 23,2%
Incorrect number / Screened out / No contact 69,4%
Response rate (eligible contacts) 24%

Gender
Blue = male
Green = female
Overall, equilibrated samples for gender
For ex-Yugoslave and Pakistani groups more men

Born in country
Blue = born outside of country
Green = born in country of residence
Pakistani in UK more often home grown

GenerationBlue = born
outside of country from parents who never lived in receiving society
Green = born outside of country from parents who migrated to receiving society
Yellow = born in country

Nationality of country of residence
NL DE CH UK BE FR
Ex-Yugoslavian 86,8% 39,1% 41,8% 70,7% 78,4% 77,3%
Turkish 83,2% 33,2% 46,2% 78,8% 88,7% 60,8%
Moroccan 93,2% 75,4% 52,4% 39,9% 82,7% 68,5%
Pakistani 90,1% 69,8% 56,6% 81,2% 76,9% 66,9%
Rate of state citizens lowest in Switzerland

Nationality of country of residence

In paid work
NL DE CH UK BE FR
National majority 55,6% 50,4% 63,7% 64,1% 56,2% 54,3%
Ex-Yugoslavian 49,7% 64,5% 74,3% 42% 62,1% 60,7%
Turkish 60,4% 48,6% 60,9% 39,2% 52% 46,4%
Moroccan 63,2% 63,1% 68,7% 41,9% 58% 47,1%
Pakistani 50,7% 41,1% 63,8% 50,4% 44,9% 50,3%

Employment sectorNL DE CH UK BE FR
National majority
Employee 79,4% 82,7% 89,3% 87,9% 88,5% 88,8%
Own business 15,4% 8,7% 9,4% 6% 6,9% 9,2%
Freelance (interim) 5,1% 6,6% 1,2% 6% 4,6% 1,9%
Ex-Yugoslavian
Employee 90,7% 80% 92,9% 81% 85,3% 85,7%
Own business 6,7% 15,8% 6,5% 12,7% 8,4% 13,2%
Freelance (interim) 2,7% 4,2% 0,5% 6,3% 6,3% 1,1%
Turkish
Employee 74,8% 82,1% 88,9% 71,1% 73,7% 81,9%
Own business 23,8% 13,8% 7,2% 13,4% 16,5% 16,4%
Freelance (interim) 1,3% 3,3% 3,9% 15,5% 9,8% 1,7%
Moroccan
Employee 88,6% 87% 89,1% 88,7% 68,9% 89,3%
Own business 9,5% 6,2% 9,9% 8,1% 11,5% 10,7%
Freelance (interim) 1,9% 6,2% 1% 3,2% 19,6%
Pakistani
Employee 58,4% 70,8% 89,1% 82,5% 50% 79,5%
Own business 40,3% 18,5% 9,3% 8,7% 43,9% 20,5%
Freelance (interim) 1,3% 9,2% 4,1% 8,7% 6,1%

Language competencies
NL DE CH UK BE FR
Ex-Yugoslavian
66,9% 75,4% 73,3% 70,7% 64,0% 69,4%
Turkish
60,3% 55,2% 72,1% 76,4% 53,7% 71,6%
Moroccan
73,2% 78,9% 89,8% 77,1% 85,1% 77,5%
Pakistani
74,2% 57,2% 65,1% 93,6% 63,3% 73,7%
Language compentency (% rarely + never problems with
national language)

Problems with national languageProblems with the national language (OLS)
Ref: France/MoroccanB Std.
Error
β t Sig.
(Constant) 1,810 0,109 16,555 0,000
United Kingdom -0,095 0,055 -0,031 -1,736 0,083
Belgium 0,314 0,054 0,102 5,803 0,000
Netherlands 0,469 0,055 0,155 8,562 0,000
Germany 0,343 0,050 0,125 6,785 0,000
Switzerland -0,089 0,053 -0,031 -1,700 0,089
Ex-Yugoslavian 0,163 0,046 0,063 3,551 0,000
Turkish 0,406 0,041 0,171 9,793 0,000
Pakistani 0,229 0,046 0,084 4,986 0,000
Male -0,111 0,032 -0,050 -3,469 0,001
Education in years -0,030 0,004 -0,105 -7,304 0,000
(Self)employed -0,133 0,032 -0,060 -4,096 0,000
Religious
identification 0,002 0,015 0,002 0,126 0,900
Bridging social capital -0,050 0,004 -0,172 -11,627 0,000
First generation 1,202 0,040 0,544 30,075 0,000
1/2 generation 0,282 0,042 0,120 6,705 0,000
• Men have lessproblems than women
• Higher educated have less problems thanlower education
• People in employmenthave less problemsthan people withoutemployment
• The first generation(and the one and a half generation) have more problems thanthe second generation
• Migrants having more bridging capital (more contact with majoritygroup) have lessproblems

Problems with national language in Belgium
How often do you have problems with the national language(s) in a conversation
Never Rarely Sometimes Often Always
Yugoslavian 39,2% 24,8% 30,7% 4,6% 0,7%
Turkish 34,5% 19,2% 31,4% 5,9% 9,0%
Moroccan 70,2% 14,9% 11,8% 1,6% 1,6%
Pakistan 44,9% 18,4% 26,5% 2,7% 7,5%

Problems with national language in the UK
How often do you have problems with the national language(s) in a conversation
Never Rarely Sometimes Often Always
Yugoslavian 54,7% 16,0% 12,7% 9,3% 7,3%
Turkish 61,2% 15,2% 15,2% 2,4% 6,0%
Moroccan 59,5% 17,6% 14,2% 6,1% 2,7%
Pakistan 85,2% 8,4% 6,0% 0,4% 0%

Problems with national language in the Netherlands
How often do you have problems with the national
language(s) in a conversation
Never Rarely Sometimes Often Always
Yugoslavian 45,7% 21,2% 27,2% 4,6% 1,3%
Turkish 42,6% 17,7% 28,5% 8,4% 2,8%
Moroccan 54,4% 18,8% 23,6% 2,8% 0,4%
Pakistan 64,9% 9,3% 23,2% 1,3% 1,3%

Problems with national language in France
How often do you have problems with the national
language(s) in a conversation
Never Rarely Sometimes Often Always
Yugoslavian 54,7% 14,7% 23,3% 6,0% 1,3%
Turkish 64,8% 6,8% 13,6% 9,2% 5,6%
Moroccan 72,0% 5,5% 15,4% 4,3% 2,8%
Pakistan 63,4% 10,3% 16,6% 9,0% 0,7%

Problems with national language in Germany
How often do you have problems with the national
language(s) in a conversation
Never Rarely Sometimes Often Always
Yugoslavian 50,4% 25,0% 16,0% 7,4% 1,2%
Turkish 36,9% 18,3% 24,2% 14,3% 6,3%
Moroccan 57,8% 21,1% 16,4% 4,3% 0,4%
Pakistan 43,5% 13,7% 25,5% 14,3% 3,1%

Problems with national language in Switzerland
How often do you have problems with the national
language(s) in a conversation
Never Rarely Sometimes Often Always
Yugoslavian 55,1% 18,2% 20,6% 4,5% 1,6%
Turkish 54,8% 17,3% 19,0% 6,5% 2,4%
Moroccan 82,3% 7,5% 8,2% 1,4% 0,7%
Pakistan 46,2% 18,9% 25,2% 6,3% 3,5%

Identification with host society
NL DE CH UK BE FR
National majority 84,2% 78,7% 79,5% 85,6% 77,2% 83,0%
Ex-Yugoslavian 60,5% 47,5% 49,2% 15,5% 56,3% 59,0%
Turkish 50,0% 11,2% 34,7% 17,2% 24,8% 38,5%
Moroccan 66,3% 44,5% 63,1% 33,1% 58,0% 42,7%
Pakistani 68,2% 33,0% 60,5% 22,6% 60,7% 63,2%
National identification by Muslims (and a control group of the national majority) in Europe
(% strongly + very strongly)
- Striking finding: identification low for Turks in Germany
- Caveat in UK the question was « identification with England », which creates a bias

Identification with host societyNational identification by Muslims in Europe (OLS)
Ref:
France/Majority
B Std.
Error
β t Sig.
(Constant) 4,219 0,088 47,943 0,000
United Kingdom -0,473 0,046 -0,154 -10,244 0,000
Belgium -0,140 0,048 -0,042 -2,903 0,004
Netherlands 0,142 0,050 0,041 2,866 0,004
Germany -0,387 0,047 -0,122 -8,265 0,000
Switzerland -0,003 0,047 -0,001 -0,054 0,957
Ex-Yugoslavian -0,877 0,045 -0,267 -19,402 0,000
Turkish -1,311 0,044 -0,450 -29,708 0,000
Pakistani -0,735 0,050 -0,216 -14,622 0,000
Moroccan -0,765 0,047 -0,240 -16,273 0,000
Male 0,031 0,028 0,013 1,072 0,284
Age -0,003 0,001 -0,041 -3,277 0,001
Education in years 0,021 0,004 0,064 5,377 0,000
(Self)employed 0,111 0,029 0,046 3,796 0,000
Religious
identification -0,026 0,013 -0,027 -1,984 0,047
• Men identify more than women
• Higher educated identify more than lower educated
• People in employment have higher identification
• Older people identify less with host society
• People with strong religious identification identify less with host society

Feelings of acceptanceFeelings of acceptance by Muslims in Europe as fellow citizens (OLS)
Ref: France/MoroccanB Std. Error β t Sig.
(Constant) 3,452 0,154 22,442 0,000
United Kingdom -0,638 0,072 -0,175 -8,839 0,000
Belgium -0,057 0,068 -0,017 -0,832 0,406
Netherlands -0,163 0,069 -0,049 -2,343 0,019
Germany -0,414 0,065 -0,135 -6,356 0,000
Switzerland 0,034 0,067 0,011 0,516 0,606
Ex-Yugoslavian 0,113 0,057 0,039 1,969 0,049
Turkish -0,347 0,052 -0,131 -6,629 0,000
Pakistani 0,110 0,058 0,036 1,878 0,060
Male -0,162 0,041 -0,066 -3,977 0,000
Age -0,007 0,002 -0,074 -4,593 0,000
Education in years0,006 0,005 0,020 1,218 0,223
(Self)employed 0,156 0,041 0,063 3,795 0,000
Religious identification-0,069 0,018 -0,063 -3,774 0,000
Bridging social capital 0,062 0,005 0,191 11,336 0,000
Experienced hostilities -0,283 0,041 -0,110 -6,933 0,000
• Women feel more accepted than men
• Higher educated and people holding a job feel more accepted
• Older people feel slightly less accepted than younger people
• People with strong religious identification feel less accepted
• People with bridging social capital feel more accepted
• Those who experienced hostility by majority group feel less accepted

Acceptance of Muslims as fellow citizens
• No gender or age effect
• Higher educated and those holding a job have more acceptance
• People with bridging social capital are more accepting
• People having experience hostility by Muslims are less accepting
• UK citizens least accepting, French most accepting
Acceptance of Muslims as fellow citizens by majority group (OLS)
Ref: FranceB Std.
Errorβ t Sig.
(Constant) 3,439 0,197 17,422 0,000United Kingdom -1,208 0,082 -0,539 -14,762 0,000Belgium -0,479 0,092 -0,172 -5,220 0,000Netherlands -0,218 0,098 -0,072 -2,233 0,026Germany -0,402 0,091 -0,154 -4,433 0,000Switzerland -0,195 0,088 -0,074 -2,208 0,027Male 0,033 0,048 0,017 0,693 0,489Age -0,002 0,002 -0,042 -1,502 0,133Education in years 0,019 0,008 0,060 2,337 0,020(Self)employed 0,076 0,052 0,038 1,468 0,142Religious identification -0,001 0,020 -0,001 -0,053 0,957Bridging social capital 0,058 0,014 0,114 4,279 0,000Experienced hostilities -0,188 0,069 -0,067 -2,734 0,006


