+ All Categories
Home > Documents > Eurofins is celebrating 30 Years of Testing For Life! … · Q1 2018: 23% revenue growth to EUR...

Eurofins is celebrating 30 Years of Testing For Life! … · Q1 2018: 23% revenue growth to EUR...

Date post: 04-Aug-2018
Category:
Upload: vudung
View: 214 times
Download: 0 times
Share this document with a friend
72
www.eurofins.com Eurofins A global leader in bioanalytical testing in the food, environment, pharmaceutical, agrosciences and clinical sectors 1 Corporate Presentation May 2018 Consistently delivering strong, sustainable, profitable growth Sales & EBITDA multiplied by more than 12 times since 2005 Doubled revenues more than 3 times (every 3 years on average) since 2005 Basic EPS multiplied by more than 11 times since 2005
Transcript

www.eurofins.com

Eurofins

A global leader in bioanalytical testing in the food, environment, pharmaceutical,

agrosciences and clinical sectors

1

Corporate Presentation

May 2018

Consistently delivering strong, sustainable, profitable growth

Sales & EBITDA multiplied by more than 12 times since 2005

Doubled revenues more than 3 times (every 3 years on average) since 2005

Basic EPS multiplied by more than 11 times since 2005

2

Disclaimer

The statements made during this presentation or as response to questions during the Question & Answers period that are

not historical facts are forward looking statements. Furthermore, estimates and judgements may be made based on market

and competitive information available at a certain time. Forward looking statements and estimates represent the judgement

of Eurofins Scientific’s management and involve risks and uncertainties including, but not limited to, risks associated with the

inherent uncertainty of research, product/ service development and commercialisation, the impact of competitive products

and services, patents and other risk uncertainties, including those detailed from time to time in period reports, including

prospectus and annual reports filed by Eurofins Scientific with the Luxembourg Stock Exchange and regulatory authorities,

that can cause actual results to differ materially from those projected. Eurofins Scientific expressly disclaims any obligation

or intention to release publicly any updates or revisions to any forward looking statement or estimate.

Eurofins provides in the Income Statement certain alternative performance measures (non-IFRS information as “Adjusted

Results and Separately Disclosed Items”) that excludes certain items because of the nature of these items and the impact

they have on the analysis of underlying business performance and trends. (Please refer to description of these terms in the

Company’s Annual Report). The management believes that providing this information enhances investors' understanding of

the company’s core operating results and future prospects, consistent with how management measures and forecasts the

company’s performance, especially when comparing such results to previous periods or objectives and to the performance of

our competitors. This information should be considered in addition to, but not in lieu of, information prepared in accordance

with IFRS. These APMs are described in more detail in the Consolidated Financial Statements 2017 in Notes 1.28 and 1.29.

This presentation does not constitute or form part of, and should not be construed as, an offer or invitation to subscribe for or

purchase securities in Eurofins Scientific S.E. and neither this document nor anything contained or referred to in it shall form

the basis of, or be relied on in connection with, any offer or commitment whatsoever.

Analyst forecasts quoted are based on published analyst views. They are the responsibility of the investment banks which

publish those forecasts and should not be interpreted as representing the views or expectations of Eurofins Scientific or the

Eurofins Scientific management. In particular, they do not constitute a profit forecast or estimate or trading statement by

Eurofins Scientific S.E. Similarly, objectives presented are only objectives and may not be achieved in reality, potentially by a

wide margin, due to a variety of factors.

3

Introduction

Market & Strategic Positioning

Finance & Outlook

Summary

Appendix

Contents

4

Eurofins’ Mission is to contribute to global

Health, Safety & Environment with the best in bioanalysis

Founded in 1987

IPO in 1997 in Paris at EUR 1.83 per share (vs EUR 507.60 at

29/12/2017)

Over 35,000 employees accross more than 400 laboratories in 44

countries

Over 150,000 validated analytical methods

Key figures 2017 2014-2017 CAGR

Revenues EUR 2.97bn 28%

Revenues (pro-forma) EUR 3.44bn

Adj. EBITDA* EUR 557m 29%

Reported EBITDA EUR 513m 31%

Op CashFlow EUR 405m 24%

Earnings per share EUR 12.68 34%

*Adjusted – reflects the ongoing performance of the mature and recurring activities excluding “separately disclosed items” **At 2017 exchange rates

Food

Environment Pharmaceuticals

Clinical

Eurofins provides testing

services in four main areas

that have a strong impact on

human health:

Mid-term (2019) EUR 4bn Revenues

Financial Objectives**

Brought forward by one

year on 24.10.2017

FY 2018 EUR 3.7bn Revenues

EUR 700m Adj. EBITDA*

Raised/set on

06.03.2018

Q1 2018 achieved: EUR 893m Revenues, +23% growth vs. Q1 2017

1987 – 2017: In only 30 years we built a unique

global network

4

employees

> 35,000

employees

From 1 laboratory in Nantes (France) in 1987…

… to more than 400 laboratories around the world in 2017!

… now present in 44 countries !

1987 2017

Eurofins’ site map as of February 2018 5

6

Illustration of Eurofins’ 2019 growth objectives assuming constant/linear acquisition volume and growth rate each year

* Objective

Mid-term plan is now to double revenues in only 4 years

(between 2015 and 2019)

EUR 4bn objective

brought forward by

1 year

Eurofins has vastly outperformed the market since

its IPO and each of its 6 equity offerings (based on share price of EUR 507.60 as of 29 December 2017)

1997

IPO

€ 5m

1998

rights

issue

€ 6m

SPO 1

1999

rights

issue

€ 7m

SPO 2

2000

SPO

€ 38.5m

SPO 3

Eurofins: +27,647% (32% CAGR) CAC 40: +92% (3% CAGR)

SBF 120: +125% (4% CAGR)

S&P 500: +205% (6% CAGR)

Eurofins: +6,347% (24% CAGR)

CAC 40: +50% (2% CAGR)

SBF 120: +76% (3% CAGR)

S&P 500: +151% (5% CAGR)

Eurofins: +6,532% (26% CAGR)

CAC 40: +13% (1% CAGR)

SBF 120: +32% (2% CAGR)

S&P 500: +106% (4% CAGR)

Eurofins: +1,081% (15% CAGR)

CAC 40: -15% (-1% CAGR)

SBF 120: 1% (0% CAGR)

S&P 500: +94% (4% CAGR)

Eurofins: +538% (20% CAGR)

CAC 40: -5% (-1 % CAGR)

SBF 120: +5% (0% CAGR)

S&P 500: +82% (6% CAGR)

10 years

Since SPO 2

Since SPO 1

Since IPO

Since SPO 3

2 years

5 years

Eurofins: +314% (33% CAGR)

CAC 40: +46% (8% CAGR)

SBF 120: +52% (9% CAGR)

S&P 500: +87% (13% CAGR)

Total equity raised in 7 offerings: only EUR 852m, EUR 57m 1997-2000, EUR 496m in 2016 and EUR 299m in 2017

7

Sept 2016

ABB**

June 2016

Private placement CDPQ

Eurofins: +58% (26% CAGR)

CAC 40: +15% (7% CAGR)

SBF 120: +16% (8% CAGR)

S&P 500: +31% (14% CAGR)

Best share price performance of all companies listed in Europe between IPO on October 1997

and October 10th 2017*

*Source Marten & Co. study 24th October 2017 **ABB: Accelerated Book Building

Oct 2017

ABB**

23%

26% 25%

Revenues Adjusted EBITDA Op CF

Continued operating and financial growth momentum in

2017 and in Q1 2018

Eurofins 5 year Report Card: 2012-2017 CAGR 2017: Strong growth & operating momentum

17.1% revenue growth to EUR 2.97bn (EUR 3.44bn pro-forma)

Close to 6% organic growth* versus 5% annual objective

About 60 acquisitions closed in 2017 representing annual pro-forma

revenues of ca. EUR 700m with an annual EBITDA margin of

ca.19%, for a total investment of about EUR 1.5bn

Sustained development of our laboratories start-up program with 30

launched in 2017 alone

Strong increase in net profit for 2017 +25% to EUR 217m thanks to

lower finance costs and reduced income tax expense

Free cash flow to equity increased +17% to EUR 147m

Strong uplift of 21% in basic earnings per share attributable to equity

holders at EUR 10.49, despite the equity and hybrid issuances of the

last 18 months

Strong balance sheet with a 2.14x pro-forma net debt/adjusted

EBITDA leverage, well below Group’s covenant of 3.50x

Dividends raised by 20% to EUR 2.40 per share, 10th consecutive

yearly increase (+36.4% 10-year CAGR)

Increased 2018 objectives to EUR 3.7bn and EUR 700m (at current

exchange rates) of revenues and adjusted EBITDA

On track to achieve mid-term objectives of generating EUR 4bn of

revenues by 2019

8

*Organic growth for a given period (Q1, Q2, Q3, Half Year, Nine Months or Full Year) - non-IFRS measure calculating the growth in revenues during that period between 2 successive years for the same scope of businesses using the

same exchange rates but excluding discontinued operations. For the purpose of organic growth calculation for year Y, the relevant scope used is the scope of businesses that have been consolidated in the Group’s income statement of

the previous financial year (Y-1). Revenue contribution from companies acquired in the course of Y-1 but not consolidated for the full year are adjusted as if they had been consolidated as from 1st January Y-1. All revenues from

businesses acquired since 1st January Y are excluded from the calculation.

Q1 2018: 23% revenue growth to EUR 839m on 4% organic growth despite strong comparative 7% organic growth in Q1 2017 and as

anticipated lower growth for Clinical Diagnostics. Adverse currency impact of 5% in Q1 2018.

Covance Food Solutions:

Offers an extensive set of routine and specialized laboratory testing and consulting services focused on ensuring

product safety, quality and adherence to internal and external standards for existing and in-development food,

beverage and supplement products.

Operates integrated network of 12 facilities (9 in the US, 2 in the UK and 1 in Asia)

Expects to generate USD 160m in 2018 with an EBITDA margin well in excess of Eurofins objectives

This acquisition will represent a significant investment*, but Eurofins is well-funded for it and intends to maintain its

strong financial discipline and solid balance sheet.

Transaction is an asset deal and should yield ca. USD 10m tax savings annually for the next 15 years

Was one of the pioneers in food product testing in the USA and has, over the years, built strong client relationships

with most of the top US food and beverage multinational corporations

*Covance Food Solutions will significantly reinforce Eurofins’ global service offering in the highly competitive food

testing market

Strong cultural fit between Covance Food Solutions and Eurofins:

Both companies have an outstanding reputation for scientific excellence

Eurofins and Covance Food Solutions have a complementary geographic footprint, client focus and service offering, no

restructuring of either business should be necessary

9

Eurofins to expand its footprint in North America, the UK

and Asia with the acquisition of Covance Food Solutions

On April 30th 2018, Eurofins announced that it has signed an agreement with LabCorp to acquire Covance Food

Solutions (CFS) for USD 670m, subject to the fulfillment of regulatory and customary closing conditions: CFS is a

leading provider of food product testing services, product safety and consulting solutions for end-use segments

spanning the entire food supply chain.

Covance Food Solutions: became a part of LabCorp as a result of their USD 6.1bn acquisition of Covance in 2015.

*subject to the fulfillment of regulatory and customary closing conditions.

Additionally, Eurofins has created three new strong business lines:

Pharma CDMO* – Eurofins entered the dynamic and growing CDMO market earlier this year with the

acquisition of Advinus in India. This was followed by the acquisitions of Amatsigroup in France and

Alphora in Canada.

Advanced Materials Sciences – the acquisition of EAG Laboratories provided Eurofins with an entry

into the very high tech Materials Sciences market, where EAG is number one in its core segments.

Clinical Genetics – the acquisitions of Genoma in Italy and Lifecodexx in Germany, two pioneers of

non-invasive prenatal testing in Europe, reinforce Eurofins solid market position in Clinical Genetics.

Eurofins has achieved new leadership positions in four business lines, including:

Global leader in Discovery Pharmacology – achieved through the acquisitions of Villapharma in Spain

and DiscoverX which has operations in the USA and the UK. The Discovery Pharmacology market is

experiencing a growing outsourcing trend; Eurofins’ global leadership position in this market should

provide significant growth opportunities.

Global leader in Agroscience services – the acquisitions of JACC and Ecopro in Japan reinforced

Eurofins leadership in this area and provided an entry into the Japanese Agroscience market. Also,

the acquisition of EAG Laboratories strengthened Eurofins’ leadership in Agroscience services.

Global leader in Genomics services – achieved thanks to the acquisition of GATC, one of Europe’s

specialists in DNA sequencing.

European leader in Forensics services – the recent acquisition of LGC Forensics, the largest player in

the UK forensics market, brought Eurofins to a leadership position in the European forensics market.

10

In 2017, Eurofins became the Global/European leader in 4

business lines

*CDMO: contract development and manufacturing organization

3 historic acquisitions:

Cerep

Panlabs

DDS-Millipore

2 recent acquisitions:

Eurofins acquired Villapharma (Spain) and DiscoverX (USA & UK) in 2017

Villapharma provides organic synthesis and medicinal chemistry services for the discovery and

optimization of potential new drug candidates

DiscoverX develops, manufactures, and commercializes reagents, complete cell-based assay kits,

profiling and screening services for drug discovery and life science markets

Business model: Villapharma and DiscoverX run research outsourcing business models for their

clients. The operating model of both companies offers flexibility to adapt to partners’ needs at

every stage of pharma discovery

Eurofins has expanded its comprehensive portfolio of laboratory services and should benefit from the

trend in outsourcing within the discovery field to Contract Research Organizations (CROs)

11

Eurofins is strengthening its global leadership in

Pharmaceutical Discovery Services

Pharmaceutical Drug

Discovery Industry

Increasing focus on cost optimization

Growing outsourcing trend

Global pharmaceutical and biotech companies

need dynamic, flexible and reliable partners

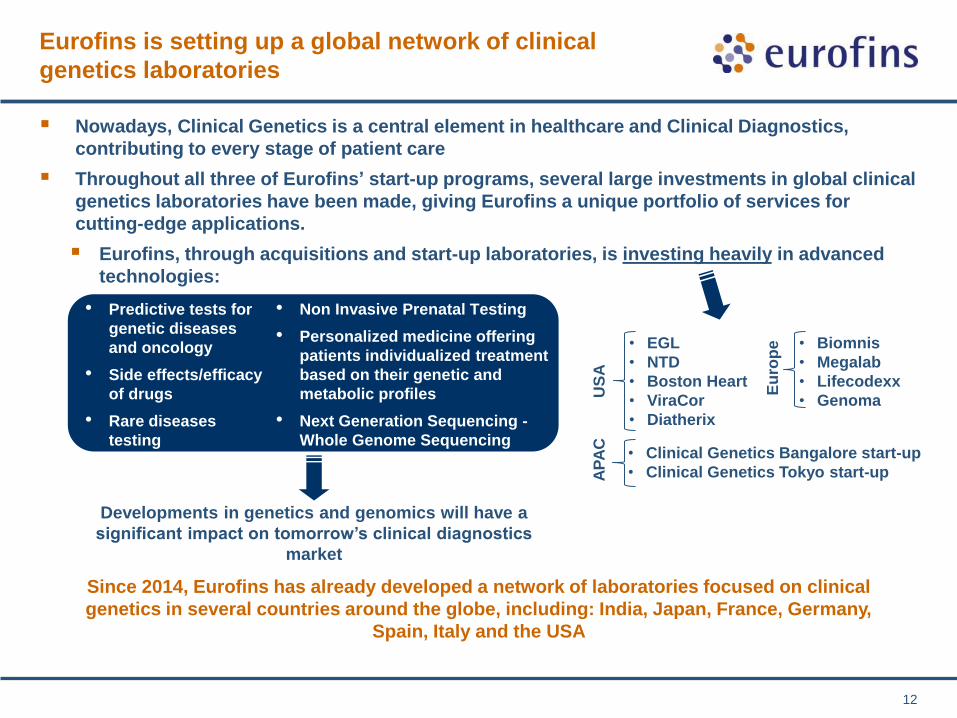
Nowadays, Clinical Genetics is a central element in healthcare and Clinical Diagnostics,

contributing to every stage of patient care

Throughout all three of Eurofins’ start-up programs, several large investments in global clinical

genetics laboratories have been made, giving Eurofins a unique portfolio of services for

cutting-edge applications.

Eurofins, through acquisitions and start-up laboratories, is investing heavily in advanced

technologies:

12

Eurofins is setting up a global network of clinical

genetics laboratories

Developments in genetics and genomics will have a

significant impact on tomorrow’s clinical diagnostics

market

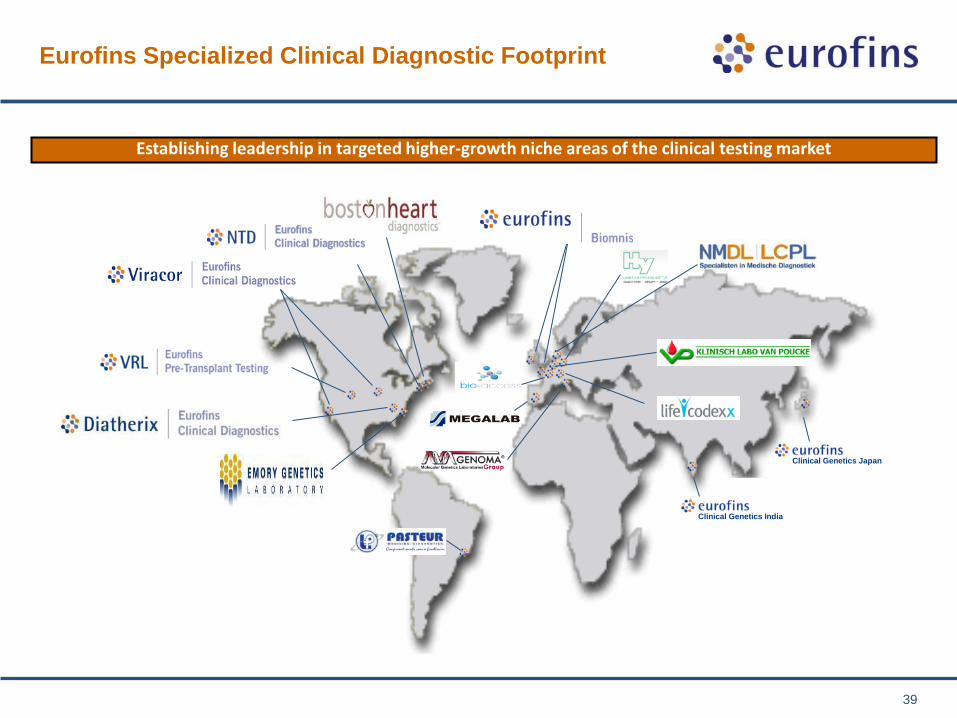
Since 2014, Eurofins has already developed a network of laboratories focused on clinical

genetics in several countries around the globe, including: India, Japan, France, Germany,

Spain, Italy and the USA

• EGL

• NTD

• Boston Heart

• ViraCor

• Diatherix

• Biomnis

• Megalab

• Lifecodexx

• Genoma

• Clinical Genetics Bangalore start-up

• Clinical Genetics Tokyo start-up

US

A

• Predictive tests for

genetic diseases

and oncology

• Side effects/efficacy

of drugs

• Rare diseases

testing

• Non Invasive Prenatal Testing

• Personalized medicine offering

patients individualized treatment

based on their genetic and

metabolic profiles

• Next Generation Sequencing -

Whole Genome Sequencing

Eu

rop

e

AP

AC

In September 2017, Eurofins’ Genoma introduced GeneSafeTM, the first non-invasive prenatal test that screens for

both de novo (non-inherited gene mutations) and inherited single-gene disorders.

GeneSafeTM detects over 40 severe genetic disorders: that may occur in absence of any family history of the

condition.

GeneSafeTM is the first NIPT to detect disorders that are increasingly prevalent with advanced paternal age:

later-stage parenthood is becoming increasingly common.

GeneSafeTM is more advanced than other NIPTs currently available: identifying fetal conditions that could be

missed by traditional prenatal testing.

Many disorders screened with GeneSafeTM:

Are not typically associated with abnormal prenatal ultrasound findings.

May not be evident until late second/third trimester or even after delivery.

In July 2017, Eurofins acquired a majority stake in LifeCodexx AG, Europe’s first NIPT provider and one of the most

innovative NIPT players.

LifeCodexx has been developing innovative and clinically validated tests since 2010.

LifeCodexx’s PrenaTest® was Europe’s first NIPT: for the determination of the most common chromosomal

disorders in unborn children. This was a substantial development that changed prenatal diagnostics

considerably.

LifeCodexx, following a positive CE marking, began rolling-out their unique qPCR-based NIPT capabilities in

December 2016: leading to increased cost-efficiency and rapid turnaround time, another significant innovative

step in the NIPT field.

13

Eurofins is expanding its global offering in non-invasive

prenatal testing (NIPT)

Eurofins NIPTs are very reliable (>99% of conclusive results), fast (turnaround time under 2 weeks, qPCR

assays only take 2-3 days) and simple (only a small blood sample required). Eurofins is the first provider to

offer the aforementioned novel NIPT tests, GeneSafeTM and qPCR-based NIPT, to the market.

14

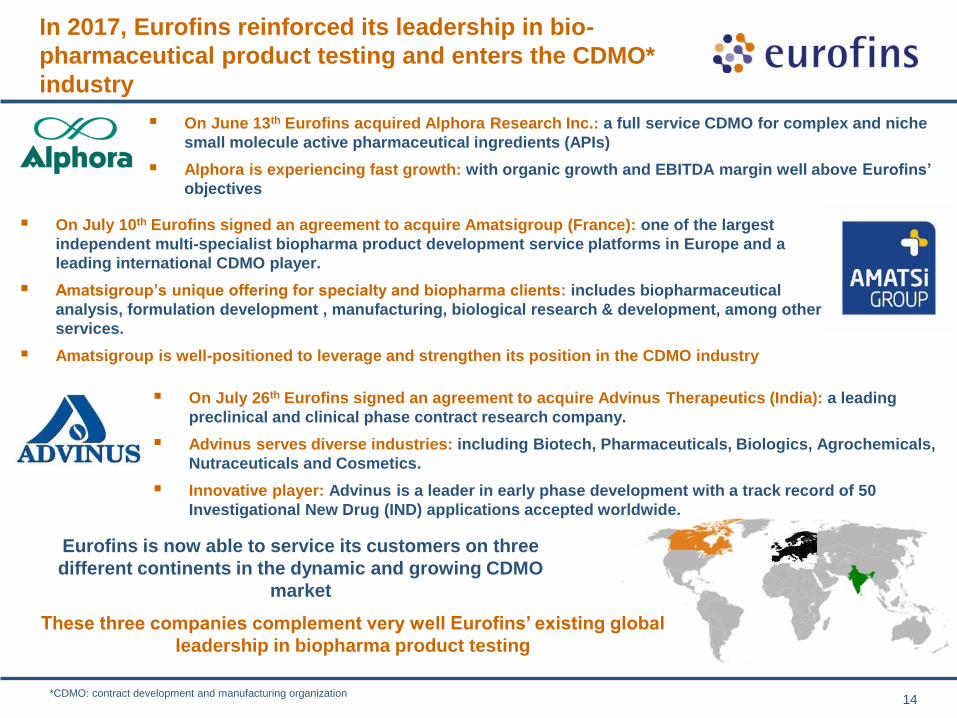
In 2017, Eurofins reinforced its leadership in bio-

pharmaceutical product testing and enters the CDMO*

industry

On July 10th Eurofins signed an agreement to acquire Amatsigroup (France): one of the largest

independent multi-specialist biopharma product development service platforms in Europe and a

leading international CDMO player.

Amatsigroup’s unique offering for specialty and biopharma clients: includes biopharmaceutical

analysis, formulation development , manufacturing, biological research & development, among other

services.

Amatsigroup is well-positioned to leverage and strengthen its position in the CDMO industry

Eurofins is now able to service its customers on three

different continents in the dynamic and growing CDMO

market

On July 26th Eurofins signed an agreement to acquire Advinus Therapeutics (India): a leading

preclinical and clinical phase contract research company.

Advinus serves diverse industries: including Biotech, Pharmaceuticals, Biologics, Agrochemicals,

Nutraceuticals and Cosmetics.

Innovative player: Advinus is a leader in early phase development with a track record of 50

Investigational New Drug (IND) applications accepted worldwide.

On June 13th Eurofins acquired Alphora Research Inc.: a full service CDMO for complex and niche

small molecule active pharmaceutical ingredients (APIs)

Alphora is experiencing fast growth: with organic growth and EBITDA margin well above Eurofins’

objectives

*CDMO: contract development and manufacturing organization

These three companies complement very well Eurofins’ existing global

leadership in biopharma product testing

15

Eurofins expands its footprint in North America with the

acquisition of EAG Laboratories

On December 4th 2017, Eurofins announced the closing of the acquisition of EAG

Laboratories: a leading global scientific services company providing analytical

testing and consulting solutions to a diverse and demanding set of end markets.

EAG Laboratories: serves over 4000 clients worldwide with 21 laboratories

across 18 locations. EAG employs over 1000 qualified scientists that are deeply

committed to answering complex scientific questions through creative problem-

solving, objective analysis and expert data interpretation.

EAG Laboratories are at the forefront of technological advancement with leading edge technologies across a

broad scope of industries:

Biopharmaceuticals – from early discovery through post-commercialization. Reinforces Eurofins

leading position in these markets.

Medical Devices – offering a complete suite of analytical services. Reinforces Eurofins leading position

in these markets.

Agroscience services – comprehensive suite of advanced services for the development, evaluation and

registration of crop science products. Reinforces Eurofins leading position in these markets.

Materials Sciences – leader in its niches with main competition in Japan and South-East Asia.

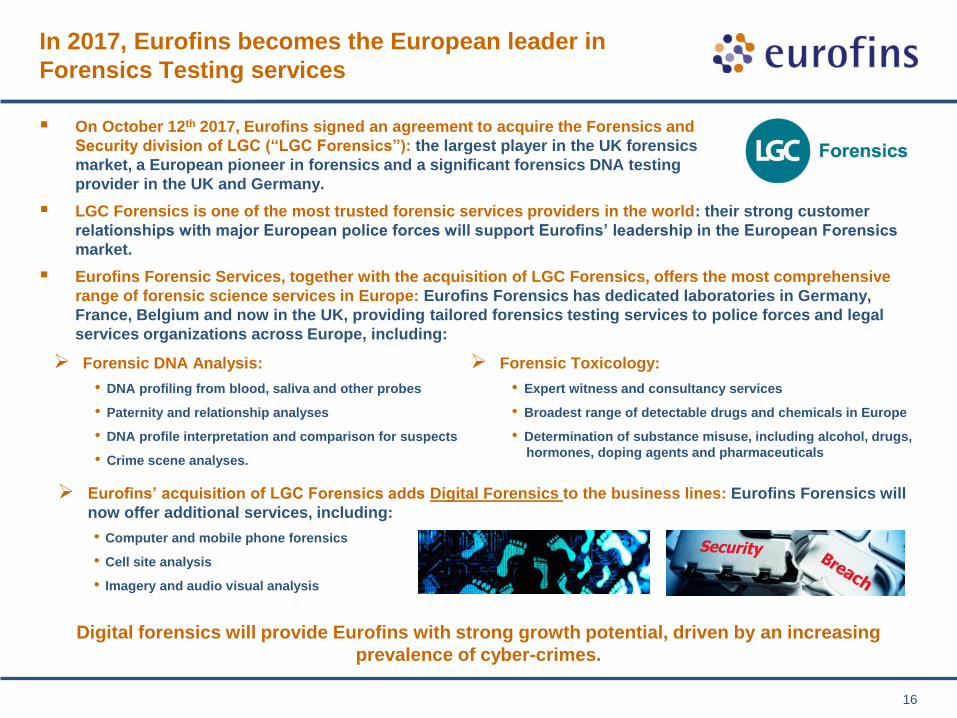
On October 12th 2017, Eurofins signed an agreement to acquire the Forensics and

Security division of LGC (“LGC Forensics”): the largest player in the UK forensics

market, a European pioneer in forensics and a significant forensics DNA testing

provider in the UK and Germany.

LGC Forensics is one of the most trusted forensic services providers in the world: their strong customer

relationships with major European police forces will support Eurofins’ leadership in the European Forensics

market.

Eurofins Forensic Services, together with the acquisition of LGC Forensics, offers the most comprehensive

range of forensic science services in Europe: Eurofins Forensics has dedicated laboratories in Germany,

France, Belgium and now in the UK, providing tailored forensics testing services to police forces and legal

services organizations across Europe, including:

16

In 2017, Eurofins becomes the European leader in

Forensics Testing services

Forensic DNA Analysis:

• DNA profiling from blood, saliva and other probes

• Paternity and relationship analyses

• DNA profile interpretation and comparison for suspects

• Crime scene analyses.

Forensic Toxicology:

• Expert witness and consultancy services

• Broadest range of detectable drugs and chemicals in Europe

• Determination of substance misuse, including alcohol, drugs,

hormones, doping agents and pharmaceuticals

Eurofins’ acquisition of LGC Forensics adds Digital Forensics to the business lines: Eurofins Forensics will

now offer additional services, including:

• Computer and mobile phone forensics

• Cell site analysis

• Imagery and audio visual analysis

Digital forensics will provide Eurofins with strong growth potential, driven by an increasing

prevalence of cyber-crimes.

Mostly high-growth and profitable companies that provide Eurofins access to new, promising growth markets

Limited restructuring required

Overall the acquisitions closed in 2017 are margin accretive, contributing with a ca. 19% EBITDA margin to FY 2017

pro-forma consolidated accounts.

As of 31/12/2017, Eurofins had signed and/or closed about 60 acquisitions, with expected annual pro forma revenues

of ca. EUR 700m in 2017

About 60 acquisitions signed and/or closed in 2017

17

Ahma (FI) Amatsi (FR)

Ramboll environmental laboratories (FI) Genoma (IT)

Nab Labs (FI) Advinus (IN)

Gözlem (TR) LifeCodexx (DE)

VBM (DK) EAG Laboratories (US)

Villapharma (ES) LGC Forensics (UK)

Mechem (SG) Institut Nehring (DE)

Alphora (CA) Grupo Pasteur (BR)

Hygel (DE) Selcia (UK)

ANA Lab (US) MET Laboratories (US)

GATC (DE) Total 24 Spectro (IN)

JACC (JP) +7 French clinical laboratories

DiscoverX (US) +31 Smaller laboratories

Acquisitions signed and/or closed up to 31/12/2017

Total Annualised Revenues

ca. € 700m

Meaningful industry consolidation is underway

18

*Source: Mergermarket, Company announcements, Bloomberg Terminal, Estimates based on publicly available information

Date Company Acquirer Geography Sales (€m) EV (€m) EV/Sales (x) EV/EBITDA (x)

September Chiltern International Labcorp US 133 990 7.4x N/A

June EUROIMMUN PerkinElmer DE 166 1,139 6.9x 32.0x

May Patheon Thermo Fischer NL 1,712 6,424 3.8x 18.1x

April Exova Element Materials Tech UK 401 743 1.9x 9.4x

January Cerba PSP, Partners Group FR 630 1,800 2.9x 12.0x

AVERAGE 4.6x 17.9x

December Unilabs Apax IX CH 675 1,500 2.2x 11.8x

November Cepheid Danaher US 485 3,770 7.8x N/A

January WIL Research Charles River US 194 527 2.7x 13.0x

AVERAGE 4.2x 12.4x

December Element Materials Technology Bridgepoint UK 270 900 3.3x 12.2x

December LGC KKR UK 358 1,237 3.5x 14.2x

October Professional Service Industries (PSI) Intertek US 227 290 1.3x 7.6x

July Amedes Antin Infrastructure Partners DE 399 775 1.9x 9.7x

June Environmental Resources Mgmt Omers Private Equity UK 835 1,511 1.8x 14.4x

June Bio-Reference Laboratories Opko Health US 787 1,337 1.7x 12.6x

June Synlab (Majority stake) Cinven DE 756 1,750 2.3x 12.1x

May Labco Cinven FR 650 1,200 1.8x 9.1x

AVERAGE 2.2x 11.5x

November Covance Labcorp US 2,465 5,320 2.2x 16.5x

June Zygo Corporation AMETEK US 142 257 1.8x 13.0x

February Maxxam Analytical International Corporation Bureau Veritas SA CA 179 433 2.4x 12.5x

January Diagnósticos Da América Sa Cromossomo Participações Ii Sa BR 1,009 1,420 1.6x 8.7x

AVERAGE 2.0x 12.7x

July Socotec Copeba (+ FAPI) FR 475 498 1.0x 9.6x

July Grontmij France Siparex FR 110 71 0.6x N/A

June Keynote Systems Inc. Thoma Bravo LLC US 118 380 3.2x 18.4x

AVERAGE 1.6x 14.0x

Selection of recent significant transactions in the testing industry

2016

2015

2014

2013

2017

Start-ups an increasingly attractive investment as we leverage

our scale and experience

130 laboratories start-ups between 2000 and 2017

1) Acceleration in laboratories start-up programs

25 start-ups 2000-2009 (Program 1)

18 start-ups 2010-2013 (Program 2)

87 start-ups 2014-2017 (Program 3)

30 start-ups opened in 2017 alone (vs. an average 20

p.a. in past 3 years)

These start-ups had an accretive effect of more than

40bp on our organic growth in 2017

Substantial acceleration offers tremendous growth potential

3) Start-up investments complement our acquisition

strategy

Alternative strategy in high-growth markets and

emerging markets where acquisition prices are too high

and/or there are limited viable options for acquisitions

25 start-ups 18 start-ups 87 start-ups 30 start-ups!

Where we are building start-up labs

19

Program 1

(2000-2009) Program 2

(2010-2013)

Program 3

(2014-2017)

2) Commitment to invest for future growth

Eurofins start-up program represents a significant

investment for the future and has a short-term dilutive

impact on the Group’s margins and cash flows.

On average, start-up periods last for 2 to 3 years in

mature markets and 2 to 5 years in emerging markets in

order to reach breakeven before they become profitable

Start-ups from the first two programs (2000-2009, 2010-

2013) were slightly above the Group’s average

profitability in 2017

Start-ups from our third program (2014-2017) were very

dilutive, they represent significant investments for the

future

Rev

en

ues (

€m

)

20

Start-ups expected to break-even on Year 3 and typically reach

Group’s profitability objectives shortly thereafter

Illustration Start-ups development:

1) Large investments have short-term dilutive

impact on Group’s margins and FCF

2) Growth momentum allows start-ups to

typically break-even on Year 3 post-creation

3) From year 5 ROCE generally better than

growth via acquisitions

Example of a typical Eurofins’ start-up:

Start-up A

Dynamic

growth

Break-even

achieved

Pre-accreditation:

Establishing

infrastructure

Receiving accreditation Start-up reaches

break-even

Developing towards

Group’s profitability levels

Diversity We are international and diverse.

Our global and multicultural

network of companies is a

stimulating environment for

graduates and professionals from

all over the world to whom we offer

fast track global careers.

What we are passionate about:

Our company DNA

Testing for Life Everything we do has a positive

impact on LIFE, HEALTH and the

ENVIRONMENT.

Science & Innovation We lead our industry in science

and innovation. Our laboratories

have invented numerous new

testing methods and applications

during the last 30 years.

Entrepreneurship We are a network of independent,

intrapreneur-led companies and a

school for those who aspire to become

entrepreneurs. Eurofins launches 20

start-ups a year.

Growth Our teams and leaders are

passionate about growth and have

successfully achieved N°1 or N°2

positions in many markets around

the world.

Results We deliver outstanding

results each year and create thousands of

sustainable, highly-skilled jobs. Eurofins is a

house of achievers, high performers and a

meritocracy where success is rewarded with

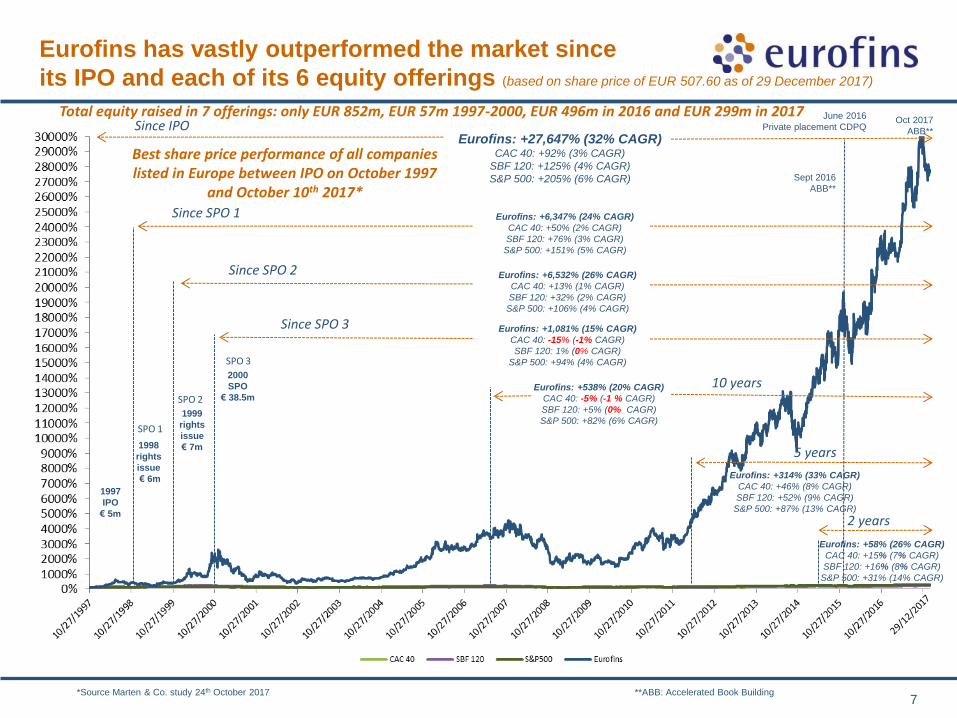
equity. Our share price has increased 290

fold in the last 20 years and has been one of

the best performing in the world.

21

Credit Suisse report shows that family-owned

businesses outperform their peers*

…supported by superior growth

and Profitability

Revenue and EBITDA growth is

stronger, EBITDA margins are higher

and cash flow returns are better.

Family-owned companies also appear

to have a greater focus on innovation

as research and development (R&D)

spending is higher.

Family-owned companies have a

longer-term and conservative focus

Company interviews show: greater

focus on quality long-term growth than

non-family owned peers.

Family-owned companies on average

tend to favor capital preservation

and long-term value creation rather

than more short-term gains.

Family-owned companies outperform

non-family-owned peers…

Family-owned companies outperformed in every

region (annual excess returns ranged from 310

bp in non-Japan Asia to 510 bp in Europe) and

in every sector.

22 *Source: Credit Suisse Research Institute: The CS Family 1000; September 2017

*To the best of Eurofins’ knowledge, based on data available to the Group

** Million Insights, June 2017 https://www.millioninsights.com/industry-reports/clinical-laboratory-services-market (Assumes 2017 average USD/EUR exchange rate of 0.89)

Leading global and local market positions* (1/2)…

Ensuring food quality and

preventing contamination and

foodborne illnesses caused by

pathogens and other harmful

substances.

Expertise includes a.o. testing

for dioxins and organic

contaminants, pesticides,

mycotoxins, allergens,

authenticity, pathogens and

vitamins

Se

gm

en

t d

es

cri

pti

on

K

ey

cli

en

ts

La

rge

pe

ers

Full range of laboratory services

for phase I – IV clinical research

programs, biopharmaceutical

product development and

quality testing, discovery and

pharmacology services,

genomic sequencing and

genotyping

Analysis of drinking water,

groundwater, seawater, soil,

sediment, air, etc; using

analytical methods to assess

their purity/absence of polution

and impact on health and the

environment

Biological samples (blood,

urine, etc.) analysis to diagnose

diseases and aid in medical

decisions

9 of top 10 largest food and

beverage producers are clients

9 out of 10 largest pharma

companies are customers

Industrial companies, water

plants, local councils,

construction companies, etc.

Doctors, hospitals, health

insurers, patients

Intertek, Bureau Veritas, SGS,

etc.

LabCorp/Covance, Charles

River, Quintiles, etc.

ALS, Bureau Veritas, SGS,

Idexx, etc.

LabCorp, Quest, Sonic

Healthcare, Synlab, Unilabs,

Cerba, etc.

N°1*

worldwide

Start 1987

N°1 to N°3*

worldwide

Start 2000-2005

N°1*

worldwide

Start 2000

Start-Up

Start 2014

Food & Feed

Testing

Environment

Testing

Clinical

Diagnostics

*Total market

size estimate ~ EUR 2-3bn ~ EUR 5bn ~ EUR 4bn

~ EUR 166bn**

23

Testing for

Pharma/Biotech/Agrosciences

*Total market

size estimate

*To the best of Eurofins’ knowledge, based on data available to the Group

Eu

rofi

ns r

an

kin

g

~ EUR 2-3bn

N° 1 in Europe

N° 1 in Germany

N° 1 in France

N° 1 in Scandinavia

N° 1 in Benelux

N° 1 in the UK

N° 1 in Brazil

N° 2/3 in the USA

N° 1 in Agro Testing EU

~ EUR 5bn

N° 1 Worldwide in Pharma

Products Testing

N° 1 Worldwide in Discovery

Pharmacology Services

N° 1 Worldwide in Agroscience

CRO services

Among top 5 global providers of

central laboratory and genomic

services

N° 1 or 2 in most segments/

countries in Europe

~ EUR 4bn

N° 1 in Europe

N° 1 in Germany

N° 1 in France

N° 1 in Scandinavia

N° 1 in Benelux

N° 3 in the USA

N° 2 in Japan

N°1*

worldwide

Start 1987

N°1 to N°3*

worldwide

Start 2000-2005

N°1*

worldwide

Start 2000

Start-Up

Start 2014

Establishing leadership in

targeted higher-growth

niche areas of the clinical

testing market, mainly in

the US and Europe for

now

~ EUR 166bn**

Leading global and local market positions* (2/2)

Food & Feed

Testing

Testing for

Pharma/Biotech/Agrosciences

Environment

Testing

Clinical

Diagnostics

24

** Million Insights, June 2017 https://www.millioninsights.com/industry-reports/clinical-laboratory-services-market (Assumes 2017 average USD/EUR exchange rate of 0.89)

25

Demand for safe

pharmaceuticals, quality food

and clean environment

Risks linked to

global sourcing

and brand

vulnerability

Consolidation of the

fragmented laboratory

market and scale effects

Drivers for long-term market growth

Outsourcing of internal

laboratories by industry

One-stop shopping (focus on

few global testing suppliers)

Increasing wealth

and quality of Life

Technological

progress

Advancing

globalisation

New analytical

methods and lower

detection limits

Consumer

expectations for

protection

Secular Underlying

Fundamentals General Market Drivers Laboratory Market Drivers

26

80% of the world’s population still has limited access to testing laboratories

N. America 30.4%

France 22.8%

Germany 11.5%

Benelux 7.2%

Nordic Region 7.1%

UK & Ireland 5.4%

Others 15.6%

2017 revenue split :

Entry into high-growth

markets with start ups

& acquisitions

An international network of world class, standardised

laboratories is attractive for our customers

Geared towards strong economies and fast-growing

markets

Geographical breakdown of Eurofins’ revenues in 2017

Germany

Austria

Switzerland

Benelux

Nordics

(Northern

Europe)

Germany

+

Northern

Europe

North

America

Germany

Northern

Europe

USA

APAC & EM

UK

&

Ireland

Total

Excluding

France &

Southern

Europe

France Italy

Spain

Portugal

TOTAL

27

APAC &

Emerging

markets

(EM)

28

Eurofins’ strategy aims at building long lasting

competitive advantages

Extensive expertise in local regulations for all

major markets, and one-stop contact for

compliance in multiple countries

Globally reliable standards of high quality and

consistency

International key accounts management

Internet-based transactions and access to

testing results

Competence Centres & R&D activities

Proprietary technologies for proof of

origin, virus phenotyping & authenticity

testing

Continuous development/acquisition of

advanced technologies

One stop shop

Leading technology

Pure-play laboratory operator

International network with a presence in

44 countries

Vast technological portfolio with more

than 150,000 validated methods

Over 360 million tests performed per year

But one contact person for each

customer

Industrialised processes

Unrivalled expertise accessible to all

customers

Continually expanding geographical coverage

Proven operating model that can be rolled-out

in various/multiple markets

Quality of customer service

29

Introduction

Market & Strategic Positioning

Finance & Outlook

Summary

Appendix

Contents

30

Consumers’

increasing awareness

and demand for safe

and high quality food

The Food testing market enjoys robust growth drivers

Compels industry to strengthen its testing programs

New products (GMOs, new packaging, etc.) create need for new tests

Governments increase regulations on food control

Brands have become more global and vulnerable to contaminations

Transparency and traceability are becoming the priorities

Increasing pressure on producers and manufacturers to invest in testing

Food scares and

crises, widely

covered in the

media

Demand for a high quality, state-of-the-art, international network of laboratories

Globalisation: Raw

materials sourced

from countries

with different QC

practices

Outsourcing of

industry’s

internal or state-

owned

laboratories

31

Retail & Distribution

Eurofins’ Food & Feed testing offering is the most

comprehensive in the market

Agricultural

production, product

development

Production

Dioxins Veterinary drug

residues

Organic residues POPs

Heavy metals Irradiation

Quality Control Vitamins

GMO Labelling

Purity Nutritional

Microbiology Sensorial

Authenticity Pesticides

Mycotoxins Allergens

32

Year Brand/ Contamination Impact Cost

Country

E. Coli in

cookie dough

70 people sick, 25 people hospitalized, job losses,

withdrawal of 86 million "cookies-worth”, court

proceedings initiated

50,000 infants ill, 6 deaths, global recall of

dairy and related products, criminal

charges in China

Melamine in

dairy products Sanlu/

Fronterra +

global brands

Unquantified

2009

2008

Nestlé

Dioxins Recall of Irish pork products, job

losses, destruction of 100,000 pigs

2008

CNN Health

BBC News

Irish pork > EUR 300m Irish Exporters

Association

Salmonella

in peanut

butter

2008 ~ USD 100m Est. only for

Kellogg’s

9 dead, 683 people sick, global recall of

peanut butter and related products

(1,600 types of products involved)

Kellogg’s,

Unilever,

General Mills Bloomberg

High profile food scares have expensive consequences

for producers…

Dioxins in

eggs, poultry

and pork

About 3,000 tons of feed contaminated with oil intended

for use in bio-fuels, 4700 farms closed, revenues lost,

tightening regulation

2011 Germany BBC news

Beef products

contaminated

with horse meat

Sales of frozen burgers plunged 43% and frozen

ready meals fell 13% in the UK between 21 Jan –

17 Feb, 2013, at the height of the scandal

2013 Europe The Guardian

~ EUR 360m

Market value

lost for Tesco

E-coli outbreak

at restaurants in

multiple states

53 people sick, 22 hospitalized in 9 states across

the US. 15% decline in like-for-like sales during

the period

2015 USA

Chipotle

CNN ~ USD 8bn Market value

lost

2017 Europe Fipronil in

European eggs

Farms shut down in the Netherlands, Belgium,

Germany and France. Supermarkets have also

withdrawn millions of eggs from sale

BBC news

33

Eurofins is meeting the demands of global players

The largest global food & beverage producers and retailers are clients of

Eurofins

Food and Beverage Retailers 2017 Sales in

EUR billion

2017 Sales in

EUR billion

Nestlé Switzerland 90.1

PepsiCo USA 63.5

Unilever UK /Netherlands 53.7

Coca-Cola USA 35.4

Mars* USA 35.0

Kraft Heinz USA 26.2

Danone France 24.7

McDonalds USA 22.8

Kelloggs USA 12.9

Pernod Ricard France 9.0 Source: Bloomberg * Forbes or other publicly available sources/estimates

Wal-Mart Stores USA 485.9

CostCo USA 129.0

Kroger USA 115.3

Carrefour France 78.8

Tesco UK 55.9

Lidl* Germany 64.4

Aldi * Germany 63.0

Metro AG* Germany 58.4

Casino Guichard France 36.0

ITM Enterprises* France 40.0

34

The Pharma testing market is both healthy and full of

potential

The increasing complexity of clinical trials leads to increasing

amounts of diagnostic procedures performed per patent

Regulatory bodies (e.g. FDA) are demanding more study data to

improve safety

New wave of biologics require more testing

Clinical trial processes are becoming increasingly rigorous to

ensure drug efficacy

The spend per drug trial is rapidly increasing

Need for big pharma

companies to expand

new drugs pipelines

Rapid technological change &

increasing complexity in testing

require ongoing investment in

technology & expertise

Greater trial complexity & size will increase likelihood of using CROs

35

Underlying trends are intact for continued growth

Pharmaceutical and biotechnology R&D

spending is expected to rise to $161 bn in

2018

2017 was a record year in FDA novel drug

approvals, the purest measure of biopharma

pipeline productivity

Drug approvals fuel reinvestment

across the R&D value chain

Record cash on biotech balance sheets

provides R&D funding through 2020

Sponsors outsource drug development to:

- Reduce their fixed cost base

- Access competencies that they do not have in-house

- Access experience and regulatory expertise in new

geographies

Growth of biotechnology industry:

- Limited physical infrastructure

- Lack of internal expertise

Source: Bloomberg Intelligence 4 Dec, 2017

Source: Citigroup Research 18 Feb, 2014

Global Drug R&D Spending (US$ bn)

Total R&D Spend $ 140bn (in 2014)

Portion that could be outsourced

$ 80bn

Currently

Outsourced

$34bn

Global % R&D Outsourced

36

Eurofins Pharma Services

Sequencing

Oligonucleotides

Pharmacogenomics

Transcriptomics

Genotyping

SNP-analysis

Pharmacology

Bioanalytical analysis

Translational

medicine

Phase I studies

Biomarkers

Bioanalysis

Immunogenicity

Proteomics

Microbiological and

Anti-infective analysis

Bioavailability

Bioequivalence

Impurities Analysis

Stability Studies

Process development

Hygiene Monitoring

Packaging analysis

High-throughput-

screening

Molecular-

pharmacology

cell-based assays

in vitro screening

in vitro profiling

in vivo safety

in vivo efficacy

Spanning the entire drug development cycle

Cardiovascular

Diseases

Immunodiagnostics

Infectious Diseases

Specific, fast-TAT

testing for transplant

patients

Genetic testing

Genomics Discovery Pharmacology

Pre-clinical/ Early

Development

Clinical (Central

Laboratory/ Bioanalytical)

Sequencing

Oligonucleotides

Pharmacogenomic

s

Transcriptomics

Genotyping

SNP-analysis

Pharmacology

Bioanalytical

Analysis

Translational

Medicine

Phase I Studies

Biomarkers

Bioanalysis

Immunogenicity

Proteomics

Microbiological and

Anti-infective

analysis

Bioavailability

Bioequivalence

High-throughput-

screening

Molecular-

Pharmacology

Cell-based Assays

In Vitro Screening

In Vitro Profiling

In Vivo Safety

In Vivo efficacy

BioPharma Products Testing

Pharmaceuticals,

Biologics, Medical

Device: Safety,

Characterization,

Quality Control,

Process

Development

Hygiene Monitoring

Packaging

Development &

Manufacturing

Complex API

Development

Multi-Step Synthesis

Cytotoxic and Highly

Potent

DS and DP

Manufacturing

New line of business (CDMO)

37

9 of the top 10 largest global pharmaceutical companies

are clients of Eurofins

Top 10 pharma companies

Pfizer (US)

Sanofi Aventis (FR)

GlaxoSmithKline (UK)

Novartis (CH)

AstraZeneca (UK)

Merck & Co (US)

Johnson & Johnson (US)

Roche (CH)

Eli Lilly & Co (US)

Bristol-Myers Squibb (US)

Global CRO Market Outlook

Eurofins pharma locations

Source: CRO Industry Primer, 20 June 2016, Credit Suisse

Genomics Services

Eurofins commences genomics

footprint with the acquisition of

Medigenomix (2001), MWG (2004),

Operon (2007) and AROS AB

(2013)

One of the world’s leaders in

Genomics Services

Custom DNA Sequencing & Synthesis

Gene Synthesis/Molecular Biology

Genotyping & Gene Expression

Next Generation Sequencing

“Genomics is one of the key technologies enabling personalized medicine…”

Application of Genomics

Technology in Bioanalytical testing

Eurofins deploys genomics

technology to further develop its

analytical portfolio for food,

environment and pharmaceutical

testing

• Reference lab for

transplantation & time-

sensitive tests

• High-complexity testing for

infectious diseases, allergy

and immune disorders

2000-2009 2010-2014 2015

Establishing platform to deploy genomics expertise for development of

innovative clinical diagnostic tests to serve global healthcare commnunity

• Leading diagnostics lab for

cardiovascular disease

• Proprietary plus clinical and

genetic tests & cardio-

informatics capabilities

• Proprietary technology

(TEMP-PCR) for single-

tube identification of

multiple pathogens

• Ultra-fast and precise,

highly parallel detection of

infectious diseases and

drug resistance

• One of the leading

groups of medical

biology labs in France

• Competency in

immunology, oncology

and infectious diseases

• One of the largest esoteric

diagnostic labs in Europe

• Strong reputation in

infectious diseases &

clinical trials for the pharma

industry

• First academic lab to bring

Next Generation Sequencing

(NGS) to commercial market

• Renowned for testing rare

genetic disorders

• Carrier screening, cancer

testing and exome sequencing

V. Ozdemir, et al. Current Pharmacogenomics and Personalized Medicine, Vol 7, Num 4, December 2009

2016-2017

• Reference lab for

reproductive genetic

testing

• Pioneer in first

trimester non-invasive

prenatal screening

test for Down

Syndrome

• One of the top 5

clinical diagnostic

laboratory groups

in Spain

• Largest national

coverage

38

• Reference lab

focused on donor

eligibility and

microbiology

testing for

transplantations.

• Broad menu of

infectious disease

screening assays

Eurofins Specialized Clinical Diagnostic Evolution

• European specialist in non-

invasive prenatal testing (NIPT)

• Launched Prenatest® in 2012,

the first NIPT in Europe

• Largest clinical diagnostics

provider in North Rhine-

Westphalia

• Access to over 900

physicians, 120 hospitals

and around 20 local health

authorities

• One of the leading specialty

diagnostics testing providers

in Italy

• Strong reputation in

molecular biology and

cytogenetics

• leading player in clinical

diagnostics in greater area of

Santos, Sao Paulo state

• A leading Belgian laboratory

performing human medical

testing covering all branches

of clinical biology

• Provides molecular

diagnostics and pathology

lab services

• Serves over 2,000 General

Practitioners in the NL

40

Increasing demand by citizens for a clean environment

EU expanding regulation (e.g. REACH)

Increasingly long list of products identified as toxic

Requirement for more sophisticated analyses and more

expensive equipment

The Environmental testing market continues to grow

Rise in

contamination &

pollution issues

Progress in epidemiology

& medicine has identified

more compounds as toxic

Compels industry to increase testing and outsource internal labs

41

Outdoor pollutants

Indoor and ambient

pollutants

Eurofins serves all the main environmental testing

markets

SOIL AIR WATER

Eurofins is the No.1 environmental testing service provider in the world*

Drinking water and groundwater

analysis

Full range of contaminants

Analysis of soil for full

range of contaminants

Consulting and

sampling companies

are natural partners

Lancaster Environmental

Testing is the laboratory

of choice for Fortune 500

companies in the USA

* Management estimate based on available information

42

Global trends in regulation support the business

Strong regulated markets (EU, USA) are still amending and adding regulations

Eastern European rules catching up with EU

Fast development of regulation in Asia

Regulation used for support of trading blocks (e.g. EU, NAFTA, ASEAN)

European Food Regulation (EC)178/2002

Recently passed

European REACH directive

US Country of Origin Labelling (COOL) law

PRC Food Safety Law in China

Food Safety Modernization Act (FSMA) in

USA

Comprehensive Review of Food Labelling

Law and Policy in Australia & New Zealand

Food imports

Labelling (e.g. allergen, origin label,

reference intakes)

Foodstuffs (marketing standards for

beverages, meat, fish, dairy products)

Pesticides

GMO & GM products

Additives (vitamin & mineral fortification,

flavourings, sweeteners, enzymes)

Key areas of food regulation Major pieces of legislation

43

*Registration Evaluation and Authorisation of Chemicals(1): Regulation (EC) N° 1907/2006 and Directive 2006/121/EC of the European Parliament and of the Council

Metals, resins, acids, solvents, oils, fibres in textile, car

components, toys, cosmetics, plastics, rubber,

microchip, etc.

Food and drug ingredients are excluded

EU regulations a key driver for the testing industry

– e.g. REACH directive

Listing and assessing the safety of 30,000

chemical substances used by industries in

Europe over 11 years

Replacing the most dangerous ones - no

chemical safety studies were conducted

before 1981; only 3700 new chemicals

analysed up to 2008 out of 100,000 used

currently in EU

Time line

Physico-chemical properties: density, viscosity, etc.

Toxicity: skin, eye, mutagenicity, inhalation, oral,

reproductive

Ecotoxicity: invertebrates, plants, fish, birds, soil,

water, degradation

Increasing testing requirements from 2010

Objectives Examples of affected products or industries

Type of testing

Estimated cost

EUR 10bn according to the EU including EUR

1.5bn for testing over 11 years

> 1 t/ p.a.

production

> 100 t/ p.a.

production

> 1,000 t/ p.a. production +

substances of very high concern

Nov 2010 May 2013 May 2018 Deadlines for

registration

44

Outsourcing adds to market growth

Examples of laboratories outsourced to Eurofins

Danish Hydrology Inst. Official water reference lab Scandinavia

Suez/Sita Envirolab The Netherlands

Danish farmers association Steins’ water/environment laboratory Denmark

Southern Water Water testing laboratory UK

Lyon University Hospital Phase I Activity France

Austrian Research Institute Food testing Austria

Clermont University Mineral water analysis France

Raisio Group Food product testing Finland

Mondi Environmental, paper/pulp testing Slovakia

DLG Group Food and feed producer Denmark

Miljølaboratoriet Environmental testing network Denmark

BASF/QTA Environmental, chemicals USA

MWH Global Environmental, water-testing USA

TÜV SÜD Dioxin Analysis Germany

Cranswick plc Food testing UK

Danone Infant and clinical nutrition analysis Germany

Company Outsourced Activity Country

45

Eurofins’ strategy builds high Barriers to Entry

GLP

GMP

GCP

ISO 9001

ISO 17025

FDA Approved

Offering a premium quality service … ... and leveraging internal efficiencies

Portfolio: over 150,000 validated methods

– unique in the world and ahead of

competition

Global laboratory network: fully set up for

cross-selling worldwide to customers

Accreditations: multiple international

accreditations

One-stop shop: single point of contact for

compliance to regulations of many

countries

Standardised testing in 44 countries

Sales and marketing: international teams

plus dedicated key account management

Reputation: high standards of quality and

consistency - the Eurofins brand

Internet: web-based transactions and

online access to testing results increase

switching costs

Industrialising the laboratory process:

rationalisation of sites and personnel

Competence Centres: high volume

laboratories providing highest levels of

expertise and service

Technology: the latest available in the

market providing the most accurate results

Economies of scale in Group purchasing

and sales functions

IT systems: cross-Group information tools

and standardised production systems

46

Introduction

Market & Strategic Positioning

Finance & Outlook

Summary

Appendix

Contents

We have built a hard-to-replicate world-class

infrastructure

Eurofins has been consistently investing more than its peers

47 47

Source: Eurofins, Company websites

TICS ex ERF = SGS, Intertek, Bureau Veritas

*2017 actuals for SGS and Bureau Veritas, Bloomberg 2017 consensus estimate for net capex and sales of Intertek

Midterm objective to reach 20% adjusted EBITDA

margin, and strengthen cashflow generation

Start-ups & businesses in significant restructuring is decreasing relative to size of the Group

SDI should reduce again relative to EBITDA of mature companies after stabilizing of start-up openings

Capex should gradually normalize back to 6% of sales, further unlocking cashflow

Eurofins Cashflow Expansion Levers

Objectives:

• Reduce relative impact of start-ups and SDI

• Bring capex back to 6% of revenues by 2020

48

* Objective

Separately Disclosed Items (SDI) costs

increased as % of EBITDA mainly due to

reorganizations in recent acquisitions and

acceleration of our start-up program

Start-ups & businesses in significant

restructuring as % of Group revenues SDI costs as % of Group EBITDA CAPEX as % of Group sales

Investments for future growth have had an

impact on cash flows

49

Cashflow expansion levers: cash investments impacting cashflows

*Free Cash Flow to Equity - Operating Cash Flow, less interest paid and net cash used in investing activities other than for acquisitions of subsidiaries

net of cash acquired and for derivative financial instruments

FCF

invested

for the

future

Reported FCF

to Equity

€19m

€57m

€81m

€75m

€49m €46m

€51m

€100m

€126m

€80m

€89m

€147m

Network Build-Out to Position for the Future

Capex remains driven by network expansion investments

First Generation OneIT deployed in ca. 85% of Food and Environment laboratories

New Generation Genomics and Agroscience IT systems deployment completed

New Generation Biopharma Product Testing system deployed in 50% of labs

Eurofins On Line (EOL) almost fully deployed in Food and Environment business lines

50

Continuous investments in state-of-the-art IT solutions

One IT (IT Solutions)

2012 2013 2014 2015 2016 2017

Lab surface

added m2 20,000 40,000 60,000 55,000 46,000 53,000

Since 2005, 120 new/expanded large modern state-of-the-art sites to

enable consolidation / closure of smaller or old sites

Total of over 430,000 m2 added or brought to most modern standards

between 2005-2017 (over 53,000 m2 in 2017)

189,000 m2 of additional modern surface planned for 2018-2019, of which

99,000 m2 planned to come on stream in 2018

Major facilities : new or recently upgraded and planned for 2018-2019

51

Laboratory Network Investments:

Expansion / Modernization of Laboratory Sites

Suzhou, CN

Fresno, CA

Wolverhampton, UK ext.

Munich, DE ext.

Taipei, TW

Bucharest, RO

Dungarvan, IE ext.

Wesseling, DE ext.

Melbourne, AU

Lancaster, PA ext.

Freiberg, DE

Shenzen, CN

Hamburg, DE

Uppsala, SE

Reichenwalde, DE

ext.

Moss, NO

Douai, FR ext.

Les Ulis, FR ext.

Boston, MA ext.

Louisville, KY

2013 2016

Des Moines, IA ext.

Bangalore, IN ext.

Vienna, AU ext.

Murcia, ES

Barneveld, NL ext.

Hamburg, DE ext.

Pomona, CA

Kansas City, MO

Heerenveen, NL

Gelsenkirchen, DE

Auckland, NZ ext.

Yokohama, JP ext.

Hamburg, DE ext.

Seattle, WA

Vergeze, FR ext.

Graauw, NL

Wageningen, NL

2014 2015

Hamburg, DE ext.

Vejen, DK ext.

Bangalore, IN

New Orleans, LA

Lancaster, PA ext.

Auckland, NZ

Sydney, AU

Bordeaux, FR

Mounds View, MN

2018-2019 2017

Nantes, FR ext.

Livingston, UK

Madrid, ES

Ho Chi Minh City, VN

Gurgaon, IN

Bangalore, IN

Lancaster, PA ext.

Hangzhou, CN

Dayton, NJ

Hasselt, BE

Almeria, ES

Nove Zamky, SK

Saverne, FR ext.

Horsham, PA

Niefern, DE ext.

Vergeze, FR ext.

Aix-en-Provence, FR

Lyon, FR

Atlanta, GA

Ebersberg, DE

New Markets

Denmark: Food & Env.

France: Environment Testing

Brazil: Food Testing

Global: Genomics

Europe: Forensic Testing

Sweden, Norway: Food and Env. Testing

Global: BioPharma Product Testing

UK & Ireland: Food Testing

Global: Agroscience

Europe: Agro Testing

China, India, Singapore, Japan: Environment Testing

Australia, New Zealand: Food & Environment Testing

Global: Discovery Pharmacology

Austria: Environment Testing

Specialised Clinical Diagnostics France

Finland: Environment Testing

USA: Food and Env. Testing

USA: Specialized Material Sciences Testing

2001

No 1

2002 2003 2004 2005 2006 2007 2008 2009 2010 2011 2012

No 1 X

No 1

X

No 1 X

No 1

X No 2

X

2013

X

X No 1

X

X

No 1

2014 2015

X

No 2

2016

X X

No 1

2017

X No 1

= Market Entry

X No 1

X No 1

No 1

X No 1

X No 1

52

Market Share: Eurofins is the leader in its industry –

and continues to reach new market leadership positions*

Eurofins already has long-standing N°1 or N°2 positions in its historic markets:

Germany (Food + Environment), France (Food), Benelux (Food + Environment) *To the best of Eurofins’ knowledge, based on data available to the Group

X No 3

X No 1

53

Eurofins is already present in countries generating

over 83% of the world’s GDP…

…and penetrates

Top 25 countries

with more and

more of its

services !

International Monetary Fund (Estimates as of October 2017)

Eurofins market presence

Country GDP ($tn) % of world's

GDP Eurofins presence Food testing

Environment testing

Biopharma services

Clinical Diagnostics

USA 20.2 23.9%

China 13.1 15.6%

Japan 5.1 6.0%

Germany 3.9 4.7%

France 2.8 3.3%

UK 2.7 3.2%

India 2.7 3.1%

Brazil 2.2 2.6%

Italy 2.1 2.4%

Canada 1.8 2.1%

South Korea 1.6 1.9%

Russia 1.5 1.8%

Australia 1.5 1.8%

Spain 1.4 1.7%

Mexico 1.3 1.5%

Indonesia 1.1 1.3%

Turkey 0.9 1.1%

Netherlands 0.9 1.1%

Switzerland 0.7 0.8%

Saudi Arabia 0.7 0.8%

Argentina 0.6 0.8%

Sweden 0.6 0.7%

Taiwan 0.6 0.7%

Poland 0.6 0.7%

Belgium 0.5 0.6%

Total top 25 70.9 84.0% 21 19 15 17 8

Eurofins is present in 21 countries of world's top 25:

66.3 78.6%

+ presence in 23 other countries

4.1 4.8%

Eurofins is present in 44 countries:

70.4 83.4%

54

€1.05 bn total investments in

laboratory network over the

last 10 years 2008-2017

130 start-up laboratories to

reinforce footprint opened

since 2000:

25 between 2000-2009 (Pr. 1)

18 between 2010-2013 (Pr. 2)

57 between 2014-2016 (Pr. 3)

30 in 2017 alone

Typically losses in years 1 and

2 of about EUR 1-2m p.a. per

start-up

Initial Capex EUR 1- 3m per

lab (e.g. premises, equipment)

Heavy investment in high-growth markets and resources

for future profits

Deploy proprietary IT

systems

eLIMS, eCommerce (EOL)

Best practice lab

organisation & processes

Consolidation into large,

world-class sites

Standardised testing

procedures

Invest in state-of-the-art

technology

Network Investments Bringing recently acquired

labs to group standards Building corporate resource

for future size and growth

Recruitment of top

leadership

Additional layer of

management to lead global

business lines

Central IT systems and

processes

(e.g. ERP, CRM)

Additional central cost

(Eurofins’ Group Service

Centre finance & IT

management costs)

+EUR 10m 2010 vs 2005

+EUR 41m 2016 vs 2010

+EUR 17m 2017 vs 2015

2017 2016 Year on year

evolution of

Adjusted

Results (%)

EUR m Adjusted

Results

Separately

disclosed

items

Reported

results

Adjusted

Results

Separately

disclosed

items

Reported

results

Revenues 2,971.4 2,971.4 2,536.6 2,536.6 +17.1%

EBITDA 556.7 -43.5 513.2 479.6 -18.5 461.1 +16.1%

EBITDA Margin (%) 18.7% 17.3% 18.9% 18.2%

EBITAS 399.6 -62.0 337.5 357.6 -38.2 319.4 +11.7%

Net Profit to equity holders 299.1 -82.4 216.8 221.6 -47.6 174.0 +35.0%

Year on year

evolution on

Reported

Results (%)

EPS to equity holders (EUR) 10.49 8.65 +21.3%

Operating Cash Flow 405.1 371.8 +9.0%

Net capex 212.6 194.1 +9.5%

Net Debt 1,395.4 557.8

Leverage Ratio (net debt/Adjusted EBITDA) 2.51x 1.16x

Leverage Ratio (net debt/ Adjusted Proforma EBITDA) 2.14x 1.13x

55

Positive trends drive solid operating results

Adjusted – reflects the ongoing performance of the mature and recurring activities excluding “separately disclosed items” (Notes 1.28 & 1.29) of Eurofins’ 2017 Notes to the consolidated financial statements

Separately disclosed items – include one-off costs from integration, reorganisation, discontinued operations and other non-recurring income and costs, temporary losses and other costs related to network expansion, start-ups and new

acquisitions undergoing significant restructuring, share-based payment charge, impairment of goodwill, amortisation of acquired intangible assets, negative goodwill, loss/gain on disposal and transaction costs related to acquisitions

as well as income from reversal of such costs and from unused amounts due for business acquisitions, net finance costs related to borrowing and investing excess cash and one-off financial effects (net of finance income) and the

related tax effects – Details are provided in Note 1.29 & 2.3. of Eurofins’ 2017 Notes to the consolidated financial statements

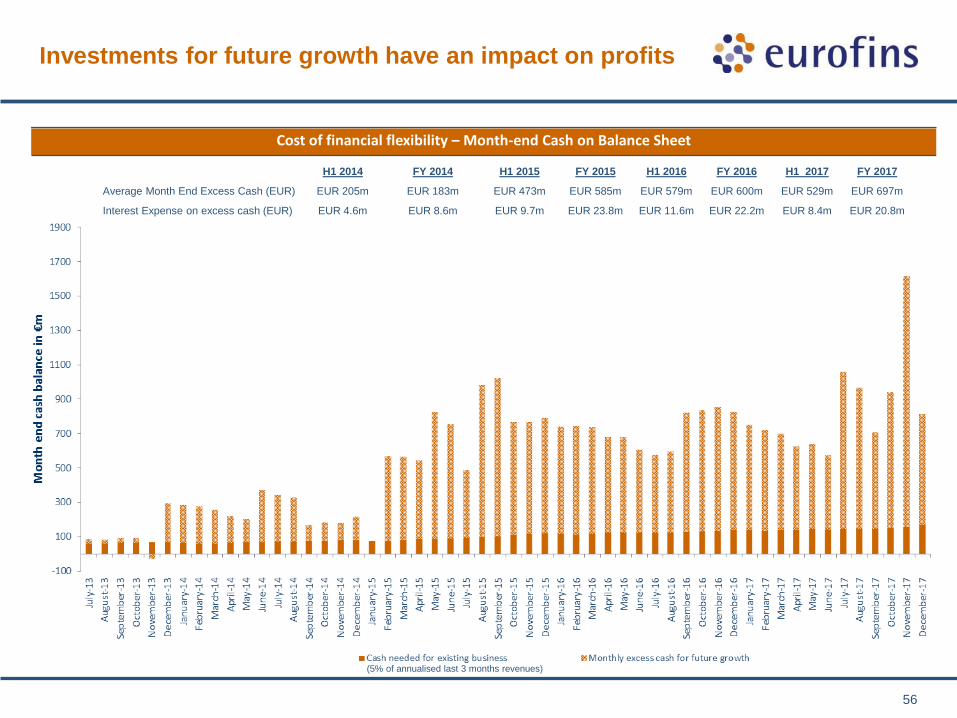
(5% of annualised last 3 months revenues)

56

Investments for future growth have an impact on profits

Cost of financial flexibility – Month-end Cash on Balance Sheet

H1 2014 FY 2014 H1 2015 FY 2015 H1 2016 FY 2016 H1 2017 FY 2017

Average Month End Excess Cash (EUR) EUR 205m EUR 183m EUR 473m EUR 585m EUR 579m EUR 600m EUR 529m EUR 697m

Interest Expense on excess cash (EUR) EUR 4.6m EUR 8.6m EUR 9.7m EUR 23.8m EUR 11.6m EUR 22.2m EUR 8.4m EUR 20.8m

0.0%

5.0%

10.0%

15.0%

20.0%

-

500

1,000

1,500

2,000

2,500

3,000

3,500

4,000

4,500

2011 2012 2013 2014 2015 2016 2017 2018* 2019*G

rou

p A

dju

ste

d E

BIT

DA

mar

gin

(%

)

Gro

up

Re

ven

ue

s (E

UR

m)

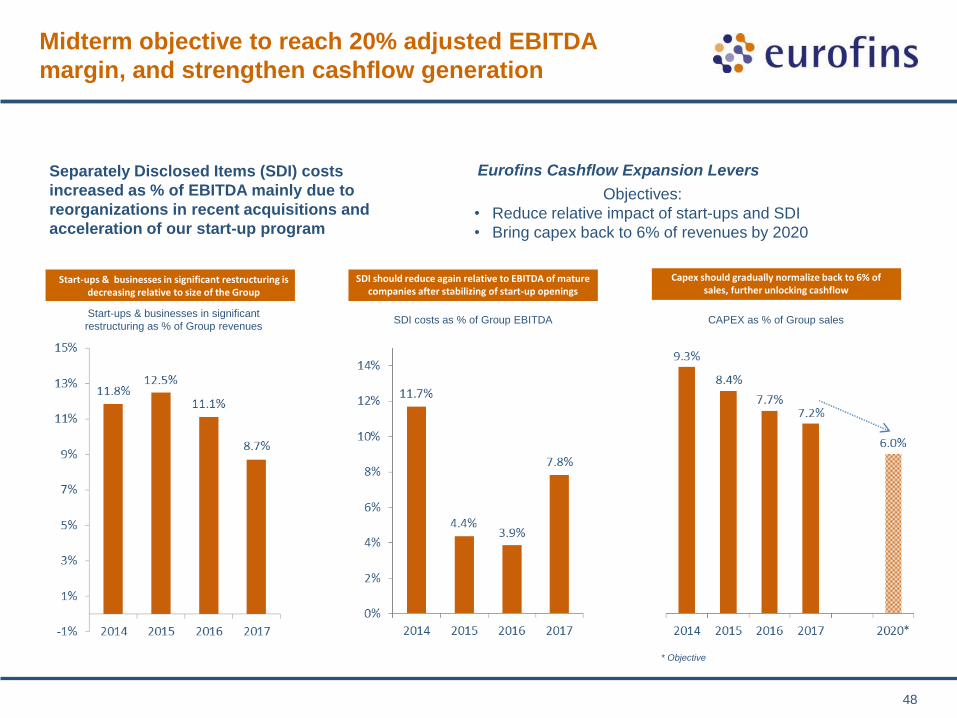
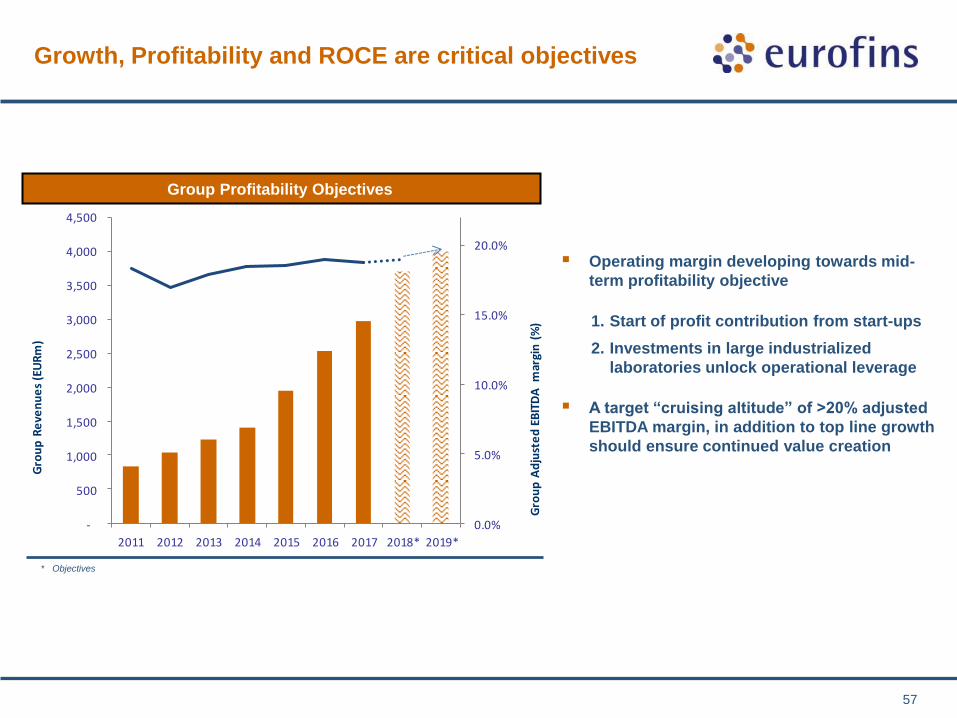
Growth, Profitability and ROCE are critical objectives

Operating margin developing towards mid-

term profitability objective

1. Start of profit contribution from start-ups

2. Investments in large industrialized

laboratories unlock operational leverage

A target “cruising altitude” of >20% adjusted

EBITDA margin, in addition to top line growth

should ensure continued value creation

57

Group Profitability Objectives

* Objectives

Solid Balance Sheet

Net Debt/ LTM Adjusted EBITDA

Net Debt (EUR m) 557.8

Net Debt

calculation

Short-term borrowings

+ Long-term borrowings

- Cash & cash equivalents

= NET DEBT

1.16 x

Cash + cash equivalents

(EUR m)

826.1

1,756.7

Hybrid

EUR 300m Eurobond issued in Nov 2013, 5-yr maturity (Nov

2018) at an annual interest of 3.125%

EUR 500m Eurobond issued in Jan 2015, 7-yr maturity (Jan

2022) at an annual interest of 2.25%

EUR 500m Eurobond issued in Jul 2015, 7.5-yr maturity (Jan

2023) at an annual interest of 3.375%

EUR 650m Eurobond issued in Jul 2017, 7-yr maturity (Jul

2024) at an annual interest of 2.125%, the lowest ever

coupon achieved by the Group

Eurobond

EUR 300m hybrid issued in Jan 2013/Jul 2014, callable at

par by Eurofins in Jan 2020. Bears a fixed coupon of 7.00%

until first call, Euribor 3m + 818 bp thereafter if not called

EUR 300m hybrid issued in April 2015, callable at par by

Eurofins in April 2023. Bears a fixed coupon of 4.875%

until first call, Euribor 3m + 701 bp thereafter if not called

EUR 400m hybrid issued in November 2017, callable at par

by Eurofins in November 2025. Bears a fixed coupon of

3.25% until first call, Euribor 3m + margin* thereafter if not

called. This is the lowest ever hybrid coupon achieved by

Eurofins and is structured for optimum equity qualification

by rating agencies

58

Total Equity (EUR m)

Dec 2017

2.51 x

Dec 2016

1,395.4

2,482.0

820.4

Net Debt/ProForma LTM

Adjusted EBITDA

2.14 x 1.13 x

* Margin depends on Eurofins’ rating scenario: 250bp if unrated; if rated please refer to the prospectus of the Hybrid issue (ISIN: XS1716945586), available at www.bourse.lu

59

High Degree of Financial Flexibility

Leverage ratio remains well below the Group’s

covenant of 3.5x

Large financial flexibility with fairly long financing

maturity

• EUR 300m Eurobond issued in 2013; maturing 2018

• Hybrid capital of EUR 300m; perpetual, callable 2020

• EUR 500m Eurobond issued in 2015; maturing 2022

• EUR 500m Eurobond issued in 2015; maturing 2023

• Hybrid capital of EUR 300m; perpetual, callable 2023

• EUR 650m Eurobond issued in 2017; maturing 2024

• Hybrid capital of EUR 400m; perpetual, callable 2025

• Revolving Credit Facilities

Continued profitability improvement of existing

businesses, in addition to increasing profit

contribution from recently-acquired companies

allows Eurofins to remain well below its debt

covenant limit and maintain significant balance sheet

headroom and financial war chest

Strong Balance Sheet as of 31/12/2017

59

Net Debt/ Adjusted EBITDA: max 3.5x

*Pro-forma Net Debt/Adjusted EBITDA leverage

EUR 4bn of revenues by 2019

Total revenue growth of 16% p.a.

2017-2019, of which

5% organic

ca. EUR 200m of acquisitions per

year in 2018 and 2019

60

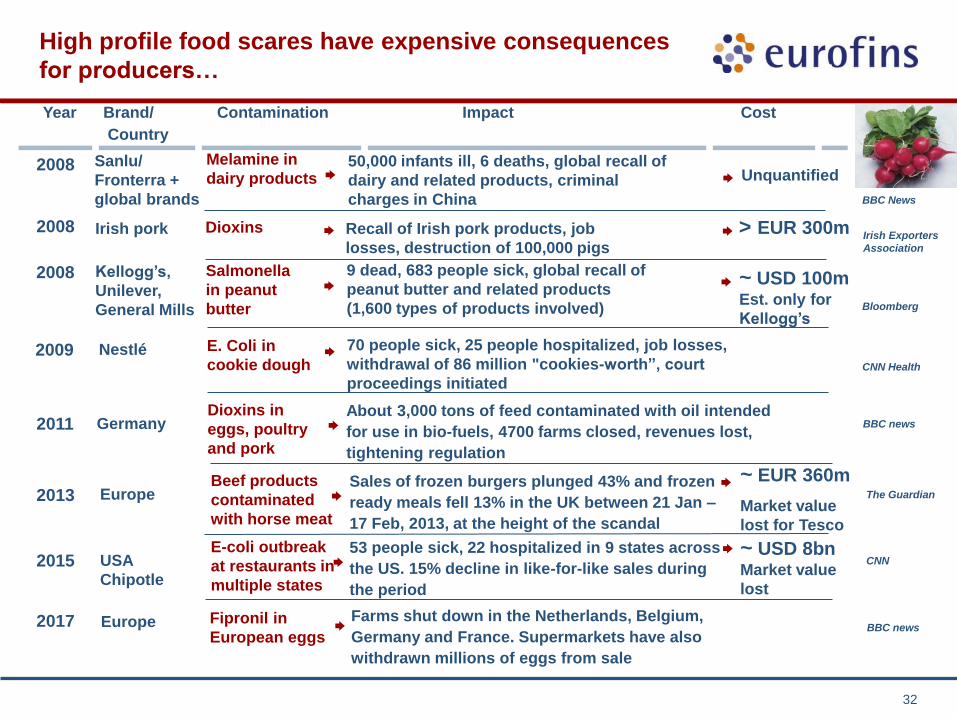
Food safety & contamination

issues

New regulations (e.g. FSMA,

REACH)

Outsourcing trend

Risks due to globalisation of

trade

Vulnerability of global brands

Scientific developments (e.g.

GMOs, Biologics…. ) + new

testing methods

New molecular and genomic

clinical diagnostics and

personalized medicine

Massive global investments in

Biopharmaceuticals

Outlook: becoming the world leader in the bioanalytical

testing market

Unique technological portfolio of

over 150,000 methods

Volume scale advantage &

Competence Centres

Focus on running laboratories

Global network of standardised

laboratories

Experience in integrating value

adding acquisitions

Recurring revenues with high

switching costs and high barriers

to entry

+ Key Success Factors Sustainable Market

Growth Drivers

Eurofins’ unique position in a young, fast growing and fragmented market should lead to long term,

sustainable profitability

= Solid Outlook

Mid-term Objectives*

CAPEX normalization to 6% of sales by 2020

20% Adjusted EBITDA margin objective by 2020

Objectives set by management include contributions from

M&A that are not yet concluded

* At 2017 FY average exchange rates

2018 Objectives*

EUR 3.7bn of revenues

EUR 700m of Adjusted EBITDA

61

Introduction

Market & Strategic Positioning

Finance & Outlook

Summary

Appendix

Contents

62

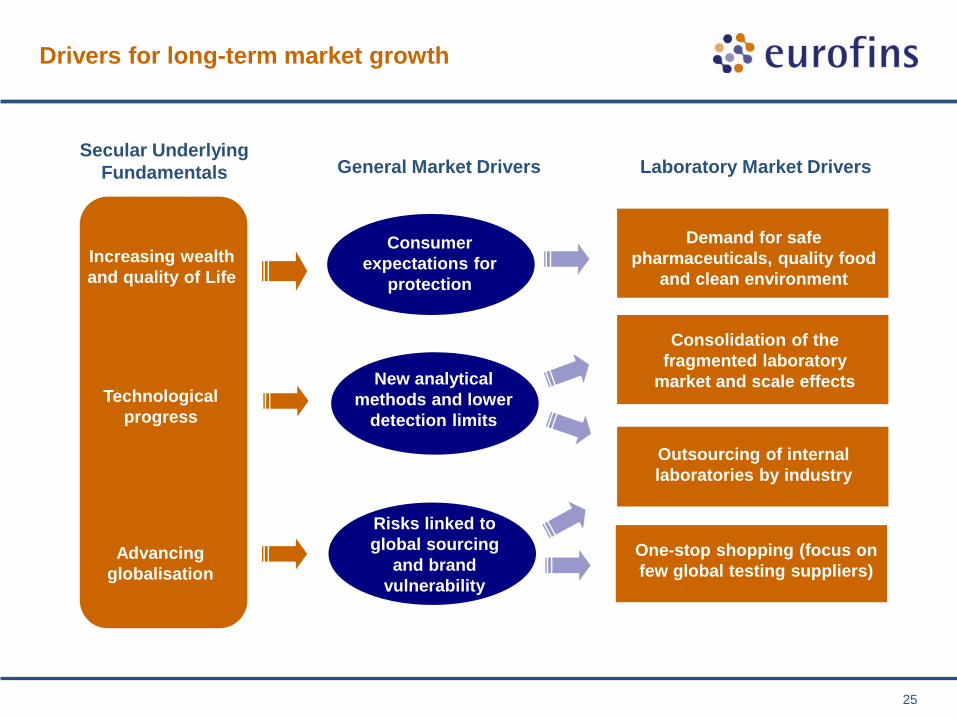
High-growth, non-cyclical markets driven by secular

mega-trends

Advancing globalisation but with very few global

testing suppliers

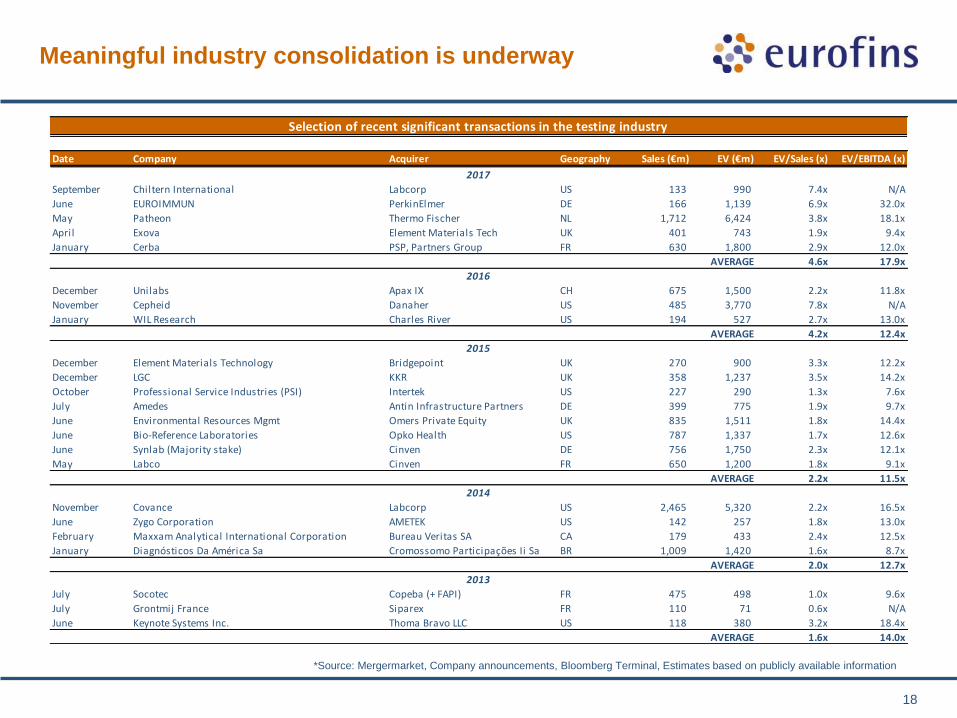
Fragmented competition & opportunities for

consolidation

Very recurring business; 6% - 12% typical historic

organic growth for the last 20 years

High barriers to entry

Best in class technology and quality give best brand

protection

N° 1 or 2 worldwide in most business lines

Strong international presence in 44 countries

State-of-the-art laboratory infrastructure

High switching costs for clients

Good cash flow visibility

Experienced multi-national leadership

Conclusion: our sustainable competitive advantage

Track record of profitable growth – Strong ROCE and cash flow generation potential

ROCE* of 12.0% and ROE** of 12.5% in 2017 despite significant future-orientated investments and one-off

restructuring costs

5-year CAGR: Revenues 23%, Operating Cash Flow 25%

Large potential to roll out business model in fast growing economies

Following past intense investment cycles Eurofins is well-positioned to double in size between 2015 and 2019 and

reach EUR 4bn in revenues by 2019 whilst maintaining leadership in multiple markets and improving profitability

*ROCE = EBITAS/Average Capital Employed over previous 4 quarters **ROE = Net Profit/Equity at the beginning of the year

63

Appendix / Back up slides

64

Consolidated Income Statement

2017 2016

EUR Thousands Adjusted

results

Separately

disclosed items

Reported

Results

Adjusted

results

Separately

disclosed items

Reported

Results

Revenues 2,971,417 - 2,971,417 2,536,608 - 2,536,608

Operating costs, net -2,414,694 -43,481 -2,458,174 -2,056,984 -18,547 -2,075,532

EBITDA 556,723 -43,481 513,243 479,623 -18,547 461,076

Depreciation and amortisation -157,161 -18,557 -175,718 -122,008 -19,688 -141,696

EBITAS 399,562 -62,038 337,525 357,615 -38,235 319,380

Share-based payment charge and acquisition- related expenses, net - -40,718 -40,718 - -37,433 -37,433

EBIT 399,562 -102,756 296,807 357,615 -75,668 281,947

Finance income 897 7,457 8,354 1,594 29,358 30,952

Finance costs -44,040 -11,419 -55,459 -50,891 -19,910 -70,801

Share of (loss)/ profit of associates 403 - 403 509 - 509

Profit before income taxes 356,823 -106,718 250,105 308,827 -66,220 242,607

Income tax expense -54,482 23,222 -31,260 -81,362 16,261 -65,101

Net profit for the period 302,341 -83,496 218,845 227,465 -49,959 177,506

Net profit and loss attributable to:

Equity holders of the Company 299,135 -82,364 216,771 221,643 -47,646 173,997

Non-controlling interests 3,206 -1,132 2,074 5,822 -2,313 3,509

Earnings per share (basic) in EUR

- Total 17.49 -4.82 12.68 13.86 -2.98 10.88

- Attributable to hybrid capital investors 1.64 0.55 2.18 1.71 0.52 2.23

- Attributable to equity holders of the Company 15.86 -5.36 10.49 12.15 -3.50 8.65

Earnings per share (diluted) in EUR

- Total 16.62 -4.58 12.04 13.07 -2.81 10.26

- Attributable to hybrid capital investors 1.55 0.52 2.07 1.61 0.49 2.10

- Attributable to equity holders of the Company 15.07 -5.10 9.97 11.46 -3.30 8.16

Weighted average shares outstanding (basic) - in thousands 17,099 - 17,099 15,990 - 15,990

Weighted average shares outstanding (diluted) - in thousands 17,998 - 17,998 16,957 - 16,957

65

Consolidated Balance Sheet

EUR Thousands December 31,

2017

December 31,

2016

Property, plant and equipment 685,998 506,818

Goodwill 2,505,337 1,584,644

Other intangible assets 735,120 383,209

Investments in associates 5,642 3,373

Financial assets and other receivables 43,942 34,154

Deferred tax assets 29,690 37,804

Total non-current assets 4,005,729 2,550,002

Inventories 51,805 39,547

Trade accounts receivable 705,716 524,508

Prepaid expenses and other current assets 99,478 65,012

Current income tax assets 58,745 38,694

Derivative financial instruments assets 90,477 85,554

Cash and cash equivalents 820,357 826,098

Total current assets 1,826,578 1,579,413

Total assets 5,832,307 4,129,415

Share capital 1,764 1,693

Hybrid capital 1,000,000 600,000

Other reserves 934,857 614,928

Retained earnings 522,881 287,281

Currency translation differences -16,332 123,576

Total attributable to equity holders of the Company 2,443,170 1,627,477

Non-controlling interests 38,803 129,237

Total shareholders' equity 2,481,973 1,756,714

Borrowings 1,662,099 1,340,359

Derivative financial instruments liabilities 239 1,659

Deferred tax liabilities 126,352 83,911

Amounts due for business acquisitions 49,521 180,600

Retirement benefit obligations 55,535 51,113

Provisions for other liabilities and charges 4,695 5,050

Total non-current liabilities 1,898,441 1,662,692

Borrowings 554,231 43,519

Interest and earnings due on hybrid capital 64,472 58,190

Trade accounts payable 301,863 230,122

Advance payments received 46,670 23,558

Deferred revenues 55,072 29,451

Current income tax liabilities 21,455 26,927

Amounts due for business acquisitions 88,235 43,511

Provisions for other liabilities and charges 15,027 12,728

Other current liabilities 304,868 242,003

Total current liabilities 1,451,893 710,009

Total liabilities and shareholders' equity 5,832,307 4,129,415

66

Consolidated Cashflow Statement

* Free Cash Flow to the Firm – Net cash provided by operating activities, less Net capex.

EUR Thousands 2017 2016

Cash flows from operating activities

Profit before income taxes 250,105 242,607

Adjustments for:

Depreciation and amortisation 175,718 141,696

Share-based payment charge and acquisition-related expenses, net 40,718 37,433

Other non-cash effects -9,596 3,714

Financial income and expense, net 45,247 39,767

Share of profit from associates -403 -509

Transactions costs and income related to acquisitions -9,940 -6,615

Increase (decrease) in provisions, retirement benefit obligations 3,397 -6,376

Change in net working capital -10,740 -6,636

Cash generated from operations 484,506 445,081

Income taxes paid -79,384 -73,239

Net cash provided by operating activities 405,122 371,843

Cash flows from investing activities

Purchase of property, plant and equipment -200,645 -155,721

Purchase, capitalisation of intangible assets -45,090 -43,954

Proceeds from sale of property, plant and equipment 33,090 5,548

Net capex -212,645 -194,127

Free cash Flow to the Firm1 192,477 177,716

Acquisitions of subsidiaries net of disposals, net of cash acquired -1,534,362 -201,122

Change in investments, financial assets and derivative financial instrument, net -3,511 -628

Interest received 3,432 4,073

Net cash used in investing activities -1,747,086 -391,803

Cash flows from financing activities

Proceeds from issuance of share capital 320,049 501,117

Proceeds from borrowings 879,732 7,945

Repayments of borrowings -138,884 -345,859

Change in hybrid capital 398,543 -

Dividends paid to shareholders and non-controlling interests -34,912 -22,452

Earnings paid to hybrid capital investors -35,625 -35,625

Interest paid -45,612 -55,223

Net cash provided by financing activities 1,343,292 49,903

Net effect of currency translation on cash and cash equivalents and bank overdrafts -10,969 4,674

Net increase (decrease) in cash and cash equivalents and bank overdrafts -9,641 34,615

Cash and cash equivalents and bank overdrafts at beginning of period 825,667 791,052

Cash and cash equivalents and bank overdrafts at end of period 816,026 825,667

EAG believes that it holds the N°1 position in both Materials and Engineering Sciences

markets, in the USA.

Materials and Engineering Sciences represent over 50% of EAG’s total revenue.

The Materials Sciences business segment is expected to further grow organically, driven by continued growth

in key end markets such as high tech, transportation, medical devices and defense.

EAG offers the most comprehensive and broad portfolio in Materials and Engineering Sciences:

Advanced Microscopy – Scanning Electron Microscopy (SEM) and Transmission Electron Microscopy

(TEM), essential techniques to investigate sample microstructure, morphology, particle size, particle

coating and defects.

Composition Analysis & Material Identification – EAG helps their clients to:

Determine the potential source of identified materials.

Compare chemistries of different materials.

Confirm identity of suspected materials.

Identify a material from a potential competitor.

Deformulation – industry leader in reverse engineering. Experienced chemists in separation, identification

and quantitation of ingredients in a formulation.

Metallurgical and Failure Analysis – investigations of various products and components used in the

aerospace, transportation, consumer products, construction and medical device industries.

Trace Elemental Analysis – expertise in ultra-trace concentrations, whose mass fractions are measured

below the parts per million levels. Even the Presence of small levels of unwanted contaminants may

influence the characteristics of materials in terms of physical, electrical or other properties.

67

EAG provides Eurofins an entry into the dynamic and

growing Materials and Engineering Sciences markets

68

Post acquisition and integration into Eurofins, both sales

and profits often increase significantly

Illustration

0.0

1.0

2.0

3.0

4.0

5.0

6.0

7.0

1992 1993 1994 1995 1996 1997 1998 1999 2000 2001 2002 2003 2004

An

nu

al

Sa

les

/ m

illi

on

Acquired

by

Eurofins

CAGR

19%

EBITDA

margin in

% of sales

<8% >20%

Growth drivers post acquisition:

1) Sales increase through cross selling of

Eurofins lab specialities internationally

2) Cost reduction – focus on most frequently

performed tests

Frequency

(e.g. no. of

tests per day)

No. of tests offered

100

Prior to acquisition

50% 50%

% of employees

performing tests

Can be subcontracted to specialised

Eurofins laboratories after acquisition

400

Focus and scale drive profitability

Actual example of an acquired lab:

100

50

500

Company A

Shareholder Returns: TICS & Clinical Diagnostics

Companies

Share price evolution 2011-2017 Total Shareholder Returns 2011-2017 (Assumes all dividends re-invested) Figure 1 Figure 2

Shareholder Returns

Based on share prices Total Shareholder Returns

31-Dec-11 31-Dec-12 31-Dec-13 31-Dec-14 31-Dec-15 31-Dec-16 31-Dec-17 31-Dec-11 31-Dec-12 31-Dec-13 31-Dec-14 31-Dec-15 31-Dec-16 31-Dec-17

Eurofins 100.0 217.5 348.8 376.4 571.4 719.0 901.1 100.0 219.5 354.4 384.6 586.6 741.4 933.0

SGS 100.0 130.3 132.0 131.5 122.9 133.2 163.4 100.0 135.3 140.4 144.3 139.7 156.6 198.5

Intertek 100.0 152.3 154.7 114.7 136.5 171.1 255.0 100.0 154.3 158.8 119.8 145.3 185.1 280.2

BV 100.0 150.4 150.9 130.1 130.7 130.8 162.7 100.0 153.1 156.9 138.3 142.2 146.1 185.7

ALS 100.0 110.2 91.2 55.6 41.3 66.2 76.6 100.0 115.6 100.7 64.3 49.5 80.9 99.6

Quest Diagnostics 100.0 100.4 92.2 115.5 122.5 158.3 169.6 100.0 101.5 95.2 121.9 132.0 174.1 190.1

Sonic Healthcare 100.0 118.2 147.0 164.0 158.4 189.7 202.7 100.0 123.9 160.7 186.4 186.5 231.6 267.1

Charles River 100.0 137.1 194.1 232.9 294.1 278.8 400.5 100.0 137.1 194.1 232.9 294.1 278.8 400.5

Neogen 100.0 147.9 223.7 242.8 276.7 323.1 402.5 100.0 147.9 223.7 242.8 276.7 323.1 402.5

Opko 100.0 98.2 172.2 203.9 205.1 189.8 100.0 100.0 98.2 172.2 203.9 205.1 189.8 100.0

Labcorp 100.0 100.8 106.3 125.5 143.8 149.3 185.5 100.0 100.8 106.3 125.5 143.8 149.3 185.5

Idexx 100.0 120.6 138.2 192.7 189.5 304.8 406.4 100.0 120.6 138.2 192.7 189.5 304.8 406.4

FTSE100 100.0 105.8 121.1 117.8 112.0 128.2 138.0 100.0 110.0 130.5 131.5 129.7 154.5 173.0

DAX 100.0 129.1 161.9 166.2 182.1 194.6 219.0 100.0 129.1 161.9 166.2 182.1 194.6 219.0

S&P500 100.0 113.4 147.0 163.7 162.5 178.0 212.6 100.0 116.0 153.5 174.5 176.9 198.1 241.3

CAC40 100.0 115.2 136.0 135.2 146.8 153.9 169.0 100.0 120.4 147.1 150.8 168.9 183.7 206.8

Based on share prices as of close 29.12.2017

69 Source: Bloomberg

Shareholder Returns: TICS & Clinical Diagnostics

Companies

Based on share prices at close of 31 December of each year

Historical Share Price Development (Y vs Y-1) Compounded Growth

2 Y 3Y 4 Y 5Y

31-Dec-13 31-Dec-14 31-Dec-15 31-Dec-16 31-Dec-17 5Y

Growth 2016-2017 2015-2017 2014-2017 2013-2017

Eurofins 60.4% 7.9% 51.8% 25.8% 25.3% 314.4% 26% 34% 27% 33%

SGS 1.3% -0.3% -6.6% 8.4% 22.6% 25.4% 15% 8% 5% 5%

Intertek 1.6% -25.9% 19.0% 25.4% 49.1% 67.5% 37% 31% 13% 11%

BV 0.4% -13.8% 0.4% 0.1% 24.4% 8.2% 12% 8% 2% 2%

ALS -17.2% -39.0% -25.7% 60.2% 15.7% -30.5% 36% 11% -4% -7%

Quest Diagnostics -8.1% 25.3% 6.1% 29.2% 7.2% 69.0% 18% 14% 16% 11%

Sonic Healthcare 24.4% 11.6% -3.4% 19.8% 6.8% 71.5% 13% 7% 8% 11%

Charles River 41.6% 20.0% 26.3% -5.2% 43.7% 192.1% 17% 20% 20% 24%

Neogen 51.3% 8.5% 14.0% 16.8% 24.6% 172.1% 21% 18% 16% 22%

Opko 75.5% 18.4% 0.6% -7.5% -47.3% 1.9% -30% -21% -13% 0%

Labcorp 5.5% 18.1% 14.6% 3.8% 24.2% 84.1% 14% 14% 15% 13%

Idexx 14.6% 39.4% -1.6% 60.8% 33.4% 237.0% 46% 28% 31% 28%

FTSE100 14.4% -2.7% -4.9% 14.4% 7.6% 30.3% 11% 5% 3% 5%

DAX 25.5% 2.7% 9.6% 6.9% 12.5% 69.7% 10% 10% 8% 11%

S&P500 29.6% 11.4% -0.7% 9.5% 19.4% 87.5% 14% 9% 10% 13%

CAC40 18.0% -0.5% 8.5% 4.9% 9.8% 46.6% 7% 8% 6% 8%

Long term (since IPO) Eurofins performance track record by 5 year intervals (Compounded Growth)

IPO 27/10/1997 - 31/12/2001

Eurofins Outperformance

Factor 01/01/2002-31/12/2006

Eurofins Outperformance

Factor 01/01/2007-31/12/2011

Eurofins Outperformance

Factor 01/01/2013-31/12/2017

Eurofins Outperformance

Factor

27.10.1997-31.12.2017

Eurofins Outperformance

Factor

Eurofins 72.7% 27.2% 0.8% 54.6% 32.5%

FTSE100 1.9% 38.4x 3.6% 7.6x -2.2% N/A 6.6% 8.2x 2.3% 13.9x

DAX 7.4% 9.8x 5.0% 5.4x -2.2% N/A 16.3% 3.4x 6.2% 5.2x

S&P500 7.0% 10.4x 4.3% 6.3x -2.4% N/A 16.3% 3.4x 5.7% 5.7x

CAC40 13.7% 5.3x 3.7% 7.4x -10.6% N/A 10.6% 5.1x 3.3% 9.7x

70

Source: Bloomberg

Source: Bloomberg

EV/EBITDA 2018 and Consensus Earnings Growth Estimates

Valuation multiples overview

Source: Bloomberg

71

Strong financial discipline at all times

Average net debt/LTM EBITDA

Acceleration of internal restructuring and

reorganization programme during economic

downturn of 2008-2009 temporarily

depressed Group profitability Acquisition of Lancaster Labs, at

that time the largest acquisition

in the Group’s history

21 acquisitions with total annualized revenue

contribution of over EUR 570m.

Entry into 3 new countries

10 start-ups

55,000m2 of lab surface added

About 60 acquisitions with total annualized

revenue contribution of ca. EUR 700m.

Entry into 5 new countries

30 start-ups

Over 53,000m2 of lab surface added

72

**Average Net Debt: Average of Net Debt at end of current and previous period


Recommended