EURONET WORLDWIDE Financial Results Second Quarter 2017 July 26, 2017 Presenters: Michael J. Brown, Chairman, CEO & President Rick L. Weller, EVP & CFO Jeffrey B. Newman, EVP & General Counsel Kevin J. Caponecchi, EVP & CEO, epay, EFT Asia Pac & Software
Transcript
EURONET WORLDWIDE
Financial Results
Second Quarter 2017
July 26, 2017
Presenters:
Michael J. Brown, Chairman, CEO & President
Rick L. Weller, EVP & CFO
Jeffrey B. Newman, EVP & General Counsel
Kevin J. Caponecchi, EVP & CEO, epay, EFT Asia Pac & Software
Forward Looking Statements
Statements contained in this presentation that concern Euronet's or its management's intentions, expectations, or predictions of future performance, are forward-looking statements. Euronet's actual results may vary materially from those anticipated in such forward-looking statements as a result of a number of factors, including but not limited to: conditions in world financial markets and general economic conditions, including the effects in Europe of the Brexit vote and economic conditions in specific countries or regions; the effects of demonetization in India; technological developments affecting the market for the Company's products and services; foreign currency exchange rate fluctuations; the effects of any breaches in the security of our computer systems or those of our customers or vendors; the Company's ability to renew existing contracts at profitable rates; changes in fees payable for transactions performed for cards bearing international logos or over switching networks such as card transactions on ATMs; changes in the Company's relationship with, or in fees charged by, the Company's business partners; competition; the outcome of claims and other loss contingencies affecting the Company; and changes in laws and regulations affecting the Company's business, including immigration laws. These risks and other risks are described in the Company's filings with the Securities and Exchange Commission, including our Annual Report on Form 10-K, Quarterly Reports on Form 10-Q and Current Reports on Form 8-K. Copies of these filings may be obtained via the SEC's Edgar website or by contacting the Company or the SEC. Any forward-looking statements made in this presentation speak only as of the date of this presentation. Except as required by law, Euronet does not intend to update these forward-looking statements and undertakes no duty to any person to provide any such update under any circumstances. The Company regularly posts important information to the investor relations section of its website.
2
Defined Terms
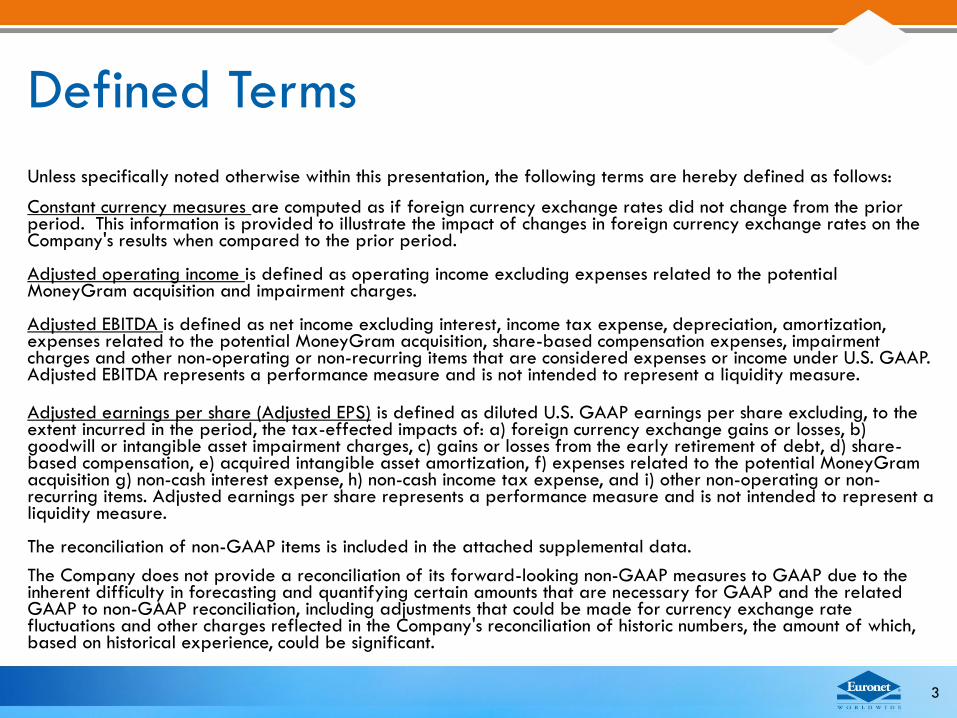
Unless specifically noted otherwise within this presentation, the following terms are hereby defined as follows:
Constant currency measures are computed as if foreign currency exchange rates did not change from the prior period. This information is provided to illustrate the impact of changes in foreign currency exchange rates on the Company's results when compared to the prior period.
Adjusted operating income is defined as operating income excluding expenses related to the potential MoneyGram acquisition and impairment charges.
Adjusted EBITDA is defined as net income excluding interest, income tax expense, depreciation, amortization, expenses related to the potential MoneyGram acquisition, share-based compensation expenses, impairment charges and other non-operating or non-recurring items that are considered expenses or income under U.S. GAAP. Adjusted EBITDA represents a performance measure and is not intended to represent a liquidity measure.
Adjusted earnings per share (Adjusted EPS) is defined as diluted U.S. GAAP earnings per share excluding, to the extent incurred in the period, the tax-effected impacts of: a) foreign currency exchange gains or losses, b) goodwill or intangible asset impairment charges, c) gains or losses from the early retirement of debt, d) share-based compensation, e) acquired intangible asset amortization, f) expenses related to the potential MoneyGram acquisition g) non-cash interest expense, h) non-cash income tax expense, and i) other non-operating or non-recurring items. Adjusted earnings per share represents a performance measure and is not intended to represent a liquidity measure.
The reconciliation of non-GAAP items is included in the attached supplemental data.
The Company does not provide a reconciliation of its forward-looking non-GAAP measures to GAAP due to the inherent difficulty in forecasting and quantifying certain amounts that are necessary for GAAP and the related GAAP to non-GAAP reconciliation, including adjustments that could be made for currency exchange rate fluctuations and other charges reflected in the Company's reconciliation of historic numbers, the amount of which, based on historical experience, could be significant.
3
FINANCIAL HIGHLIGHTSSECOND QUARTER 2017Rick L. WellerExecutive Vice President & CFO
• Revenue - $164.1 million• 2% increase from $160.7 million for Q2 2016
• 4% increase on a constant currency basis
• Operating income - $14.8 million• 8% decrease from $16.0 million for Q2 2016
• 4% decrease on a constant currency basis
• Adjusted EBITDA - $17.5 million• 6% decrease from $18.6 million for Q2 2016
• 3% decrease on a constant currency basis
• Transactions – 300 million• 4% decrease from 314 million for Q2 2016
16
epay Segment HighlightsQ2 2017 Growth Drivers
• Launched:
• United States Mobile distribution agreement with Verizon Wireless for independent dealer network
• Italy Expanded distribution of Microsoft Windows and Xbox through existing retailer locations
• Europe Grew antivirus software and Microsoft Office bundle program to key retailers
• Europe Google Play cards and digital codes in five new countries
• Germany Distribution of Amazon digital codes into Postbank and Sparkasse
• Germany First digital kiosk solution at Rewe, a leading supermarket chain
• Signed:
• United States Agreement with virtual reality hardware provider, CEEK VR, to bundle iTunes with hardware purchases
• AU, Brazil & NZ Distribution of new content, Electronic Arts (EA), which will result in distribution of gift cards digital codes to over 10,000 existing retail locations and their online stores
• Australia Distribution of Symantec and Netflix into existing retailer locations
• Poland Distribution Netflix physical cards and digital codes to over 1,000 new retailers
• Europe Distribution agreement with Sony PlayStation to expand into Central and Eastern Euro
• Global Distribution of numerous Xbox game titles
17
MONEY TRANSFER SEGMENT
18
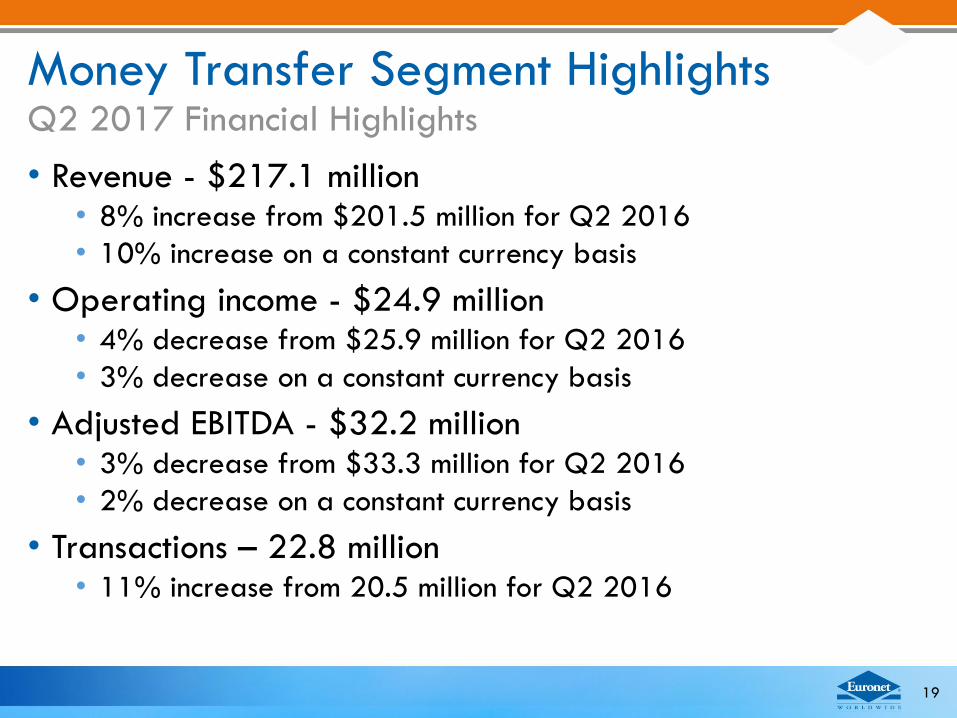
Money Transfer Segment HighlightsQ2 2017 Financial Highlights
• Revenue - $217.1 million• 8% increase from $201.5 million for Q2 2016
• 10% increase on a constant currency basis
• Operating income - $24.9 million• 4% decrease from $25.9 million for Q2 2016
• 3% decrease on a constant currency basis
• Adjusted EBITDA - $32.2 million• 3% decrease from $33.3 million for Q2 2016
• 2% decrease on a constant currency basis
• Transactions – 22.8 million• 11% increase from 20.5 million for Q2 2016
19
Money Transfer Segment HighlightsQ2 2017 Growth Drivers
• Growth in Send & Payout Network, Correspondents and Locations
• Our Network reaches:
• 144 countries
• 324,000 total network locations, a 3% increase vs 2Q 2016
• Correspondent Expansion
• Launched 21 new correspondents in 17 countries
• Signed 14 new correspondent agreements across 13 countries
• Other Business:
• Signed and initiated the launch of direct partnership agreements with Paul Merchants Limited, Weizmann Forex Limited and Transcorp, three of India's leading cash remittance payout agents
• Launched riamoneytransfer.com.au in Australia
20
Summary & Outlook
• Q2 2017 constant currency revenue growth of 15%
• EFT results reflect benefit of the strong ATM deployments from the past several quarters
• epay benefitted from increased sales of non-mobile content
• Money Transfer delivered a strong quarter, implemented the Walmart extension and made investments in our network
• Our balance sheet remains strong with good cash flow generation
• Q3 2017 Adjusted EPS is expected to be approximately $1.60, assuming consistent foreign currency exchange rates
21
Supplemental Data
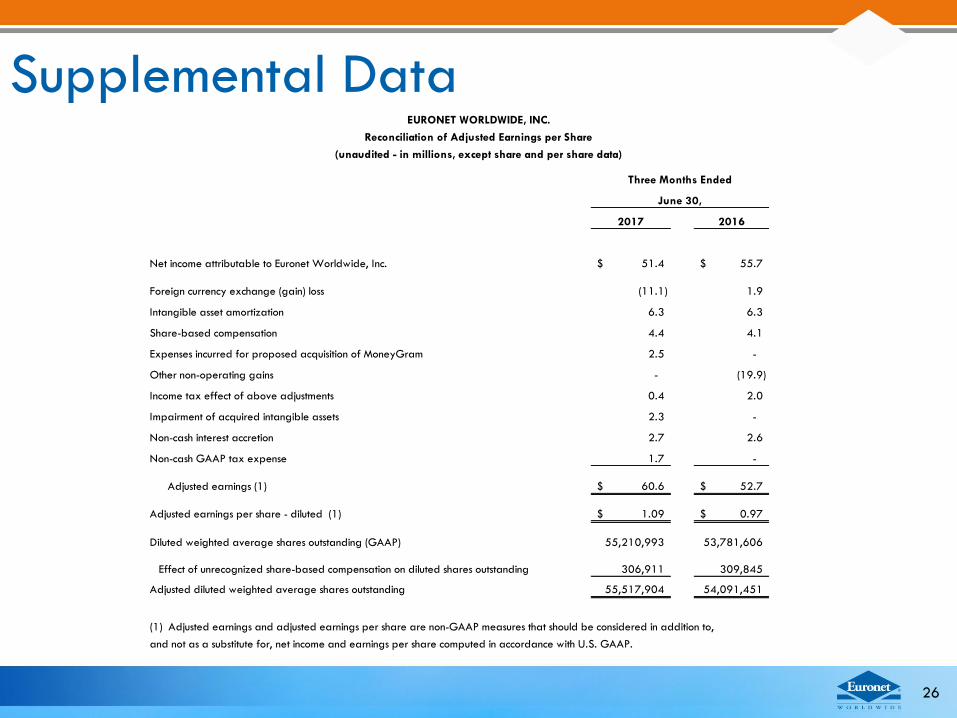
In addition to the results presented in accordance with U.S. GAAP, the Company presents non-GAAP financial measures, such as constant currency, adjusted operating income, adjusted EBITDA and adjusted earnings per share. These measures should be used in addition to, and not a substitute for, revenues, net income, operating income and earnings per share computed in accordance with U.S. GAAP. We believe that these non-GAAP measures provide useful information to investors regarding the Company's performance and overall results of operations. These non-GAAP measures are also an integral part of the Company's internal reporting and performance assessment for executives and senior management. The non-GAAP measures used by the Company may not be comparable to similarly titled non-GAAP measures used by other companies. The attached schedules provide a full reconciliation of these non-GAAP financial measures to their most directly comparable U.S. GAAP financial measure.
22
Supplemental Data
23
EFT Money Corporate
Processing epay Transfer Services Consolidated
Net income 51.4$
Add: Income tax expense 18.6
Less: Total other income, net (3.3)
Operating income (expense) 39.3$ 14.8$ 24.9$ (12.3)$ 66.7
(1) Adjusted operating income excludes impairment charges and costs related to the potential MoneyGram acquisition and is a non-GAAP measure that should
be considered in addition to, and not a substitute for, net income computed in accordance with U.S. GAAP.
EURONET WORLDWIDE, INC.
Reconciliation of Net Income to Adjusted Operating Income (Expense) and Adjusted EBITDA
(unaudited - in millions)
(2) Adjusted EBITDA is a non-GAAP measure that should be considered in addition to and not a substitute for, net income computed in accordance with U.S.
GAAP.
Supplemental Data
24
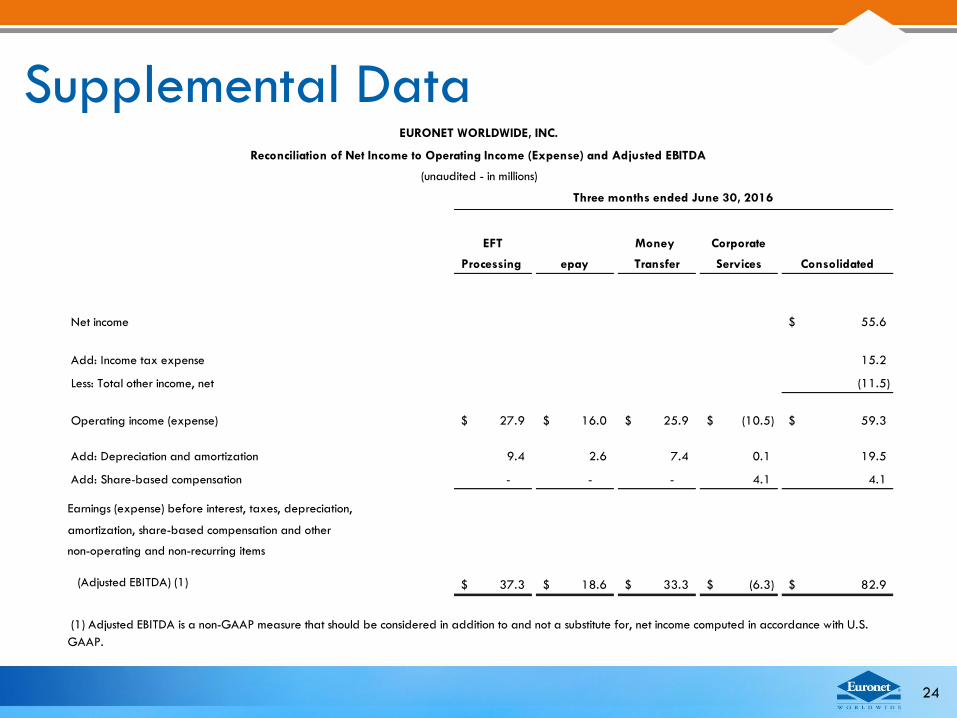
EFT Money Corporate
Processing epay Transfer Services Consolidated
Net income 55.6$
Add: Income tax expense 15.2
Less: Total other income, net (11.5)
Operating income (expense) 27.9$ 16.0$ 25.9$ (10.5)$ 59.3$
Add: Depreciation and amortization 9.4 2.6 7.4 0.1 19.5
Add: Share-based compensation - - - 4.1 4.1
Earnings (expense) before interest, taxes, depreciation,
(1) Adjusted EBITDA is a non-GAAP measure that should be considered in addition to and not a substitute for, net income computed in accordance with U.S.
GAAP.
Three months ended June 30, 2016
EURONET WORLDWIDE, INC.
Reconciliation of Net Income to Operating Income (Expense) and Adjusted EBITDA