Glaciers of GLACIERS OF THE ALPS THE AUSTRIAN ALPS By HELMUT ROTT THE SWISS ALPS By KARL E. SCHERLER THE FRENCH ALPS By LOUIS REYNAUD THE ITALIAN ALPS By ROSSANA SERANDREI BARBER0 and GIORGIO ZANON SATELLITE IMAGE ATLAS O F GLACIERS OF THE WORLD Edited by RICHARD S. WILLIAMS, Jr., and JANE G. FERRIGNO U.S. GEOLOGICAL SURVEY PROFESSIONAL PAPER 1386 - E - 1 The Alps of Austria, Switzerland, France, and have a total area covered by glaciers of 542, 1,342, 350, and 608 square kilometers , respectively
Transcript
Glaciers of
GLACIERS OF THE ALPS
THE AUSTRIAN ALPS By HELMUT ROTT
THE SWISS ALPS By KARL E. SCHERLER
THE FRENCH ALPS By LOUIS REYNAUD
THE ITALIAN ALPS By ROSSANA SERANDREI BARBER0 and GIORGIO ZANON
SATELLITE IMAGE ATLAS OF GLACIERS OF THE WORLD
Edited by RICHARD S. WILLIAMS, Jr., and JANE G. FERRIGNO
U . S . GEOLOGICAL SURVEY PROFESSIONAL PAPER 1386-E-1
The A l p s of A u s t r i a , S w i t z e r l a n d , F r a n c e , and have a t o t a l a r e a c o v e r e d b y g l a c i e r s of 5 4 2 , 1 , 3 4 2 , 350 , and 608 square k i l ome te r s , r e s p e c t i v e l y
CONTENTS III
IV CONTENTS
CONTENTS V
SATELLITE IMAGE ATLAS OF GLACIERS OF THE WORLD
GLACIERS OF
GLACIERS OF THE ALPS
Introduction
The Alps are a complex system of mountain ranges south-central Europe that extend about 1,000 k m in a crescent shape along Italy’s common border with Yugoslavia, Austria, Switzerland, and France. The southern flank of the Alpine chain is subdivided by Italian geographers into the Western, Central, and Eastern Alps. Other scientists, especially those from the regions along the northern slope of the Alps, subdivide the system into the Western and Eastern Alps by an imaginary line following the Rhine River from (Lake of Constance) to Lake Como.
The Alps have summit elevations that reach a maximum of more than 4,800 m, as on Mont Blanc. The major glacierized areas are situated along the crest of the mountain chain. The largest glaciers are often at the highest elevations, especially where comparatively level areas exist above the snowline. Numerous smaller glaciers are, however, scattered throughout the Alps.
Far fewer glaciers are found on the southern flanks than on the northern slopes of the Alps because of seasonal weather patterns and greater intensity of solar radiation on the south. Humid, moisture-laden winds tend to blow from westerly and northwesterly directions in the winter. More southerly winds predominate in the spring and autumn. Southward-facing slopes receive greater amounts of solar radiation throughout the year. Orographic effects complicate the situation. More precipitation falls in the external ranges than in the interior ones because rain shadows related to the prevailing seasonal winds are created by the presence of these outer mountains. The firnline follows the precipitation pattern. The maximum altitude for the firnline is lower in the external, more humid massifs and higher in the interior ranges. Therefore, maximum precipitation on northern slopes, greatest ablation on southern ones, location, of mountain range, and elevation and configuration of the terrain govern the distribution of glaciers throughout the Alps.
The Alps are composed of numerous principal mountain ranges, many subsidiary ranges, and several smaller groups. Several ranges cross international boundary lines and are known by different names in the bordering countries. The massif called Mont Blanc in France is Monte Bianca in Italy, and the chain called Alpi Venoste in Italy becomes Ötztaler in Austria. Sometimes the same name is spelled differ-ently in bordering countries. The Alpes Maritimes in France are the Alpi Marittime in Italy.
In this subchapter, the glaciers of the Alps are discussed geographi-cally by country. To solve the problem that arises because different names describe a single geographic place or feature, an editorial decision was made to use the geographic names approved by the United States Board on Geographic Names for each country in each of the four divisions of the section. The authorities used for reference were the gazetteers approved by the United States Board on Geographic Names, as follows:
GLACIERS OF THE ALPS E l
Austria, Gazetteer No. 66, Switzerland, Preliminary Gazetteer, 1950; France, Gazetteer No. 83, 1964; and Italy and associated areas, Gazetteer No. 23, 1956.
Various terms are used for glaciers throughout the Alps. “Gletscher” is commonly used in the German-speaking region of the Western Alps. In the German-speaking region of the Eastern Alps, “Ferner” and “Kees” are used. “Glacier” is used in the French Alps and “ghiacciaio” in the western Italian Alps. ‘Vedret” or “vedretta” is used in the eastern Italian Alps.
Glaciological studies have been carried out in the Alps since the Some areas have been studied intensively, others only moderately. Early glaciological studies were conducted with and time-intensive fieldwork. Aerial photographic surveys are now commonly used to supplement ground studies. Recently, other remote sensing techniques, such as satellite imagery, have been explored to see what the data can contribute to glaciological studies of the Alps. The four divisions of this section of Chapter E describe some of the applications of Landsat imagery, although constraints imposed by the spatial resolution of the multispectral scanner (MSS) image limit the use of Landsat to the largest glaciers in the Alps.
Landsat imagery of the Alps has been acquired since 1972. Although the Alps are frequently cloud covered, enough Landsat data had been collected by 1982 that the Georg Westermann Company was able to produce an almost cloud-free image mosaic of the entire Alps area by using portions of 50 images. The images selected were acquired during the summer months (June through August), so areas of snow and ice are strikingly evident (fig. 1).
Initially, all the Landsat data were acquired and archived by the United States. Starting in 1975, the European Space Agency’s receiving station in Fucino, Italy, also began acquiring and archiving the data. Landsat images of the Alps are frequently cloud covered, but some optimum imagery has been archived by the United States and is listed in table 1. Also listed are the best images archived by the European Space Agency that are known to the authors or editors. The coverage of the optimum imagery is shown in figure 2.
Figure 7.-Landsat image mosaic of the Alps at 1:3,300,000 scale. The mosaic was pro- duced by the Georg Westermann Company, Braunschweig, Germany. Parts of 50 Land- sat images were used.
E2 SATELLITE IMAGE ATLAS OF GLACIERS OF THE WORLD
GLACIERS OF THE ALPS E3
TABLE l . Optimum Landsat 1, 2, and 3 images of glaciers of the Alps [The Landsat imagery evaluated for this chapter is archived primarily at the EROS Data Center, Sioux Falls, S. Dak. I t is likely that better imagery of this area is archived by the European
Space Agency, but, because of the difficulty determining what imagery is available and evaluating it for glaciological purposes, only those images known to the authors or editors have been listed. Two optimum Landsat thematic mapper images are included at the end of the table to provide better coverage of the glacierized areas of the Eastern Alps]
Nominal Solar scene Landsat e1evation Code Cloud
Path-Row center identification Date angle cover Remarks (lat-long) number (in degrees) (see fig 2) (in percent)
047º20'N. 2231-09142 10 Sep 75 41 20 Hohe Tauern and Dachstein 013º52'E. areas, Austria
211-28 045º55'N. 1078-09555 9 Oct 72 34 Vanoise glaciers and some on the Mont Blanc glaciers; Alpes Grées (Alpi Graie) and Alpes de Savoie, France and Italy
E4 SATELLITE IMAGE ATLAS OF GLACIERS O F THE WORLD
TABLE l.-Optimum Landsat 1, 2, and 3, images of glaciers of the Alps-Continued
Cloud cover Remarks
(in percent)
Solar e1ev a tion
angle (see fig. 2)(in degrees)
CodeLandsat
number
Nominal scene center
(lat-long) identification DatePath-Row
211-29 044°30'N. 9 Oct 72 35 0 Glacierized areas of Grandes 005°33'E. Rousses and Mont Pelvoux are
cloud free; Alpes du Dauphin6
211-29 044°30'N. 3 Oct 75 - 0 The best image of Mont Pelvoux 005°33'E. area, France
Optimum Landsat TM images
047°27'N. - Sep 85 37 0 Zillertalen Alpen, Hohe
193-27 047°27'N. - 30 Sep 85 43 0 Ötztaler and Stubaier Alpen, 012°33'E. Austria
Austria011°00'E.
Figure 2.-Optimum Landsat 1, 2, and 3 images of the glaciers of the Alps. The vertical lines represent nominal paths. The rows (horizontal lines) have been established to indicate the latitude at which the imagery has been acquired.
GLACIERS OF T H E ALPS E5
The Austrian Alps
By Helmut Rott 1
Abstract
An overview is provided on the occurrence of the glaciers in the Eastern Alps of Austria and on the climatic conditions in this area. Historical documents on the glaciers have been available since the Middle Ages. Special glaciological observations and topographic surveys of individual glaciers were initiated as early as 1846. Recent data in an inventory based on aerial photographs taken in 1969 show 925 glaciers in the Austrian Alps with a total area of 542 square kilometers. Present research topics include studies of mass and energy balance, relations of glaciers and climate, physical glaciology, a complete inventory of the glaciers, and testing of remote sensing methods. The location of the glacier areas is shown on Landsat multispectral scanner images; the improved capabilities of the Landsat thematic mapper are illustrated with an example from the Ötztaler Alpen group.
Introduction
A line from (Lake of Constance) along the Rhine River to Lake Como is usually taken as the division between the Eastern and the Western Alps. The main rivers and the major glacierized mountain groups of the Eastern Alps are shown in the sketch map of the region (fig. 3), and total areas for the glacierized regions are listed in table 2. Runoff from the northern region drains to the North Sea through the Rhine River. The eastern regions drain to the Black Sea through the Danube River from its tributaries, the Inn, Salzach, and Drava Rivers. The major glacier areas are distributed along the main east-west ridge of the drainage divide, which is composed of resistant igneous and metamorphic rocks. Summit elevations reach between 3,500 and 3,798 m in the Austrian Alps. The Nördliche Kalkalpen (Northern Calcareous Alps), which extend north of the line along the Inn and Salzach Rivers, reach summit heights just below 3,000 m and contain only a few small glaciers.
Climatic Conditions
The altitude of the equilibrium line (ELA) varies on East Alpine glaciers from about 2,600 to 3,100 m above mean sea level, depending on the geographic location and on slope orientation (Grossand others, 1977). Regional differences in the ELA are primarily related to the precipitation pattern. Orographic effects result in a decrease of precipitation from the northern and southern slopes to the inner Alpine zone. In the central part of the Ötztaler Alpen group, where sheltering is most effective, mean annual precipitation at glacier altitudes is about 1,500 mm. In the Hohe
and Silvretta groups, which receive the majority of their precip-itation from northerly and westerly winds, annual precipitation is about 50 percent higher, and the ELA is 200 to 300 m lower than in the Ötztaler Alpen. An important factor influencing the mass balance of the glaciers is the synoptic weather situation during the ablation period (Hoinkes, 1970).
'University of Innsbruck, Institute for Meteorology and Geophysics, 52, A4020 Innsbruck, Austria.
E6 SATELLITE IMAGE ATLAS OF GLACIERS OF THE WORLD
Occurrence of Glaciers
Recent data on all Austrian glaciers are available in an inventory based on vertical aerial photographs taken in September and October 1969 (Patzelt, 1980). The Austrian Alps comprise 925 glaciers with a total area of 542 km2; 5 glaciers are larger than 10 km2. Current and historic data on the five largest glaciers are summarized in table 3. Twenty-five glaciers are larger than 4 km2, but the majority are smaller than 1 km2.
The largest glaciers cover mountain regions that have comparatively level areas above the snowline. These low-relief areas in the highlands
GLACIERS OF THE ALPS E7
TABLE 3.-The largest glaciers of the Austrian Alps [For 1969: I, area of the main glacier; II, area including tributary glaciers separated since 1850; -,no available data]
Area km2) Altitude (1969) in meters Glacier Mountain 1969 1925 1850 above mean sea level
are considered to be relic landforms from the Miocene Epoch, which ended about 5.3 m.y. ago. The accumulation of ice in these highland areas led to the formation of valley glaciers, with extended firn fields and ice tongues descending into narrow valleys. The maximum glacier length is 9.2 km (Pasterzen Kees in the Hohe Tauern). Many of the small glaciers are cirque, niche, and slope (ice apron) glaciers. A division of the glacier areas according to mountain groups is given in table 2. Several mountain groups containing small glaciers are not listed. Among these are the German Alps along the border with Austria, the largest glacier of which is the Schneeferner (0.4 km2), near the meteorological observatory on the Zugspitze.
Observations and Mapping of Glaciers
HISTORIC STUDIES
East Alpine glaciers are mentioned and described in historic docu-ments dating back to the Middle Ages, with an increasing number of reports beginning about the year 1600, when a major advance of the glaciers occurred. The early documents usually reported observations about individual glaciers, such as the Vernagtferner in the Ötztaler Alpen, the surges of which dammed a lake and caused outburst floods (jökulhlaups) in the years around 1600, 1680, 1773, and 1845 (Hoinkes, 1969). The first comprehensive studies of the East Alpine glaciers became possible with the availability of topographic maps produced from the second topographic survey of Austria, which also included most of the East Alpine glacier regions south of the main drainage divide. Maps at a scale of 1:28,800 were published during the period 1807 to 1834. After 1845, an increasing number of special glaciological observations were carried out, including mapping of individual glaciers and ice-velocity measurements. Some of the earliest observations are attributed to H. and A. Schlagintweit, C. Sonklar, and J. Payer. The first complete inventory of the East Alpine glaciers was published by Richter (1888). It was based on the original 1:25,000-scale maps of the third Austrian topographic survey carried out from 1871 to 1873. During the last two decades of the 19th century, many glacier investigations were initiated, some of which have been continued up to the present. Of special note are the first photogrammetric survey carried out of a glacier (Vernagtferner, Ötztaler Alpen) in 1887 and the drilling operations through Hintereis-ferner (Ötztaler Alpen) in the years between 1899 and 1909.
Historical documents and other published observations reveal similar periods of advance and retreat for East and West Alpine glaciers during the past 400 years. After a glacier maximum in the early 17th century, the glaciers remained in a fairly advanced position, with only small variations for the next 250 years. Most East Alpine glaciers reached another maximum at 1770 to 1780 and again around 1850. Since that time
E8 SATELLITE IMAGE ATLAS OF GLACIERS OF THE WORLD
Figure The Dorferkees (Hohe Tauern group) in 1840 near its maximum extent. Watercolor painting by Thomas Ender, from the Erzherog Johann collection.
Figure The terminus of the Dorferkees on 5 October 1965 from the same point of view as figure 4. The dashed lines mark the gla-cier's extent in 1850. Photograph by Gernot Patzelt.
glaciers receded until about 1965, although the recession has been interrupted by small readvances between 1890 and 1920. In the period 1977 to 1982, between 50 and 70 percent of the approximately 100 Austrian glaciers, which are observed annually, were advancing; the annual average advance amounted only to a few meters. Due to warm summers and reduced snowfall on the glaciers, most of the advances stopped in the mid-1980's. In 1988, about 80 percent of the Austrian glaciers retreated.
Figures 4 and 5 exemplify historical glacier variation. Figure 4 shows a painting by Thomas Ender of the Dorferkees (Hohe Tauern) in 1840 near its maximum extent. The detail shown on the glacier is most remarkable. A modern photograph taken on 5 October 1965 (fig. 5) shows the glacier from nearly the same position. It documents a 2.5-km
GLACIERS OF THE ALPS E9
retreat of the glacier terminus (Patzelt, 1973) when compared with Ender's painting. The glacier area has decreased from a maximum of 6.9 km2 in the 19th century to 4.6 in 1969.
MODERN STUDIES
A complete bibliography of the Austrian glaciers with more than 1,600 citations has been compiled for the Austrian glacier inventory (Patzelt, 1980). The inventory of all Austrian glaciers is based on a special aerial photographic survey conducted at the end of the ablation period in 1969, from which maps at scales of 1:10,000 to 1:15,000 were produced. The areas and altitude distributions of existing glaciers were mapped; in addition, the areas of the 1850 stage and, where possible, of the 1920 stage were evaluated from the positions of the moraines. The loss of total glacier area within Austria since the 1850 stage amounted to 40 percent, with 542 km2 remaining in 1969 (Patzelt and Gross, personal commun.).
Many subjects of glaciological research have been investigated on East Alpine glaciers in the last decades. In Austria, glaciological research is conducted by a number of institutes, several of which are located at the University of Innsbruck. Several institutes in Germany, especially the Commission on Glaciology of the Bavarian Academy of Sciences, carry out investigations on the German glaciers and on a number of Austrian glaciers. The annual mass balance is investigated on several East Alpine glaciers. A long, continuous series of observations using the direct glaciological method, based on actual field measurements of the glacier, is available for Hintereisferner (since 1952-53) and Vernagtferner in the Ötztaler Alpen. Figure 6 shows the annual specific mass balance of Hintereisferner for the budget years 1952-53 to 1988-89 together with data on the ELA (Kuhn, 1981; Kuhn and others, 1985). The close relationship between ELA and mass balance is of particular interest for remote-sensing applications, as was discussed by Østrem (1975). Recent investigations are concerned with the development of remote-sensing methods for glacier studies. Airborne surveys with multispectral scan- ners (MSS) and synthetic aperture radar (SAR) have been carried out over glaciers in the Ötztaler Alpen (Rott and Domik, 1984; Rott and others, 1985).
Figure Mean specific mass balance and mean altitude of the equilibrium line of Hin- tereisferner (Ötztaler Alpen) from the budget years 1952-53 to 1988-89.
E10 SATELLITE IMAGE ATLAS OF GLACIERS OF THE WORLD
Satellite Imagery
Figure 7.- Part of Land- sat 2 MSS image of the Eastern Alps taken on 75 August 1980 (band 6; Path 207, Row 27). The num-bers refer to the mountain groups listed in table 2. Landsat image from the European space Frascati, Italy.
Considering the size of the East Alpine glaciers, only high-resolution satellite sensors are of use for glaciological investigations. Sensors having the resolution of the Landsat MSS can be useful for mapping changing phenomena such as the extent of the snow and ice areas on the glaciers (Rott, 1977). Landsat 4 and 5 thematic mapper (TM) and Landsat 3 return beam vidicon (RBV) images have pixel sizes of about 30 m, or nearly 3 times better than the pixel size of Landsat MSS images. Large Format Camera (LFC) photographs have a spatial resolution of 10 m or better. The new generation of sensors on Earth observation satellites or manned spacecraft that have higher surface resolution is useful for updating the inventories of the mountain glaciers and for mapping of snow and ice areas (Rott and Markl, 1989). Vertical aerial photographs are still needed for providing accurate maps of surface topography of the glaciers.
The Landsat MSS image in figure shows a section of the Eastern Alps, from the Bavarian foothills on the north, to the Nordliche Kalkal-pen and the glaciated Central Alps, and to the Alpi Dolomitiche in the south. The image includes the Zillertaler and Hohe groups.
GLACIERS OF THE ALPS El l
Figure 8 provides a view of the Ötztaler Alpen and Stubaier Alpen (table 2). Some scattered convective clouds are visible on both images, but the glacier regions are totally cloud free. In both figures only the lower parts of the glacier tongues are snow free. They cannot be easily distinguished from the surrounding terrain, which has a similar reflectivity in the near infrared. Both images clearly show the dendritic drainage network of the Alpine valleys that was formed by erosion during the Pleistocene Epoch. Figure 9 shows several glaciers of the Ötztaler Alpen group in a Landsat 5 TM image that was acquired on 30 September 1985, at the end of the ablation season. The main glaciers in the image are the Gepatschferner (17.7 km2), the Vernagtferner (9.3 km2), and the Hintereisferner (9.1 km2). Because the mass balances of the glaciers were negative during the balance year 1 October 1984 to 30 September 1985, the equilibrium line was situated above the edge of the firn. The equilibrium line can be determined accurately from the TM image, because the firn from previous years shows significantly lower reflectivity than snow from the 1984435 mass-balance season.
Figure 8.-Enlargement of part of a Landsat 1 M S S image taken on 13 August 1972 band 7; Path 208, Row 27). The numbers refer to the moun-tain groups listed in table 2. Landsat image from the EROS Data Center, U.S. Geological Survey, Sioux Falls, S. Dak.
E12 SATELLITE IMAGE ATLAS OF GLACIERS OF THE WORLD
Figure 9.-Enlargement at approximately 1:250,000 scale of part of a Landsat 5 TM image over the Ötztaler Alpen group taken on 30 September 1985 (bands 1,2,3; Path 193, Row 27). The main glaciers are Gepatsch-ferner, Hintereisferner, and Vernagtferner. Landsat image from the European Space Agency, Frascati, Italy.
Selected References Escher-Vetter, H., 1985, Energy balance calculations from five years'
meteorological records at Vernagtferner, Ötztal Alps: Zeitschrift für Gletscherkunde und Glazialgeologie, v. 21, p. 397402.
Gross, G., 1987, Der Flachenverlust der Gletscher in Österreich 1850-1920-1969 [Areal losses of the glaciers in the Austrian Alps 1850-1920-19693: Zeitschrift ftir Gletscherkunde und Glazialgeolo-gie, v. 23, no. 2, p. 131-141.
Gross, G., Kerschner, H., and Patzelt, G., 1977, Methodische Unter-suchungen über die Schneegrenze in Gletscher-gebieten [Systematic research on the in Alpine glacier regions]: Zeitschrift fir Gletscherkunde und Glazialgeologie, v. 12, no. 2, p. 223-251.
Hoinkes, H., 1969, Surges of the Vernagtferner in the Ötztal Alps since 1599: Canadian Journal of Earth Sciences, v. 6, no. 4, p.
(Østrem, G., 1975, ERTS data in glaciology-An effort to monitor glacier mass balance from satellite imagery: Journal of Glaciology, v. 15, no. 73, p.
Patzelt, G., 1973, Die neuzeitlichen Gletscherschwankungen in der Venedigergruppe [Recent glacier variations in the Venediger-gruppe] (Hohe Ostalpen): Zeitschrift fir Gletscherkunde und Glazialgeologie, v. 9, no. 1-2, p. 5-57. -1980, The Austrian glacier inventory: Status and first results,
in World Glacier Inventory: International Association of Hydro-logical Sciences-Association Internationale des Sciences Hydro-logiques Publication No. 126, p. 181-183.
Richter, E., 1888, Die Gletscher der Ostalpen [The glaciers of the eastern alps]: Engelhorn, Stuttgart, 306 p.
Rott, H., 1977, der Schneeflachen auf Gletschern der Tiroler
studien auf Gletschern. Ergebnisse der Messreihe Hintereisferner (Ötztaler 19531968 [Techniques and feasibility of balance studies of glaciers. Results from measuring Hintereis-ferner (Örztal Alps) 195319681: Zeitschrift firGletscherkunde und Glazialgeologie, v. 6, no. 12, p. 3790.
Kuhn, M., 1981, Climate and glaciers, Sea level, ice, and climatic change: International Association of Hydrological Sciences Publi-
Kuhn, M., Markl, G., Kaser, G., Nickus, U., Obleitner, F., and Schneider, H., 1985, Fluctuations of climate and mass balance: Different responses of two adjacent glaciers: Zeitschrift für Gletscherkunde und Glazialgeologie, v. 21, p.
Oerter, H., Reinwarth, O., Rufli, H., 1982, Core drilling through a temperate Alpine glacier (Vernagtferner, Ötztal Alps) in 1979: Zeitschrift fir Gletscherkunde und Glazialgeologie, v. 18, no. 1, p. 1-11.
glaciers of the central alpine Tyrol using Landsat imageryl: Zeitschrift für Gletscherkunde und Glazialgeologie, v. 12, no. 1,
Rott, H., and Domik, G., 1984, The SAR-580 experiment on snow and glaciers at the Austrian Test Site. Final report of the European SAR-580 Campaign: Ispra, Italy, v. 2 SA/I.04, E2.85.12,
Rott, H., Domik, G., Mätzler, C., and Miller, H., 1985, Towards a SAR system for snow and land ice applications: Proceedings of shop on Thematic Applications of SAR Data, Frascati, Italy, September 1985, ESA SP-287, p. 29-39.
Rott, H., and Markl, G., 1989, Improved snow and glacier monitoring by the Landsat Thematic Mapper: Proceedings of Workshop on Landsat Thematic Mapper Applications, Frascati, Italy, Decem-ber 1987, ESA SP-1102, p. 312.
—1970, Methoden und Mög1ichkeiten von Massenhaus ha1ts- Zentral-alpen aus Landsat-Bildern [Analysis of snow areas on
p. 128.
cation No. 131, p. 320. p.
GLACIERS OF THE ALPS E13
The Swiss Alps
By Karl E. Scherler2
Abstract
According to a glacier inventory published in 1976, which is based on aerial photography of 1973, there are 1,828 glacierunits in the Swiss Alps that cover a total area of 1,342 square kilometers. The Rhonegletscher, currently the ninth largest in the country, was one of the fist to be studied in detail. Its surface has been surveyed repeatedly; velocity profiles were measured, and the fluctuations of its terminus were mapped and recorded from 1874 to 1914. Recent research on the glacier has included climatological, hydrological, and mass-balance studies. Glaciological research has been conducted on various other glaciers in Switzerland concerning glacier hydrology, glacier hazards, fluctuations of glacier termini, ice mechanics, ice cores, and mass balance. Good maps are available showing the extent of glaciers from the latter decades of the 19th century. More recently, the entire country has been mapped at scales of 1:25,000, 1:50,000, 1:100,000, 1:200,000, and 1:500,000. The 1:25,000-scale series very accurately represents the glaciers as well as locates supraglacial morainic debris and crevasses. The maps are revised every 6 years by use of aerial photogrammetric methods. The possibility of producing a glacier inventory by combining the topographic maps with digital and visual data is discussed.
Introduction
The Swiss Alpine mountain system, which encompasses two-thirds of the country, is divided into northern and southern chains by the deep west-southwest-east-northeast-trending tectonic trough occupied by the upper courses of the Rhône, Reuss, and Rhine River systems (fig. 10).
Moisture-bearing winds blow mostly from the westerly to northwest- erly directions and produce precipitation on the windward northerly slopes of the northern chains. In spring and autumn, the situation is often reversed, with southerly winds causing heavy precipitation in the south- ern parts of the mountain chains. The large east-west valleys receive the least precipitation, because they are sheltered from both the north and the south. This pattern is especially marked in the Rhône River valley and its tributaries (Valais canton) and in the Engadine Valley of the Inn River.
The largest ice masses occur in the highest chains, the Alpi Berner Alpen, Alpi Lepontine, and Rhätische Alpen (table 4; fig. 10). Numerous smaller glacier units of different types are dispersed through- out the remaining part of the Swiss Alps. According to Muller and others (1976a), 1,828 glacier units cover a total area of 1,342 km2.
The elevations at which glaciers are found closely follow the precipita- tion pattern (Haeberli, 1983a). The median elevations of the glaciers in the dry R h ô n e basin are several hundred meters higher than those on the north slope or those which are exposed to the influence of the cyclonic storms passing south of the Alps (table 4, fig. l0). This difference is shown by Müller and others (1976a) and Muller and Scherler (1980).
Observations of Glaciers
Prior to the 18th century, man's attitude toward high mountains was one of fear and terror. Glaciers were mentioned in tales, when they
2Laboratory of Hydraulics, Hydrology, and Glaciology, Swiss Federal Institute of Technology (ETHZ), CH-8092 Switzerland.
E14 SATELLITE IMAGE ATLAS OF GLACIERS OF THE WORLD
TABLE 4.-The largest glaciers in Switzerland (from Muller and others, 1976a) [Glaciers are shown by number on figure10]
Figure Glacier distribution in Switzerland (after Muller and others, 1976a). Numbers refer to table 4; the location of the four glaciers where continuous mass-balance studies have been conducted is shown as follows: A, Aletschgletscher;B, Griesgletschsr; C, Limmerngletscher; D , Silvrettagletscher.
GLACIERS OF T H E ALPS E15
caused the sudden disappearance of fertile pastures under ice masses as a punishment for the sins committed by the mountain people. Ancient chronicles also told about ice avalanches and lake outbursts. In 1595, an outburst flood from a lake caused by the Giétro Glacier, Pennine Alps, caused 160 deaths; in 1597, an ice-and-snow avalanche from Hohmatten Glacier, Pennine Alps, caused 81 deaths.
Starting with the 18th century, this negative view changed to one of romantic enthusiasm, as is shown in poems by Albrecht von Haller and Jean-Jacques Rousseau. Then scientists turned their attention to glacial phenomena. Names of some of the pioneers in the field of glaciology were Scheuchzer, Venetz, Agassiz, and de Saussure.
The Rhonegletcher was one of the first Swiss glaciers to be observed in detail. Its surface was surveyed repeatedly, velocity profiles were measured, and the fluctuations of its terminus were mapped and recorded. This research was carried out continuously from 1874 to 1914 and published by the Swiss Academy of Sciences (Schweizerische Natur-forschende Gesellschaft, 1916). Since 1880, fluctuations of the termini of a representative number of glaciers have been measured annually and published in the journal (Jahrbuch) of the Swiss Alpine Club (SAC) from 1891 to 1924, and in Die since 1925; Aellen (1985) gives a summary.
A good review of glacier research in Switzerland is given by the Swiss National Tourist Office (1981). During the 19th century, the most important tasks consisted of dealing with hazards related to glacier advances, glacier floods, and ice avalanches (Röthlisberger, 1981) and of starting long-term national as well as international glacier monitoring (Kasser, 1967, 1973; Müller, 1977; Haeberli, 1985; Haeberli and Müller, 1988). In the 20th century, intensive development of hydroelectric power schemes in heavily glacierized areas led to strong interaction between glaciology and hydraulic engineering. In recent years, concern for the quality of the environment has resulted in involvement in various fields of pure and applied ice research. Assessing glacier hazards in densely populated areas remains a task of vital importance (Haeberli, 1983b;
1985; Haeberli and others, 1989). Core drilling in cold firn and ice at 4,450 m above mean sea level on Colle Gnifetti, Monte Rosa, furnishes important information on the development of atmospheric composition (Oeschger and others, 1978; Haeberli and others, 1988; Wagenbach and others, 1988). Subglacial hydraulics and sliding processes at the beds of temperate valley glaciers are also intensely studied (Iken and Bindschad-ler, 1986). Continuous mass-balance measurements are being carried out on the Griesgletscher, Limmerngletscher, Plattalvagletscher, and Sil-vrettagletscher. The mass balance of the Aletschgletscher, the largest glacier in the Alps, is estimated by use of a hydrological model.
Glacier inventories were published by Jegerlehner (1902) and by Muller and others (1976a). The latter was based on aerial photographs taken near the end of the 1973 ablation season (Muller and others, 1976b), while the former consisted of measurements done on the 1:50,000-scale map sheets of the Siegfried Atlas (see following section), showing the state of the glaciers during the last two decades of the 19th century. Because different data bases were used in these two inventories, it is difficult to make comparisons.
Mapping of Glaciers
Topographical surveying of the Swiss Alps was carried out mainly by the Federal Topographical Survey Office, with the notable exception of the Meyer-Weisz Atlas of Switzerland (1796-1802), consisting of 16 sheets at an approximate scale of 1:108,000. During the first decades of
E16 SATELLITE IMAGE ATLAS OF GLACIERS OF THE WORLD
-
the 19th century, the whole country was surveyed under the direction of General G.-H. Dufour. The survey was done at scales of 1:25,000 and 1:50,000, the latter for mountain regions. However, the Dufour Atlas was published at a scale of 1:100,000 only A revised version of the Dufour topographical survey was used as the basis for maps, in the Siegfried Atlas, which was published in the years following 1870 at the larger scales. Therefore, good maps showing the extent of the glaciers in the last decades of the 19th century are available. All of these map sheets are in color, with contour intervals at 30 m (Grob, 1941). These two national atlases showed a remarkable degree of accuracy and were regarded as masterpieces of contemporary cartography at their time of publication.
As early as 1891, the Swiss Alpine Club requested the preparation of a uniform topographic atlas or set of topographic maps of Switzerland. The Siegfried Atlas had the serious disadvantage of using two different scales. In addition, the map sheets showed too strongly the individual mark of the responsible topographer and of the cantonal authorities who granted part of the financial support. Both of these factors influenced the scope and detail of the individual map sheets. A series of precision-leveling surveys, carried out during the period 1903 to 1925, and a new geodetic triangulation survey revealed serious errors both in elevations and positions of mapped features.
Therefore, in 1935, the Federal Assembly passed a-law that was to form the basis of the New Topographical Atlas of Switzerland (Neue Landeskarte der Schweiz, now Landeskarte der Schweiz). The Atlas was published at scales of 1:25,000, 1:50,000, 1:100,000, 1:200,000, and 1:500,000, under the sole responsibility of the Federal Topographical Survey. The last sheet at the scale of was published in 1979. At this scale, the glaciers are represented very accurately. The contour interval for high mountain regions is 20 m. Also shown are moraine cover and major crevasses. The maps are revised every 6years by use of aerial photogrammetric methods. Therefore, the whole of Switzerland is peri-odically covered by high-quality vertical aerial photographs. Muller and others (1976b) provide a list of aerial photographs for all Swiss glaciers.
The Aletschgletscher was mapped at a scale of 1:10,000 by the Federal Topographical Survey and the Laboratory of Hydraulics, Hydrology, and Glaciology in 1957. This special topographic map shows the state of the Aletschgletcher, including detailed information on glaciological features such as crevasses and moraines.
Satellite Imagery
It is by no means easy to find optimum remotely sensed images of Swissglaciers. The same applies to standard vertical aerial photographs. Glaciers should be photographed (or imaged) at the end of the ablation season, which may be any time between the end of August and the early part of October. The optimum time is very dependent on weather conditions, which are highly variable in the Swiss Alps. In addition, at the end of the ablation season, the solar elevation angle is already rather small, so deep shadows are produced on north and northwest slopes as Landsat passes over Switzerland during the morning hours. Thus, identification of the glaciers on the steep north slope of the Alps is difficult (figs. 11and 12).
H.J. Gilgen, in his discussion in “Inventory of Glaciers” (this volume), shows that a preliminary glacier inventory can be prepared of an area on the basis of analysis of Landsat digital data recorded on computer-compatible tapes. So far, no attempt has been made to assess the glacier
GLACIERS OF THE ALPS E17
area of Switzerland from visual analysis of Landsat images. The assess-ment could be made, however, if the excellent maps that are available and enlargements of Landsat MSS images were used. Figures 13 and 14 show that it is possible t o compile a simple glacier inventory on the basis of Landsat images and good topographic maps. The topographic base maps are important in assessing watershed areas and in estimating various altitudes in the regions encompassed by Landsat images.
Figure 11.- Landsat 2 MSS false-color com- posite of the western part of the Swiss Alps on 16 September 1978 (2733349210; path 210, Row 28,. The scale is approxi- mately 1:1.000,000. Landsat image from the
f
European Space Agency, Frascati, Italy.
E18 SATELLITE IMAGE ATLAS OF GLACIERS OF THE WORLD
Figure 12.-Landsat 2 MSS image of the eastern part of the Swiss Alps on 4 Septem-ber 1980 (band 7; Path 209, Row 27). The scale is approximately 1:1,000,000. image from the European Space Agency, Frascati, Italy.
GLACIERS OFTHE ALPS E19
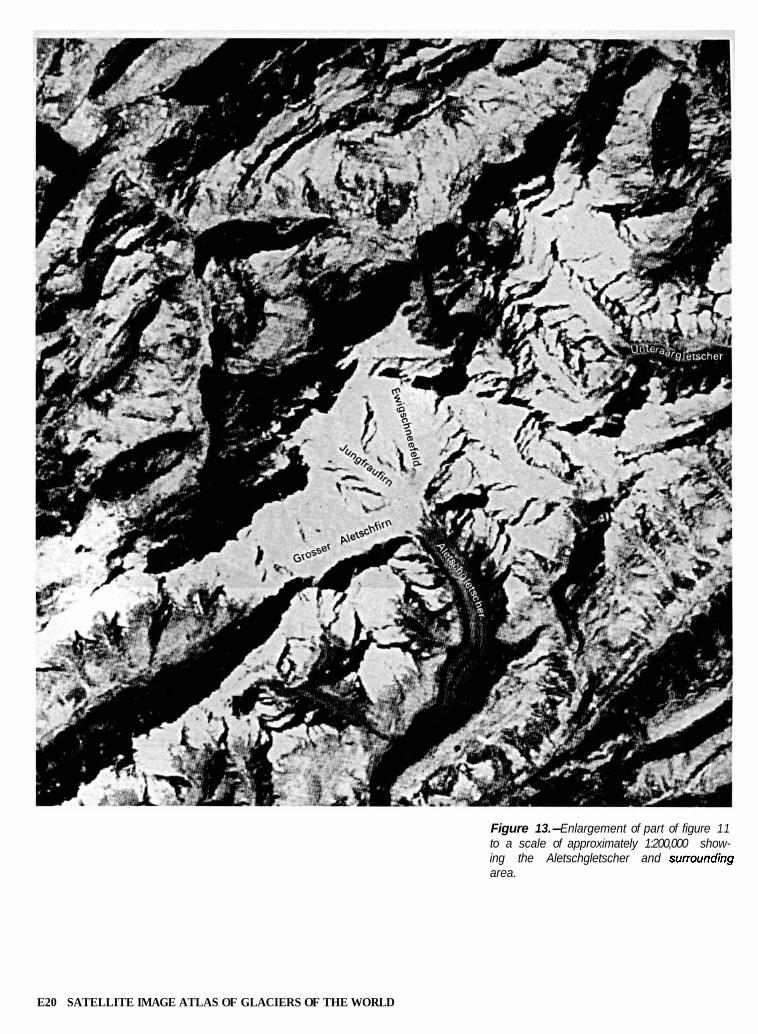
Figure 13.-Enlargement of part of figure 11 to a scale of approximately 1:200,000 show-ing the Aletschgletscher and area.
E20 SATELLITE IMAGE ATLAS OF GLACIERS OF THE WORLD
Figure 14.-A Landeskarte der Schweiz sheet at 1:200,000scale showing the same region as in figure 13. Reproduced permission of the Swiss Topographical Sur-vey, dated 15 January 1982.
GLACIERS OF THE ALPS E21
Jegerlehner, J., 1902, Die Schneegrenze in den Gletschergebieten der Acknowledgment Schweiz [The in the glacier region of Switzerland]: Beitrage zur Geophysik, v. 5, no. 3, p. 486-568.
Kasser, P., compiler, 1967, Fluctuations of glaciers 1959-1965, v. 1:The editors thank Dr. Wilfried Haeber1i, Swiss Fed- Paris, International Association of Scientific Hydrology (IASH)
era1 Institute of Technology, who read the manuscript and United Nations Educational, Scientific, and Cultural Organi-and made valuable contributions. zation (UNESCO), 52 p., with an additional 23 tables, 7 figures,
and 1:25,000-scale photogrammetric map of Aletschgletscher. References Cited 1973, Fluctuations of glaciers 1965-1970, v. 2 Paris, Interna-
tional Association of Hydrological Sciences (IAHS) and United Aellen, M., 1985, Les variations récentes des glaciers des Alpes Suisses Nations, Educational, Scientific, and Cultural Organization
[Recent variations of glaciers of the Swiss Alps]: Geografia Fisica (UNESCO), 357 p., with 5 special topographic maps of glaciers. e Dinamica Quaternaria, v. 8, no. 2, p. 73-82. Muller, F., 1977, Fluctuations of glaciers v. 3 Paris,
Alean, J., 1985, Ice avalanches: Some empirical information about their national Association of Hydrological Sciences (IAHS) and United formation and reach: Journal of Glaciology, v. 31, no. 109, Nations Educational, Scientific, and Cultural Organization p. 324-333. (UNESCO), 269 p., with 12 special topographic maps of glaciers.
Grob, R., 1941, Geschichte der Schweizerischen Kartographie [History Muller, F., Caflisch, T., and Muller, G., 1976a, Firn and Eis der of Swiss mapping]: Bern, Kümmerly and Frey, 194 p. Schweizer Alpen [Firn and ice in the Swiss Alps]: Glacier inven-
Haeberli, W., 1983a, Permafrost-glacier relationships in the Swiss tory: Zürich, Geographisches Institut ETH, Publication No. 57, Alps-Today and in the past: Permafrost, Fourth International 174 p. Conference, Fairbanks, Alaska, July 17-22, 1983, Proceedings, -1976b, Firn and Eis der Schweizer Alpen [Firn and ice in the p. 415-420. Swiss Alps]. Photoliste: Zürich, Geographisches Institut ETH,
1983b, Frequency and characteristics of glacier floods in the Publication No. 57a. Swiss Alps: Annals of Glaciology, v. 4, p. 85-90. Muller, F., and Scherler, K., 1980, Some comments on the Swiss
C o m p i l e r , 1985, Fluctuations of glaciers v. 4: Paris, glacier inventory, in World Glacier Inventory Workshop: Interna-International Association of Hydrological Sciences (IAHS) and tional Association of Hydrological Sciences-Association Interna-United Nations Educational, Scientific, and Cultural Organization des Sciences Hydrologiques Publication No. 126, (UNESCO), 265 p., with 13 special topographic maps of glaciers. p. 185-194.
Haeberli, W., Alean, J.-C., Muller, P., and Funk, M., 1989, Assessing Oeschger, H., Schotterer, U., Stauffer, B., Haeberli, W., and Röth-risks from glacier hazards in high mountain regions: Some experi- lisberger, H., 1978, First results from Alpine core drilling ences in the Swiss Alps: Annals of Glaciology, v. 13, p. 96-102. projects: Zeitschrift für Gletscherkunde und Glazialgeologie, v. 13,
Haeberli, W., and Muller, P., compilers, 1988, Fluctuations of glaciers p. 193-208. 1980-1985, v. 5 Zurich, IAHS/UNEP/UNESCO, 288 p., with 13 Röthlisberger, H., 1981, Eislawinen und Ausbrüche von Gletscherseen special topographic maps of glaciers. [Ice avalanches and outbursts from glacier lakes]: Jahrbuch der
Haeberli, W., Schmid, W., and Wagenbach, D., 1988, On the geome- Schweizerischen Naturforschenden Gesellschaft 1978, p. try, flow and age of firn and ice at the Colle Gnifetti core drilling Swiss National Tourist Office, eds., 1981, Switzerland and her glaciers: site (Monte Rosa, Swiss Alps): Zeitschrift für Gletscherkunde und Bern, Kümmerly and Frey, 191 p. Glazialgeologie, v. 24, no. 1, p. 1-19. Schweizerische Naturforschende Gesellschaft, 1916, Vermessungen am
Iken, A., and Bindschadler, R.A., 1986, Combined measurements of Rhonegletscher [Measurements on the R h ô n e Glacier subglacial water pressure and surface velocity of Findelen- 1874-19151: Georg & Co., p. gletscher, Switzerland: Conclusions about drainage system Wagenbach, D., Munnich, K.O., Schotterer, U., and Oeschger, H., and sliding mechanism: Journal of Glaciology, v. 32, no. 110, 1988, "he anthropogenic impact on snow chemistry at Colle p. 101-119. Gnifetti, Swiss Alps: Annals of Glaciology, v. 10, p.
E22 SATELLITE IMAGE ATLAS OF GLACIERS OF THE WORLD
The French Alps
By Louis Reynaud3
Abstract
The glaciers of the French Alps are distributed in four main groups and have a total area of 350 square kilometers. The northernmost group, on the Mont Blanc massif, has a glacier area of 110 square kilometers, which includes Mer de Glace, which, with an area of 40 square kilometers, is the largest glacier in the Western Alps. Farther south, the Massif de la Vanoise contains 130 glaciers that have a total area of square kilometers. The glaciers of the Grandes Rousses massif have a total area of 11 square kilometers. Lastly, the Massif du Pelvoux has a total glacier area of 120 square kilometers. Studies of glacier variations since 1600 A.D. have shown numerous fluctuations in glacier length. The glaciers on Mont Blanc that appear to show similar fluctuations in fact have different individual response times. Mass-balance measurements are presently being carried out on nine glaciers. The measurements on one of these glaciers, Glacier de Saint Sorlin, have been used to validate( a linear statistical model for mass-balance variation. The model seems to give good results when extended over the entire region of French Alpine glaciers. New methods of mass-balance reconstructions by use of a continuity equation are discussed. Current satellite data have limited usefulness for glacier studies in the French Alps, with the exception of the method correlating changes in the elevation of snowline to changes in glacier mass balance.
Introduction
The French part of the Alps constitutes the western face of the chain, spanning the region between Lake Geneva and the Mediterranean Sea (fig. 15).Glaciers are distributed in four main groups north to south over a distance of approximately 250 km (fig. 16 and table 5).
The summit regions in the French massifs are heavily dissected by erosion. At this end of the Alpine mountain chain, changes in elevation are large. In a distance of only 8km from the summit of Mont Blanc to the channel of the Arve River there is 3,800 m of relief. Granite needles overlook deep-walled cirques, but the mean altitude of the massif is not very high. This low mean altitude explains why, although the summits are higher than in the central regions of the Alps, the glacier areas are in fact much smaller. Except for the extensive area of glaciers around the Mont Blanc massif, French glaciers are small or very small in size.
Precipitation in the French Alps is evenly distributed over all months of the year. However, there is a great variation with elevation and exposure. Chamonix, which is at the foot of Mont Blanc and has an elevation of 1,030 m, has 1,020 mm of annual precipitation, and the Col du Midi, at 3,500 m, has 3,100 mm, but near the summit, around 4,300 m, the annual precipitation is lower and reaches only 1,100 mm (Jouzel and others, 1984). At the edge of the Massif du Pelvoux, the valleys at an elevation of 1,000 m receive annually only 600 to 700 mm of precipitation. The precipitation is mostly due to a flow of maritime air from the west (Atlantic Ocean); circulation from the southeast (Mediterranean Sea) is less common. However, changes in the tracks of low-pressure distur-bances during some years further accentuate the north-south differences of the mountain chain.
From Mont Blanc to Mont Pelvoux the snowline on the glaciers is between 2,750 m and 2,950 m, depending upon the exposure (2,800 m on
3 Laboratory of Glaciology, Rue Molière, Domaine Universitaire, B.P. 96, 38402 St.-Martin d'Hères Cedex, France.
GLACIERS O F THE ALPS E23
Figure 15.-Distribution of glaciers in the French Alps compiled from 1:25,000-scale lnstitut Géographique National maps (various dates). Glaciers in the Alpes Cottiennes and Maritimes are not included. Elevations are in meters.
E24 SATELLITE IMAGE ATLAS OF GLACIERS OF THE WORLD
the northerly exposed Mer de Glace and 2,950 m on the Glacier Blanc, which faces south). Mont Blanc (4,807 m) is the only massif that has a large, relatively continuous area of glaciers. Mont Blanc accounts for 110 km2 out of a total glacier area of 350 km2 in the French Alps, and it includes the largest glacier in the Western Alps, the Mer de Glace, which has an area of 40 km2.
To the south of the Mont Blanc massif is the Massif de la Vanoise; its highest elevation is Point de la Grande Casse, at 3,861 m. The massif contains about 130 glaciers that have a total glacierized area of 85 km2.
The glaciers of the Grandes Rousses massif have a total area of 11km2. This massif includes Glacier de Sarennes and Glacier de Saint-Sorlin, which were mapped in detail in 1904.
Lastly, the Massif du Pelvoux, with its highest elevation, Barre des Écrins, at 4,102 m, is the most southerly glacial massif in the Alps (approximately 45° N. lat) and the second largest glacierized area in France at 120 km2. To the south of the Massif du Pelvoux, the mean elevation of the chain declines sharply. Only about 30 small glaciers exist here, and their combined area is 4 km2.
Previous work on glacier inventories of France document the substan- tial reduction in size of the French glaciers. Mougin (1925) published figures for the surface area of alpine glaciers at the end of the last century (1895) based on 1:80,000-scale maps and ground surveys. The areas given were 359 km2 for the Savoie region and 159 km2 for Dauphin6 and Provence, or a total of 518 km2 for the French Alps. Vivian (1975) conducted a systematic inventory between 1967 and 1971 of 919 glaciers of the Western Alps covering a total area of 568 km2, of which 395 km2
were in the French Alps. The inventory was conducted by use of completely revised cartography at 1:20,000 and 1:25,000 scale, fieldwork, and aerial photographic coverage from the Institut Géographique Nation- al's Photothèque.4 An inventory has also been completed for the Tempo-rary Technical Secretariat for the World Glacier Inventory (now part of the World Glacier Monitoring Service) by use of aerial photography and systematic field investigations.
4 Institut Géographique National (IGN) Photothèque is located at 2 Avenue Pasteur, 94160 Saint Mandé, France.
GLACIERS OF THE ALPS E25
'
Satellite Images of Glaciers of the French Alps
Only three Landsat images are required to cover the entire French Alps (see table 1, fig. 2). The Path 211, Row 28 nominal scene covers Mont Blanc and the Massif de la Vanoise; the Path 211, Row 29 nominal scene includes the Alpes du Dauphin6 (Grande Rousses massif and Massif du Pelvoux); and the Path 209, Row 29 nominal scene encompasses the Alpes Maritimes.
The images of the French Alps noted in table 1 were taken in September or October with the Sun at an angle of 35" in elevation and 150" in azimuth, which roughly corresponds to about 0945 hours Univer- sal, or Greenwich Mean Time. These circumstances allow for a good image of glaciers that are oriented to the south or southeast, but many glaciers that are to the north are hidden by shadows cast from the mountains (for example, Les Bossons in the Mont Blanc massif and Glacier Noir in the Massif du Pelvoux). Other glaciers are only partly visible, concealed by the very distinctive shadows of the nearest summits t o the southeast.
Figures 16 and 17 illustrate the main groups of French glaciers shown on figure 15. Figure 17 shows enlarged sections from the two Landsat 1 multispectral scanner (MSS) images mosaicked in figure 16. The Mont Blanc, Grandes Rousses, and Pelvoux areas are practically cloud free, but most of the Vanoise glaciers are hidden by orographic clouds (figs. 16, 17). A light snowfall whitens the summits near the Italian border, to the east. The presence of snow or clouds makes it difficult t o determine the
.areal extent of glaciers in the Alps. Until 1983, no glaciological investigations had been done on the French
Alps by use of satellite data. That is probably because of the recent availability of these data and the fact that the typical kind of information provided by such image data does not compare very well with conven- tional measuring methods that have been developed for these generally small, scattered glaciers and, therefore, does not meet the specific aims of the average glaciologist. In order for one to understand the potential future contribution of the satellite imagery to the glaciology of these areas, a brief historical description of glacier fluctuations and a survey of the objectives and methods of Alpine glaciology are needed.
The History of Glacier Variations in the French Alps
Through previous studies by Mougin (1934), Lliboutry (1964, 1965), and Le Roy Ladurie (1967), variations in the length of Alpine glaciers have been determined, beginning in about the year 1600. Earlier evi- dence is rare, but occasional documentation of previous glacier extent can be found in old books on geographic description and travel (Bourrit, 1787). Some local traditions mention a major glacier recession in the past (Vallot, 1900). The Chamonix glaciers on Mont Blanc reached one maximum position in about 1610, another about 1644, and the last and largest about 1664. The last of these was the greatest known advance in recorded history. After a major retreat there were other maxima in about 1720 and 1776, but the period of largest growth started about 1810 and reached its peak around 1818 to 1822. This peak was followed by a period of great shrinkage (for example, the Mer de Glace retreated 1,500 m), which continued until 1880. Recent information on fluctuations is given by Reynaud (1984).
To the casual observer, the fluctuations of the Mont Blanc glaciers may appear to be exactly synchronous, but annual measurements show that these fluctuations are not. Regular topographic surveys to measure the
mosaic of the French Alps showing the Mont Blanc (A), the Grandes Rousses (C), and the Pelvoux ( D ) areas without clouds; the Vanoise area (B) is obscured by oro-graphic clouds. Landsat images 09555, band 7; 9 October 1972; Path 21 1, Row 28 and band 7; 9 Octo-ber 1972; Path 21 1, Row 229. The scale is approximately 1:1,000,000. Landsat images from the EROS Data Center, U.S. Geological Survey, Sioux Falls, S. Dak.
E26 SATELLITE IMAGE ATLAS OF GLACIERS OF THE WORLD
GLACIERS OF THE ALPS E27
Figure 17.-Enlarged sections of the Land-sat image mosaic of the French Alps (figure 16). The Mont Blanc area (A) and Vanoise area (B) are from Landsat image 09555. The Grandes Rousses area (C) and Pelvoux area (D) are from Landsat image 107849562. On B, the glacier areas are shown in green to avoid confusion with cloudcover.
E28 SATELLITE IMAGE ATLAS OF GLACIERS OF THE WORLD
GLACIERS OF THE ALPS E29
advance of the Alpine glaciers were begun in the late 19th century. Annual measurements for slightly more than a century are now available for four large glaciers on the northern face of Mont Blanc (fig. 18). Three of these glaciers, Les Bossons, Glacier d’Argentière, and Mer de Glace, are in France, and one is in Switzerland, Trient Glacier. The four glaciers show similar fluctuations in length, with advances in 1890, 1920, and 1970 that alternate with recessions, including the period from 1940 to 1950, when there was a major retreat affecting all the glaciers in the Alps. Upon closer examination, these variations are not as close together as they first appear, because a time delay occurs between maxima on different glaciers. The starting dates of advance of the terminus during the three periods of expansion provide a more precise reference that can be plotted as shown in the lower part of figure 18. For each period, each of the glaciers has its own distinctive response time; Les Bossons reacts first, then Glacier d’Argentière and the Trient Glacier 4 to 7 years later, and the Mer de Glace is last, 11 to 15 years later.
Les Bossons is the only one whose terminus variation reflects small fluctuations which do not appear on longer glaciers (for example, the advances of Les Bossons in 1940) but which were also apparent on smaller glaciers in the French Alps. The length variations of the four Mont Blanc glaciers cannot therefore be taken to fully represent the fluctuation of the French Alpine glaciers, because the individual response time differs for each glacier. Nevertheless, the other glaciers do generally follow the fluctuations of Les Bossons, and even those of Glacier Blanc, the most southerly glacier studied in France.
What- causes these fluctuations in glacier length? If the rate of nourishment is the cause, it is necessary to establish this regime for each glacier and learn how it operates over a complete massif.
Mass-Balance Measurements in the French Alps
At present, mass-balance measurements are being taken on nine glaciers in the French Alps (table 6). The only one of these glaciers for which direct measurements are being taken is Glacier de Sarennes on the Grandes Rousses massif, where mass-balance measurements were begun in 1948. This is the longest available series of mass-balance records in the Alps (those for the Aletschgletscher in Switzerland go back to 1923, but an indirect method is used, the hydrological method) and the second longest in all of Europe after the Swedish Storglaciären records, which were started in 1946 (see fig. 1 of “Glaciers of Sweden”).
Glacier de Sarennes is a small cirque glacier that has an area of 0.87 km2 that faces due south between 2,180 m and 3,300 m in altitude. It has been surveyed and photographed yearly since 1949 by the Centre d’Étude du Machinisme Agricole-du Génie Rural des Eaux et Forêts (CEMA-GREF)5 in Grenoble (Valla, 1984), with accumulation and ablation recorded at five fixed points during every glaciological year (October to October) by the Ahlmann method.
the northern end of the same massif (Grande Rousses) is Glacier de -Sorlin, which has an area of 3 km2. I t faces north and extends from
2,650 m to 3,664 m, the altitude of the highest point of the massif. Mass-balance measurements conducted at 32 different points in the ablation zone since 1956 have been used to validate a linear statistical
glaciers on the north side of Mont Blanc from1870 to 1984. The lower portion of the figure plots the starting dates of
5 CEMAGREF is the French National Office of Waters and Forests. Photographic Library established advance of termini during three periods of in The address is Domaine Universitaire, B.P. 76, 38402 St. Martin d’Hères Cedex, France. expansion.
E30 SATELLITE IMAGE ATLAS OF GLACIERS OF THE WORLD
GLACIERS OF THE ALPS E31
This model has been extended to the whole glacier by Vallon and Leiva (1982) and tested on Glacier de Sarennes by using the 32 years of measurements, from 1949 to 1980 (Reynaud, 1983).
This linear statistical model of mass-balance variation has several advantages. First, it allows optimal processing of all the available data, in particular when series of measurements are incomplete (because stakes are missing or mass balance has not been measured for several consecu-tive years). Next, with this model, the annual mass-balance measure-ments can be limited to a few accessible ablation zones, without steep slopes, crevasses, or risk of avalanche, on which a dense network of stakes can be established and monitored yearly. This approach not only makes it easier to monitor a larger number of glaciers that are widely separate geographically (for example, Glacier de Gébroulaz in the Massif de la Vanoise and Glacier Blanc in the Massif du Pelvoux) but also enables mass-balance changes to be measured on large glaciers such as Glacier d’Argentière, Mer de Glace, and Les Bossons, which do not lend themselves very readily to conventional methods.
Lastly, the liner model has made it possible to obtain better objective knowledge of mass-balance variation in space and time on a glacier (Meier and Tangborn, 1965; Reynaud and others, 1986) and has made possible some studies of this variation near the equilibrium line (Hoinkes, 1970; Østrem, 1975). However, the relation obtained for mass balance versus altitude near the equilibrium line is only very roughly linear. The poor concordance is generally blamed on the altitude measurement, which is difficult to obtain. In fact, it must be acknowledged that the mass balance, too, is subject to much greater error than is usually admitted; the deviation the linear model is 20 g/cm2 averaged over 16 years for 32 stakes on the Glacier de Saint-Sorlin and 7 g/cm2 averaged over 31 years for 5 stakes on the Glacier de Sarennes. These deviations should be attributed much more to the nature of the glacier surface than simply to measurement error. In other words, there is inevitable noise in this type of measurement, and our failure to recognize it still prevents us from determining the full significance of the fluctuations of glacier mass balances.
The comparison of mass balances of various alpine glaciers has shown that the linear-balance variation model, extended to a whole region, gives a good account of the balance fluctuations that were measured on 10
E32 SATELLITE IMAGE ATLAS OF GLACIERS OF THE WORLD
glaciers spread along the 500 km of the chain (Reynaud, 1980, 1983; Letréguilly, 1984).
The homogeneity of the balance fluctuations over a large area explains why the length variations seem to be caused by the same major factors in the nourishment. To enlarge the mass-balance series of Glacier de Sarennes, Martin (1978) did a reconstruction in which he used winter precipitations and summer temperatures from Lyon, 100 km from the glacier. This model of the balance fluctuations, which takes into account
percent of the variance for the survey period, gives a reconstruction of accumulated balance variations (Bt) since 1882 (fig. 19).
All the factors that are responsible for the advance around 1890 and 1920 can be found from this analysis, as well as the reason for the large recession beginning in 1940. The value of Bt during the period of 1940 to 1950 is generally 1 m of water less than the mean for the last century. In addition, the last three decades , one can see some readvances around 1950 for the shorter glaciers and 1970 for the larger, although the accumulated balance variation only shows a steady state. This apparent balance is probably because of the reduced extent of the glaciers, for which a balance around the mean constitutes in fact an excess of nourishment. Therefore, the recent readvance of most of the alpine glaciers is caused by a return to conditions common from before 1940. In other words, the glacier is trying to regain the ground lost during the decade 1940 to 1950. Moreover, the less favorable weather pattern since 1977 should produce much larger advances in the near future.
Several additional long series of accumulated balance variations are needed to obtain a good understanding of glacier fluctuation and the climatic significance. Where ground observations in the past are lacking, one has to be satisfied with reconstructions such as those of the Glacier de Sarennes. Nevertheless, such reconstructions must be based on and confirmed by as many data as possible. Such work has been done on a section of the Glacier de Gébroulaz for the period between 1908 and 1950. The area selected is bounded by two cross profiles, where the velocities, levels, and thicknesses are known. Mass balances of this sector were computed by using the continuity equation (Reynaud and others, 1983, 1986). The values obtained in such a manner were compared to the Glacier de Sarennes reconstruction and to the hydrological values from the Aletschgletscher (fig. 20). These various series show a similar main
Figure 19.-Accumulated balance variations (Bt) versus for Glacier de Sarennes. Ground measurements from Valla (1 984); reconstruction of 1882 through 1948 from Martin (1978).
GLACIERS OF THE ALPS E33
Figure 20.-Balance variations (Bt) versus time for Glacier de Gébroulaz from 1908 to 1950 and a comparison of the accumulated variations with the Glacier de Sarennes and Aletschgletscher (from Reynaud and others, 1986). Reproduced by courtesy of the Inter-national Glaciological Society from Journal of Glaciology, v. 32, no. 112, p. 452.
trend as well as accumulated balance variations of the same magnitude. This new way of computing mass balances gives us a means of producing a long series for several glaciers that have been surveyed repetitively on different cross profiles in the past, including a method of testing the accuracy of the reconstruction. In addition, it is a simpler alternative for mass-balance studies, because it only needs a survey of a sector of the glacier, when the bed topography is known.
The primary goal of glaciologists involved in glacier fluctuations is the establishment of an extended time series for many different glaciers in different geographic settings. The usual survey methods, such as direct ground measurements, require expensive equipment and are time con-suming and labor intensive. For these reasons, there is great interest in the information that may be derived by indirect glaciological methods, such as aerial or satellite photogrammetry, and the kind of physical parameters that can be measured.
E34 SATELLITE IMAGE ATLAS OF GLACIERS OF THE WORLD
Aerial and Terrestrial Photogrammetric Surveys in Alpine . Glaciological Studies
Aerial or terrestrial photogrammetry has been increasingly important during the past 30 years. As a result, a large set of aerial photographs is available for the Alpine glaciers. From these surveys, much glaciological information was derived and special analyses were done (Lliboutry and Reynaud, 1981; Vallon and Leiva, 1982). Aerial photogrammetry is very attractive, because it makes possible an instantaneous record of the shape of large surfaces. These data can be stored easily and retrieved for additional processing. Several national glacier services have changed their surveying methods following the recommendations of the first glacier mapping congress in Ottawa in 1965. Unfortunately, this method is very expensive, and, except for determination of area, the accuracy of conventional ground measurements is difficult to match. For example, it is well known that mass balances cannot be determined yearly by aerial photogrammetric methods but have to be spaced out in time, if we are to obtain relatively good precision on volumetric changes. In addition, successive annual aerial photogrammetric surveys do not give accurate surface velocities. Therefore, if the same financial support for glaciolog-ical studies were to be spent only on aerial surveys, there would result not only an information loss but also a hiatus in the extended time series of annual observation of glacier altitude, velocity, and mass-balance variation.
The same is true for satellite images, and, despite their real importance for regions not well mapped glaciologically, the images will not give any better information than aerial photogrammetry. One exception is where application of the linear variation of balance is used to relate the changes in elevation of the to corresponding changes in glacier mass balance (Østrem, 1975). In this case the regional coverage by satellite images could be a significant advantage by allowing spatio-temporal distribution studies of mass balance over wide areas. In the French Alps, however, all but a few glaciers have such a small altitude range that they are entirely within the ablation zone or the accumulation zone, depending on the year.
In conclusion, regions like the French Alps are ill-suited to surveying by satellite sensors, because the glacierized areas are too fragmented and scattered (except in the Mont Blanc massif) and because they have been well studied by detailed ground and aerial methods (in situ measurement and regular aerial photography). However, satellite data may yet become useful for studying these types of glaciers as the quality of data recording and processing improves. In any event, such areas in the Alps are good testing areas for satellite glaciological surveys, because the results of indirect methods can be compared with data the actual terrain.
GLACIERSOFTHE ALPS E35
-
References Cited Bourrit, M.T., 1787, Nouvelle description des Alpes [A new description
of the Alps]: Geneva, Chez Barde, & Comp., 3 v., 838 p. Hoinkes, H., 1970, und Möglichkeiten von Massenhaus-hatstudien auf Gletschern [Techniques and feasibility of mass-balance studies of g1aciers]: Zeitschrift für Gletscherkunde und Glazialgeologie, v. 6, no. 1-2, p. 37-90.
Jouzel, J., and others, 1984, Chronologie d'un carottage de 20 m au col du Dome (Massif du Mt. Blanc) [Chronology of a core sample in the
f
Col du Dome (Mt. Blanc area)]: La Houille Blanche, no. 617, p. 491-497.
Le Roy Ladurie, E., 1967, du climat l'an Mil [History of the climate since the year 10001: Paris, Flammarion, 381 p.
Letréguilly, A., 1984, Bilans de masse des Glaciers Méthodes de mesures et repartition spatio-temporelle [Glacial mass balance of the Alpine glaciers: Methodology and spatio-temporal distribu-
unpublished Third Cycle thesis, University of Grenoble, September 1984.
Lliboutry, L., 1964, Traite de glaciologie [Treatise on glaciology], v. 1: Paris, Masson et Cie, 427 p.
1965, Traite de glaciologie [Treatise on glaciology], v. 2: Paris, Masson et Cie, 611 p.
1974, Multivariate statistical analysis of glacier annual bal-ances: Journal of Glaciology, v. 13, no. 69, p. 371-392.
Lliboutry, L., and Reynaud, L., 1981, Global dynamics of a temperate valley glacier, Mer de Glace, and past velocities deduced from Forbes' bands: Journal of Glaciology, v. 27, no. 96, p. 207-226.
Martin, S., 1978, e t reconstitution de la série de bilans annuels du glacier de Sarennes, sa relation avec les fluctuations du niveau de trois glaciers du massif du Mont-Blanc (Bossons, Argentière, Mer de Glace) [Analysis and reconstitution of the Sarennes Glacier annual mass balances, their relation to the altitude variations of three glaciers of the Mont B1anc massif (Bossons, Argentière, Mer de Glace)]: Zeitschrift Gletscherkunde und Glazialgeologie, v. 13, no. 1-2, p. 127-153.
Meier, M.F., and Tangborn, W.V., 1965, Net budget and flow South Cascade Glacier, Washington: Journal of Glaciology, v. 5, no. 41, p. 547-566.
Mougin, P., 1925, Études glaciologiques, tome 5 [Glaciological studies, v. 51: Paris, Direction des Eaux et du Rural, Imprimerie Nationale.
-1934, Études glaciologiques, tome 7 [Glaciological studies, v. 7]: Paris, Direction des Eaux et du Rural, Imprimerie Nationale.
Østrem, G., 1975, ERTS data in glaciology-An effort to monitor glacier mass balance from satellite imagery: Journal of Glaciology, v. 15, no. 73, p.
Reynaud, L., 1980 Can the linear ba1ance mode1 be extended to the whole Alps?, in World Glacier Inventory: International Associa-tion of Hydrological Sciences-Association International des Sci-ences Hydrologiques (IAHS-AISH) Publication No. 126, p. 273-284.
1983, Recent fluctuations of Alpine glaciers and their meteoro-logical causes: 1880-1980, in Street-Perrot, A., Beran, M., and Ratcliffe, R., eds., Variations in the global water budget: Dordrecht, D. Publishing Company, p. 197-205.
1984, Mesures des fluctuations glaciaires dans les Alpes Françaises: Collecte des données et resultats [Measurements of glacial fluctuations in the French Alps: Collection of data and results]: La Houille Blanche, no. 617, p. 519-525.
Reynaud, L., Vallon, M., Carle, C., 1983, Analyse et synthèse des mesures glaciologiques effectuées sur le glacier de Gébroulaz, massif de la Vanoise [Analysis and synthesis of glaciological measurements made on the Gébroulaz Glacier, Vanoise Travaux scientifiques du Parc National de la Vanoise, v. 13, p. 9-29.
Reynaud, L., Vallon, M., and Letréguilly A., l986, Mass balance measurements: Problems and two new methods of determining variations: Journa1 of Glaciology, v
* 32, no.. 112, p. 446-454.
Valla, F., 1984, Bilan du Glacier de Sarennes: 1948-1983 [Glacial mass balance of Sarennes Glacier: 1948-19831: La Houille Blanche, no. 6/7, p. 526-528.
Vallon, M., and Leiva, J.-C., 1982, Bilans de masse et fluctuations récentes du Glacier de Saint-Sorlin, Alpes Françaises [Mass bal-ance and recent fluctuations of Saint-Sorlin Glacier, French Alps]: Zeitschrift für Gletscherkunde und Glazialgeologie, v. 17, no. 1-2, p. 143-167.
Vallot, J., 1900, Annales de I'Obsevatoire météorologique Mont-Blanc, IV [Annals of the meteorological observatory of Mont-Blanc, IV]: Paris, Steinheil.
Vivian, R., 1975, Les glaciers des Alpes Occidentales [The glaciers of the Western Alps]: Grenoble, Allier, 513 p.
E36 SATELLITE IMAGE ATLAS OF GLACIERS OF THE WORLD
The Italian Alps
By Rossana Serandrei Barbero6 and Giorgio Zanon7
Abstract
Research carried out by Italian glaciologists in support of the World Glacier Inventory project identified approximately 1,400 glaciers in the mountain groups of the Italian Alps. The total surface area of all glaciers, glacierets, and permanent snow fields in Italy with an
of Italian glaciers, which was published in four volumes by the Comitato Glaciologico Italiano of the Consiglio Nazionale delle Ricerche showed a total glacier area of about 540 square kilometers, but this earlier inventory did not include glacierets and snow fields. Italian glaciers are of the mountain type, especially the cirque variety, but alpine-type valley glaciers are frequent, and Scandinavian-type ice fields are also present. Scientific research on the glaciers of Italy began during the first quarter of the 20th century and included four efforts to accurately document the number and areal distribution of Italian glaciers. The most comprehensive was the work completed for the World Glacier Inventory project. The use of Landsat images to delineate glaciers and monitor their fluctuations in the Italian Alps has been limited because of the spatial resolution of the Landsat multispectral scanner sensor and the shadowing of glaciers in the high-relief Alps caused by the solar azimuth and elevation of the Landsat orbit. Nevertheless, digital image processing and enhancement techniques have been successful in the development of an operational tool for monitoring individual glaciers and variation in snow cover. This development is important for calibration of snowmelt models needed for runoff estimates in the production of hydroelectric power in small basins.
Introduction
The southern flank of the Alpine chain is generally subdivided by Italian geographers into the Western, Central, and Eastern Alps. Other scientists, especially those from regions encompassing the northern part of the Alps, only subdivide them into the Western and Eastern Alps. However, because of the arcuate east to west orientation of the Alps (fig. 21) , this subdivision does not affect the distinctive features of its glaciers. It is the location of glaciers within or peripheral to the Alpine chain that is essential because of the strong relationship of glacier size and position to the source and propagation of masses of humid maritime air.
The maximum altitude of the firnline is, as a result, lower on the more external and humid massifs such as the Alpi Dolomitiche (Dolomites) and, to an even greater extent, the Alpi and Alpi Giulie, where it reaches its lowest altitudes in the Italian part of the Alpine chain. The firnline definitely rises in the more interior, drier mountain groups such as the Alpi Venoste, where the internal location is often accompanied by deep longitudinal valleys, frequent katabatic winds (fohn), and a continental-type precipitation regime, characterized by a winter minimum.
Location and Distribution
For the obvious reasons of general exposure and orography, the southern flank of the Alps has far fewer glaciers than the northern flank. The Monte Bianco and Bernina massifs and the Alpi and Alpi
6 National Research Council (CNR), Institute for the Study of the Dynamics of Large Masses, S. Polo 1364, 30125 Venice, Italy.
7 Department of Geography, University of Padua, Via del Santo 26, 35100 Padua, Italy.
GLACIERS OF THE ALPS E37
Venoste demonstrate this point. However, several mountains and ranges show important concentrations of glaciers, such as the Ortles-Cevedale, in the Alpi Retiche, which, according to the “Catasto dei Ghiacciai Italiani” of the Consiglio Nazionale delle Ricerche (1959; 1961a,b; 1962), includes 113 glaciers that have a total surface area of 105 km2, and the Adamello-Presanella area, again in the Alpi Retiche, which has 89 glaciers covering 53 km2.
The range of morphological types of the Italian glaciers is great, although mountain glaciers (especially cirque glaciers) predominate. Numerous alpine-type valley glaciers also are present, and they include some of the largest glaciers in the country. However, rather unusual types may be found, such as the Scandinavian-type ice field, which is found in the central part of the Gruppo del Adamello. The ice field is an almost flat plateau (Pian di Neve) from which outlet glaciers extend. On Monte Bianco, the great Ghiacciaio del Miage (Miage Glacier) has no real accumulation basin; rather, it is fed to a great extent by avalanches (Zanon 1980, 1985). Its tongue, about 10 km long, shows remarkable similarities to the avalanche glaciers of central Asia. Table 7 lists the largest glaciers in Italy.
Porro (1925) was the first scientist to make a systematic identification of the Italian glaciers. Two years later Porro and (1927) prepared a 1:500,000-scale compilation that listed 774 glaciers. As a result of the International Geophysical Year research, the Consiglio Nazionale delle Ricerche (1959; 1962) published a four-volume inventory of the glaciers of Italy (“Catasto dei Ghiacciai Italiani”). The inventory identi-fied, plotted on 1:25,000-scale maps, and described 838 glaciers then existing in Italy and 190 others that had disappeared during the previous 50 years. Glacier distribution by region was as follows: Piedmont (and Valle d’Aosta), 322; Lombardy, 185; Tre Venezie, 330. Of these totals,
Figure 21. -The main glacierized mountain areas in the Italian Alps.
E38 SATELLITE IMAGE ATLAS OF GLACIERS OF THE WORLD
’
534 glaciers belonged to the Po basin, 255 to the Adige basin, and 48 to other basins. It should be noted that the isolated Ghiacciaio di Calderone, not included in the above categories, the southernmost glacier in Europe, lies in the Apennines (Gran Sasso d’Italia) of central Italy (fig. 21).
Between 1980 and 1986, Italian collaboration on the World Glacier Inventory project was concluded with the identification of 1,397 glaciers distributed as follows: Piedmont (and Valle d’Aosta), 531; Lombardy, 305; and Tre Venezie, 560. The total surface area of these glaciers is 608 km2. The large difference in the number of glaciers between the two inventories is almost exclusively because the new World Glacier Inven-tory requires a listing of all permanent snow fields and glacierets in Italy having areas greater than 5 ha. Most of these small snow fields and glacierets were not included in the old “Catasto dei Ghiacciai Italiani.” A revision and updating of the “Catasto dei Ghiacciai Italiani” is expected during the next few years, and the new data collected for the World Glacier Inventory project will be used.
Italian Glaciological Research
Glaciology is a relatively recent science in Italy (Nangeroni, 1964). It was only at the beginning of this century that it found its scientific niche. Glaciology was mainly directed at an evaluation of glacial water reserves, with a view to their possible use for production of hydroelectric energy. The founding in 1914 of the Comitato Glaciologico Italiano (CGI) (still in existence with a head in Turin) provided general coordination and great stimulus to glaciological research, which was aimed not only at descriptive geography but also at the gathering of information from geophysical, hydrological, geomorphological, and topographic view-points. A comprehensive bibliography of the Italian glaciers is included in the first volume of “Catasto dei Ghiacciai Italiani” (Consiglio Nazionale delle Ricerche, 1959).
Ever since its founding, one of the main activities of the CGI has been the monitoring of glacier variation by means of systematic field observa-tions on representative glaciers. This activity began on a regular basis around 1925 and coincided with a renewed though moderate advance of the Italian glaciers after the end of the so-called “Little Ice Age” that had affected the Alpine region for more than 300 years. A very long retreat phase began a few years later and lasted uninterruptedly until the Further advance then began for the Italian glaciers, too, and has recently become more pronounced.
Italian glacier variations were published in the “Bollettino del Comi-tato Glaciologico Italiano” until 1977; after 1977 publication continued in
GLACIERS OF THE ALPS E39
“Geografia Fisica e Dinamica (published in Turin by the CGI). On an international scale, data on Italian glaciers appeared in the various Reports of the Commission on Snow and Ice, International Association of Hydrological Sciences-International Union of Geodesy and Geophysics (IAHS-IUGG). Variations from 1959 to 1965 were edited by P. Kasser (1967) in the first of a series of volumes sponsored by the International Association of Hydrological Sciences and the United Nations Educational, Scientific, and Cultural Organization (UNESCO) entitled “Fluctuations of Glaciers,” a continuation of the earlier interna-tional Reports of the Commission on Snow and Ice. Since 1967, with the creation of the Permanent Service on the Fluctuations of Glaciers (now the World Glacier Monitoring Service), Italian glacier variations have been reported in “Fluctuations of Glaciers” 1965-70 (Kasser, 1973);
(Muller, 1977); 1975-80 (Haeberli, 1985); and (Haeberli and Muller, 1988). These publications also include the results of surveys on the mass balance of the Ghiacciaio di Marmolada (Alpi Dolomitiche) for 1964-65 and 1965-66, and of the Ghiacciaio di Caresèr (Ortles-Cevedale) from to
The Italian glaciers are shown on the official maps of the Istituto Geografico (IGMI) at 1:25,000, 1:100,000, and, more recently,
scales, which are derived from the 1:25,000-scale maps. The cartography at the 1:25,000 and 1:50,000 scales, done from aerial photo-grammetric surveys carried out during the early 1960’s, is of good quality, but the mapping does not yet cover the entire region of the Italian Alps. During the past few years, technical regional maps also have been published at scales of 1:10,000 and 1:5,000; both map scales were produced from aerial photogrammetric surveys. However, they are still not used extensively, and glacier margins are sometimes not well defined because of less than optimum conditions at the time the flights were carried ’out. For some glaciers of particular research interest, special very large-scale terrestrial and aerial photogrammetric surveys were carried out over a period of many years. Examples of products from these surveys are the glacier maps of the Ghiacciai di Lys, Forni, Belvedere (Gruppo del Monte Rosa), and Pian di Neve, and the series of surveys carried out on the Ghiacciai di Caresèr and Marmolada (table 8).
SATELLITE IMAGE ATLAS OF GLACIERS OF THE WORLD
Glacier Surveys by Satellite Remote Sensing
Figure 22.-Landsat 2 MSS image (21333-09210, band 6; September 1978; Path 210, Row 28) showing part of the Monte Bianco (A) and the Monte Rosa (6) mountain groups. Landsat image courtesy of the Swiss Federal Institute of Technology, Zurich. The scale is approximately 1: 1,000,000.
Table 1and figure 2 list the optimum Landsat 1,2, and 3 images of the Alps and show their area of coverage. To cover the entire Italian section of the Alps, eight Landsat MSS images are required. Several images that show a part of the Alps are discussed in this section. A Landsat 2 MSS image (fig. 22) band 6; 16 September 1978; Path 210, Row 28) shows part of the Western Alps, including, among the principal Italian mountain groups, Monte Bianco (A) and Monte Rosa (B). A Landsat 1 MSS false-color composite image 13 August 1972; Path 208, Row 28) shows part of the Central Alps, the Alpi The Badile-Disgrazia (A), Ortles-Cevedale (B), and Adamello-Presanella (C)areas are indicated (fig. 23). Observations by satellite remote sensing were carried out on the first group (Della Ventura and others, 1982, 1983). Mass-balance studies were completed on the second group (Zanon, 1982). A Landsat 1MSS image (band 7; 26 October 1975; Path 207, Row 28) shows the Eastern Alps between the Alpi Venoste and the Alpi
(fig. 24). In each of the illustrations, some of the glacier
GLACIERS OF THE ALPS E41
Figure 23.-Landsat 1 MSS false-color com- posite image 13 August. 1972; Path 208, Row 28) showing part of the central Italian Alps. The Badile-Disgrazia (A), Ortles-Cevedale (B), and Adamello- Presanella (C) mountain groups are shown.
image from the EROS Data Center, US. Geological Survey, Sioux Falls, S. Dak. The scale is approximately 1:1,000,000.
E42 SATELLITE IMAGE ATLAS OF GLACIERS OF THE WORLD
Figure 24. -Landsat 1 MSS image (band 7; 26 October 1975; Path 207, Row 28) show- ing the eastern Italian Alps between the Alpi Venoste and the Alpi Carniche. Landsat image from the European Space Agency, Frascati, The scale is approximately 1:1,000,000.
features are partially obscured by clouds, snow cover, or shadows, but many of the glacier features can be seen clearly.
The high frequency and areal extent of coverage of the Alps by Landsat’ images, which have been acquired of the region since 1972, suggested that, despite the many factors (for example, clouds and snow cover) that decrease the number of usable images, repeated measure-ments of significant glaciological parameters could be made if coupled with traditional field measurements made in the Italian Alps at a few of the glaciers. At the end of the summer the total area of a glacier could be measured; the data would be useful for subsequent areal comparisons and for evaluating the extent of annual surface variations. Measurement of the area of residual snow cover on the glacier at the end of the melt season, could, with the total area of the glacier, produce an estimated Accumulation Area Ratio (AAR) computation.
GLACIERS OF THE ALPS E43
Although visible and near-infrared satellite image data had been used frequently to carry out glaciological studies of large glaciers at high latitudes, and it was established that AAR could be computed from Landsat MSS images on a glacier with an area less than 10 km2
(Salomonson, 1983), the question arose as to whether satellite remote sensing was applicable to glacier dimensions in the Italian Alps, where glacier areas less than 1 km2 are common. Therefore, simple represen-tative models were examined to see if the spatial resolution of Landsat MSS images of the Alps was sufficient to trace the dynamics of the Italian Alpine glaciers. Calculation of the variations in surface area of selected glaciers could then be correlated with fluctuations of their termini (Rabagliati and Serandrei Barbero, 1979). In spite of the small size of the glaciers, calculations of variation in surface area were, in the majority of the cases, able to be determined with the Landsat spatial resolution.
Following a systematic approach (Della Ventura and others, 1981), Della Ventura and others (1983) performed the first extensive glacier survey on Monte Disgrazia. The glaciers investigated, whose surface areas ranged between 0.2 and 2.5 (Consiglio Nazionale delle Ricerche, 1961b), lie in different orientations around Monte Disgrazia, about 100 km north-northeast of Milan, within the drainage system of the Adda, a tributary of the Po.
Landsat MSS images acquired on 13 September 1975 (20234-09320; Path 209, Row 28), 28 August 1978 (21314-09142; Path 209, Row 28), and 4 September 1980 (Path 209, Row 28) were digitally processed through four steps: preprocessing, classification of glacier surfaces, classification of morphological features, and registration. An analysis of the four Landsat MSS bands showed, in accordance with the observations made on the Ghiacciaio di Marmolada in the Alpi Dolomitiche by Pagliari and Zandonella (1982), that MSS band 5 contains the best information about the areal extent of glaciers and that MSS band 7 is optimum for delineating morphological characteristics of the glacier surface (glacier ice, snow, shadowed areas, rocky outcrops, crevasses).
The areal extent of several glaciers, which was obtained through digital image analysis of Landsat MSS images, is shown in table 9. The digital image analysis showed good agreement with traditional field measurements, but the research carried out by Della Ventura and others (1982) determined that the shadow effect caused by the time of the Landsat passage over the Alps at about 0930 hours Greenwich Mean Time caused uncertainty in the identification and analysis of Alpine glaciers that are oriented to the north and northwest. The shadow effect results from the solar azimuth and angle above the horizon in late summer, about 136° and 50°, respectively.
E44 SATELLITE IMAGE ATLAS OF GLACIERS OF THE WORLD
The second area analyzed included the Valle Aurina glaciers (Alpi Noriche); they were specially selected to be representative of glaciers oriented to the northwest on Landsat MSS images. They have areas that range from 0.06 to 1.69 km2 (Provincia di Bolzano, 1983) and lie within the drainage system of the Isarco, a tributary of the Adige. The problem with their delineation on Landsat images was confronted during fieldwork in 1979, 1981, and 1983 (Della Ventura and others, 1987a). Radiance measurements made on the ground at the time of the Landsat satellite overpasses gave indications that led to using MSS band 6 combined with MSS band 5 to differentiate glaciers situated on shadowed slopes from the surrounding land.
Figure 25 is a digitally processed Landsat image that makes three classifications: other, doubtful, and ice/snow. Glaciers can be delineated in this Landsat MSS image (2 September 1980; Path 207, Row 27) as the first step in an interpretation procedure that uses the product of MSS bands 5 and 6. Figure 26 shows how the four separate MSS bands are unable, on the shaded slope, to clearly distinguish glacier ice from the surrounding area. Two other Landsat MSS images were also digitally processed (6 September 1981; Path 207, Row 27; and 9 August 1983; Landsat 4 Path 192, Row 27, approximately equivalent to Landsats 1-3 Path 207, Row
Figure 25. -Digitally processed Landsat 2 MSS image (2 September 1980; Path 207, Row 27) of part of the eastern Italian Alps. The Landsat image makes three classifica-tions: other, doubtful, and ice/snow. This classifying represents the first s tep in the interpretation procedure developed to calcu-late glacier areas. The glaciers are labeled with their catalog reference numbers. The watershed line is superimposed from carto-graphic data. Image processing courtesy of the lstituto di Fisica Cosmica e Tecnologie Relative-CNR, Milan.
GLACIERS OF THE ALPS E45
Figure 27shows the final classification map, in which the snow-covered glacier areas are identified from the digitally processed Landsat MSS image of 9 August 1983 and additional synthesis of MSS bands 5, 6, 7. The complete analysis gave the areas of the glaciers at the end of the summer of 1980, 1981, and 1983, the variations in area between 1980 and 1983, and the AAR (Della Ventura and others,
Figure 26.-Digitally processed Landsat 3 false-color MSS image (6 September 1981; Path Row 27) of part of the eastern Italian Alps. False colors are used in each of the four MSS bands. The glaciers investi- gated are in the Valle Aurina area. The white
In both of the regions investigated, it was possible to duplicate with the areas on the right-hand part of the images correspond to the Austrian glaciers exposed
Landsat images' the measurements made at glacier termini. This capa- to the south and to the southeast. lmagebility perceive, within a given area, fluctuations in all of the existing processing courtesy of the Istituo di Fisica glaciers, even those with movements opposite to those observed on the Cosmica e Tecnologie Relative-CNR, Milan. main glaciers, permits a accurate assessment of glacier variations in a region. An analysis of problems related to the areal dimension and exposure of glaciers being studied permitted the development of a method to automatically delineate Alpine glaciers on Landsat images, in the absence of a digital model. Glacier areas are calculated by evaluating the intensity values on Landsat images combined with validity of observational conditions related to exposure, slope, and surface homoge-
E46 SATELLITE IMAGE ATLAS OF GLACIERS OF THE WORLD
Figure 27. -Digitally processed Landsat 4 image (40389-09272; 9 August 1983; Path 192, Row 27, approximately equivalent to Landsats Path 207, Row 27) of part of the eastern Italian Alps. This final classifica- tion map delineates snow-free and covered glacier areas. Image processing courtesy of the lstituto di Fisica Cosmica e Tecnologie Relative-CNR, Milan.
neity (Della Ventura and others, 1987b). An observational accuracy value is assigned to each glacier by comparing the area recorded in existing glacier catalogs with the area calculated from the digitally processed image (MSS band 5 x MSS band 6). The low-cost methodology permits the calculation of the areas of glaciers and snow-covered regions at different years and thereby makes it possible to estimate the long-term trend of the glacierization of a region.
As an operational tool, this technique of monitoring individual glaciers and snow-covered regions in separate Alpine areas was evaluated for recognition of the extent of snow cover in the upper Piave basin (eastern Italian Alps). These data would be useful in improving models of snow-cover change (Rossi and others, 1986). Landsat images for Path 207, Row 28, which were acquired between August 1983 and July 1984, during both the snow accumulation and snow ablation seasons, were used. The results show that this technique makes possible the calibration of a snowmelt model that can be used to estimate the amount of runoff for the production of hydroelectric power in small basins.
GLACIERS OF THE ALPS E47
References Cited Consiglio Nazionale delle Ricerche, 1959, Catasto dei Ghiacciai Italiani,
Anno Geofisico 1957-1958 [Inventory of Italian glaciers, geophys-ical year Turin, Comitato Glaciologico Italiano, v. 1, 171 p.
—1961a, Catasto dei Ghiacciai Italiani, Anno Geofisico 1957-1958 [Inventory of Italian glaciers, geophysical year 1957-19581: Torino, Comitato Glaciologico Italiano, v. 2, 324 p.
—1961b, Catasto dei Ghiacciai Italiani, Anno Geofisico 1957-1958 [Inventory of Italian glaciers, geophysical year 1957-19581: Torino, Comitato Glaciologico Italiano, v. 3, 389 p.
—1962, Catasto dei Ghiacciai Italiani, Anno Geofisico 1957-1958 [Inventory of Italian glaciers, geophysical year 1957-1958]: Torino, Comitato Glaciologico Italiano, v. 4, 309 p.
—Della Ventura, A,, Mussio, P., Rabagliati, R., Rampini, A,, and Serandrei Barbero, R., 1981, Determination of the spectral signatures of a glacier, in Guyot, G., and Verbrugghe, M., eds., Proceedings of the International Colloquium on Spectral Signa-
of in Remote Sensing: Avignon, Institut National de la Recherche Agronomique, v. 5, p. 477485.
Della Ventura, A., Rabagliati, R., Rampini, A,, and Serandrei hero, R., 1982, Remote sensing observation of glaciers toward their monitoring, in Papers Approved for Presentation at the Sixteenth Symposium on Remote Sensing of Environment: Ann Arbor, Mich., Environmental Research Institute of Michigan, v. 2, p.
Della Ventura, A,, Rampini, A,, Rabagliati, R., and Serandrei Bar-bero, R., 1983, Glacier monitoring by satellite: Il Nuovo Cimento, Serie 1, v. 6C, p, 211-222.
Della Ventura, A,, Rabagliati, R., Rampini, A,, and Serandrei Bar-bero, R., 1987a, L'evoluzione recente del glacialismo in Valle Aurina (Alpi Pusteresi) nelle immagini Landsat MSS [Recent glacial evolution in Valle Aurina (Pusteresi Alps) by Landsat MSS images]: Geografia Fisica e Dinamica Quaternaria, v. 9, no. 1 (1986) p. 3948.
Della Ventura, A,, Rampini, A,, Rabagliati, R., and Serandrei bero, R., 1987b3, Development of a satellite remote sensing nique for the study of Alpine glaciers: International Journal of Remote Sensing, v. 8, no. 2, p.
Haeberli, W., compiler, 1985, Fluctuations of glaciers Paris, International Association of Hydrological Sciences (IAHS) and United Nations Educational, Scientific, and Cultural Organization (UNESCO), v. 4, 265 p., with 13 special topographic maps of glaciers.
Haeberli, W., and Müller, P., compilers, 1988, Fluctuations of glaciers 1980-85 Zurich, Switzerland, International Association of logical Sciences (IAHS), United Nations Environment Programme (UNEP), and United Nations Educational, Scientific, and Cultural Organization (UNESCO), v. 5, 288 p., with 13special topographic maps of glaciers.
Kasser, P., 1967, Fluctuations of glaciers Paris, Interna-tional Association of Scientific Hydrology (IAHS) and United
Nations Educational, Scientific, and Cultural Organization (UNESCO), v. 1, 52 p., with an additional 23 tables, 7 figures, and 1:25,000-scale photogrammetric map of Aletsch-gletscher.
—1973, Fluctuations of glaciers Paris, International Association of Hydrological Sciences (IAHS) and United Nations Educational, Scientific, and Cultural Organization (UNESCO),
2, 357 p., with 5 special topographic maps of glaciers. Müller, F., 1977, Fluctuations of glaciers Paris, Interna-
tional Association of Hydrological Sciences (IAHS) and United fNations Education, Scientific, and Cultural Organization
(UNESCO), v. 3, 269 p., with 12 special topographic maps of glaciers,
Nangeroni, G., 1964, Ghiacciai, nevi e fenomeni periglaciali [Glaciers, snow and periglacial phenomenal, in Un Sessantennio di Ricerca Geografica Italiana: Memorie della Societa Geografica Italiana, v. 26, p.
Pagliari, M., and Zandonella, A,, 1982, Bacino della Marmolada-Analisi multitemporale della copertura nevosa immagini Landsat [Marmolada basin-A multitemporal analysis of the snow cover by Landsat images]: Gargnano, Atti 4° Convegno Società Italiana Telerilevamento.
Porro, C., 1925, Elenco dei Ghiacciai Italiani [List of Italian Glaciers]: Parma, Ufficio Idrografico del Po, 61 p.
Porro, C., and P., 1927, Atlante dei Ghiacciai Italiani [Atlas of Italian Glaciers]: Firenze, Istituto Geografico Militare.
Provincia di Bolzano, 1983, Catasto dei ghiacciai della Provincia di Bolzano [Glacier inventory of the Province of Bolzano): Ufficio Idrografico di Bolzano.
Rabagliati, R., and Serandrei Barbero, R., 1979, Possibilitá di impiego del remote sensing da satellite peril controllo dei ghiacciai [The possible use of satellite remote sensing in the yearly control of glaciers]: Geografia Fisica e Dinamica Quaternaria, v. 2, no. 1, p. 35-40.
Rossi, G., Tomasino, M., Della Ventura, A,, Rampini, A,, Serandrei Barhero, R., and Rabagliati, R., 1986, Landsat registrations for a snowmelt model of the Piave River basin, in Modelling snowmelt-induced processes, Proceedings of the Budapest Symposium, July 1986 International Association of Hydrological Sciences Publica-tion No. 155, p. 215-229.
Salomonson, V.V., 1983, Water resources assessment, snow and ice mapping and monitoring, in Manual of remote sensing: American Society of Photogrammetry, v. 2, p. 15-22.
Zanon, G., 1980, Ghiacciai, neve e valanghe [Glaciers, snow and avalanches], in Associazione dei Geografi Italiani, La Ricerca Geografica in Italia 1960-1980,ASK edizioni: Varese, p.
—1982, Recent glaciological research in the Ortles-Cevedale region (Italian Alps): Geografia Fisica e Dinamica Quaternaria, v. 5, no. 1, p. 7 5 - 8 1 .
—1985, Glaciology, in Gruppo Nazionale CNR Geografia Fisica e Geomorfologia, [Italian research on physical geography and geo-morphology (addendum)]: Bologna, Tecnoprint, p.
E48 SATELLITE IMAGE ATLAS OF GLACIERS OF THE WORLD