Page 1
Venture Capital in Europe & IsraelVenture Investment Data: Fourth Quarter, 2015
Prepared by Gil Dibner
Passo dello Stelvio, Italian-Swiss BorderSecond highest pass in Europe, at 2,757 m (9,045 ft) above sea level blog
Page 2
The data• Around the middle of last year, I decided I wasn’t happy with available data sources on VC
rounds in Europe & Israel, and that I’d need to build my own• The data in this report consists entirely of data I’ve gathered manually based on publically
available, free sources• No paid data sources or API calls were harmed in the making of this dataset, every
investment was manually classified• This allows analysis of some aspects of the data I consider important – aspects that don’t
appear in other data sources• Seed investment is still under-reported, but I got a bit better at capturing it in the fourth
quarter. Rounds smaller than $500K are generally excluded from this analysis• The analysis is limited to ICT categories and excludes life sciences• The analysis excludes Turkey and FSU countries• I’m converting EUR and GBP into USD using monthly average exchange rates
2@gdibnerblog: yankeesabralimey Syndicate for European & Israeli Enterprise Companies
Page 3
Quarterly pace of venture investment• For the first time since I
started collecting data, the total investment amounts in Europe & Israel decreased
• In 4Q15, Europe & Israel saw $2.856 billion flowing into 357 venture transactions
• While the number of accounted and recorded deals continued to rise, the total amount of investment dollars decreased to the lowest quarterly level in 2015, 12% below 3Q15 and just under 1% below 1Q15
3@gdibnerblog: yankeesabralimey Syndicate for European & Israeli Enterprise Companies
1,703 1,916 2,873 3,139 3,248 2,856
122
204
270 271286
357
0
500
1,000
1,500
2,000
2,500
3,000
3,500
0
50
100
150
200
250
300
350
400
Qtr3 Qtr4 Qtr1 Qtr2 Qtr3 Qtr4
2014 2015
Amou
nt in
vest
ed (U
S $M
)
Num
ber
of in
vest
men
ts
VC Investments in Europe & Israel
Invested amount (US $M) Number of investments
Page 4
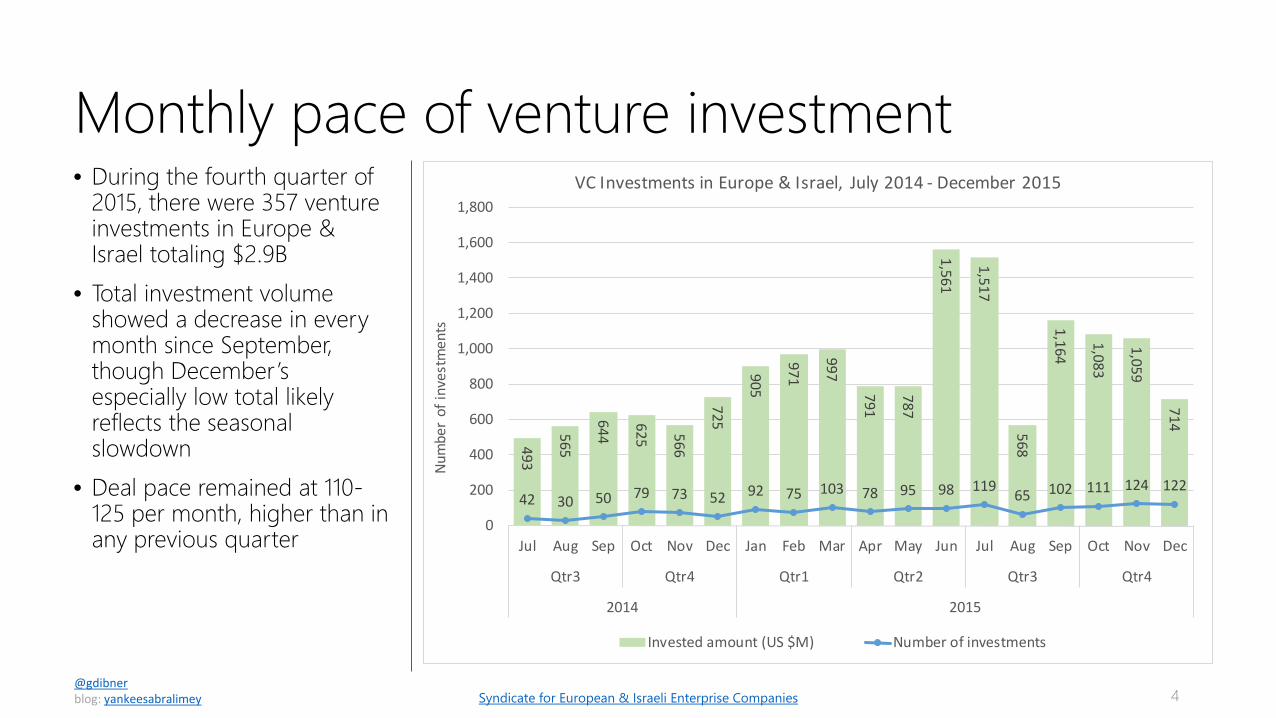
Monthly pace of venture investment• During the fourth quarter of
2015, there were 357 venture investments in Europe &Israel totaling $2.9B
• Total investment volume showed a decrease in every month since September, though December’s especially low total likely reflects the seasonal slowdown
• Deal pace remained at 110-125 per month, higher than in any previous quarter
@gdibnerblog: yankeesabralimey 4Syndicate for European & Israeli Enterprise Companies
493
565
644
625 566
725
905
971
997
791
787
1,561
1,517
568
1,164
1,083
1,059
714
42 30 50 79 73 52 92 75 103 78 95 98 119 65 102 111 124 122
0
200
400
600
800
1,000
1,200
1,400
1,600
1,800
Jul Aug Sep Oct Nov Dec Jan Feb Mar Apr May Jun Jul Aug Sep Oct Nov Dec
Qtr3 Qtr4 Qtr1 Qtr2 Qtr3 Qtr4
2014 2015
Num
ber
of in
vest
men
ts
VC Investments in Europe & Israel, July 2014 - December 2015
Invested amount (US $M) Number of investments
Page 5
Mega-rounds skew the investment totals• This analysis breaks down VC
investments into brackets by size:• Seed (less than $2M)• Early venture ($2-8M)• Venture ($8-20M)• Growth ($20-100M)• Mega ($100M+)
• Three mega-rounds took place in Europe this quarter – all of them consumer-oriented businesses in the UK:
• Karhoo, a UK-based on-demand taxi app, raised $250M in October
• Deliveroo, a UK-based on-demand food delivery service, raised $100M in November
• Atom Bank, a UK-based challenger consumer bank, raised $128M in November
• Adjusting for mega-rounds, 4Q15 shows a decline compared to 3Q, but is the second highest quarter since 3Q14
5@gdibnerblog: yankeesabralimey Syndicate for European & Israeli Enterprise Companies
248 349 285 354 368 507345312 556
716 567559539
935
1,154 8131,513 1,187
0
500
1,000
1,500
2,000
2,500
3,000
3,500
Qtr3 Qtr4 Qtr1 Qtr2 Qtr3 Qtr4
2014 2015
Amou
nt In
vest
ed (U
S $M
)
Pace of VC Investment in Europe and Israel
Mega (>100) Growth (20-100) Venture (8-20) Early Venture (2-8) Seed (.5-2)
Page 6
Strong year-over-year growth• 4Q15 total investment volume
in Europe & Israel was up 48% over 4Q14 (excluding seed deals, where data is more spotty)
• Early venture volume grew by 45%
• Venture volume grew by 79%
• Growth volume grew by 27%
• Mega round volume nearly doubled, growing 91%
6@gdibnerblog: yankeesabralimey Syndicate for European & Israeli Enterprise Companies
349 507
312
559
935
1,187250
478
0
500
1,000
1,500
2,000
2,500
3,000
Qtr4 Qtr4
2014 2015
Tota
l VC
inve
stm
ent (
US $
M)
VC investment volume in Europe and Israel by bracket
Mega (>100) Growth (20-100)Venture (8-20) Early Venture (2-8)
Page 7
Number of investments, by bracket• Excluding seed deals, the
total number of VC investments per quarter was 223 in 4Q15, 24% higher than 3Q15
• All of this growth was in the early venture bracket of rounds under $8M, which grew 49% from 93 in 3Q15 to 139 in 4Q15
• All other categories were roughly flat in 4Q15 compared to 3Q15
7@gdibnerblog: yankeesabralimey Syndicate for European & Israeli Enterprise Companies
6083 77 85 93
13930
26 4262 44
46
13
2633
26 38
35
3
1
6
6 4
3
0
50
100
150
200
250
Qtr3 Qtr4 Qtr1 Qtr2 Qtr3 Qtr4
2014 2015
Num
ber
of V
C in
vest
men
ts
VC investment volume in Europe and Israel by bracket
Mega (>100) Growth (20-100)Venture (8-20) Early Venture (2-8)
Page 8
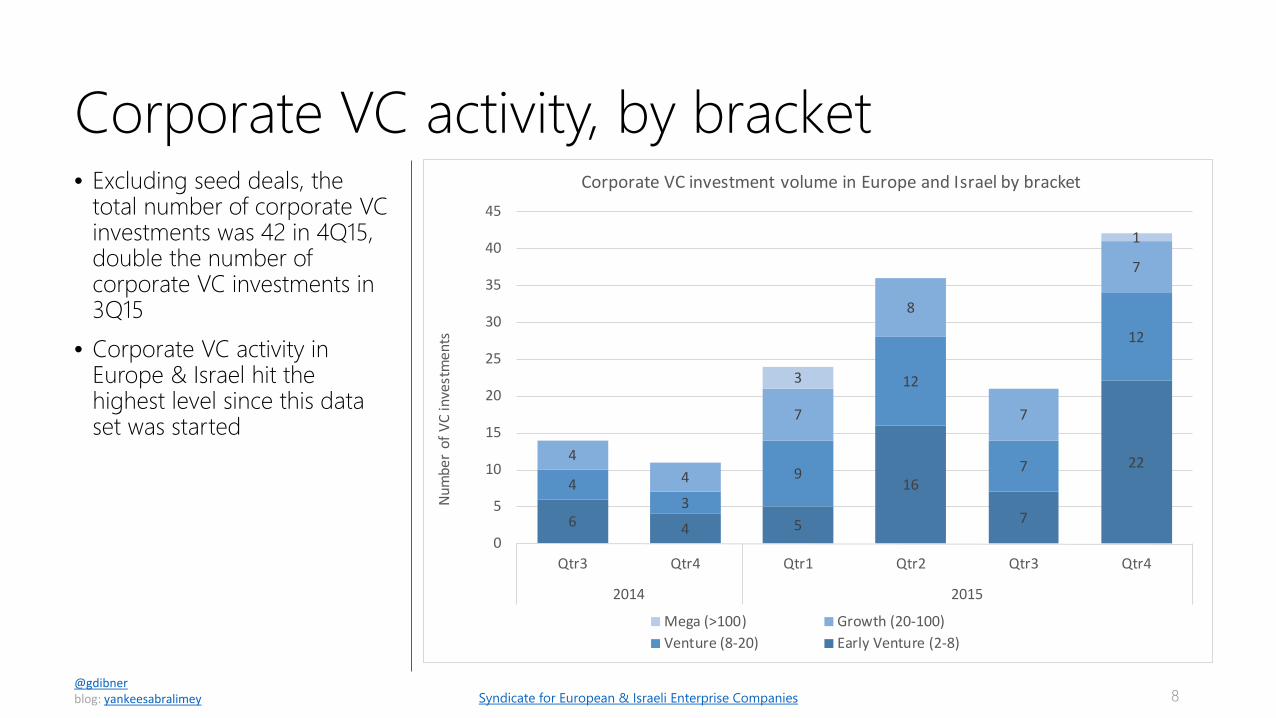
Corporate VC activity, by bracket• Excluding seed deals, the
total number of corporate VC investments was 42 in 4Q15, double the number of corporate VC investments in 3Q15
• Corporate VC activity in Europe & Israel hit the highest level since this data set was started
8@gdibnerblog: yankeesabralimey Syndicate for European & Israeli Enterprise Companies
6 4 5
16
7
224
3
9
12
7
12
44
7
8
7
7
3
1
0
5
10
15
20
25
30
35
40
45
Qtr3 Qtr4 Qtr1 Qtr2 Qtr3 Qtr4
2014 2015
Num
ber
of V
C in
vest
men
ts
Corporate VC investment volume in Europe and Israel by bracket
Mega (>100) Growth (20-100)Venture (8-20) Early Venture (2-8)
Page 9
Corporate VC activity, by country• During the fourth quarter of
2015, Israel saw the highest number of corporate VC investments, with 15
• The UK saw 7 corporate VC investments during that period
• Twelve other countries saw corporate VC activity across Europe, but at much lower levels
9@gdibnerblog: yankeesabralimey Syndicate for European & Israeli Enterprise Companies
10
31 1 1 1 1 1 1 1 1
3
3
1 1 2 11
2
2 1 1
1
1
0
2
4
6
8
10
12
14
16
Israe
l
UK
Fran
ce
Spai
n
Germ
any
Swed
en
Norw
ay
Esto
nia
Finl
and
Switz
erla
nd
Belg
ium
Litua
nia
Aust
ria
Neth
erla
nds
Num
ber
of in
vest
men
ts
Number of corporate VC investments in Europe and Israel by bracket(4Q15)
Mega (>100) Growth (20-100) Venture (8-20) Early Venture (2-8)
Page 10
Average round size• Previously, I presented this broken
down by bracket, but I think the data is more meaningful when taken in aggregate.
• This average excludes seed rounds and mega rounds, so it reflects all rounds done in Europe & Israel between $2M and $100M
• From February to June, average round sizes across all venture rounds were hovering between $10M and $12M
• The third quarter saw consistently higher average round sizes –between $13M and $14.5M on average
• In the fourth quarter, however, the trend reversed itself, with average round sizes dropping to $11M in October, $10.5M in November, and $9.2M in December
10@gdibnerblog: yankeesabralimey Syndicate for European & Israeli Enterprise Companies
11.1
17.6
6.8
11.7 11.3
12.7
15.8
11.211.9
11.110.1
11.4
13.913.2 14.6
11.110.5
9.2
4
6
8
10
12
14
16
18
20
Jul Aug Sep Oct Nov Dec Jan Feb Mar Apr May Jun Jul Aug Sep Oct Nov Dec
Qtr3 Qtr4 Qtr1 Qtr2 Qtr3 Qtr4
2014 2015
Amou
nt In
vest
ed (U
S $M
)
Average investment size in Europe and Israel(Round sizes of 2-100M)
Page 11
Total venture investment by country, 4Q 2015• The UK again took the top
spot in 4Q15 with over $900M in total capital invested
• Israel took second place with just under $700M in venture capital investment
• Germany captured third place, with $341M, and France was a strong fourth place at $225M
11@gdibnerblog: yankeesabralimey Syndicate for European & Israeli Enterprise Companies
922.0699.0
341.1224.7
112.0103.1
90.483.6
53.753.5
41.034.029.5
22.617.5
8.05.05.05.02.72.30.4
UKIsrael
GermanyFrance
SpainDenmark
SwitzerlandSwedenIrelandFinland
BelgiumIceland
LituaniaNetherlands
NorwayEstonia
BucharestAustria
ItalyPortugal
PolandCzech
0 100 200 300 400 500 600 700 800 900 1,000
Total VC investment volume by country, 4Q15 (US $M)
Page 12
Total venture investment by country, 2015• When 2015 is looked at as a
whole, the UK took the top spot, at $3.3B
• Israel came in second with $2.8B
• Germany, France, and Sweden rounded out the top five
• Spain, Denmark, the Netherlands, and Ireland each saw over $200M in VC investment during 2015
12@gdibnerblog: yankeesabralimey Syndicate for European & Israeli Enterprise Companies
3,335.32,786.6
1,921.61,167.9
950.8450.4
264.2242.3236.8
161.9146.0
122.955.142.538.235.635.429.529.324.612.6
UKIsrael
GermanyFrance
SwedenSpain
DenmarkNetherlands
IrelandFinland
SwitzerlandBelgiumEstonia
PortugalNorwayGreeceIceland
LituaniaItaly
PolandSlovenia
0 500 1,000 1,500 2,000 2,500 3,000 3,500 4,000
Total VC investment volume by country, 2015 (US $M)(countries with over $10M in VC investment)
Page 13
Total venture investment by country, 2015(excluding mega rounds)• When mega-rounds
($100M+) are excluded, Israel saw more VC investment than the UK in 2015
• Excluding mega-rounds, Germany was a solid third place with $1.3B raised in 2015, roughly half of Israel’s figure, but nearly twice France, which saw $853M
13@gdibnerblog: yankeesabralimey Syndicate for European & Israeli Enterprise Companies
2,344.62,222.3
1,318.0852.9
424.8350.4
264.2242.3236.8
161.9146.0
122.955.142.538.235.635.429.529.324.612.6
IsraelUK
GermanyFrance
SwedenSpain
DenmarkNetherlands
IrelandFinland
SwitzerlandBelgiumEstonia
PortugalNorwayGreeceIceland
LituaniaItaly
PolandSlovenia
0 500 1,000 1,500 2,000 2,500
Total VC investment volume by country, 2015(Excludes mega-rounds, US $M, countries with over $10M in VC investment)
Page 14
Total venture investment by country, 3Q14 to 3Q15• To get a better sense of VC
volumes in various countries, this analysis excludes mega-rounds
• Investment volumes increase in all of the top five markets
• Of the top five markets, only Israel showed an increase in 4Q compared to 3Q
14@gdibnerblog: yankeesabralimey Syndicate for European & Israeli Enterprise Companies
315
567543
475
628
699
369
267
719
437
621
444
180
284
389
209
379341
29
163118
232279
225
74 12389
112140
84
Qtr3 Qtr4 Qtr1 Qtr2 Qtr3 Qtr40
100
200
300
400
500
600
700
800
Tota
l VC
inve
stm
ent (
US $
M)
Total VC investment, 3Q14 - 4Q15 (top 5 countries, excluding mega-rounds)
IsraelUKGermanyFranceSweden
Page 15
Average venture round sizes, by region• This analysis excludes mega-
rounds and rounds less than $2M
• In 4Q, DACH companies raised the largest rounds on overage
• When we compare 4Q15 to 4Q14, the trend is mixed –round sizes in Israel, DACH, and the Nordics decreased, while other regions saw larger round sizes
• Overall, the trend towards round size convergence seems to be continuing
15@gdibnerblog: yankeesabralimey Syndicate for European & Israeli Enterprise Companies
Benelux, 4.7 Benelux, 4.5
DACH, 14.9
DACH, 12.5
France, 8.2France, 9.2
Iberia, 7.2
Iberia, 9.4
Israel, 15.9
Israel, 11.5Nordic, 11.5
Nordic, 8.0UK & Ireland, 8.5
UK & Ireland, 11.2
0.0
2.0
4.0
6.0
8.0
10.0
12.0
14.0
16.0
18.0
Qtr4 Qtr4
2014 2015
Aver
age
roun
d si
ze (U
S $M
)
Average investment size in Europe and Israel (rounds of $2-100M)
Page 16
Total venture investment by region, 2015• When VC investments across
Europe are aggregated into regions, UK & Ireland, Israel, DACH, the Nordics, and France are the clear and consistent leaders
• Benelux, Iberia, Southern Europe, and Eastern Europe do produce meaningful VC investments, but the volumes are still low
16@gdibnerblog: yankeesabralimey Syndicate for European & Israeli Enterprise Companies
UK & Ireland, 3,572.1, 29%
Israel, 2,786.6, 23%DACH, 2,073.9, 17%
Nordic, 1,541.5, 13%
France, 1,167.9, 10%
Iberia, 493.0, 4%
Benelux, 365.2, 3%
South. Eur., 78.3, 1%
East. Eur., 37.7, 0%
Total VC investment by region, 2015
Page 17
Rounds by bracket & region• To get a better sense of deal
volume, this analysis excludes seed deals which are often poorly reported
• Excluding seed deals, Israel led in the number of announced deals, with 60 investments announced
• The UK & Ireland took second place with 45
• The Nordics took third place with 38, overtaking DACH with 34
17@gdibnerblog: yankeesabralimey Syndicate for European & Israeli Enterprise Companies
3224
29
19 1610 7
1 1
17
11 3
10
2
12
11
76
5
4
2
3
0
10
20
30
40
50
60
70
Israel UK &Ireland
Nordic DACH France Benelux Iberia East. Eur. South. Eur.
Num
ber
of in
vest
men
ts
Number of investments in Europe and Israel by bracket, 4Q 2015
Mega (>100) Growth (20-100) Venture (8-20) Early Venture (2-8)
Page 18
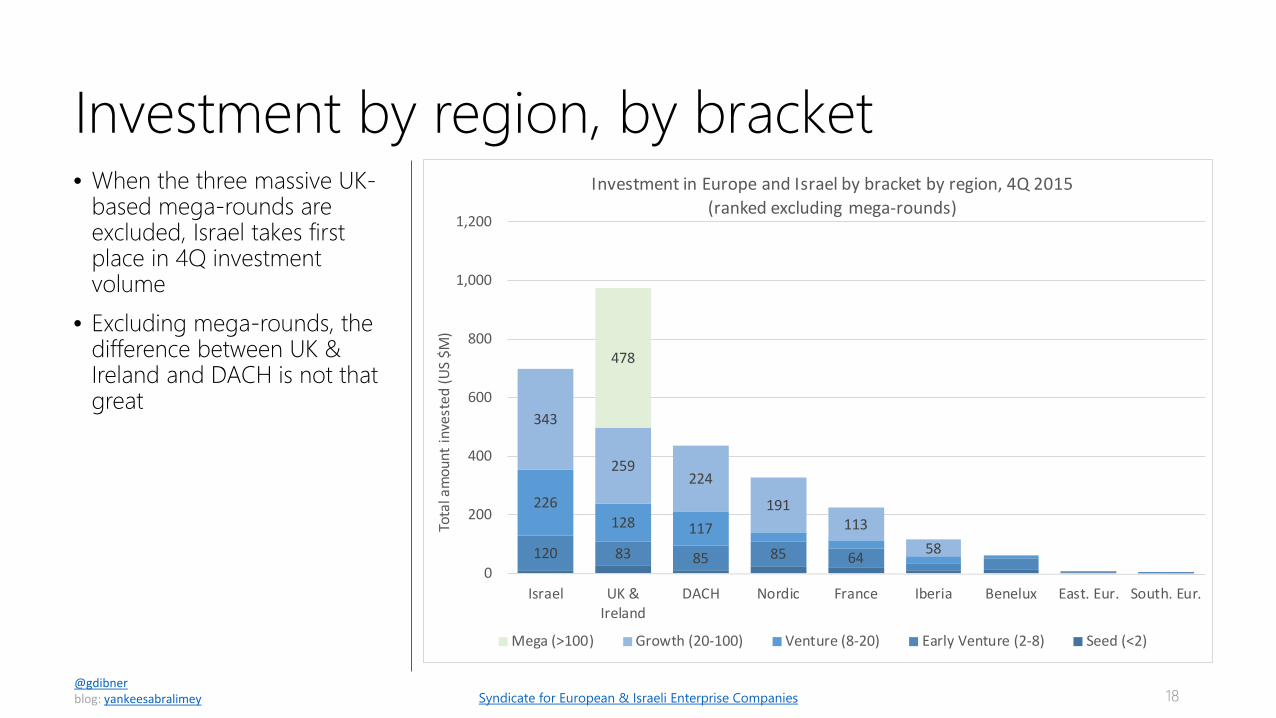
Investment by region, by bracket• When the three massive UK-
based mega-rounds are excluded, Israel takes first place in 4Q investment volume
• Excluding mega-rounds, the difference between UK & Ireland and DACH is not that great
18@gdibnerblog: yankeesabralimey Syndicate for European & Israeli Enterprise Companies
120 83 85 85 64
226128 117
343
259224
191113
58
478
0
200
400
600
800
1,000
1,200
Israel UK &Ireland
DACH Nordic France Iberia Benelux East. Eur. South. Eur.
Tota
l am
ount
inve
sted
(US
$M)
Investment in Europe and Israel by bracket by region, 4Q 2015(ranked excluding mega-rounds)
Mega (>100) Growth (20-100) Venture (8-20) Early Venture (2-8) Seed (<2)
Page 19
Participation rate of US VC firms, by bracket• US VC firms are increasingly
active in the European and Israeli VC markets
• Year to date, US VC firms participated in 14% of the venture rounds in Europe
• US VCs participated in only 5% of seed rounds, 9% of early venture rounds, and 22% of venture rounds
• As a company moves from bracket to bracket, the chance of US VC participation doubles with each bracket change
19@gdibnerblog: yankeesabralimey Syndicate for European & Israeli Enterprise Companies
5% 9%22%
39%
68%
95% 91%78%
61%
32%
0%
10%
20%
30%
40%
50%
60%
70%
80%
90%
100%
Seed (.5-2) Early Venture (2-8) Venture (8-20) Growth (20-100) Mega (>100)
Perc
enta
ge o
f rou
nds
Did US VC firms participate in European VC rounds? (2015)
No Yes
Page 20
Rate of participation by US firms has recovered• US VC firm participation in
European & Israeli venture rounds dropped in 4Q15 to 17%, down from 21% in 3Q
• In fact, 4Q15 saw the lowest US VC participation rate since I started tracking the data in 3Q14
20@gdibnerblog: yankeesabralimey Syndicate for European & Israeli Enterprise Companies
16%24% 20% 22% 21% 17%
84%76% 80% 78% 79% 83%
0%
10%
20%
30%
40%
50%
60%
70%
80%
90%
100%
Qtr3 Qtr4 Qtr1 Qtr2 Qtr3 Qtr4
2014 2015
Perc
enta
ge o
f Rou
nds
Did US VC firms participate in European VC rounds?(Excludes seed rounds, 3Q14-4Q15)
No Yes
Page 21
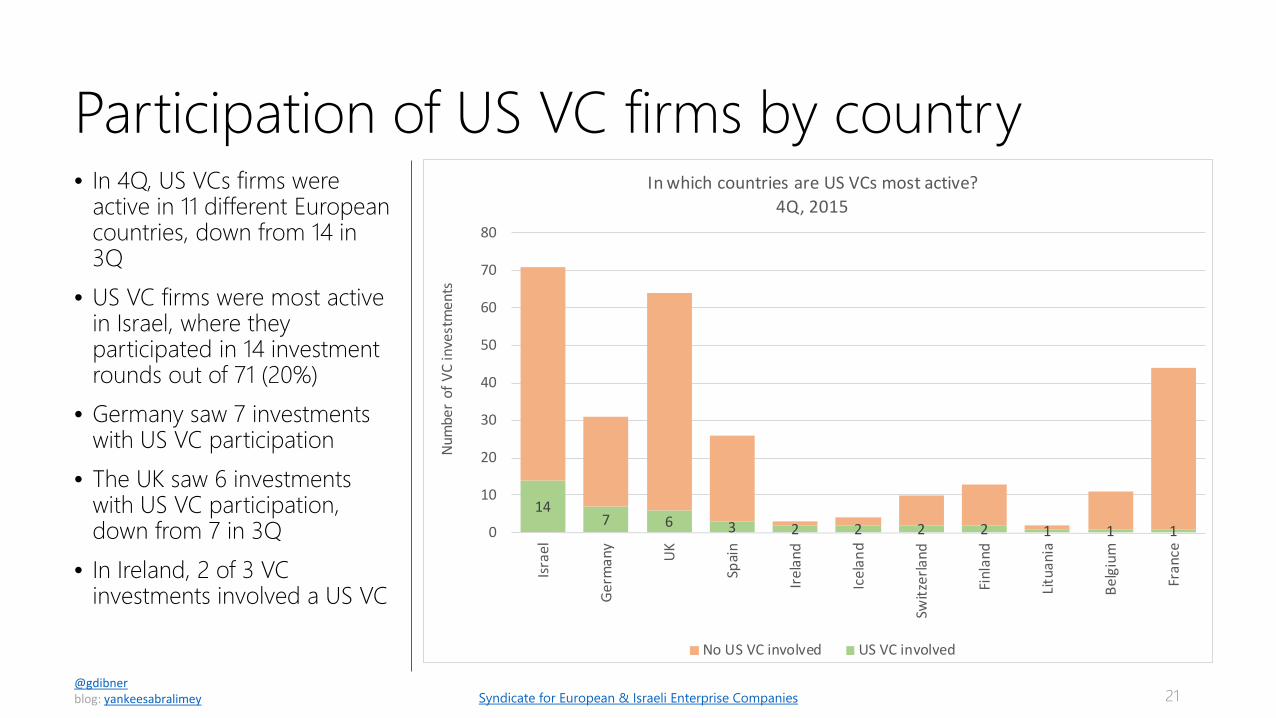
Participation of US VC firms by country• In 4Q, US VCs firms were
active in 11 different European countries, down from 14 in 3Q
• US VC firms were most active in Israel, where they participated in 14 investment rounds out of 71 (20%)
• Germany saw 7 investments with US VC participation
• The UK saw 6 investments with US VC participation, down from 7 in 3Q
• In Ireland, 2 of 3 VC investments involved a US VC
21@gdibnerblog: yankeesabralimey Syndicate for European & Israeli Enterprise Companies
147 6 3 2 2 2 2 1 1 10
10
20
30
40
50
60
70
80
Israe
l
Germ
any
UK
Spai
n
Irela
nd
Icel
and
Switz
erla
nd
Finl
and
Litua
nia
Belg
ium
Fran
ce
Num
ber
of V
C in
vest
men
ts
In which countries are US VCs most active?4Q, 2015
No US VC involved US VC involved
Page 22
Participation of US VC firms by country• This chart shows US VC
activity within Europe throughout 2015
• The bulk of US VC activity is in Israel, the UK & Ireland, DACH, and the Nordics
22@gdibnerblog: yankeesabralimey Syndicate for European & Israeli Enterprise Companies
Israel, 12 Israel, 14 Israel, 14 Israel, 14
UK & Ireland, 10
UK & Ireland, 13UK & Ireland, 9 UK & Ireland, 8
DACH, 8
DACH, 6
DACH, 4DACH, 9
Nordic, 2
Nordic, 3
Nordic, 5
Nordic, 5Iberia, 3
Iberia, 4 Iberia, 3Benelux, 5
France, 3
France, 2East. Eur., 2
South. Eur., 2
0
5
10
15
20
25
30
35
40
45
50
Qtr1 Qtr2 Qtr3 Qtr4
2015
Num
ber
of V
C in
vest
men
ts
Investments with US VC participation, 2015
South. Eur. East. Eur.
France Benelux
Iberia Nordic
DACH UK & Ireland
Israel
Page 23
Dimension Categories Explanation/Example
1. Target market Consumer, SMB, Enterprise, Government, Telecom, OEM
What sort of customer does the company target?
2. Vertical marketAdtech, Communications, Data, Development, Durables, Education, Electronics, Employment, Energy, Fashion, Financial, Food, Gaming, Health, HMI, Industrial, Infrastructure, Lifestyle, Logistics, Marketing, Media, Productivity, Real Estate, Security, Sports, Storage, Transportation, Travel, Water
What type of problem does the company solve?
3. Business modelCommerce, Components, Content, Marketplace, SaaS, Semiconductors, Services, Software, Systems,
How does the company makemoney? What are customers paying for?
Segment descriptor Consumer + Travel + Marketplace AirBnB has built a travel-related marketplace for consumers
Three-dimensional approach to sector mapping
Page 24
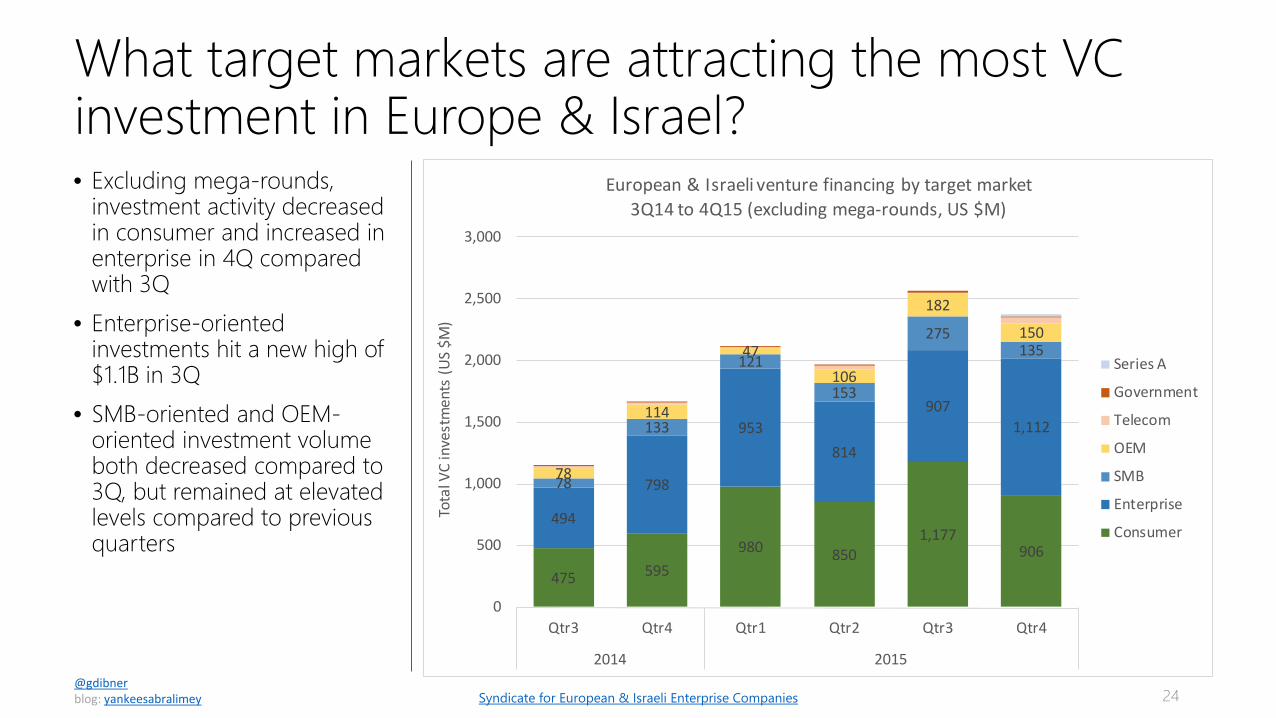
• Excluding mega-rounds, investment activity decreased in consumer and increased in enterprise in 4Q compared with 3Q
• Enterprise-oriented investments hit a new high of $1.1B in 3Q
• SMB-oriented and OEM-oriented investment volume both decreased compared to 3Q, but remained at elevated levels compared to previous quarters
24@gdibnerblog: yankeesabralimey
What target markets are attracting the most VC investment in Europe & Israel?
Syndicate for European & Israeli Enterprise Companies
475 595980 850
1,177906
494
798
953814
9071,112
78
133
121
153
275135
78
114
47106
182
150
0
500
1,000
1,500
2,000
2,500
3,000
Qtr3 Qtr4 Qtr1 Qtr2 Qtr3 Qtr4
2014 2015
Tota
l VC
inve
stm
ents
(US
$M)
European & Israeli venture financing by target market3Q14 to 4Q15 (excluding mega-rounds, US $M)
Series A
Government
Telecom
OEM
SMB
Enterprise
Consumer
Page 25
• When Israel is excluded from the sample, 56% of all VC dollars in Europe went to consumer-oriented companies
• OEM-oriented companies continued to rise slightly in importance, accounting for 5% of all VC dollars in Europe
25@gdibnerblog: yankeesabralimey
Consumer investment leads Europe
Syndicate for European & Israeli Enterprise Companies
62%
36%
56% 63% 62% 56%
18%
49%
34% 22% 24% 32%
6%10% 4% 12% 8% 6%5%4% 2% 4% 5%6%8%
0%
10%
20%
30%
40%
50%
60%
70%
80%
90%
100%
Qtr3 Qtr4 Qtr1 Qtr2 Qtr3 Qtr4
2014 2015
European venture financing by target market3Q14 to 4Q15 (excluding Israel, percent of US $M)
Government Telecom OEM SMB Enterprise Consumer
Page 26
• When the sample set is limited to rounds under $20M, the ratio of consumer to enterprise investments looks a bit more balanced –and steadier over time – but there does seem to be a rising trend in consumer-oriented early-stage investment
26@gdibnerblog: yankeesabralimey
Consumer accounts for half of early rounds
Syndicate for European & Israeli Enterprise Companies
39%50% 46% 41% 46% 50%
41%37% 50%
47% 39% 36%
9% 7% 9% 6%11%7%
0%
10%
20%
30%
40%
50%
60%
70%
80%
90%
100%
Qtr3 Qtr4 Qtr1 Qtr2 Qtr3 Qtr4
2014 2015
European venture financing by target market3Q14 to 4Q15 (excluding Israel, rounds up to $20M, percent of US $M)
Government Telecom OEM SMB Enterprise Consumer
Page 27
Breakdown by region & target market• Once again, all regions
except Israel saw more consumer investment than enterprise/SMB investment
• Investments across France and DACH were dominated by consumer-oriented companies
• The Nordics showed a healthy balance, with a 50/50 split between enterprise and consumer
27@gdibnerblog: yankeesabralimey Syndicate for European & Israeli Enterprise Companies
648
180 208 149 14366
237
437
148149
5945
88
71
0
200
400
600
800
1,000
1,200
UK & Ireland Israel DACH Nordic France Iberia Benelux
Tota
l am
ount
inve
sted
(US
$M)
Investment in Europe and Israel by target market by region4Q, 2015 (US $M)
Government Telecom OEM SMB Enterprise Consumer
Page 28
Distribution of investment rounds by country• Across Europe & Israel, 46%
of VC investment rounds were in consumer companies in 2015
• In DACH, 56% of rounds were into consumer companies, the highest proportion of any region except Iberia, where the number was 59%
• In UK, the number of consumer rounds was around 50% of the total
28@gdibnerblog: yankeesabralimey Syndicate for European & Israeli Enterprise Companies
29%
41%
42%
47%
48%
50%
56%
59%
56%
47%
36%
39%
40%
39%
32%
27%
4%
14%
7%
8%
9%
7%
13%
8%
5%
3%
3%
1%
0% 10% 20% 30% 40% 50% 60% 70% 80% 90% 100%
Israel
South. Eur.
Benelux
Nordic
France
UK & Ireland
DACH
Iberia
Investment in Europe and Israel by target market by country2015 (Number of investments)
Consumer Enterprise SMB OEM Telecom Government
Page 29
Growth rounds by target market• From 4Q14 to 2Q15, there
was an upward trend towards consumer-oriented companies in growth investing, but this trend reversed itself in 3Q15 and continued into 4Q15
• For the first time, enterprise companies accounted for 50% of all growth rounds in Europe & Israel
29@gdibnerblog: yankeesabralimey Syndicate for European & Israeli Enterprise Companies
56%
37%46%
56%43% 39%
25%
41%
46% 25%38% 50%
6% 7%
5%
9% 12%6% 11% 6% 7% 5%6%
0%
10%
20%
30%
40%
50%
60%
70%
80%
90%
100%
Qtr3 Qtr4 Qtr1 Qtr2 Qtr3 Qtr4
2014 2015
Investment in Europe and Israel by target market(Rounds over $20M, number of investments)
Government Telecom OEM SMB Enterprise Consumer
Page 30
• Marketing was the most popular vertical across Europe & Israel, with 33 investments in the category
• Security was second, with 25• Finance dropped to third
place, from first last quarter• Lifestyle (which is a catch-all
consumer category) took the fourth slot
• IT Infrastructure and health took the fourth and fifth slots
30@gdibnerblog: yankeesabralimey
Finance returned to being the top vertical
Syndicate for European & Israeli Enterprise Companies
Marketing, 33
Security, 25
Financial, 22
Lifestyle, 20Infrastructure, 17
Health, 17
Development, 16
Logistics, 16
Electronics, 16
Fashion, 14
Adtech, 13
Data, 13
Food, 12
Employment, 12
Education, 10Productivity, 10Social, 9Gaming, 9
Communications, 9Entertainment, 8Real Estate, 8Payments, 7Industrial, 7
Travel, 6SCM, 5
Energy, 5
European & Israeli venture financing by target market4Q 2015 (number of investments)
Page 31
• This graph shows number of investments in the top 10 verticals across 4Q14 and 4Q15
• All of the top ten verticals increased in frequency
• Marketing-related investments more than doubled from 15 in 4Q14 to 33 in 4Q15
• Security investments exploded in frequency from 4 in 4Q14 to 25 in 4Q15
• Health-related investments nearly than doubled from 9 in 4Q14 to 17 in 4Q15
31@gdibnerblog: yankeesabralimey
How have the most popular verticals grown?
Syndicate for European & Israeli Enterprise Companies
Marketing, 15Marketing, 33
Financial, 17
Financial, 22Li festyle, 13
Li festyle, 20Infrastructure, 15
Infrastructure, 17
Securi ty, 4
Securi ty, 25
Health, 9
Health, 17
Data, 11
Data, 13
Adtech, 11
Adtech, 13
Development, 7
Development, 16
Electronics, 7
Electronics, 16
Logistics, 7
Logistics, 16
0
50
100
150
200
250
Qtr4 Qtr4
2014 2015
European & Israeli venture financing by vertical market(top 10 verticals, number of investments)
Page 32
• Marketing was the most frequently funded vertical, with enterprise-oriented marketing taking the lion’s share within that category
• Security took second place with a heavy emphasis on enterprise security
• Finance dropped to third place, with most of the activity in the consumer finance space, followed by SMB finance
• IT infrastructure and health tech made strong showings
• Consumer lifestyle, electronics, and fashion also made the top ten verticals
32@gdibnerblog: yankeesabralimey
Which verticals for which segments?
Syndicate for European & Israeli Enterprise Companies
Fashion
Electronics
Logistics
Development
Health
Infrastructure
Lifestyle
Financial
Security
Marketing
0 5 10 15 20 25 30 35
European & Israeli venture financing by target market4Q, 2015 (number of investments, top 10 verticals)
Consumer
Enterprise
SMB
OEM
Telecom
Government
Page 33
• This chart shows the ten most commonly funded verticals across Europe & Israel by quarter
• Marketing, security, and logistics, developer tooling show continued strength
• Health and adtech seem to have rebounded as areas of investor interest
33@gdibnerblog: yankeesabralimey
The most popular verticals in the past 12 months
Syndicate for European & Israeli Enterprise Companies
Qtr3 Qtr4 Qtr1 Qtr2 Qtr3 Qtr4
2014 2015
0
50
100
150
200
250
European & Israeli venture financing by vertical market(number of investments, top 10 verticals)
Marketing
Financial
Lifestyle
Infrastructure
Security
Adtech
Electronics
Health
Logistics
Development
Page 34
• Lifestyle, which is admittedly a bit of a catch-all consumer category, continues to show tremendous strength in terms of VC volume
• Finance took the second place overall
• Health showed significant strength in 4Q
• Electronics (which typically means consumer electronics systems companies) seems to have rebounded
• Gaming, travel, and food-related categories whichedseem to be declining in 3Q, seemed to recover in 4Q
• Consumer-oriented logistics plays seem to be emerging as an important category for VC investment
34@gdibnerblog: yankeesabralimey
Consumer VC investment trends
Syndicate for European & Israeli Enterprise Companies
Qtr3 Qtr4 Qtr1 Qtr2 Qtr3 Qtr4
2014 2015
0
20
40
60
80
100
120
140
European & Israeli venture financing by consumer verticals(number of investments, top 10 verticals)
Lifestyle
Financial
Fashion
Gaming
Health
Travel
Social
Food
Logistics
Electronics
Page 35
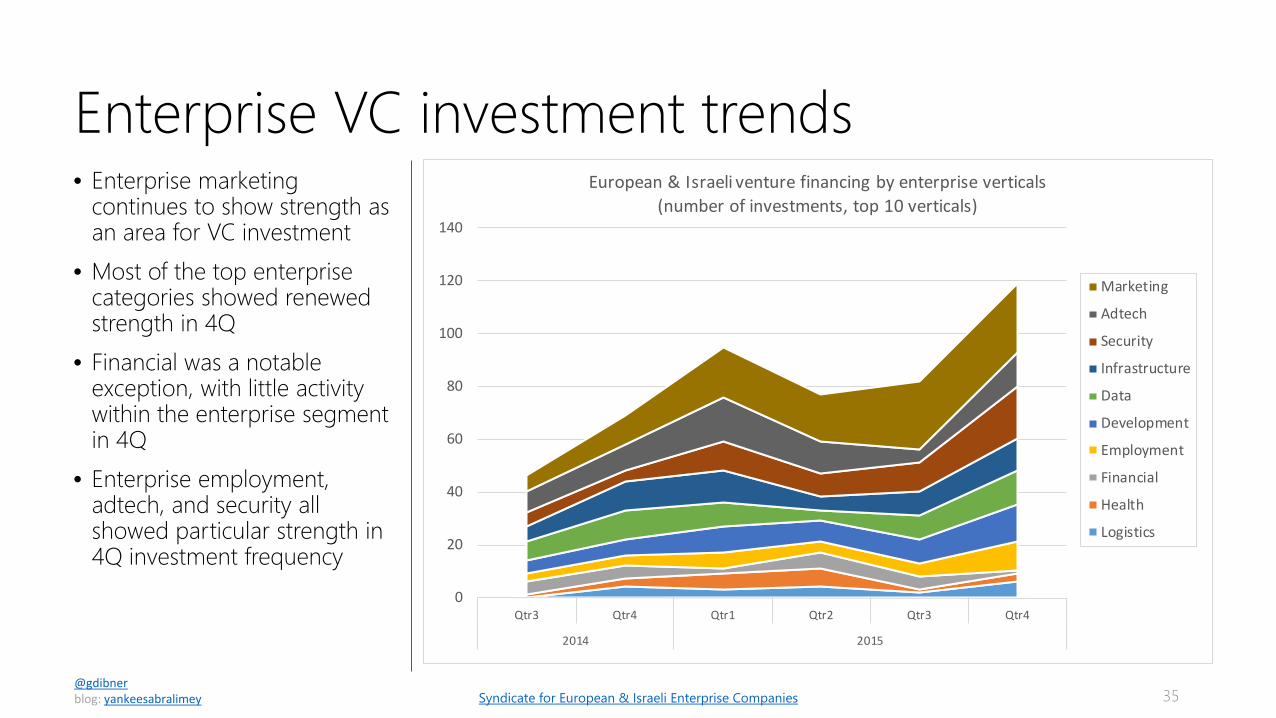
• Enterprise marketing continues to show strength as an area for VC investment
• Most of the top enterprise categories showed renewed strength in 4Q
• Financial was a notable exception, with little activity within the enterprise segment in 4Q
• Enterprise employment, adtech, and security all showed particular strength in 4Q investment frequency
35@gdibnerblog: yankeesabralimey
Enterprise VC investment trends
Syndicate for European & Israeli Enterprise Companies
Qtr3 Qtr4 Qtr1 Qtr2 Qtr3 Qtr4
2014 2015
0
20
40
60
80
100
120
140
European & Israeli venture financing by enterprise verticals(number of investments, top 10 verticals)
Marketing
Adtech
Security
Infrastructure
Data
Development
Employment
Financial
Health
Logistics
Page 36
• Security retained the top spot in Israel, with 16 investments including 2 consumer-oriented investments
• Israel also saw 8 investments in IT infrastructure and 8 investments in the marketing vertical
• Communications and big data were the fourth and fifth most frequently funded categories
• Development tooling finally cracked the top ten, with 3 investments in 4Q
36@gdibnerblog: yankeesabralimey
A closer look at Israeli venture in 4Q15
Syndicate for European & Israeli Enterprise Companies
Fashion
Financial
Electronics
Logistics
Development
Data
Communications
Marketing
Infrastructure
Security
0 2 4 6 8 10 12 14 16 18
Israeli venture financing by target market4Q, 2015 (number of investments, top 10 verticals)
Consumer
Enterprise
SMB
OEM
Telecom
Government
Page 37
• Throughout 2015, security, marketing, and infrastructure were the most frequently funded categories in Israel
• Communications, fintech, and adtech also made good showings
• Interestingly, enterprise development tools and consumer electronics are now strong emerging categories in Israel
37@gdibnerblog: yankeesabralimey
A closer look at Israeli venture in 2015
Syndicate for European & Israeli Enterprise Companies
Electronics
Development
Logistics
Productivity
Adtech
Financial
Communications
Infrastructure
Marketing
Security
0 5 10 15 20 25 30 35 40 45
Israeli venture financing by target market2015 (number of investments, top 10 verticals)
Consumer
Enterprise
SMB
OEM
Telecom
Government
Page 38
• For the fourth quarter running, Fintech was the dominant category of investment in the UK, but this quarter the differential was much less than in 3Q
• Enterprise employment and enterprise marketing were also important categories
• As usual, consumer-oriented companies dominated most categories of VC funding across the UK
• Adtech and gaming did not crack the top ten
38@gdibnerblog: yankeesabralimey
UK VCs dialed back on fintech in 4Q…a bit
Syndicate for European & Israeli Enterprise Companies
Food
Lifestyle
Fashion
Development
Payments
Real Estate
Education
Security
Marketing
Employment
Social
Financial
0 1 2 3 4 5 6
UK venture financing by target market4Q, 2015 (number of investments, top verticals)
Consumer
Enterprise
SMB
OEM
Page 39
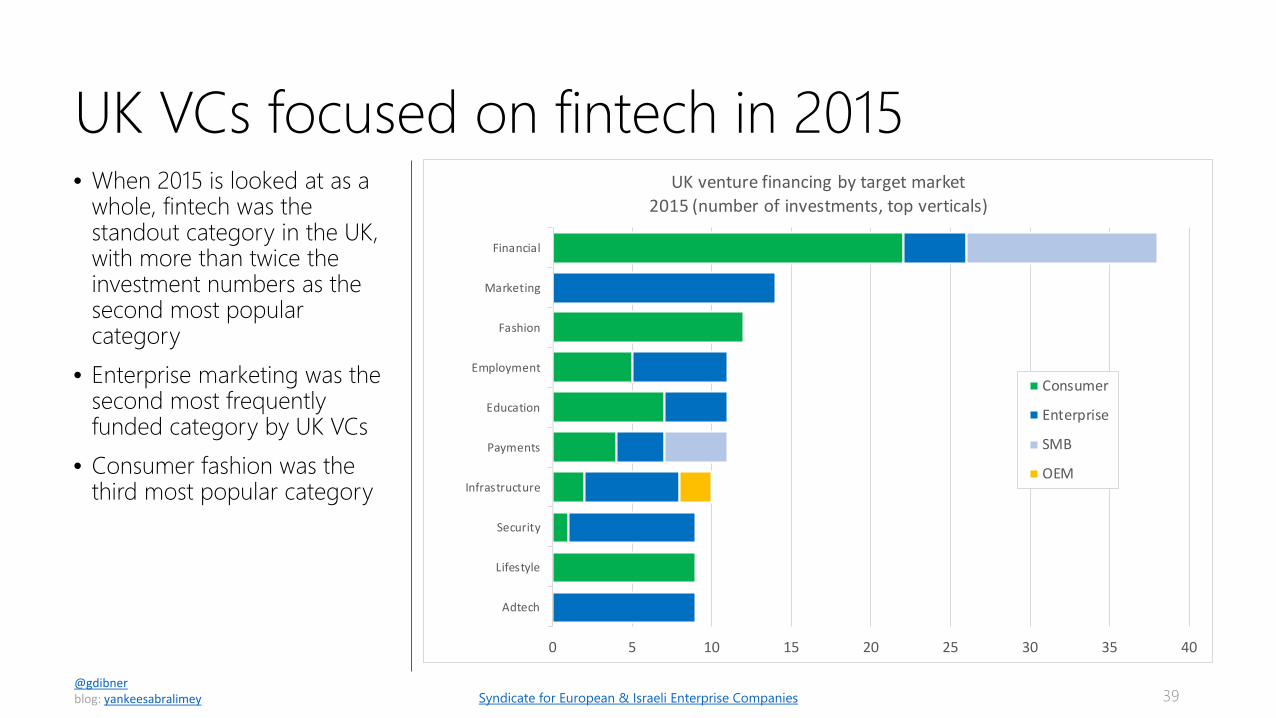
• When 2015 is looked at as a whole, fintech was the standout category in the UK, with more than twice the investment numbers as the second most popular category
• Enterprise marketing was the second most frequently funded category by UK VCs
• Consumer fashion was the third most popular category
39@gdibnerblog: yankeesabralimey
UK VCs focused on fintech in 2015
Syndicate for European & Israeli Enterprise Companies
Adtech
Lifestyle
Security
Infrastructure
Payments
Education
Employment
Fashion
Marketing
Financial
0 5 10 15 20 25 30 35 40
UK venture financing by target market2015 (number of investments, top verticals)
Consumer
Enterprise
SMB
OEM
Page 40
• The top three categories in German VC investment in 3Q15 were consumer lifestyle, consumer travel, and enterprise development tools
• In total, the top 10 categories in Germany generated 31 investments, 15 of which were in consumer companies
40@gdibnerblog: yankeesabralimey
The German VC market in 4Q15
Syndicate for European & Israeli Enterprise Companies
HMI
Adtech
Food
Communications
Energy
Logistics
SCM
Marketing
Fashion
Payments
Industrial
Health
Real Estate
Infrastructure
Financial
Electronics
Lifestyle
Travel
Development
0 1 2 3 4
German venture financing by target market4Q, 2015 (number of investments, top 10 verticals)
Consumer
Enterprise
SMB
OEM
Page 41
• Throughout 2015, the most frequently funded categories in Germany were consumer lifestyle, consumer fashion, consumer fintech, enterprise marketing, and consumer food
• In total, the top 10 categories in Germany generated 83 investments, 57 of which were in consumer companies
41@gdibnerblog: yankeesabralimey
German VCs focused on consumer in 2015
Syndicate for European & Israeli Enterprise Companies
Education
Durables
Infrastructure
Health
Data
Travel
Food
Fashion
Marketing
Financial
Lifestyle
0 1 2 3 4 5 6 7 8 9 10 11 12 13 14
German venture financing by target market2015 (number of investments, top 10 verticals)
Consumer
Enterprise
SMB
OEM
Telecom
Page 42
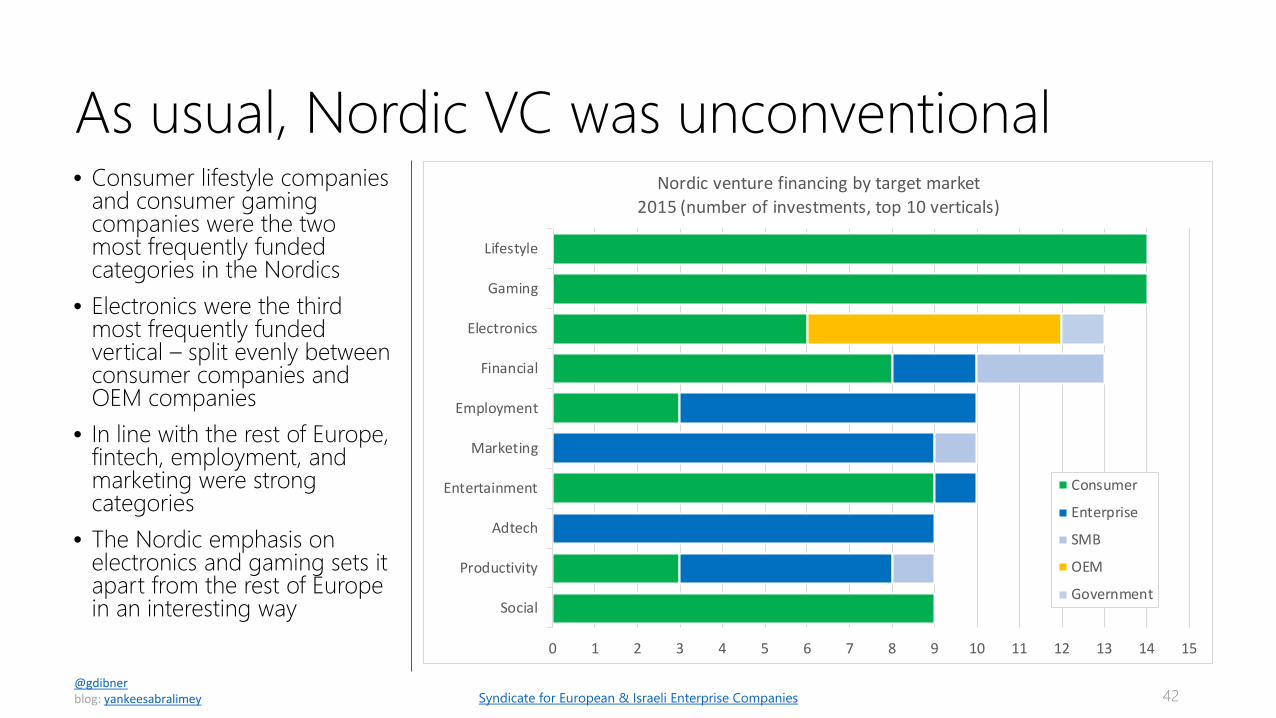
• Consumer lifestyle companies and consumer gaming companies were the two most frequently funded categories in the Nordics
• Electronics were the third most frequently funded vertical – split evenly between consumer companies and OEM companies
• In line with the rest of Europe, fintech, employment, and marketing were strong categories
• The Nordic emphasis on electronics and gaming sets it apart from the rest of Europe in an interesting way
42@gdibnerblog: yankeesabralimey
As usual, Nordic VC was unconventional
Syndicate for European & Israeli Enterprise Companies
Social
Productivity
Adtech
Entertainment
Marketing
Employment
Financial
Electronics
Gaming
Lifestyle
0 1 2 3 4 5 6 7 8 9 10 11 12 13 14 15
Nordic venture financing by target market2015 (number of investments, top 10 verticals)
Consumer
Enterprise
SMB
OEM
Government
Page 43
• As software eats the world, services are becoming an increasingly important business model for venture-backed startups
• This was certainly the case in 2015, with services taking 26% of the venture dollars invested in Europe & Israel
• SaaS emerged as the second most funded business model in 2015
• Commerce continues to be important, with 17% of the financing in 2015
• Marketplaces – business that serve a price discovery function – were 9%
43@gdibnerblog: yankeesabralimey
Services & SaaS dominated 2015
Syndicate for European & Israeli Enterprise Companies
Services, 2,331, 26%
SaaS, 1,969, 22%
Commerce, 1,497, 17%
Software, 1,343, 15%Marketplace, 768, 9%
Systems, 472, 5%
Media, 406, 4%
Components, 125, 1%
Semiconductors, 106, 1%
European & Israeli venture financing by target market2015 (in US $M) (excluding mega-rounds)
Page 44
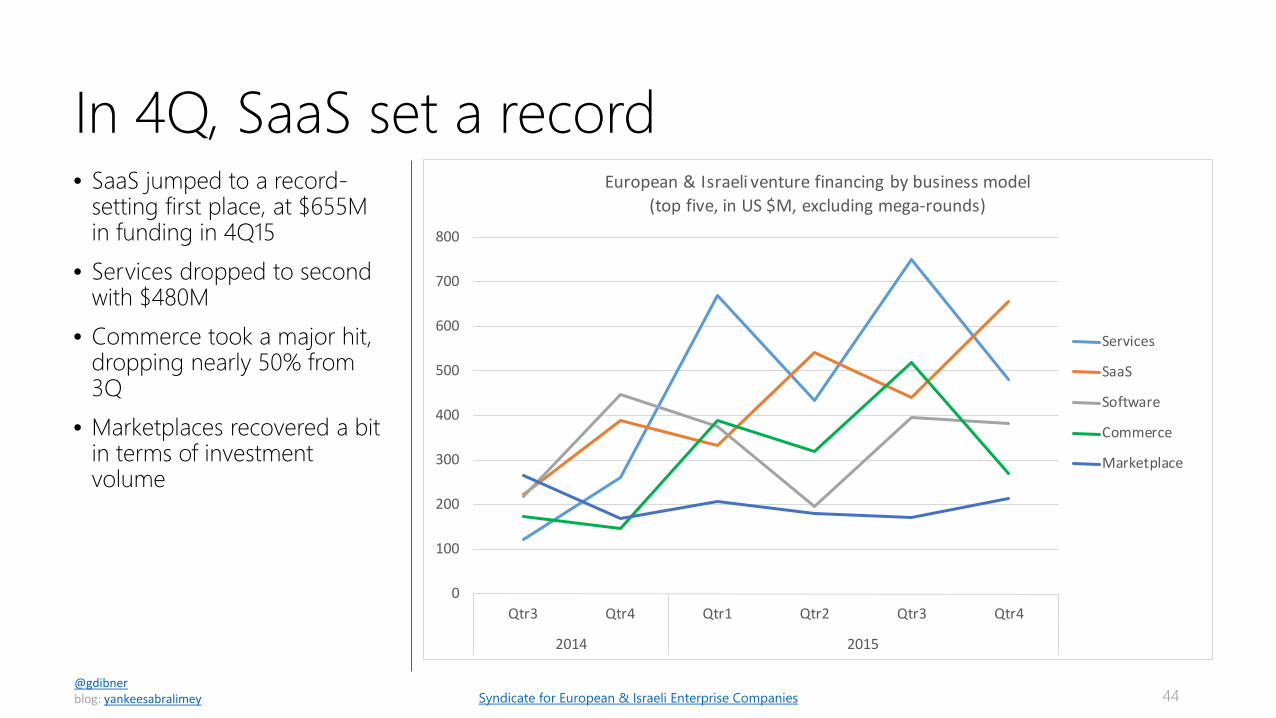
• SaaS jumped to a record-setting first place, at $655M in funding in 4Q15
• Services dropped to second with $480M
• Commerce took a major hit, dropping nearly 50% from 3Q
• Marketplaces recovered a bit in terms of investment volume
44@gdibnerblog: yankeesabralimey
In 4Q, SaaS set a record
Syndicate for European & Israeli Enterprise Companies
0
100
200
300
400
500
600
700
800
Qtr3 Qtr4 Qtr1 Qtr2 Qtr3 Qtr4
2014 2015
European & Israeli venture financing by business model(top five, in US $M, excluding mega-rounds)
Services
SaaS
Software
Commerce
Marketplace
Page 45
US VCs focused on SaaS & services• Throughout 2015, US VC
interest was skewed heavily towards SaaS, Software & Services models
• Markets, commerce, and media investments also attracted US VC interest, but at much lower levels
45@gdibnerblog: yankeesabralimey Syndicate for European & Israeli Enterprise Companies
47 43 32 15 12
259232
147
11995
72 80
0
50
100
150
200
250
300
350
SaaS Services Software Commerce Marketplace Media Systems Components Semiconductors
VC Investments in Europe & Israel2015 (number of investments)
No US VC involved US VC involved
Page 46
• Enterprise marketing SaaS was by far the most popular segment for VC investment in 2015 with 72 investments across the region
• Consumer financial services were next, with 42 investments
• Enterprise security software was third, with 36 investments
46@gdibnerblog: yankeesabralimey
Enterprise marketing & consumer fintech
Syndicate for European & Israeli Enterprise Companies
0 10 20 30 40 50 60 70 80
Enterprise CRM SaaS
Consumer Travel Commerce
Enterprise Infrastructure SaaS
Enterprise Data Software
Consumer Education Services
Consumer Food Commerce
Consumer Gaming Software
Enterprise Employment SaaS
Enterprise Development SaaS
SMB Financial Services
Consumer Electronics Systems
Enterprise Adtech Services
Consumer Social Media
Consumer Lifestyle Commerce
Consumer Fashion Commerce
Enterprise Security Software
Consumer Financial Services
Enterprise Marketing SaaS
Number of VC investments
Investment in Europe & Israel by segment by country2015 (segments with 15 or more investments)
UK & Ireland IsraelNordic DACHFrance BeneluxIberia South. Eur.East. Eur.
Page 47
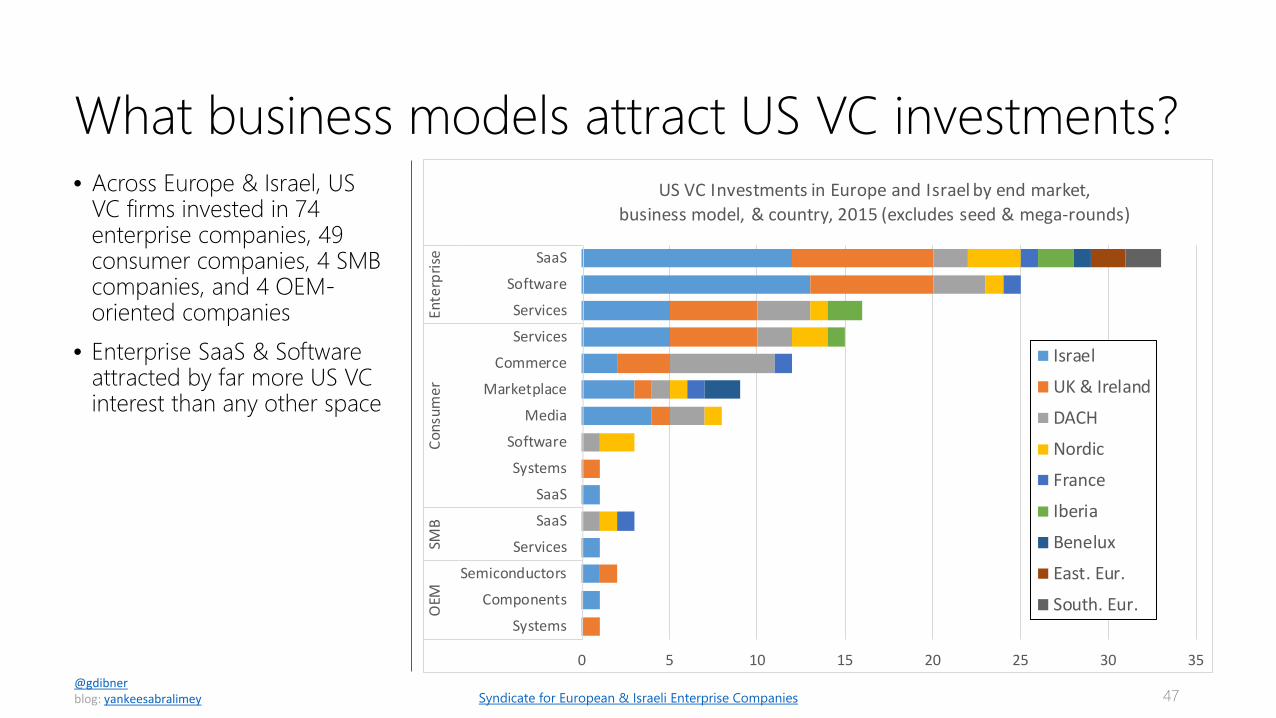
• Across Europe & Israel, US VC firms invested in 74 enterprise companies, 49 consumer companies, 4 SMB companies, and 4 OEM-oriented companies
• Enterprise SaaS & Software attracted by far more US VC interest than any other space
47@gdibnerblog: yankeesabralimey
What business models attract US VC investments?
Syndicate for European & Israeli Enterprise Companies
0 5 10 15 20 25 30 35
Systems
Components
Semiconductors
Services
SaaS
SaaS
Systems
Software
Media
Marketplace
Commerce
Services
Services
Software
SaaS
OEM
SMB
Cons
umer
Ente
rpris
e
US VC Investments in Europe and Israel by end market, business model, & country, 2015 (excludes seed & mega-rounds)
Israel
UK & Ireland
DACH
Nordic
France
Iberia
Benelux
East. Eur.
South. Eur.
Page 48
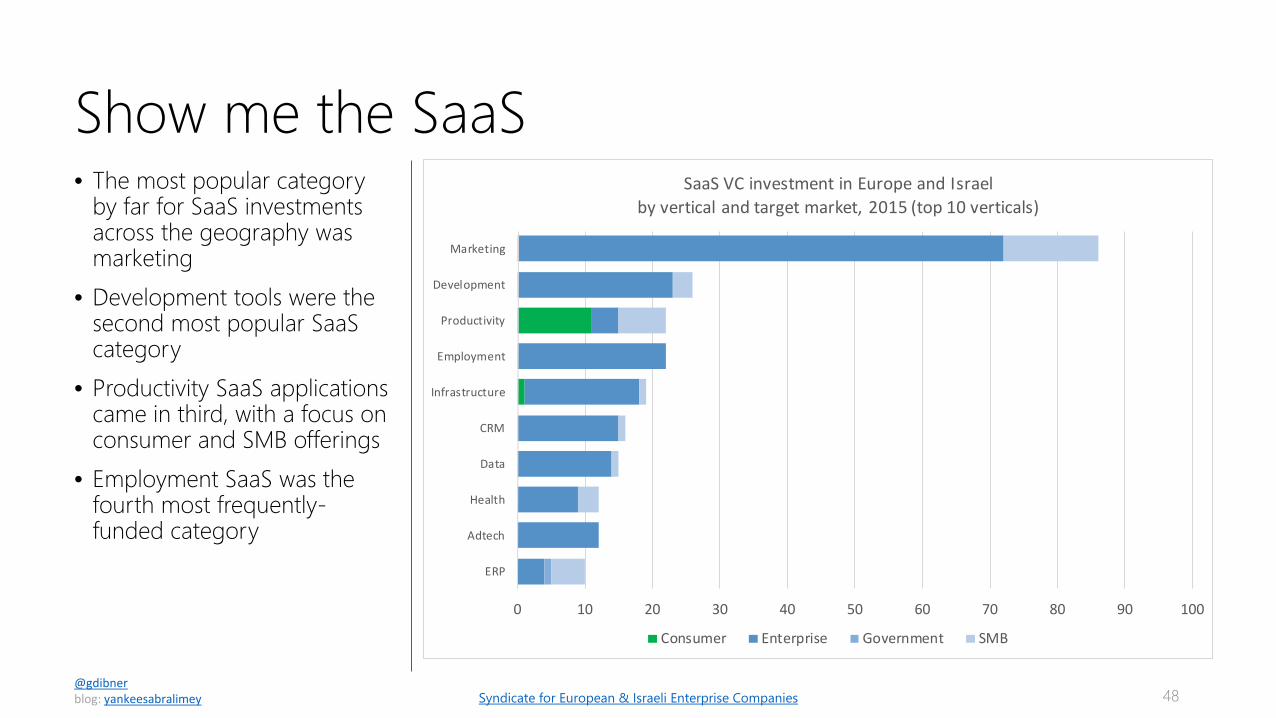
Show me the SaaS• The most popular category
by far for SaaS investments across the geography was marketing
• Development tools were the second most popular SaaS category
• Productivity SaaS applications came in third, with a focus on consumer and SMB offerings
• Employment SaaS was the fourth most frequently-funded category
48@gdibnerblog: yankeesabralimey Syndicate for European & Israeli Enterprise Companies
0 10 20 30 40 50 60 70 80 90 100
ERP
Adtech
Health
Data
CRM
Infrastructure
Employment
Productivity
Development
Marketing
SaaS VC investment in Europe and Israelby vertical and target market, 2015 (top 10 verticals)
Consumer Enterprise Government SMB
Page 49
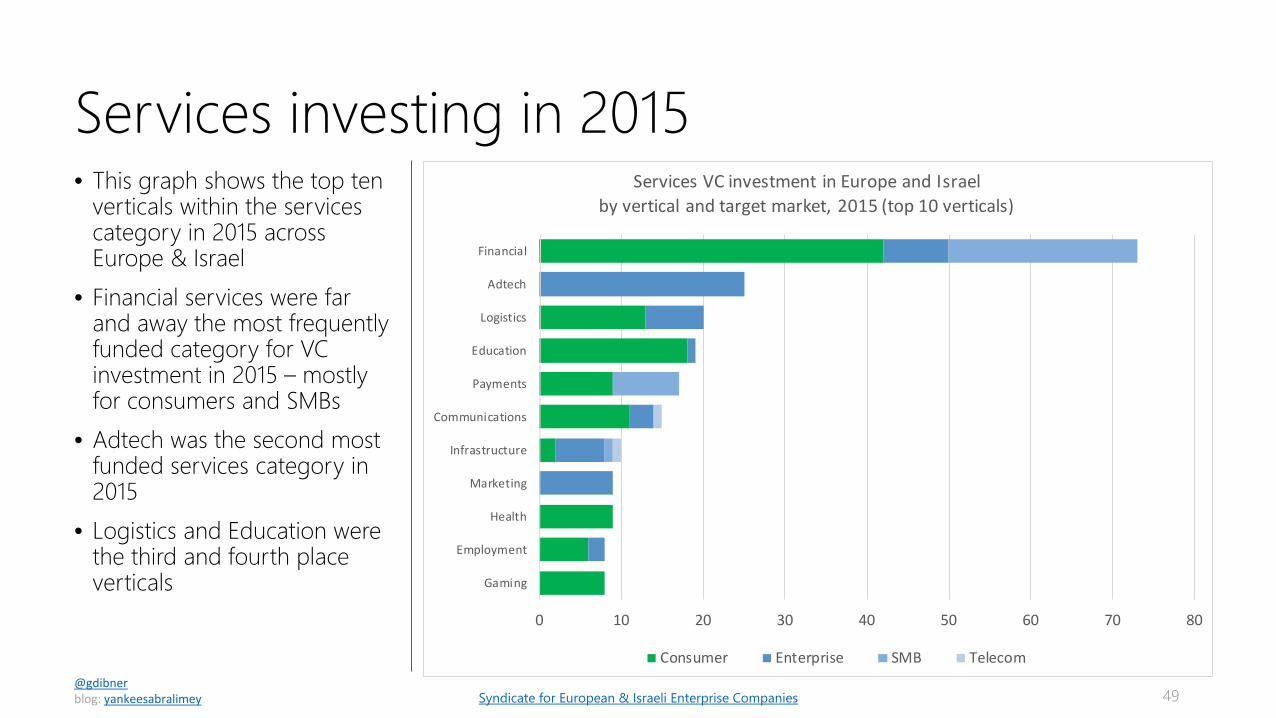
Services investing in 2015• This graph shows the top ten
verticals within the services category in 2015 across Europe & Israel
• Financial services were far and away the most frequently funded category for VC investment in 2015 – mostly for consumers and SMBs
• Adtech was the second most funded services category in 2015
• Logistics and Education were the third and fourth place verticals
49@gdibnerblog: yankeesabralimey Syndicate for European & Israeli Enterprise Companies
0 10 20 30 40 50 60 70 80
Gaming
Employment
Health
Marketing
Infrastructure
Communications
Payments
Education
Logistics
Adtech
Financial
Services VC investment in Europe and Israelby vertical and target market, 2015 (top 10 verticals)
Consumer Enterprise SMB Telecom
Page 50
Based in , I was previously a partner at . Before that, I helped run the
European seed program for . I moved to London after seven years in
during which I worked as a VC with and . I’m originally from .
My VC investments include and . Angel investments include and many more.
If you found this useful, I hope you’ll subscribe to my blog.50
Gil DibnerTo invest in the best European & Israeli enterprise startups,
consider backing me on here. Lots of exciting stuff in thepipeline – and you’ll be in pretty good company.
Page 51
Thank youblogPrepared by Gil Dibner