81
European Car and Light Commercial Vehicle Production Outlook November 2013 SMMT, the 'S' symbol and the ‘Driving the motor industry’ brandline are trademarks of SMMT Ltd
European Car and Light Commercial Vehicle Production Outlook November 2013
SMMT, the 'S' symbol and the ‘Driving the motor industry’ brandline are trademarks of SMMT Ltd

EUROPEAN CAR AND LCV PRODUCTION OUTLOOK REPORT November 2013| Page 2
Contents
Introduction and analysis overviews:
About this report 3
Executive Summary 4 Demand Side Perspective 11
Production Outlook Overview 13
Country Rankings 28 Alternative Scenarios 31
Disclaimer 36
Individual vehicle manufacturer reviews:
BMW 38
Daimler 41 Fiat (incl. Chrysler) 44
Ford 49
GM 51 Honda 54
Hyundai-Kia 55
PSA 56 Renault-Nissan-Dacia 61
Suzuki 66
Tata – Jaguar Land Rover 67 Toyota 70
Volkswagen (incl. Porsche) 71 Volvo 78
Aston Martin 80

EUROPEAN CAR AND LCV PRODUCTION OUTLOOK REPORT November 2013| Page 3
About this report
This is the fifth short version of the 2013 Production Outlook report from AutoAnalysis. In January we produced our full “Foundation” report and readers are referred to this report for full details on the recent history and developments at each VM in particular.
The aim of the shorter reports is to focus on the Production Outlook volumes and developments at the VMs since the previous report. This means this report and the remaining reports in 2013 will be much shorter than the Foundation report.
The views and projections contained in this report are those of the author, Ian Henry of AutoAnalysis. They do not represent an official SMMT view. The projections regarding new model timings, changes in production locations and the associated production volumes shown here have been compiled on the basis of information from a variety of sources. In most cases, the vehicle companies do not provide official information on which models will be made at which plants, nor do they provide detailed information on future volumes and timings. They have been prepared on the basis of judgments made by AutoAnalysis, taking into account the information, opinion and inside from a range of industry, press and analyst sources available at the time of compiling this report.
Ian Henry of AutoAnalysis will gladly address SMMT members’ specific questions on this report.
Readers’ comments and questions on this report will be greatly appreciated. Please e-mail: [email protected].

EUROPEAN CAR AND LCV PRODUCTION OUTLOOK REPORT November 2013| Page 4
Executive Summary Recent sales fall reversed? Although 2012 and the first 8 months of 2013 had seen steady falls in
registrations across the EU, there are signs that the bottom has been reached and the long awaited upturn has begun, 2012 had seen a fall of 8.2% in EU27 car registrations, something which was directly reflected in the fall in production which Europe witnessed last year. The first eight months of 2013 saw this decline continue, although July 2013 actually saw a year-on-year increase of 5%. However, this was a short-lived phenomenon, and the figures for August showed a 5% fall for the month and a year-to-date fall of 5.2%. Throughout this period, the UK remained the only major market showing signs of growth, with a rise of 10.4% year-on-year in the first eight months of the year; even in Germany, so long the engine of growth in Europe, registrations have fallen by 6.6% in the year to date.
In September and October, however, the market began to turn around – the UK continued to grow and Spain was boosted (possibly only temporarily) but government-supported incentives which resulted in a year-on-year growth of more than one-third. Total EU sales in rose 5.4% in September and 4.7% in October.
Once again in October, the UK continued to grow, this time by 10.2%; in France and Germany, the other major markets, there was also a modest rise in October, both growing by just over 2% although they still show year-to-date declines, by 7.4% in France and 5.2% in Germany.
Production recovering … Our total for 2012 European production including Russia is c18.12mn, a fall of
around 1mn from 2011. We now see that most of this fall will be recouped by the end of 2013, with production including Russia rising to nearly 18.98mnn. This rise is driven by a combination of factors, partly Russia, but more crucially a recovery in production in Spain and continued rises in the UK and Turkey.
Taking Russia out of the equation, we have 2012 European production down at just over 16.6mn units, a fall of c1.75mn units from 2011. We now see European production without Russia rising to 17.82mn in 2013 – as noted above, we see Spain, Turkey and the UK contributing much of this recovery.
European production, excluding Russia, has clearly started to recover, despite the continued sales falls across EU markets for much of the year. This rise in production reflects continued strong exports of premium brands (especially JLR and the German brands), the supply of models from Spain to emerging markets by PSA, the strength of LCV demand (underpinning production in Spain and Turkey especially) and general pipeline filling by the VMs with a series of new models.
In addition, new models from Dacia (including at its plant in Morocco which we treat as part of Europe from a production point of view) and strong demand for Skoda and Hyundai-Kia models also highlight the increasing role of new “value” brands, at the expense in many cases of traditional volume brands.
Just as recent production volumes have been underpinned by premium brands and some newer entrants, we also expect the main winners in the near term will be the same companies. Thus we expect most of the growth will come from the premium brands from Germany, JLR/Mini/Nissan in the UK, the value brands (ie Dacia, Skoda and Hyundai-Kia) and also LCVs, especially the expanding range from Ford. Ford will also be boosted by rising production in Russia.
However, we expect to see a mix of (at best) stable and in some cases continued decline in production at the volume VMs. Opel/Vauxhall is expected to see total production dip below 900,000 pa through to 2015 (with its recovery dependent on the new Astra and Corsa models after this date). Citroen is likely to fall similarly, while its sister brand Peugeot will also fall in the long run, despite its recent production boost from the 208 and 2008. Fiat will have a tough period until its expanded 500 range comes on stream – and it is possible that funding restrictions could mean this will be delayed and its volumes could be lower than projected in this report.
There will also be a number of exceptions to this negative picture at the volume VMs. This will mainly in the crossover segments, eg the B-segment

EUROPEAN CAR AND LCV PRODUCTION OUTLOOK REPORT November 2013| Page 5
models from PSA (2008) and Renault (Captur) and, as noted above, emerging markets models (301 and C4 Elysee) made in Spain by PSA.
Modest restructuring finally under way The decisions in 2012, by GM, PSA and Ford to restructure and start cutting
excess European manufacturing capacity over the next few years suggest that the volume VMs have finally faced up to the reality of declining demand (in the face of both premium brands and new value brands starting to encroach onto their traditional territory), increased competition and the cumulative impact of substantial financial losses sustained over several years.
While these three VMs are beginning their structural problems through capacity cutbacks, (Ford has closed Southampton in the UK and will soon close Genk in Belgium, Opel is closing Bochum in Germany and PSA is closing Aulnay in Paris), other volume VMs are following a different route.
Fiat and Renault have embarked on restructuring plans which for now exclude plant closures. Renault announced further investment in Spain at the end of last year and this year it has confirmed additional investment in its Douai plant in France as well as plans to bring production of the Nissan Micra to France, to the Flins plant near Paris.
Renault commitment to its Spanish car and powertrain operations includes the production of new engines and two new models at the Palencia factory, alongside the new B-segment crossover, the Captur, which is now in production at the Valladolid factory The Captur is likely to be boosted later this year with the addition of a Samsung badged model, increasing plant utilisation and filling in a gap in the Korean brand’s range.
Like Renault, rather than close any plants, Fiat is investing in its Italian operations, to re-organise the production allocation between its four main Italian plants and re-focus its product line-up around its premium Alfa and Maserati brands and a much slimmed down Fiat range; whether this brave strategy will be successful in the long run remains to be seen, but Fiat has clearly recognised the need to change tack.
Fiat’s reorganisation plans are, however, taking time to be fully implemented, partly because of financial restraints on the company ahead of the full takeover of Chrysler (Fiat needs access to Chrysler’s cash resources to implement its new strategy. Problems with the design and specification of several of the new Alfa models which are integral to the Alfa brand’s revival have delayed the new models’ launches and this will have a direct impact on Alfa volumes which we now see as not growing until 2015 at the earliest.
Rather than close factories, Fiat is reorganising its Italian operations, changing the production allocation between its four main Italian plants. This reflects a new strategy which focuses on the premium Alfa and Maserati brands and a much slimmed down Fiat range, based on the 500 and Panda models; whether this strategy succeeds remains to be seen, especially given the continued delays to the new Alfa product programme.
Fiat plans to use its Italian, Serbian, Polish and Turkish plants as global supply points, a strategy which is new to the company. This will involve selling vehicles under the Jeep – and Ram – names from plants in Italy and Turkey, and possibly the other plants too. If this succeeds, it may well be able to hold onto its existing manufacturing footprint, but if it does not then closures and production cutbacks which appear to be off Fiat’s agenda at this point may well be required. The Fiat Ducato van has been launched in North America under the Ram name in Q4/2013.
This strategy – of investment for growth rather than cutting capacity – is consistent with the announcement in early 2013 from Renault, committing it to growing production in France to 710,000 by 2016 in exchange for its unions agreeing to a range of cost cuts and 7,500 jobs. Even though Renault is adding the Nissan Micra to its Flins factory, our view is that the Renault target will not be met by 2016 if Clio production moves to Turkey in the volumes expected or unless LCV production turns out to be higher than currently projected. We are more confident of Renault reaching its 710,000 target by 2018 however.
We remain somewhat sceptical of Fiat and Renault’s plans to grow their way out of their current predicaments, ie avoiding plant closures as part of their restructuring plans. However, for the short term at least, both car companies

EUROPEAN CAR AND LCV PRODUCTION OUTLOOK REPORT November 2013| Page 6
have managed to find ways to keep existing plants in operation and convince their backers that continued investment is the way forward.
Meanwhile, in the UK, Honda has cut several hundred jobs and retrenched somewhat, while Vauxhall moved production at its Ellesmere Port plant from a 5-day to a 4-day week (although working four longer days and nominally maintaining production levels). These moves have been described as necessary to “right-size” these plants’ capacities on an interim basis while demand recovers ahead of new model launched planned for these factories; the companies remain committed to these UK factories in the long run.
Elsewhere, the common approach to falling demand – putting factories on temporary shutdown – is being followed; Ford has announced a series of down days recently for its Craiova plant which makes the B-Max, sales of which are slowing.
By contrast with the problems and pressure to change faced by the volume VMs, at several other VMs, especially the Koreans, the VW group, the German premium brands, JLR and indeed some of the Japanese, the current economic uncertainty has been less of a problem.
Inevitably, there will always be winners and losers as markets evolve; our view is that the losers are likely to be the traditional volume brands whose recent and likely future restructuring may actually only serve to delay the eventual demise of one of the traditional volume players. The path being followed by the Koreans and the premium brands is not easy, but their relative stability and in most cases modest growth, amidst the prevailing economic uncertainty, only reinforces the pressure on the volume brands.
JLR’s announcement at the Frankfurt motor show in September that it would launch a new range of aluminium-bodied Jaguars from 2015 with a major expansion at Solihull is indicative of the positive outlook for the premium brands in general. Since this announcement was made, news has emerged of the range of models which will appear on the new JLR aluminium platform, including Jaguar and Land Rover SUVs and a range of conventional Jaguar bodystyles, sedan, coupe and estate.
The full report contains further insight into the new JLR range and the potential production volumes which will flow from this range expansion. Our view is that
by the end of the period under consideration here, JLR could well be producing around double the volumes it made in 2012; the precise point in time when this is reached will depend on the exact launch timetable for the recently announced models and variants thereof and the degree to which production in China and even India takes some production away from the UK; however, based on our current understanding of JLR’s plans, we do not expect the expansion of JLR’s production footprint to have a significant impact until later in decade by when the recently announced new models will be in full production.
In general, the premium brands have had fewer problems in terms of excess capacity than the volume companies. Although Mercedes had to implement production slowdowns for some of its large car lines during 2012, this was largely a function of model cycle effects. In fact, as we have noted before, Mercedes has had a structural shortage of capacity for its new A-/B-class range; and in order to overcome this problem it has had to bring on stream additional capacity at a contract manufacturer, Valmet in Finland in order to cope with stronger than expected demand for the A-class. It has also accelerated plans to increase production in Hungary as the range of derivatives of the A-/B-class widens; the recently launched CLA sedan for example has exceeded all initial sales expectations and it would not be surprising if production capacity for this model were to be raised in the future.
Theoretically, capacity could have been found in Rastatt or Hungary, were production limited to the basic A- and B-class models – however, both factories are going to be making much more than just the basic models, and this production complexity lies behind the decision to move some production to Valmet. Even so, Daimler is bringing forward the planned expansion of its new Hungarian factory.
In parallel, to meet long-run expected demand for Minis, BMW has reached agreement with the new owners of the Nedcar plant in the Netherlands, to produce up to 100,000 Minis there per year from 2014 – capacity at the Mini plant in Oxford is at its limit. BMW models could be added to the production line-up in the Netherlands in the years ahead, although for now we believe this plant will be allocated to Minis only.
The change in the market towards premium brands is evident in the continued expansion of the product ranges offered by the German brands Audi, BMW

EUROPEAN CAR AND LCV PRODUCTION OUTLOOK REPORT November 2013| Page 7
and Mercedes – but it is also evident in the recent announcements of further expansion at JLR in the UK – and the intention of Nissan to add production of its first Infiniti model in Europe in the period covered by this review.
The premium brands, notably JLR, Mini and the Germans, continue to see strong export market demand, especially from North America, China and much of Asia. Demand appears to be holding up well here. The global appeal of premium brands is moreover evident in Nissan’s decision to export its UK-made Infiniti model on a global basis.
While export markets outside Europe may have their own problems and be subject to their own fluctuations, such export markets are generally not open to the European volume VMs; Ford, Opel, PSA, Renault and Fiat tend have their own production facilities in these markets already, making exports of the same or similar (but normally more expensive) European-made models impractical. Fiat and Ford (in LCVs) are trying to circumvent this traditional block on their sales but how successful this strategy will be – especially at Fiat – remains open to debate just now.
In our view, what the current situation suggests is that, in the main, the losers are likely to be the traditional volume brands whose recent and likely future restructuring may only serve to delay their eventual demise. It remains to be seen what format this “demise” might take, as outright closure of a major European volume brand might seem difficult to imagine – some form of corporate realignment, ie merger, is likely however. It is a question of timing.
Production in Russia will be increasingly important Russian production will also help drive future production growth in Europe as a
whole, with c2.6mn units – and quite possibly more – currently scheduled to be made by European, Japanese and Korean VMs in Russia there in 2017-18.
Predicting the volumes to be made in Russia by the international brands remains a challenge for a number of reasons. There is currently an extensive range of CKD/SKD activity in the country, with models from BMW, GM, Hyundai and others assembled by local assemblers – these do not count as full manufacturing for the purposes of this report but over time we expect some or all of these to switch to full manufacturing operations. Secondly, our
analysis covers the Renault/Dacia-based models which will gradually the old Lada models which are not covered. Thirdly, new VM activity is being added to Russia on a regular basis, for example Mazda in Primorsky in the Far East of the country, details of which remain sketchy at best.
As a result of these factors, it is likely that Russian production by the international brands will effectively be at least 0.5mn units higher in the long term, and possibly even higher than this.
As a result, the significance of Russia in determining the future direction for many VMs and suppliers should not be underestimated. In 2013, production in Russia will account for 60% of the net growth in European production.
Although there will be some production growth in 2013 in the UK, Slovakia, Hungary, Turkey and the Czech Republic, some of this will be “cancelled” out by declines at the volume VMs in France and Germany, plus barely unchanged numbers in Spain and Italy.
Changes in the geography of vehicle production Although there will be broadly stable production in Germany and some
production growth in the UK, Czech Republic, Slovakia, Hungary and Romania, to some extent this is “cancelled” out by declines at the volume VMs in France and Italy, as well as recent slowdowns in production in smaller markets, i.e. Belgium (as Ford’s production cutbacks there begin), Poland (which is hit by declines at Fiat and Opel) and Slovenia (Renault).
Through to 2018 France will see some recovery – from an expected 1.84mn in 2013 – to 2.1mn in 2018; however, this will be much lower than the peaks in 2007-8 and indeed below the level of French production in 2010-11; similarly, Italy – even with the new models from Fiat – will see long run production below 900.000, well below the 1.2mn produced in 2007.
Interestingly, Spain is likely to see its 2018 production volume – at 2.6mn – back to close to its 2007 level of 2.76mn. This reflects investment plans and production allocation by several VMs; the breadth of VMs and their production range in the country is actually a potential strength of Spain.

EUROPEAN CAR AND LCV PRODUCTION OUTLOOK REPORT November 2013| Page 8
Production will also rise in Turkey will rise, reflecting the strength of LCV production there by Ford and the transfer of production to Turkey by Renault; meanwhile Spanish production growth reflects the commitment of VW and PSA in particular to the country – and in the case of PSA, the decision to produce a vehicle for emerging markets in Spain; in addition, Ford is shifting large car production to Spain from Belgium which will help underpin production volumes there.
Clear opportunities for UK suppliers …
As a result of continued production growth in the UK, especially at JLR, Nissan and BMW Mini, there will be a corresponding increase in business to be placed with suppliers. The opportunity for UK suppliers will be significant. The announcement of the new Jaguars which was made at the Frankfurt motor show in September will result in significant new business potential for JLR’s supply base.
UK production is expected to rise in 2013 to 1.6mn units; this will continue in the years ahead. We expect the 2mn units’ barrier to be breached in 2017. This rise in production will mean significant opportunities for suppliers in the UK; JLR has already awarded substantial new contracts for the Evoque, F-TYPE and the new engine plant. In the full report we detail the volumes we expect from the most recently announced models by JLR and explain how these could yet be added to in the years to come.
The value of supply contracts for the Evoque, F-TYPE and the new engine plant will be repeated – and probably exceeded – once the new models referred to above have been fully sourced, although details of the work awarded to suppliers will not be made public for a couple of years yet.
In parallel with the new business from JLR, GM has boosted the UK supply bases through re-sourcing more than £300mn worth of business to the UK. Interestingly, some of this is for export, for supply to GM plants in Germany and Spain. GM has also committed to doubling the UK content of the next Astra and Vivaro from 2015 and is now in the midst of searching out new UK-based suppliers.
Other boosts to the UK supply base come from the centralisation of Auris production in the UK, the continued expansion and widening of the model range made at Nissan, the addition of Mini production at Nedcar and other lower volume models such as the Bentley SUV, production of which has now been confirmed for the UK. All of these developments mean additional business opportunities for the UK supply base.
The rise in UK production from these new models will result in further supply opportunities for UK suppliers, or suppliers willing to locate in the UK. Nissan is still in the process of sourcing suppliers for the new models which will be produced in the next few years; although many sourcing decisions have been made, there should still be opportunities for suppliers for models from 2016 onwards. In addition, the centralisation of Auris production in the UK and the widening of the Mini range, allied to the addition of Mini production at the Netherlands, should represent further opportunities for UK suppliers.
Furthermore, as we have previously stated, it is also worth noting that Ford’s Bridgend engine plant has won the contract to supply the EcoBoost engines for the next Mondeo (and related models), further cementing the role of that factory – and its suppliers – within the Ford manufacturing network in Europe. Ford’s UK engine plants have a worldwide supply role, with engines from Bridgend for example being fitted to Focus cars made in Thailand.
As noted above, JLR is also opening its own engine plant in the UK which will offer significant opportunities for the UK supply base. UK engine production already exceeds 2mn units; it is not inconceivable that 3mn engines could be produced in the UK in the long run.
The UK government and the Automotive Council believe that there are supply opportunities worth at least UK£3bn at UK based VMs; in our view, this greatly understates the potential business open to suppliers to the UK VMs. In fact, we would expect the value of new business which will be placed by UK VMs over the next few years, both on new models and on re-sourcing to UK suppliers if they come to the UK, will be more like double this sum.
Potential investors in the UK will moreover be encouraged to set up operations in the UK to supply the UK VMs by the new Automotive Investment Organisation, a dedicated arm of UKTI, focused on attracting more investment to the UK by automotive suppliers.

EUROPEAN CAR AND LCV PRODUCTION OUTLOOK REPORT November 2013| Page 9
Production Outlook summary and alternative scenarios We continue to reduce the rate and overall volumes for the recovery; last time we projected that Europe, without Russia, would reach 19.7mn units in 2016 in our Base Outlook. We now see this at 19.95mn in 2016, 20.87mn in 2017 and 21.14mn in 20-18. We agree with the general consensus that there will be a long term recovery in terms of European, although we remain cautious.
This caution derives from the fact that a large part of the recovery plans for Ford, Fiat and indeed PSA include export beyond Europe. While exports beyond Europe are well-established at the premium brands, and can be reasonably expected to continue, the volume brands have much less established records in this area. In the case of Fiat and Jeep exports from Italy in particular this strategy is untested and unproven.
Furthermore, the recovery in European production will be somewhat stymied by the increase in production capacity which is being installed outside Europe by the French and German VMs especially – moves such as the production of the Volkswagen Passat in the US will inevitably reduce the export market opportunities for European car plants, reducing their long run output in some cases. New plants built by VW-Audi in North and South America and China and PSA in China are leading the way in this area. These moves and similar moves by BMW and Mercedes in China and Brazil reflect these companies’ increasingly global positioning but also limit the potential for exporting to these markets from European factories.
In addition to our Base Outlook, we provide a number of alternative scenarios which address the implications of greater falls in various markets than in the Base Outlook. Specifically, we look at the implications of deeper falls for a longer time period across the whole of Europe and also a slower recovery. It is, of course, impossible to predict which scenario is most likely, but rather the aim of these scenarios is to highlight the scale of the problem which could face Europe if the current recession is deeper and the ultimate recovery slower and later than we currently expect.
In our Base Outlook, we now European production recovering in the next couple of years, rather than falling steeply now as it did in the 2008-9 downturn. However, in our Worst Case scenarios, we describe the conditions, in terms of markets falling,
which would be a collapse to the levels seen in 2009. In 2009, excluding Russia, European production fell to just under 16mn units.
In the event that 2014 sees a reversal of the recent slowdown in decline and partial recovery, ie we see continued decline and the hoped-for recovery in the major markets fails to materialise and if exports beyond Europe also decline, then a sustained fall in production over the next 2-3 years to below 16mn is not just conceivable, but in fact highly probable. In the worst case scenario, European production could still be as low as c15.7mn in 2016, c16.17mn in 2017 and c16.66mn in 2018: if European production volumes remain at this level for a period of three or more years, it seems inconceivable to us that all the existing VMs could survive in their current forms. Who might actually disappear – or be absorbed within another company in some of industrial restructuring remains a matter for conjecture right now, but something which will need to be considered seriously in the months and years ahead.
The worst of the scenarios we have prepared has the 2018 volume (excluding Russia) – 16.66mn – at nearly 4.5mnmn units down on our Base Outlook. The implications of such a sustained decline would almost certainly be additional plant closures and significant further industry restructuring, possibly including the loss of a major name from the industry, either entirely or through merger with another stronger player.
In our Base Outlook, we do not see European production immediately falling as steeply now as it did in the 2008-9 downturn. In fact we still think the most likely outcome is a slow, steady recovery. However, in our Worst Case scenarios, we describe the background conditions, in terms of markets falling, which would be a collapse to the levels seen in 2009. In 2009, excluding Russia, European production fell to just under 16mn units. We have 2012 production excluding Russia at just over 16.6mn, rising to just over 17.8mn units this year. The start of the recovery reflects the new model programmes which are coming on stream and in particular, will actually start this year, partly due to improved production volumes at Mercedes and BMW, the increase in production at JLR, the strong performance of Hyundai-Kia and the boost given to the market by new crossover B segment models from PSA and Renault.
However, as our alternative scenarios section makes clear, 2013-14 could actually be much worse than 2012. In the event that Q4/2013 and indeed

EUROPEAN CAR AND LCV PRODUCTION OUTLOOK REPORT November 2013| Page 10
2014 see a reversal of the recent upturn and then further decline, (most likely because the much-vaunted recovery in the major markets especially fails to materialise and exports beyond Europe also decline), then a sustained fall over the next 2-3 years to below 17mn is conceivable. The view of most VMs at the Frankfurt motor show and in response to the recent ACEA figures which showed continued decline in European sales is that we have no reached the bottom of the downturn, that the rate of sales decline has now slowed and that further declines are not expected. Time will tell if this optimism is justified or not. There remains distinct possibility that production volumes could indeed remain at the reduced levels as set out in the Alternative Scenarios. In summary, our view is that, whatever the actual decline or slower recovery, the recovery will be slower than was seen in 2010. At this time, there was an immediate bounce-back in 2010-11, largely due scrappage incentives across Europe. Although such schemes could theoretically be reinstated, given European governments’ financial difficulties, we can no longer envisage a repeat of such schemes being especially likely. Spain has however introduced some sales incentives but we think this will be both short-lived and something of an exception. In addition, we have to factor in the impact of unemployment and the associated decline in consumer confidence in some countries, especially Spain and Italy where unemployment continues to rise and disposable incomes are under increasing pressure.
It is worth repeating the point made above, namely that in the worst case, European production will be remain below 16mn until 2016, below 16.2mn in 2017 and not climb above 16.6mn until 2018. Put another way, this would mean European production may not get back to last year’s levels for another 5 years and even by 2018 would still be below the 2008 pre-recession volumes: if European production volumes remain at this level for a period of three or more years, it seems inconceivable to us that all the existing VMs could survive in their current forms. Who might actually disappear is a matter for conjecture right now, but something which will need to be considered seriously in the months and years ahead.

EUROPEAN CAR AND LCV PRODUCTION OUTLOOK REPORT November 2013| Page 11
Demand Side Perspective European sales in decline …
European passenger car registrations fell by 8.2% in 2012 as a whole, continuing the decline in European demand of recent years; this depressing picture has, by and large, continued in the first five months of 2013. For January–May, the regional decline was 6.8% and 5.9% for May alone. The picture for June, for which the figures were released just as this report was being finalised were similar – Europe had seen a decline of 6.6% in H1 and 5.6% in June alone.
Although July produced slightly better results across Europe, with a 5% rise being recorded, by the time the August figures were released, the picture of reversal and decline has returned to the fore. August alone saw a 5% decline across Europe, with the year-to-date decline at 5.2%.
However, September and October saw better figures, with total EU registrations up 5.2% in September and 4.7% in October.
More specifically, in October:
The UK continued its strong performance, up 10.2% for the month and 4% for the year.
France and Germany were up 2.6% and 2.3% respectively in October by were still down 7.4% and 5.2% for the year-to-date
Spain was up 1.1% for the year-to-date and 34.4% for the month of the October – due to sales incentives underpinned by the government. In total the monthly figures were still down, by 8% and the year-to-date numbers were also down 5.6%.
In terms of other markets, there was a mixed picture. Positive results for the year to October included:
Austria (+1.6%), Bulgaria (+11.6%), Denmark (+10.9%), Estonia (+21.5%), Finland (+11.0%), Hungary (+26.7%), Netherlands (+37.4%), Poland (+19.3%), Portugal (22.8%), Slovakia (+37.6%), Slovenia (23.1%) and Sweden (+5.4%).
The other negative markets in October were Belgium, the Czech Republic, Greece and Romania
In terms of the year to date figures, the picture was still largely negative - because of the poor performance of these markets in the early months of the year. Indeed, apart from the UK and Spain, the only markets with positive year to date results were:
Denmark (5.8%), Estonia (+14.7%), Hungary (+6.5%), Poland (+4.8%), Portugal (+8.1%), Slovenia (+4.5%).
The figures so far for 2013 are somewhat more positive than for the full year data for 2012 as a whole which can be summarised as follows:
EU27 registrations were just over 12.5mn, down from almost 13.6mn in 2011.
The UK was the only major market which saw an increase in registrations in 2012, by 5.3% to just under 2.05mn units.
Bulgaria, Estonia, Hungary and Luxembourg also experienced gains in 2012, but all other markets shrank.
Even Germany, so long the engine of growth in Europe, saw a contraction of nearly 3%, while France fell by c14%, Italy by c20% and Spain by over 13%.
In terms of the VMs, the picture for 2012 was also broadly negative, ie:
VW group was down 1.6%, but Audi was up 3.1%.
PSA was down almost 13%, with both Peugeot and Citroën declining by the same percentage.
Renault was down by 22%, while Opel/Vauxhall fell by nearly 16%.
Ford fell by 13% and Fiat by 15%.
At the premium brands, BMW fell by just 0.5%, and Mercedes by 1.8% (note how Audi continued to grow by contrast); Volvo fell by almost 10%.
However, Jaguar-Land Rover did much better, up nearly 26% with most of this growth due to Land Rover which was up 33% year-on-year.

EUROPEAN CAR AND LCV PRODUCTION OUTLOOK REPORT November 2013| Page 12
The picture at the major Japanese VMs was also negative, with Toyota down 3.1%, Nissan and Honda each down by 6.3%.
Hyundai-Kia continued to grow, with Hyundai up 9.4% and Kia up 14.1%.
In terms of January-October figures for the VMs, there were positive results in European registrations for the following:
BMW +0.9%
Dacia +20.2%
Mercedes +6.8%
Kia +0.8%
Jaguar +9.2%
Land Rover +16.6%
SEAT +10.7%
And Skoda +1.2%
Other VMs and brands were negative, such as Volkswagen (-6%), Audi (-2.4%), Ford (-4.8%), Fiat group (-8%), Renault (-3.6%) and PSA (-10.3%).
Light commercial vehicles The picture with LCVs has not been much better – these were down by 13.3% in 2012 across Europe, with all the major markets declining, ie: Germany -6%, UK -8%, France -11%, Spain -26% and Italy -32%.
The negative picture from 2012 has continued in January-March 2013 with total European LCV registrations down by around 10%; the UK actually increased by c11%, but it remains to be seen if this is a real change in fortunes for the sector or just a one-off. France (-9.2%), Germany (-9.6), Spain (-9%) and Italy (-22.5%) all fell between January and May, albeit by lower percentages than in the four months to April, suggesting that the decline in the LCV market is finally slowing.
By the time that figures for the period to June were released, there was still no sign of improvement in the LCV market. June figures were down 4.2% for the month although both the UK (+3.4%) and Spain (+21.9%) saw monthly rises in LCV sales.
Germany was down 6.7%, France down 8.6% and Italy fell by 10.9%. Looking at the first half of the year as a whole, the UK is the only market to show an overall rise, up 11.2%; by contrast, Spain was down 3.8% despite the rise in June; Germany fell 9%, France by 9.1% and Italy by 20.1%. The overall decline in LCV registrations in Europe was 5.9% for H1.
And there was not much improvement in Q3; in terms of year-pt-date figures for the 9M to September:
The market is down 6.1% - although the UK was up by the same percentage
Germany was down 8.9%, France was down 8.4%. Italy was down 14.1% and Spain was down 12.1%.
In fact the only LCV markets, apart from the UK, showing positive results were: the Czech Republic (+7.9%), Estonia (+34.8%), Greece (+26.1%), Ireland (+21%), Lithuania (+1.3% and Poland (+1.9%). The LCV market clearly has a long way to go before it returns to health.

EUROPEAN CAR AND LCV PRODUCTION OUTLOOK REPORT November 2013| Page 13
Production Outlook Overview
Introduction In the previous edition, we extended the Production Outlook to 2018.
As before, although we include the full manufacturing volumes for the European/Japanese/Korean/American VMs in Russia, we do not include the CKD volumes for these VMs in Russia; the CKD numbers are part of the reported figures for individual countries herein. Furthermore, we do not include the indigenous Russian brands (mostly the original Ladas), which are all slowly being replaced by international models (essentially Renaults, Dacias and Nissans).
As a result we understate the number of vehicles assembled in Russia (the CKD volumes in Russia are countered within the production volumes for the countries where the kits originate, ie elsewhere in Europe, Korea, North America, Japan or China. There remains a lack of information to allow fuller coverage of the Chinese VMs; Great Wall has now opened its plant in Bulgaria, while the Chery plant in Turkey, which is a JV with Turkish company, Mermerler, will not actually start production until 2015; when fuller information is available on these VMs we will report on them in detail.
Production fell in 2012 … Owing to disputes over data provision, France still has not released official data at model level for 2012 production, so our figures still have some element of being provisional about them. Official German data is also less detailed than in the past and as a result some of the German numbers may be subject to minor change in due course when more detailed data is accessible. Our total for 2012 European production, including Russia, is just under 18.2 units. Without Russia, we record Europe in 2012 at just over 16.6mn units, down almost 1.75mn down on the c18.38mn units total for last year. For 2013, we now expect a modest recovery to c18.97mn units, including Russia, compared to 18.66mn units which we projected last time. This increased total is indicative of the stronger signs of recovery which are now evident compared to our last report. Moreover, we have Europe without Russia growing to just over 17.8mn units which
an improvement on last time (17.4mn – again reflecting better than expected performances of some new models). In fact we now think that 2013 will see Europe, excluding Russia, recovering almost 2/3 of the losses it experienced in 2012. More specifically, we see the 2013 revival occurring as follows: Spain (+230k), mainly due to better than expected performances from Ford
and Citroen Germany (+130k), with slow and steady improvement mainly at the premium
brands Romania (+100k), due to the new Dacia Logan/Sandero range coming on
stream, plus the Ford B-Max, albeit at lower volumes than originally expected Serbia (+100k), where the new Fiat 500L and variants based on this new
model are now in production Morocco (+90k), with the new Dacia Dokker and Lodgy models in their first full
year of production Turkey (+70k), with Hyundai i10/i20 and various models from Renault and
Toyota contributing strongly. UK (+60k), with the growth coming from JLR and the new Toyota Auris; a
boost in Q4 may be expected with the new Mini. By contrast, 2013 will see declining production in France, Belgium, Italy, Poland, Portugal and Slovenia. In summary, bulk of the growth in Western/Central European production will come from the premium brands in particular. PSA’s emerging markets models made in Spain and the continued growth of Dacia, partly because of the addition of production in Morocco (which counts within “greater” Europe for the purposes of this report) show that there is a strong market, in Europe and beyond, for value brands/products. The continued weak economic outlook, lack of consumer confidence (the UK’s current boom in car sales notwithstanding) and the progressive shift of production from Europe to China and the US at several VMs, means that we still have to sound a note of caution. Although the economic figures in the UK are better than expected of late, the recovery is not secure across Europe and we continue to produce our scenarios looking at what might happen if the recovery stalls and export markets go into reverse.

EUROPEAN CAR AND LCV PRODUCTION OUTLOOK REPORT November 2013| Page 14
Certainly Fiat, Ford, Opel, PSA and Renault have given us much cause for concern in 2012 – and this has not been entirely dissipated of late.
2012 versus 2011 Looking at 2012 versus 2011 in particular we can note specifically:
Fiat, which lost c158,000 units in 2011 over 2010, saw a further fall of around 187,000 to just over 1.03mn units in 2012, despite the new Panda, continued strong production of LCVs and the arrival of the new 500L series. Delays in the launch of various models, including variants of the new 500L range and the decision to drop the Bravo replacement did not help. The situation was worsened at the group level by delays to various new Alfa models and associated delays to the equivalent Chrysler or Jeep versions. (The situation at Alfa in terms of new model launch times has still not been resolved and in the detailed numbers in the Outlook we have put Alfa’s growth to at least 2015: it could well be later than this.)
As a result of the economic situation and these programme delays, we do not expect Fiat’s recovery in production to reach a significant level until 2015 for the group and 2016 for the Fiat brand in particular. Moreover, as we have noted before, this recovery will be at least partly contingent upon US consumers accepting European-made models (especially those made for sale under the Jeep brand), production growth at Fiat’s Turkish affiliate Tofas, and production in Russia, at an all-new plant, being a success. Fiat is also in the midst of reorganising the allocation of production between its Italian factories, although the full implications of this change will not be felt for some time. Fiat has suggested that it wants to make around 150,000 small (B-segment) SUVs for Jeep in its Italian factories for global sale, but especially in North America. This total, alongside the proposed 130,000 small SUVs for the Fiat brand, seems optimistic to us and we have projected somewhat lower numbers for both brands in the Outlook.
Ford, which we estimate to have been down by c209,000 units in 2012 over 2011. This decline was largely due to the slowdown in production of its large models made in Belgium, the Fiesta (ahead of this an imminent facelift and then an all-new model in the next couple of years) and delays to new models expected to be made in Romania.
Ford also intends to make a major push with its LCV range, widening its range to include small vans which will be sold under the Transit brand; Transit is intended to be transformed into a global brand in its own right, with a range of models bearing the Transit name. The bulk of the growth in Ford production projected at the end of the period covered in this Outlook comes from increased LCV production in particular, as well as a general rise in production in Russia, as opposed to a significant rise in passenger car production at its traditional European operations.
GM Opel/Vauxhall, which lost just over 40,000 units in 2011 compared to 2010, saw a further fall of around 260,000 units in 2012, with this loss spread across most of its model range. The expectation is that Opel/Vauxhall volumes will continue to fall for the next two years ahead of the new Astra and Corsa which are due from 2015 onwards. The replacement Zafira and all-new Insignia follow soon afterwards (a heavily revised and updated Insignia was shown at the Frankfurt show but this was not a completely new model). The recently launched Adam and Cascada will help ameliorate the general decline, as will the Insignia facelift, but these are not high volume models and Opel/Vauxhall needs its new volume models sooner rather than later to help it recover its production volumes to any appreciable extent.
We have noted in previous reports, the model cycle timings of the Opel/Vauxhall range could not have been timed worse as they have coincided with the deepest trough in the current economic downturn. GM has cut into its cost base by confirming it will close Bochum – and has in fact brought this closure forward to 2014. The financial benefits of this move and the alliance with PSA will, however, take some time to be fully evident.
The company is embarking on a new strategy, Drive! 2022, which will see the model range extensively overhauled in the next few years. GM management in the US is backing its beleaguered European operations, so perhaps Opel/Vauxhall will be able to turn around its fortunes later in the decade. Press reports that PSA would be sold to GM – or at least GM would take an increased stake in PSA and direct its strategy – have been strenuously denied by both sides and we certainly do not expect any closer association between PSA and GM in the near future. GM executives have made it clear that the task facing both companies in the near future is to make sure the currently planned joint programmes come to fruition.

EUROPEAN CAR AND LCV PRODUCTION OUTLOOK REPORT November 2013| Page 15
PSA, which was stable in 2011 over 2010, is estimated to have lost around 360,000 units in 2012. Earlier in the year, we had expected that it would see a further c50,000 unit decline in 2013; however, the greater than expected success of the 301 and C4 Elysee (models made in Spain emerging markets) and similar success of the 208/ 2008 mean that we now expect PSA to experience a small rise in production this year from 2.018mn to 2.049mn units; however, PSA’s position remains challenging as much of its model range is heading into the downward phase of model cycles and facing tremendous competition in very difficult economic times. Like Opel/Vauxhall, we do not expect to see any significant benefit from the GM-PSA alliances until much later in the decade, most probably after 2017 by when the first jointly developed models should have appeared.
Although PSA has stopped the decline in its volumes, its “recovery” will be modest at bestir and we still do not see it getting back to 2007-8 production volumes – the pressure to close more than one factory in Europe (ie in addition to Aulnay) may well become stronger. We think that there are likely to be further changes to PSA’s production arrangements once the GM alliance moves into all-new model programmes, but on balance, these are unlikely before 2016/7. As noted above, in the GM section, we expect the companies to focus on making their current plans work before embarking on a further round of alliances
Renault: although group production, including Nissan and Dacia, is largely on an upward curve, at Renault itself the reverse is true in the last couple of years; we estimate Renault to have lost around 204,000 units in 2012. We expect Renault to lose another 80,000+ units in 2013. By contrast, Dacia continues to go from strength to strength, adding c60,000 units in 2012. Nissan meanwhile saw another record production year in the UK.
In comparison to the volume brands, most other brands were either stable in 2012 or saw modest increases in production. The Volkswagen brand saw a small rise in production volumes, of around 62,000, largely on the back of the new Golf, while SEAT also saw a rise in production of c26,000, but this was actually due to the Audi Q3 which is made at SEAT in Barcelona. BMW/Mini also saw a modest rise in 2012 production, due to rising Mini output. Audi actually fell somewhat in 2012, 2011 having be an unusually high year.
We now turn to a brief commentary on how we see 2013 turning out for the major
VMs:
Summary of 2013 projections: BMW will be up around 125,000 with improved performance at both BMW and
Mini
Daimler will be up around 140,000 due mostly to strong performances from the variants on the A-class, eg the CLA
Fiat is up very slightly but by only c33,000, one-third of which comes from Maserati’s expanding model range; we don’t see Fiat really improving until 2015 when the 500X comes on stream
Ford will be up c50,000, partly due to models made in Spain doing better than expected
Opel/Vauxhall continues its decline by just over 60,000, reflecting the age of its models; as noted before, until the next Corsa and Astra come on stream we do not see much material improvement for the Opel/Vauxhall brands in Europe.
Hyundai-Kia is up slightly, mostly due to the i10/i20 in Turley.
PSA improves somewhat this year following new models like the 2008 and the emerging markets models made in Spain – however, this is likely to be a short-lived phenomenon with the Peugeot brand especially expected to decline somewhat in the years ahead. Citroen will do better with the expanded DS range.
Renault will decline slightly as its main volume and large cars continue to age; the success of the Captur B segment crossover provides some modest relief ahead new models coming on stream from 2015. Nissan grows slightly while Dacia grows strongly due largely to the new plant in Morocco coming on stream and some growth in Russia.
Tata-JLR will have an especially strong 2013, with both Jaguar and Land Rover experiencing strong growth. We don’t see much growth in the next couple of years at JLR – but once the new range of Jaguars and Land Rovers, as presaged at the Frankfurt motor show this year, come on stream, from 2015 onwards, JLR will see very strong and rapid growth as its range expands.

EUROPEAN CAR AND LCV PRODUCTION OUTLOOK REPORT November 2013| Page 16
Toyota is on an upward curve now, partly because of an expanded range in Russia and also the new Auris/Corolla/Verso range produced in the UK and Turkey.
Volvo is expected to be broadly stable this year and will actually fall slightly next year as model changeovers take place – from 2015 however several models on the new SPA platform come on stream and will give the brand a strong boost in production.
The VW group has had a generally better year than 2012 but the most successful brand in production terms is likely to be Skoda, mainly because of the Rapid/Seat Toledo.
Turning now to the country picture, we look at the main vehicle production countries in alphabetical order:
o Belgium: Having seen over 851,000 vehicles made there in 2007, production has fallen steadily since then to just o490,000, owing to declining production of the large Fords and the older Volvo models made there.
o The one bright spot in Belgium is the Audi plant which will produce over 200,000 upa by the end of our Outlook period. However, this will not stop the long-run decline in Belgian production which will now take place following the decision by Ford to close its Genk factory.
o Production in Belgium will now settle back in the range 450,000 upa and will rely on Audi and Volvo for any future growth. The recovery at the end of the period covered here reflects the expanded range which we expect to be produced by Volvo on its CMA platform from 2016 onwards.
Czech Rep.: production climbed to over 1mn units for the first time in 2010, a level which was sustained in 2011 and 2012. The country has benefited greatly from the success of Hyundai and Skoda which have more than compensated for falling production at the PSA-Toyota JV. We expect Skoda and Hyundai to continue to grow, while the PSA-Toyota JV will produce a new model in the near future – on the back of this, we have a broadly positive outlook for Czech production, expecting it to exceed 1.3mn upa by the end of the period covered by this report. If Hyundai invests further at Nosovice, as we expect it will, then the 1.4-1.5mn upa level could be reached and indeed surpassed by the end of the decade or in the 2020s for sure.
France: production reached c2.25mn units in 2011, following two years of growth; despite the rise in production in 2010-11 (after the collapse in 2009), the 2011 total was still some way off the 2.5mn units in 2008 and the 2.9mn units of 2007. However, 2012 saw a steady fall in French production to just under 2mn units, a low point for many years, a fall of 268,000; this fall is in spite of the benefit of the new Peugeot 208, the new Yaris, revised Smart and the EVs from Renault. Moreover: o We expect France to remain below the 1/9m level from this year until
2016, after which point we expect a climb up above 2mn pa once again. o There will be a revival in French production from 2016, but with Renault
increasingly orientating itself towards Russia and other emerging markets, following PSA’s lead, we do not expect French production to climb back once again to past levels.
o Renault has announced a renewed commitment to production in France, but to a large extent this will only partially make up some of the recent losses in production and will not fully compensate the country for the loss of PSA production and earlier overall decline. There is, moreover, no cast-iron guarantee that Renault’s targets for increasing production in France will be successful; we think these are optimistic ambitions in any case and will depend on the success of other brands, not just Renault. Renault is going to make Micras for Nissan and will continue to make small vans for Mercedes, but we remain to be convinced that these contracts will be sufficient to make up for the loss of production of other models, especially the Clio which is moving increasingly to Turkey.
o As a result, we now expect France will actually fall behind Spain and will also face a challenge from the UK in the battle for 2nd, 3rd and 4th spots in the EU country rankings behind Germany. In fact we expect the UK will over take France from 2016 onwards.
o By the end of the Outlook period, we expect production in France, still at just over 2.1mn, will be around 807,000 units down on the 2007 level, reflecting already planned production shifts by PSA and Renault to Slovenia, Slovakia and Turkey, political pressures from the French government and Renault’s recent renewed commitment to French production notwithstanding.

EUROPEAN CAR AND LCV PRODUCTION OUTLOOK REPORT November 2013| Page 17
Germany: although 2011 saw German production climb to almost 6.13mn units, it fell to just over 5.61mn in 2012; following the new Golf and other models at the premium brands having a strong performance in 2013, we now expect a rise to 5.75mn in 2013, a slightly lower 5.7mn in 2014 and then 5.8mn in 2015 as new model programmes settle down. We now expect Germany to reach 6mn units again in 2018.
The fall in 2012 in German production was attributable to a number of reasons, including: o A large part of 2011 production was actually for “brought forward demand”
attributable to temporary scrappage schemes and to meet the initial burst of recovery demand from North America in particular.
o Failing short-term production of several models which are due to be replaced in the next 2-3 years, eg Mercedes C-class, Ford Fiesta, Opel Astra, and the Volkswagen Passat/CC.
o A shift of some production away from Germany, with the Passat already being made in the USA as well as Germany, and the Mercedes A- and B-class seeing some production moving to Hungary. Audi will move production of the Q5 to Mexico and BMW will make all its X series models from the X3 upwards in North America rather than Europe.
o A general decline in production in Germany by Opel and Ford. However, 2013 and 2014 will see the loss of 2012 fully recouped; moreover,
o By the end of the period covered by our report however, we expect production to have climbed back towards 6mn upa, reaching 5.9mn in 2017 and 6m in 2018, with a series of new models boosting production.
o The continued importance of Germany to European vehicle production will remain. All the principal German brands will remain focused on producing vehicles in Germany, although the capacity installed by the premium German brands outside Germany is also increasing.
o Daimler has started full-scale production at the new Mercedes plant in Hungary; and BMW has said it will establish full manufacturing in Russia, although this will almost certainly be after the time period with which this report is concerned; Daimler has established a van production JV in Russia, but has said it will not build a car plant there for the time being. BMW has committed to a new plant in Brazil and Mercedes is expected to
increase capacity there in the near future as well. o Audi has expanded production capacity in Neckarsulm in Germany and at
Gyor in Hungary and it is now building a factory in Mexico with production of the Q5 starting there in 2015. It worth repeating the comment made in previous reports that one of the reasons for the expansion of BMW and Mercedes production outside Germany has largely been undertaken in order to free up capacity in Germany and to allow the German factories to produce a wider range of models.
o VW, BMW and Mercedes are all expanding the production ranges in the US and China – and this trend will undoubtedly continue in the years ahead.
Hungary: for some years, vehicle production in Hungary had been limited to Suzuki and a small volume at Audi. However, we will now see a steady rise in production in Hungary in the years ahead. Audi is adding capacity to allow production in Hungary of more than 100,000 upa (for the A3 sedan primarily) and Mercedes is producing some of the new A- and B-class programmes in an all-new plant in the country. We expect the 208,000 units made in 2011 to double by 2016 (slightly later than expected before) and then climb to nearly 460,000 upa by 2016-17, with the bulk of this growth coming from Audi and Mercedes. Suzuki’s renewed commitment to its Hungarian operations, announced in late 2012, should see even more production growth later in the decade, but we need further details on the company’s plans before commenting in greater detail here. If Mercedes can bring its expanded capacity on stream sooner than expected and accelerate the new model programme associated with the factory, then the 0.5mn units barrier will be breached sooner rather than later
Italy: just as France saw a fall from its 2007 peak, so has Italy experienced a similar fall in production. Vehicle production in Italy was over 1.2mn units in 2007, but it fell steadily every year until 2011 when production was just over 751,000 units. This decline continued in 2012, with full year Italian production at c632,000 confirming the scale of the fall. We expect production to fall again to 626,000 in 2013: o Reduced production volumes have coincided with a series of major
reorganisations at Fiat, the closure of one plant (in Sicily) and extensive negotiations with the unions about improving the efficiency and cost base

EUROPEAN CAR AND LCV PRODUCTION OUTLOOK REPORT November 2013| Page 18
of its Italian operations. The reduced production volumes at Fiat in Italy have been such that total vehicle production in Italy is now running at a total below that achieved by Nissan UK on its own.
o The details of the latest reorganisation were provided in the Foundation report from January, but the key aspects are that: Pomigliano remains production site for the Panda and is likely to be
the production site for the Pandona, the anticipated Panda-based replacement for the Punto.
Melfi will make small SUVs for both Fiat and Jeep. Cassino will make mid-size/compact Alfa Romeos and possibly some
Chrysler versions. And Mirafiori will make a range of other Alfa Romeos and a new set
of Maserati models, although the timescale for the Alfa models in particular remains uncertain
o The full effect of these new manufacturing arrangements has yet to be seen, - and indeed their implementation may be delayed owing to financial restrictions at Fiat ahead of the full takeover of Chrysler being completed. However, our initial assessment is that they will not arrest the long run decline in Fiat production in Italy; accordingly, we do not see Fiat volumes in Italy climbing above 1mn again during the period covered by this report. We now project these as peaking at around 880,000 units by 2018. However even reaching this number assumes success for the B-SUVs, Pandona and Alfa models – and is somewhat lower than projections provided earlier in the year
o In fact such has been the slowdown at Fiat and so significant have the various delays to new models been that we now expect a decline in production in Italy in both 2013 and 2014, to 626,000 and 590,000 units respectively. We do not expect a recovery in production in Italy until 2015 at the earliest.
Poland: here production reached its peak in 2008 when nearly 930,000 vehicles were made; since then production has fallen, and we expect this fall to continue in 2013-14, especially in the absence of further commitment to its plants there from Fiat, VW and GM. Production in 2014 will be in the region of 555,000. The real cause of falling production in Poland is Fiat which has transferred production of the Panda to Italy and which we expect will lose the
Ford Ka volumes in the next few years as well: Fiat will bring some production (of the 500) back from Mexico when the new 500 model goes into production, alongside a smaller City car version; even so, this expanded 500 range is unlikely to compensate fully for the loss of Panda production, and indeed the loss of Opel Zafira production. Poland too has seen total production volumes fall to below that achieved by Nissan UK alone, although with the next Astra and other new models coming on stream the country is well positioned to experience a revival in production in the later years of the decade. However, production in Poland will, like that in Italy fall for the next couple of years before recovering from 2015 onwards. Additional Opel production later in the period covered should mean Polish production will once again climb above 800,000 upa.
Portugal: here production fell from just under 168,000 in 2007 to just under 149,000 in 2010, but rose again in 2011, to c183,000 units – although we now expect it to fall steadily over the next few years and we n140-150,000 upa. The increase in Portuguese production in 2018 will be due to a replacement for the Sharan/Alhambra MPV expected at this time.
That said, in the long term, it would not be surprising to see PSA close its Mangualde plant and it is not inconceivable that Volkswagen could consider re-allocating its own production in Portugal to other group plants at some point in the future. Certainly, we do not expect the VW to produce as many sports cars in Portugal as in recent years and while we expect the VW Sharan to have a good couple of years with the all-new model, we see volumes here falling; the best days of the large MPV segment are arguably behind it.
Romania: like Hungary, this country should see a rise in production volumes in the coming years. The Dacia factory has reached close its capacity, while the country has finally seen Ford producing its first all-new model – the B-Max – here. The B-Max was due to be produced at a rate of c100,000 upa from 2013, but production volumes will be below this target; moreover, we no longer think that Ford will add a second model here within the period cover by the Outlook. Sales of the B-Max in 2013 have been disappointing and a number of down days have been scheduled for the factory in the last four months of the year. Ford had said it would add a second model to the Romanian plant, but it would appear that this programme has been delayed, indefinitely for now. The continued popularity of Dacia range and Ford’s reduced volumes suggest that

EUROPEAN CAR AND LCV PRODUCTION OUTLOOK REPORT November 2013| Page 19
annual Romanian production will be in the region of 420-450,000 upa, depending on the stage in various model cycles. The Dacia plant is understood to be close its full capacity – this has led Renault to build a second Dacia factory in Morocco to supply Europe and the near East.
Serbia: ahead of the recent European economic “crisis”, Fiat agreed to take on the former Zastava plant in Serbia and received significant EU, Serbian government and EIB support. Its initial plans are to make a series of small 5- and 7-seater MPVs based on the Fiat 500 platform. We had also expected this plant would also make a version of the Uno (project 326) which is being made in Brazil, but we now think this has been delayed.
This plant was due to make as many as 180,000 500L and variants this year, but production targets have been lowered, to a maximum of 140,000 units this year. Once all the variants have been launched, and assuming there is no global collapse, it is possible that future production could well exceed 200,000 in the second half of the decade depending on which models (eg the 326) are allocated to this plant. However, for now we have the maximum volumes coming out of Serbia at 150,000 upa. Whether Fiat would have taken on this plant had it been able to foresee the state of the global car market by 2012 is an interesting question – almost certainly the 500L could have been made in Poland or at one of the under-utilised plants in Italy.
Slovakia: production here continues t rise, or remains on the up – due to the Volkswagen Up! and its sister models from SEAT and Skoda. In 2007, production in Slovakia was just over 538,000 and after falling in 2008-9, was back to the 2007 level in 2010. In 2011, with growth at Kia (due to the Sportage and continued success of the cee’d), and the new Touareg at Volkswagen, output climbed to nearly 578,000 units:
On the back of this, and full year production for the Volkswagen Up!, 2012 production is estimated to have risen to over 846,000, up c268,000 units, the bulk which was due to the Volkswagen Up! and its SEAT/Skoda versions. The expansion in this range, the expected continued success of Kia and the widening of the Audi SUV range will all help to push Slovakian production towards 950,000 upa by 2018, similar to the level projected previously. By the end of the decade, production could conceivably climb above 1mn upa, or sooner – depending on the success of variants of the Up! which are due to be introduced, such as the proposed Audi Q1.
Slovenia: here there is just one factory, owned by Renault. Production fell in 2012 and will remain at a similar level this year owing to poor sales for the Twingo and the cutting of one shift; it will take the new Twingo and Smart derivatives from 2014 for production to recover to around the 190,000 upa level. Without the JV with Daimler/Smart underpinning production here, we suspect this plant could well have been deemed superfluous to Renault’s needs. However, having invested heavily to produce the new Twingo and Smart four-seater, there would be little to be gained from closing this plant and moving production elsewhere.
Spain: production in Spain was just over 2.75mn units in 2007, after which point it fell in 2008 and 2009; there was a recovery in 2010 on the back of increased production to meet small cars for the various European scrappage schemes. However 2011 saw a slight fall and 2012 saw a further fall to c1,939,000, a fall of c415,000 units. 2012 saw falling production at most VMs in Spain. Despite the generally negative picture for the Spanish economy as a whole, the outlook for vehicle production in Spain is actually very positive and we expect Spain to see production rise to around 2.3mn units through the latter years of the decade.
More specifically:
o 2013 should now see a recovery to 2.17mn units, with output from Ford and PSA boosting the hitherto negative picture and production volumes much more than had been expected
o Similarly, VW’s Pamplona plant is expected to produce a wider range of models based on the Polo, including a small MPV (the SUV we had expected is now expected to come VW Brazil), VW has also committed to investing c€800mn in Pamplona for the new Polo and various derivatives to be made there over the next five years.
o Meanwhile Ford has allocated a number of new models to Valencia, ie the Mondeo/S-Max/Galaxy which will move from Genk from 2014 onwards; the C-Max will in turn move from Spain to Germany. We had expected production of the Kuga also to move entirely away from Spain, to Russia and the USA, but we now expect some Kuga production to remain in Spain.

EUROPEAN CAR AND LCV PRODUCTION OUTLOOK REPORT November 2013| Page 20
o We expect Fiesta production to be concentrated in Germany; on the one hand this will lead to a direct reduction of production in Spain, but Ford Spain will become the centre of large car production for Ford in Europe.
o Opel has made Zaragosa as the lead Corsa plant and sole source for the Meriva; it will also continue producing the Meriva, despite the imminent arrival of the Mokka. The next Meriva will share the same platform as replacement B-MPV models from PSA. Production of the Meriva and its Citroen counterpart has been confirmed for Zaragosa – one of the few definite successes of the PSA-GM alliance in action.
o PSA is expecting to see a rise in production at Vigo, possibly to 440,000 units this year, following the success of the 301 and C4 Elysee – we think this may be a somewhat overoptimistic target, but certainly some production growth at PSA Spain is expected – we have the Vigo production volume for 2013 at under 420,000 units.
o In addition, Renault has pulled back from the possible closure of the Valladolid plant which will be the sole plant for the new Captur. We understand that there will also be Samsung version of the Captur for export to Korea. At the end of last year, Renault Spain also confirmed the long term future of the Palencia plant, as well as investment in its engine and transmission parts factories in the country. Renault will not, it appears, close a plant in Spain.
o Production in Spain will be sustained by the Volkswagen Polo, strong LCV/SUVs and Pick-up production by Nissan and the decision by PSA to allocate their emerging markets C-segment vehicle to Spanish production, at its Vigo plant. The decision by Renault to invest in Palencia will also help underpin production in Spain.
o With new models coming to Spain and the renewed commitment to country by al the VMs there, we now expect production in Spain in 2018 to climb back to ward 2.6mn, ie around 150,000 units lower than it was in 2007; this is better than we had expected earlier in the year and for now we believe no plants will close in Spain, assuming the models planned for the country come to fruition and are successful..
Sweden: here vehicle production will be much lower than in the past in the short term, by the end of the period covered here we expect it will climb to
c330,000 upa, ie close to the 2007 level when Sweden produced just over 340,000 vehicles. However, this fell to just under than 189,000 in 2011; we have 2012 showing a further fall to 163,000 and with the success of the S60./V60 and continued popularity of the old XC90, we expect to see a broadly stable production volume in 2013 of c161,000. This will be followed by a strong model-led and export-led recovery from 2015 – when the new SPA platform models will begin to be in full production. One variable will be the split of production between Sweden and Belgium for the S60: Volvo has configured its factories so that both can make the model according to the demands for other models at each factory.
Turkey: here, apart from a dip in 2009 and 2012 when production fell, respectively, to just under 850,000 and just over 985,000 units, production has been around 1-1.1mn upa in recent times. Model life cycle effects and the general economic uncertainty meant a slight fall in production in 2012 (which is likely to be recovered in 2013), but the new Chery factory and the new Renault Clio should give production a boost to 1.4mn by 2016 and nearly 1.5mn by 2018. This total will be underpinned by the new Ford Transit and the new Ford small van from 2014. All being well, we expect production in Turkey to settle down at around 1.4-1.5mn upa for the remainder of the decade.
UK: production here fell significantly from 1.72mn units in 2007 and 1.62mn units in 2008 to only 1.075mn units in 2009; 2010 and 2011 were excellent recovery years for UK vehicle manufacture. Production was around 1.44mn units in 2011, and 2012 saw output rise again to 1.56mn units. The positive picture at JLR, Nissan, Mini and Toyota means we now expect 2013 production be over 1.6mn, 1.65mn in 2014; we think the next boost to UK volumes will come in 2015, with the new JLR models coming on stream, along with the next Astra – we project 2015 will be around 1.77mn, rising thereafter to 1.98mn in 2016, before breaching the 2mn upa barrier in 2017/18; the timing of this barrier being breached will depend on model timings for Jaguar Land Rover in particular; the announcements at the Frankfurt motor show concerning the new Jaguar models mean we are even more confident than before that the 2mn upa barrier will indeed be breached in the near future.
Finally, we have to consider Russia:
Here we only cover the international brands which have full manufacturing operations in Russia. Back in 2007, just 170,000 vehicles were made on this

EUROPEAN CAR AND LCV PRODUCTION OUTLOOK REPORT November 2013| Page 21
basis, mostly the Ford Focus and the Renault Clio which was made at Avtoframos. Since then, VW has opened a plant at Kaluga, Ford has added the Mondeo and is expanding its manufacturing line-up in Russia, especially through its JV with Sollers; GM has opened its all new plant at St Petersburg and several other VMs have also started full production in Russia. GM and VW have also established JVs with GAZ, while Fiat is opening its own plant, backed by the Russian bank Sberbank, although its production volumes will be somewhat lower than originally suggested.
Toyota and Nissan have relatively small operations and they have been joined by PSA and Mitsubishi with their JV which started as a CKD operation but which is being transformed into a full production unit and Nissan has committed to expanding production in Russia, with the new Almera to be joined by the Qashqai in the next few years. Nissan will also produce models from its “rising markets” brand Datsun in Russia from 2014 and Toyota has confirmed it will add the RAV4 SUV to its production line-up in the near future too. Suzuki will soon open a plant, and Honda will do the same in the near future; even Mazda should have an operation of some form in Russia in the coming years. Both Nissan and Toyota have invested in new press and large injection moulding facilities in Russia to bring these plants into line with capabilities at its other plants around the world.
Hyundai has opened a brand new plant capable of making 300,000 vehicles and is well on the way to utilising this capacity. However, the biggest change in Russia involves Renault/Dacia models being made at AvtoVAZ, the manufacturer of Ladas. In 2012, Renault-Nissan took effective management control of AvtoVAZ.
Together, these developments mean that in 2012 around 1.1mn foreign brand cars were made in Russia by these international brands – and by 2018 the total will exceed 2.6mn units and could quite possibly be higher than this. Much will depend on whether some of the current CKD operations in Russia become full manufacturing operations sooner than planned and also on the actual rate at which the old Ladas are replaced by new models based on the Dacia Logan platform.
Increasing Russian production will clearly underpin European production growth; moreover, for suppliers this means that the need to follow the VMs to Russia is even more pressing than it has ever been. The importance of
Russia to European production became especially evident in 2011 when production of international brands there climbed over 800,000; in 2012, the 1mn units barrier was breached this total is rising steadily; we expect the 2mn barrier for international brands’ production to be reached in 2015.
In terms of the overall European picture, our views are as follows:
We project European production including Russia as rising from c18.2mn in 2012 to c21.17mn in 2015 and just under 23.8mn in 2018. The situation in Europe is shown on the following pages in graphical and tabular formats.

EUROPEAN CAR AND LCV PRODUCTION OUTLOOK REPORT November 2013| Page 22
European Production Outlook to 2018, by VM and major brands – Base Outlook Group Marque 2007 Production 2008 Production 2009 Production 2010 Production 2011 Production
Production Outlook 2012
Production Outlook 2013
Production Outlook 2014
Production Outlook 2015
Production Outlook 2016
Production Outlook 2017
Production Outlook 2018
BMW BMW 1,097,076 988,949 874,520 973,046 1,028,700 1,024,525 1,133,500 1,196,000 1,213,250 1,212,000 1,278,300 1,318,900BMW MINI 237,709 235,019 213,670 241,043 294,117 307,291 323,650 352,100 392,200 405,650 413,900 390,700BMW Rolls Royce 1,009 1,247 870 3,215 3,685 3,234 3,100 2,950 3,150 3,300 3,500 3,650BMW ALL 1,335,794 1,225,215 1,089,060 1,217,304 1,326,502 1,335,050 1,460,250 1,551,050 1,608,600 1,620,950 1,695,700 1,713,250Daimler Mercedes‐Benz 1,279,654 1,202,414 924,352 1,207,929 1,254,072 1,258,219 1,395,500 1,445,950 1,463,000 1,419,050 1,416,750 1,396,750Daimler Smart 102,660 139,964 115,469 97,435 103,560 103,000 99,000 105,000 120,000 117,500 108,000 105,000Chrysler Chrysler 41,811 12,926 2,146 3,002 0 0 0 0 0 0 0 0Chrysler Jeep 29,213 16,781 3,230 2,495 0 0 0 0 0 0 0 0Daimler Maybach 320 317 205 157 200 190 0 0 0 0 0 0Daimler & Chrysler 1,453,658 1,372,402 1,045,402 1,311,018 1,357,832 1,361,409 1,494,500 1,550,950 1,583,000 1,536,550 1,524,750 1,501,750Fiat Fiat 1,483,731 1,433,011 1,438,865 1,376,723 1,217,989 1,031,210 1,062,000 1,017,500 1,258,250 1,372,250 1,445,750 1,468,500Fiat Alfa Romeo 151,499 109,428 104,022 120,068 136,121 92,053 86,300 78,750 82,000 143,900 207,150 227,400Fiat Lancia 117,864 113,298 113,796 97,963 108,172 75,183 74,250 68,750 60,500 45,000 36,500 65,000Fiat Chrysler/Jeep 0 0 0 0 0 0 0 1,000 15,000 25,000 30,000 33,000Fiat Ferrari 6,561 6,722 6,213 6,627 7,314 7,663 7,850 7,400 7,700 8,000 8,250 8,500Fiat Maserati 7,669 9,294 4,041 5,842 6,161 6,204 15,250 28,950 53,250 61,500 64,250 57,500Fiat ALL 1,767,324 1,671,753 1,666,937 1,607,223 1,475,757 1,212,313 1,245,650 1,202,350 1,476,700 1,655,650 1,791,900 1,859,900Ford Ford 1,920,173 1,842,089 1,470,319 1,557,907 1,555,274 1,330,101 1,379,250 1,463,000 1,655,000 1,725,500 1,811,500 1,850,000Ford Volvo 488,756 356,748 294,108 202,379 0 0 0 0 0 0 0 0Ford Jaguar 53,812 0 0 0 0 0 0 0 0 0 0 0Ford Land Rover 232,548 0 0 0 0 0 0 0 0 0 0 0Ford Mazda 14,235 0 0 0 0 0 0 0 0 0 0 0Ford ALL 2,709,524 2,198,837 1,764,427 1,760,286 1,555,274 1,330,101 1,379,250 1,463,000 1,655,000 1,725,500 1,811,500 1,850,000GM Opel 1,653,800 1,409,681 1,084,126 1,234,783 1,191,427 929,340 868,700 826,250 855,500 985,750 1,125,500 1,233,500GM Excludes kits assemb 103,266 156,587 65,240 183,087 204,110 269,355 231,500 278,000 357,000 384,000 373,250 359,000GM Saab/Cadillac 119,912 86,480 20,685 1,482 0 0 0 0 0 0 0 0GM ALL 1,876,978 1,652,748 1,170,051 1,419,352 1,395,537 1,198,695 1,100,200 1,104,250 1,212,500 1,369,750 1,498,750 1,592,500Honda Honda 263,435 280,516 93,847 150,103 109,800 188,130 163,600 162,250 176,000 180,000 196,250 201,250Hyundai‐Kia Hyundai Turkey 90,190 80,682 52,082 75,495 91,866 90,878 113,250 187,500 213,750 223,250 229,250 217,000Hyundai‐Kia Kia 156,465 200,823 160,182 229,505 252,200 292,000 303,000 305,000 294,500 287,500 292,500 312,000Hyundai‐Kia Hyundai 0 11,004 116,200 200,010 377,136 528,111 507,000 488,000 538,500 571,000 643,250 641,000Hyundai‐Kia ALL 246,655 292,509 328,464 505,010 721,202 910,989 923,250 980,500 1,046,750 1,081,750 1,165,000 1,170,000Isuzu Isuzu 0 0 0 0 0 0 500 2,900 3,500 3,750 3,500 3,250LDV LDV 10,418 9,308 40 0 0 0 0 0 0 0 0 0SAIC MG MG 0 468 88 0 1,315 0 0 0 0 0 0 0Mitsubishi Mitsubishi 66,433 63,135 50,620 52,275 52,772 42,047 22,000 25,000 45,000 55,000 52,000 50,000PSA Citroën 1,174,855 1,125,641 995,343 1,051,806 1,069,179 880,095 827,600 886,300 863,000 868,000 919,750 960,750PSA Peugeot 1,502,828 1,352,227 1,242,968 1,325,329 1,310,011 1,137,866 1,202,000 1,227,750 1,182,150 1,142,000 1,177,250 1,157,000PSA ALL 2,677,683 2,477,868 2,238,311 2,377,135 2,379,190 2,017,961 2,029,600 2,114,050 2,045,150 2,010,000 2,097,000 2,117,750Renault‐Nissan Renault 1,745,311 1,482,313 1,377,999 1,495,692 1,468,830 1,262,289 1,235,000 1,277,600 1,424,250 1,552,750 1,593,500 1,516,250Renault‐Nissan Nissan 546,415 522,298 386,205 529,377 663,985 667,622 684,500 768,000 941,500 973,000 987,250 966,250Renault‐Nissan Dacia 361,402 357,029 345,663 428,147 469,924 588,251 735,750 848,500 917,500 926,500 919,750 913,500Renault‐Nissan AvtoVAZ 0 0 0 0 0 16,764 83,500 155,000 265,000 415,000 475,000 488,000Renault‐Nissan ALL 2,653,128 2,361,640 2,109,867 2,453,216 2,602,739 2,534,926 2,738,750 3,049,100 3,548,250 3,867,250 3,975,500 3,884,000Suzuki Suzuki 246,786 286,007 186,049 178,897 168,555 159,750 137,000 196,500 192,000 213,250 213,500 200,500Toyota Toyota 805,736 686,731 516,435 476,763 478,087 483,679 593,000 636,000 650,750 716,500 749,750 774,500Volkswagen Volkswagen 2,026,602 2,054,283 1,835,493 2,124,741 2,372,955 2,422,795 2,478,500 2,420,500 2,454,250 2,582,500 2,626,250 2,638,250Volkswagen Audi 974,715 1,019,625 931,016 1,148,692 1,349,756 1,065,611 1,098,409 1,111,259 1,143,259 1,144,000 1,194,950 1,265,750Volkswagen Seat 412,937 379,834 293,548 344,162 370,794 396,393 417,500 403,500 461,250 470,500 455,000 446,000Volkswagen Skoda 621,626 614,999 541,189 558,735 583,000 589,150 651,800 639,000 668,000 716,250 693,000 662,250Volkswagen Lamborghini 2,580 2,424 1,253 1,227 1,738 2,197 2,500 2,800 3,750 5,000 5,500 6,000Volkswagen Bentley 10,000 7,692 3,596 4,792 7,528 9,108 9,275 9,200 10,950 11,850 12,325 14,300Volkswagen Porsche 107,170 96,721 75,637 95,529 127,165 146,500 164,168 196,500 198,100 198,400 203,800 204,500VW Group ALL 4,155,630 4,175,578 3,681,732 4,277,878 4,812,936 4,631,754 4,822,152 4,782,759 4,939,559 5,128,500 5,190,825 5,237,050Tata Jaguar 0 72,696 41,765 56,456 49,932 55,916 82,000 79,250 76,750 174,500 214,500 247,500Tata Land Rover 0 188,147 116,581 185,096 241,099 311,748 356,250 345,250 353,500 404,500 493,500 507,000Tata Tata JLR 0 260,843 158,346 241,552 291,031 367,664 438,250 424,500 430,250 579,000 708,000 754,500Saab Sypker Saab 0 0 0 30,763 13,555 0 250 5,000 15,000 17,000 15,000 12,000Geely Volvo 0 0 0 165,103 443,526 420,116 422,275 404,000 497,250 510,250 587,500 584,750Aston Martin Aston Martin 7,373 6,487 2,475 4,201 4,427 3,693 3,800 3,600 4,825 5,350 4,800 4,160Chery Chery 0 0 0 0 0 0 0 0 22,500 61,000 75,000 74,000Great Wall Great Wall 0 0 0 0 0 1,100 2,500 7,750 15,000 24,000 26,500 28,000Total Total 20,276,555 19,022,045 16,102,151 18,228,079 19,190,037 18,199,377 18,976,777 19,665,509 21,167,584 22,361,000 23,382,725 23,613,110

EUROPEAN CAR AND LCV PRODUCTION OUTLOOK REPORT November 2013| Page 23
European Production Outlook to 2018 by VM Group – Base Outlook
2007 2008 2009 2010 2011 2012 2013 2014 2015 2016 2017 2018BMW 1,335,794 1,225,215 1,089,060 1,217,304 1,326,502 1,335,050 1,460,250 1,551,050 1,608,600 1,620,950 1,695,700 1,713,250Daimler 1,453,658 1,372,402 1,045,402 1,311,018 1,357,832 1,361,409 1,494,500 1,550,950 1,583,000 1,536,550 1,524,750 1,501,750Fiat 1,767,324 1,671,753 1,666,937 1,607,223 1,475,757 1,212,313 1,245,650 1,202,350 1,476,700 1,655,650 1,791,900 1,859,900Ford 2,709,524 2,198,837 1,764,427 1,760,286 1,555,274 1,330,101 1,379,250 1,463,000 1,655,000 1,725,500 1,811,500 1,850,000GM 1,876,978 1,652,748 1,170,051 1,419,352 1,395,537 1,198,695 1,100,200 1,104,250 1,212,500 1,369,750 1,498,750 1,592,500Honda 263,435 280,516 93,847 150,103 109,800 188,130 163,600 162,250 176,000 180,000 196,250 201,250Hyundai-Kia 246,655 292,509 328,464 505,010 721,202 910,989 923,250 980,500 1,046,750 1,081,750 1,165,000 1,170,000Mitsubishi 66,433 63,135 50,620 52,275 52,772 42,047 22,000 25,000 45,000 55,000 52,000 50,000PSA 2,677,683 2,477,868 2,238,311 2,377,135 2,379,190 2,017,961 2,029,600 2,114,050 2,045,150 2,010,000 2,097,000 2,117,750Renault-Nissan-Dacia 2,653,128 2,361,640 2,109,867 2,453,216 2,602,739 2,534,926 2,738,750 3,049,100 3,548,250 3,867,250 3,975,500 3,884,000Suzuki 246,786 286,007 186,049 178,897 168,555 159,750 137,000 196,500 192,000 213,250 213,500 200,500Tata JLR 0 260,843 158,346 241,552 291,031 367,664 438,250 424,500 430,250 579,000 708,000 754,500Toyota 805,736 686,731 516,435 476,763 478,087 483,679 593,000 636,000 650,750 716,500 749,750 774,500Volkswagen Group 4,155,630 4,175,578 3,681,732 4,277,878 4,812,936 4,631,754 4,822,152 4,782,759 4,939,559 5,128,500 5,190,825 5,237,050Geely Volvo 0 0 0 165,103 443,526 420,116 422,275 404,000 497,250 510,250 587,500 584,750Others 17,791 16,263 2,603 34,964 19,297 4,793 7,050 19,250 60,825 111,100 124,800 121,410
Total 20,276,555 19,022,045 16,102,151 18,228,079 19,190,037 18,199,377 18,976,777 19,665,509 21,167,584 22,361,000 23,382,725 23,613,110

EUROPEAN CAR AND LCV PRODUCTION OUTLOOK REPORT November 2013| Page 24
European Production Outlook to 2018 by VM Group – Base Outlook
European car and LCV production by VM group, 2007-2018
0
5,000,000
10,000,000
15,000,000
20,000,000
25,000,000
2007 2008 2009 2010 2011 2012 2013 2014 2015 2016 2017 2018
Others
Geely Volvo
Volkswagen Group
Toyota
Tata JLR
Suzuki
Renault-Nissan-Dacia
PSA
Mitsubishi
Hyundai-Kia
Honda
GM
Ford
Fiat
Daimler
BMW

EUROPEAN CAR AND LCV PRODUCTION OUTLOOK REPORT November 2013| Page 25
Country review In terms of country trends, the following table shows the expected trend in country production (please note that we now include Renault’s two Moroccan factories in the Outlook – hence the appearance of Morocco in this table and chart):
European Production Outlook to 2018 by country – Base Outlook 2007 2008 2009 2010 2011 2012 2013 2014 2015 2016 2017 2018
Austria 202,014 129,098 60,411 90,440 131,838 118,380 145,000 138,500 121,750 155,000 173,000 91,750Belgium 851,330 736,185 559,570 571,387 558,533 507,802 489,775 413,000 396,250 418,750 450,000 453,750Bulgaria 0 0 0 0 0 1,100 2,500 7,750 15,000 24,000 26,500 28,000Czech Rep 931,853 934,267 973,890 1,049,583 1,105,689 1,109,213 1,150,800 1,173,000 1,239,500 1,287,750 1,318,750 1,291,250Finland 23,026 16,145 10,414 6,385 2,015 0 16,500 25,500 23,250 21,500 12,750 0France 2,931,425 2,504,298 2,006,002 2,186,643 2,259,868 1,992,350 1,841,600 1,854,300 1,839,500 1,897,750 2,091,000 2,124,250Germany 5,740,200 5,527,105 4,989,604 5,690,807 6,126,315 5,617,524 5,749,327 5,704,959 5,809,109 5,719,700 5,901,550 6,060,150Hungary 298,704 341,203 218,103 217,428 208,263 240,902 297,750 434,000 420,500 457,750 457,000 435,250Italy 1,233,763 966,361 810,762 798,411 751,167 632,017 626,400 590,150 777,700 818,150 855,150 879,400Morocco 0 0 0 0 0 113,000 200,000 275,000 350,000 383,000 401,500 385,500Netherlands 61,692 60,305 50,620 48,025 40,772 27,047 0 19,000 50,000 65,000 90,000 155,000Poland 788,746 929,437 870,891 886,169 823,659 635,827 595,250 556,000 636,500 751,500 795,750 813,000Portugal 167,806 155,460 131,480 148,681 183,390 156,490 150,750 129,500 114,900 114,500 129,250 140,500Romania 292,161 284,311 296,312 350,857 335,167 337,743 440,750 474,500 467,500 442,500 420,500 434,500Russia 170,215 272,353 185,421 456,737 804,479 1,079,889 1,155,750 1,484,250 2,028,750 2,413,000 2,510,500 2,471,250Serbia 0 0 15,000 15,000 8,000 30,000 131,000 145,000 150,000 145,000 143,000 139,500Slovakia 538,288 520,953 521,853 539,101 577,907 846,500 878,750 896,500 867,000 849,250 866,000 947,500Slovenia 200,157 198,094 212,680 212,493 173,782 110,500 98,000 151,100 195,000 192,500 185,000 171,500Spain 2,758,555 2,494,012 2,139,857 2,368,832 2,342,751 1,939,326 2,172,250 2,181,000 2,333,750 2,533,000 2,614,250 2,605,750Sweden 340,311 252,647 126,158 174,656 188,869 162,814 161,750 164,750 250,000 262,500 334,000 332,750Turkey 1,028,581 1,083,227 848,015 1,049,652 1,124,753 985,128 1,057,250 1,198,150 1,308,000 1,425,250 1,467,750 1,470,750UK 1,717,728 1,616,584 1,075,108 1,366,792 1,442,820 1,555,825 1,615,625 1,649,600 1,773,625 1,983,650 2,139,525 2,181,810Total 20,276,555 19,022,045 16,102,151 18,228,079 19,190,037 18,199,377 18,976,777 19,665,509 21,167,584 22,361,000 23,382,725 23,613,110 The following pages show the data above in graphical terms, both with and without Russia.

EUROPEAN CAR AND LCV PRODUCTION OUTLOOK REPORT November 2013| Page 26
European car and LCV production by country, 2007-2018
0
5,000,000
10,000,000
15,000,000
20,000,000
25,000,000
2007 2008 2009 2010 2011 2012 2013 2014 2015 2016 2017 2018
UK
Turkey
Sweden
Spain
Slovenia
Slovakia
Serbia
Russia
Romania
Portugal
Poland
Netherlands
Morocco
Italy
Hungary
Germany
France
Finland
Czech Rep
Bulgaria
Belgium
Austria

EUROPEAN CAR AND LCV PRODUCTION OUTLOOK REPORT November 2013| Page 27
European car and LCV production by country, 2007-2018, excluding Russia
0
5,000,000
10,000,000
15,000,000
20,000,000
25,000,000
2007 2008 2009 2010 2011 2012 2013 2014 2015 2016 2017 2018
UK
Turkey
Sweden
Spain
Slovenia
Slovakia
Serbia
Romania
Portugal
Poland
Netherlands
Morocco
Italy
Hungary
Germany
France
Finland
Czech Rep
Bulgaria
Belgium
Austria

EUROPEAN CAR AND LCV PRODUCTION OUTLOOK REPORT November 2013| Page 28
Country Rankings The battle for second place intensifies The position of Germany as the largest vehicle production country is well-established and will continue. Below Germany, the position of different countries is changing. For many years France has been the clear no.2 and Spain the clear no.3 in terms of production volume rankings. In 2007, France produced c2.9mn units and Spain c2.76mn units – both have declined significantly since then and their positions have actually reversed; in 2011, Spain made c2.34mn units and France c2.26mn. In 2012, production in both France and Spain was below 2mn.
Our Base Outlook sees France declining further in 2013, to around 1.84mn units, and remaining below the 1.9mn level until the end of the period covered here – by the point we now expect France to recover to 2.1mn units on the back of new models, some extra production by Renault and despite the production shifts away from the country by both Renault and PSA. However, while Spain too fell to 1.9mn in 2012, we expect this to recover to c2.4-2.6mn units in 2016-8, better than we had projected last time, and a much stronger performance than evident in France.
Our view is that production in Spain will likely climb ahead of France in the future because of the spread of VMs in the country and the expansion in production expected at Ford, PSA and VW especially. The commitment of Opel to its plant in Zaragosa and the addition of some PSA production there has given it a bigger boost this time than we had expected in previous years That said, the actual volumes made in France and Spain will still be subject to change depending on key decisions regarding the final allocation of models to PSA and Renault’s French/Spanish sites.
For all its problems, Spain has the great advantage in that most of the volume VMs having a presence there, ie Opel, Ford, PSA, Renault and VW/Seat, as well as Nissan, Mercedes and Iveco in vans; as result, because most of these companies have signalled their long run commitment to Spain with recent investment announcements and commitments to new models, the country has a surprisingly robust automotive future. PSA, with the 301/C4 Elysee, Opel with the Mokka (and
the replacements for the Opel Meriva and Citroen C3 Picasso), Renault with the Captur and VW with its proposed expansion at Pamplona have all signalled their faith in Spain as a long-run production location.
However, it is the future position of the UK and Russia which pose the biggest challenge to France. Russia is something of a unique case in that almost all of the production growth there is for the local market and because of import duties, it is extremely unlikely that Russian demand could have been met from core European production sites. So, while we expect to see Russian production of international brands reaching 2.5mn units by 2018, and almost certainly more than this in due course, it is the changing position of the UK which is most relevant to the discussion of country rankings.
The planned new model programmes and the continued growth at Mini, JLR and Nissan (despite the economic climate) are very positive for the UK. In addition, we have the return to production health of Toyota, plus the confirmation that GM will retain both of its vehicle plants in the UK. All of this means we can expect UK vehicle production to rise from almost 1.56mn units in 2012, on a steady path thereafter, to 2mn upa by 2017/18. On this basis, we could expect to see the UK producing more vehicles than France by 2016. We think the UK will struggle to catch Spain in view of the volumes to be made there by a range of VMs, including a Nissan model which was originally slated for UK production.
However, if JLR continues to grow – and retains production in the UK – and if GM, Toyota and Honda can find ways to utilise their production capacity fully then it is actually conceivable that the UK could match and even overtake Spain in terms of production volumes around the turn of the decade. For now, we are adopting a cautious approach but following the new model announcements from JLR at the Frankfurt motor show and further details which have emerged since then, we are very confident that the UK will indeed soon break the 2mn units’ barrier.
Further evidence of the changing focus of vehicle production in Europe comes from the rise in production in the Czech Republic and Turkey (both now well over 1mn upa and rising) and Slovakia which is also trending towards 1mn upa. Italy by contrast is unlikely to get back to its historic production levels above 1mn units, certainly not within the period covered by this Outlook. Indeed we think Italy is unlikely to get back about 900,000 upa in the foreseeable future.

EUROPEAN CAR AND LCV PRODUCTION OUTLOOK REPORT November 2013| Page 29
The position of Germany relative to the other major European vehicle production companies is shown on the following chart. The distance between Germany and the other countries is especially clear. The chart also makes it clear how close the battle is for second place between the UK, Spain, France and Russia.
Base Outlook Major Countries
0
1,000,000
2,000,000
3,000,000
4,000,000
5,000,000
6,000,000
7,000,000
2007 2008 2009 2010 2011 2012 2013 2014 2015 2016 2017 2018
Years
Units
Czech Rep
France
Germany
Italy
Russia
Spain
TurkeyUK

EUROPEAN CAR AND LCV PRODUCTION OUTLOOK REPORT November 2013| Page 30
The following chart replicates the data from the preceding chart, but takes out Germany to highlight more clearly the changes in the relative positions of the different countries and shows in particular how the UK will get close to the production volumes in France and Spain by the end of the period covered here.
Base Outlook Major Countries, excl. Germany
0
500,000
1,000,000
1,500,000
2,000,000
2,500,000
3,000,000
2007 2008 2009 2010 2011 2012 2013 2014 2015 2016 2017 2018Years
Uni
ts
Czech RepFrance
ItalyRussia
SlovakiaSpainTurkey
UK

EUROPEAN CAR AND LCV PRODUCTION OUTLOOK REPORT November 2013| Page 31
Alternative Scenarios In this section we look at a number of alternative scenarios for European production – these have been prepared in order to provide readers with some alternative perspectives on how the Outlook could vary in the current uncertain economic climes. These have been produced on similar lines to the scenarios in our previous reports. The implications for European vehicle production in the event of our worst case scenarios coming to pass are rather worrying.
The Base Outlook The Base Outlook presented above and in the individual VM profiles remains our most likely scenario, taking into account our judgement of the regional and global economic climate, consumer and business confidence and the short and medium product and manufacturing plans of the VMs themselves. It is also crucially based on the assumption that there is no further substantial economic collapse in Europe.
In the Base Outlook, we calculate European production in 2012, including Russian production of international brands, at just over 18.19mn units – this was a fall of just under 1mn units from 2011; also in the Base Outlook, we see a modest overall recovery in 2013 to 18.98mn units; although some of this “recovery” is due to continued expansion of the international brands in Russia rather than due to an improvement in the core European market, there has been some better than expected recovery in Spain and Germany, as well as continued growth in the UK – and new production facilities in Serbia and Morocco (part of Renault’s greater European production network) have given the total volumes a bigger boost than expected last time..
We need to emphasise that our Base Outlook takes into account current rates of European sales volumes (and current expectations of continued decline); we also take into account already announced plant shutdowns (Ford Genk and Dagenham, Opel Bochum, Mitsubishi Netherlands and PSA Aulnay) and reliably expected closures or temporary shuttering/slowdowns, eg Ford Craiova. We do not currently project which factories might be closed in the years ahead but we expect 2 or 3 more plants to close. It is just a question of which and when these closures are announced
On this basis, we see production, excluding Russia, declining from c18.39mn in 2011 to just over 16.6mn units in 2012, a fall of around 1.74mn units. The importance of Russia to Europe’s future production total is clear from the table below – with Russia, production in 2018 should be nearly 22.9mn units, but without, production is not even 20.46mn, ie not much more than Europe’s total for 2007. In 2013 much of the 2012 fall is actually now expected to be recouped as shown in the table below.
Base Outlook - total European production with and without Russian production of international brands2007 2008 2009 2010 2011 2012 2013 2014 2015 2016 2017 2018
Total inc. Russia 20,276,555 19,022,045 16,102,151 18,228,079 19,190,037 18,199,377 18,976,777 19,665,509 21,167,584 22,361,000 23,382,725 23,613,110Total exc. Russia 20,106,340 18,749,692 15,916,730 17,771,342 18,385,558 16,643,552 17,821,027 18,181,259 19,138,834 19,948,000 20,872,225 21,141,860 Our Base Outlook, moreover, assumes the recovery across Europe will really take off from H2/2015 onwards, half a year later than previously thought; now we expect total production in 2014 to reach 19.66mn units including Russia (versus 19.2mn units expected last time). Subsequently, we expect the 20mn barrier to be reached again in 2015. In terms of production excluding Russia, we expect this to reaching 18.2 in 2014 and climb above 19mn in 2015. Continued growth in 2016-18 is then projected.

EUROPEAN CAR AND LCV PRODUCTION OUTLOOK REPORT November 2013| Page 32
All this assumes that the current economic uncertainty (and depression or stagnation in some markets) is resolved and complete economic meltdown across Europe is averted. However, because of the myriad of complexities affecting the industry right now and the economic uncertainty, we need to provide some overall insight as to what might happen if things turn out to be worse than currently expected.
Alternative views The uncertainty in the Eurozone in particular means that more pessimistic views need to be considered. We present a range of scenarios, all variants on the Base Outlook, and with options including Russia and without – most of the Russian production of international brands is for the Russian market.
Scenario 1 Here we look at what could happen if production in Spain, Italy and France was between 2-5% pa below that projected in the Base Outlook between 2013-2017, while production in the other countries remains as per the Base Outlook. The reason for looking at this scenario is that these three countries produce mostly in the A/B/C segments which are the most prone to major volume impacts in a worsening economic climate. In addition, the volume VMs in these countries are especially vulnerable to the increasingly competitive Koreans and the move into the C segment especially by the premium brands (who appear to be less affected by the current economic situation than the volume brands). It is worth noting that in late 2012, French ministers unsuccessfully called for an EU investigation into Korean VMs, as the French clearly felt they are being undercut on prices, especially in France. This call however went unheeded.
In this scenario, including Russia, we see provisional European production having fallen to just over 18.19mn units in 2012, before recovering along a similar line as in the Base Outlook – albeit with slightly lower annual totals. More significantly, this means that, taking Russia out of the equation, European production does not recover to its 2007 peak until 2017. However, it is worth noting that the underlying strength of Germany, the UK and Hyundai-Kia means we expect still expect a modest rise in total European production under this scenario.
Scenario 1 - France, Spain and Italy down 2-5% pa 2013-2017 compared to Base Outlook2007 2008 2009 2010 2011 2012 2013 2014 2015 2016 2017 2018
Total inc. Russia 20,276,555 19,022,045 16,102,151 18,228,079 19,190,037 18,199,377 18,983,797 19,573,000 21,068,565 22,203,533 23,215,913 23,444,828Total exc. Russia 20,106,340 18,749,692 15,916,730 17,771,342 18,385,558 16,643,552 17,681,820 18,088,750 19,039,815 19,790,533 20,705,413 20,973,578 Scenario 2 Here we look at what could happen if, in addition to the reduced production projected in France, Spain and Italy noted above, German production sees its production reach between 1-4% per year below that projected in the Base Outlook. While this reduced production volume would be spread across 2013-2016, most of it would still be in 2013. The impact of this would be that Europe (excluding Russia) grows by c4600,000 units in 2013, rather than the rise of 1m units in scenario 1. This scenario specifically excludes any further allowance for a fall in production in the UK, Slovakia, the Czech Republic, Hungary and Romania where significant investment is now coming on stream, producing new models from highly competitive VMs.
Scenario 2 = scenario 1, plus Germany down 1-4% pa 2013-2017 compared to Base Outlook2007 2008 2009 2010 2011 2012 2013 2014 2015 2016 2017 2018
Total inc. Russia 20,276,555 19,022,045 16,102,151 18,228,079 19,190,037 18,199,377 18,262,637 19,515,950 20,952,383 22,146,336 23,156,898 23,384,227Total exc. Russia 20,106,340 18,749,692 15,916,730 17,771,342 18,385,558 16,643,552 17,106,887 18,031,700 18,923,633 19,733,336 20,646,398 20,912,977

EUROPEAN CAR AND LCV PRODUCTION OUTLOOK REPORT November 2013| Page 33
In this scenario, total European production, including Russian production of international brands, should be just under 18mn in 2013, compared to 18.67mn in the Base Outlook. As in scenario 1, this would mean that Europe would take until around or more likely after 2017 before it again reaches its earlier 2007 peak.
Scenario 3 Here we look at what would happen if all European production countries, except Russia, were all 2-5% pa below the figures project in the Base Outlook. .
Scenario 3 - whole market, except Russia, down 2-5% pa 203-2017, compared to Base Outlook2007 2008 2009 2010 2011 2012 2013 2014 2015 2016 2017 2018
Total inc. Russia 20,276,555 19,022,045 16,102,151 18,228,079 19,190,037 18,199,377 18,442,146 19,301,884 20,784,807 21,762,560 22,756,558 22,978,854Total exc. Russia 20,106,340 18,749,692 15,916,730 17,771,342 18,385,558 16,643,552 16,929,976 17,544,915 18,564,669 19,349,560 20,246,058 20,507,604
The data in the above tables is now shown graphically below, first with Russia and then without.
European Production Outlook and 3 alternative scenarios
15,000,000
16,000,000
17,000,000
18,000,000
19,000,000
20,000,000
21,000,000
22,000,000
23,000,000
24,000,000
25,000,000
2007 2008 2009 2010 2011 2012 2013 2014 2015 2016 2017 2018
Years
Uni
ts
Base OutlookScenario 1Scenario 2Scenario 3
European Production Excl Russia - Base Outlook & 3 alternative scenarios
15,000,000
16,000,000
17,000,000
18,000,000
19,000,000
20,000,000
21,000,000
22,000,000
23,000,000
24,000,000
2007 2008 2009 2010 2011 2012 2013 2014 2015 2016 2017 2018Years
Units
Base w/oRussia
Scen 1 w/oRussiaScen 2 w/oRussia
Scen 3 w/oRussia

EUROPEAN CAR AND LCV PRODUCTION OUTLOOK REPORT November 2013| Page 34
And if things were even worse than this? A fall of up to 5% more than our Base Outlook would be bad enough, but in view of the current economic climate, we need to recognise that in reality, things could be worse! With this in mind, we have constructed three further scenarios for European production excluding Russia. These are discussed below.
Whereas scenarios 1-3 with and without Russia are predicated on a reasonable recovery through to 2018 (including continued export growth, eg of Fiats/Jeeps to North America and of JLR and German premium brands to North America, China and the Middle East), scenarios 4, 5 and 6 have been designed to reflect the potential impact of significant stagnation in Europe and a failure of the export-led strategy of Fiat (and Ford in LCVs) and the premium brands to counter reduced sales in Europe. While we clearly cannot say which scenario is the most likely, the point of preparing these alternative views is to present the reader with a macro view of what the market could look like in the event of a worsening of the global economic situation, for example a serious slowdown or retrenchment in China and/or the USA failing to resolve its long term fiscal problems. Scenario 4 assumes that from 2013 the market is 5-7% worse than the Base Outlook throughout the Outlook period. Then in scenario 5, we assume the situation in scenario 4 is worsened, ie with a further decline of 2.5% in each of 2013 and 2014, before a recovery in 2015 of 3.5% and then 5% in 2016/17. Scenario 6 assumes the same as in scenario 5 for 2013 and 2014, but then assumes a smaller rate of recovery, ie just 1.5% in 2015 and 3% in 2016/17/8. The results of these declines and recovery profiles are summarised in the table below.
Scenarios 4. 5 and 6 versus European Base Outlook, without Russia 2007 2008 2009 2010 2011 2012 2013 2014 2015 2016 2017 2018
20,106,340 18,749,692 15,916,730 17,771,342 18,385,558 16,643,552 17,821,027 18,181,259 19,138,834 19,948,000 20,872,225 21,141,86020,106,331 18,749,692 15,916,730 17,771,342 18,385,558 16,643,552 16,573,555 16,908,571 17,799,116 18,950,600 19,828,614 20,084,76720,106,331 18,749,692 15,916,730 17,771,342 18,385,558 16,643,552 15,811,374 15,020,806 15,546,534 16,634,791 17,466,531 18,339,85720,106,331 18,749,692 15,916,730 17,771,342 18,385,558 16,643,552 15,811,374 15,020,806 15,246,118 15,703,501 16,174,606 16,659,845Scenario 6 exc. Russia
Base Outlook exc. RussiaScenario 4 exc. RussiaScenario 5 exc. Russia
The data above is also shown graphically overleaf. The implications of these scenarios are that by 2018 European production excluding Russia will not have returned to its 2007 levels and in the worst case scenarios only gets back above the 2009 trough in 2017. The long-run implications for the structure of the European vehicle manufacturing sector are ominous.
Although some plant closures have already been announced and we feel sure more may well follow, especially if the above scenarios come to pass, we are also sure that European VMs are still doing all they can to avoid closing any more car plants, at least unless the economic situation worsens significantly and for a sustained period. This would be the case if the production volumes for Europe excluding Russia turn out to be something in the range shown in scenarios 5 and 6. Moreover, if these levels were maintained in the long run, then widespread plant closures would surely be inevitable – and the loss of one of the major names in European car production would be a distinct possibility. We would not be talking about a few plant closures but the possible exit of a major name, ie the kind of industrial restructuring some analysts suggest is required to bring supply and demand into better balance. European VMs are struggling to maintain an even keel financially as it is, but if production remains at below 18.75mn units in the long run (ie below the 2008 total), further and potentially much more widespread plant closures would then seem to be unavoidable. Core European market sales were down in 2012 and they are expected to fall again in 2013, with January-August figures down c5% year-on-year: although export growth to the US especially, emerging markets (in particular Russia and China) and the buoyancy of UK sales have maintained production volumes at some VMs, the pinch is now being felt across all markets and we can expect a fall in production at several VMs as a result.

EUROPEAN CAR AND LCV PRODUCTION OUTLOOK REPORT November 2013| Page 35
What is notable about the current situation is that a number of VMs have begun to speak publicly about the need to cut capacity and close factories. And some have acted, even no one is prepared to follow the advice or Dr Winterkorn, head of VW, who believes that 10 plants need to close across Europe (although not including any VW group factories). The message that VMs cannot sustain the fixed costs of numerous underutilised plants appears to have been heard loud and clear. Ford, PSA and GM have begun to act; Fiat and Renault appear to be bucking this trend, with renewed investment in France, Italy and Spain; and even GM and Ford appear to be committed to their reduced footprints – the question is will they be able to resist further change and until when?
Base Outlook versus worst scenarios (4, 5 and 6)
European Production Excl. Russia - Worst Scenarios
14,000,000
15,000,000
16,000,000
17,000,000
18,000,000
19,000,000
20,000,000
21,000,000
22,000,000
23,000,000
24,000,000
2007 2008 2009 2010 2011 2012 2013 2014 2015 2016 2017 2018Years
Uni
ts
Base Outlook
Base w/oRussia
Scen 4 w/oRussia
Scen 5 w/oRussia
Scen 6 w/oRussia

EUROPEAN CAR AND LCV PRODUCTION OUTLOOK REPORT November 2013| Page 36
Disclaimer As noted at the outset, the views and projections contained in this report are those of the author, Ian Henry of AutoAnalysis. They do not represent an official SMMT view.
The projections regarding new model timings, changes in production locations and the associated production volumes shown here have been compiled on the basis of information from a variety of sources. In many cases, the vehicle companies do not provide official information on which models will be made at which plants, nor do they provide detailed information on future volumes and timings. They have been prepared on the basis of judgments made by AutoAnalysis, taking into account the information, opinion and inside from a range of industry, press and analyst sources available at the time of compiling this report.
Ian Henry of AutoAnalysis will gladly address SMMT members’ specific questions on this report.
Readers’ comments and questions on this report will be greatly appreciated. Please e-mail: [email protected].

EUROPEAN CAR AND LCV PRODUCTION OUTLOOK REPORT November 2013| Page 37
Vehicle manufacturer reviews

EUROPEAN CAR AND LCV PRODUCTION OUTLOOK REPORT November 2013| Page 38
BMW Corporate Developments
2012 was BMW’s best ever year: group revenue rose nearly 12% to €76.8bn, with pre-tax profits up 6% at €7.8bn. Global unit sales rose 10.6% to 1.845mn; BMW brand saes rose 11.6% to 1.54mn, with Mini up nearly 6%, despite the imminent replacement of the main Mini model. BMW also expanded its workforce in 2012, by 5.6% to nearly 106,000 worldwide. 2012 worldwide sales were up 6% at over 954,000, driven by strong sales of the 5-series, XF, 3-series GT and the early sales of the 4-series. Mini sales were down slightly as the current model enters the last months of its life cycle, but the group as seen sales in China (+6.3%) and Russia (+10.4%) continue to power ahead; similarly Japan rose 10.1% and South has been followed by continued strong sales worldwide; H1 Korea rose 18.3%. Heavy expenditure on new models led to a fall of 8.8% in Q2 profits to €2.07bn, although revenue rose by 1.8% to €19.6bn, with unit sales also up 6.6%. Its automotive margin also fell from 11.6% to 9.6%. By the end of October, the company was able to announce a worldwide sales increase of 7.3% to a new record of 1.6mn units – BMW brand sales were up 5.4% to over 140,000 worldwide, while Mini sales were also at a record, at over 25,000 for the month, up nearly 4%. However, although sales are up, the company’s finances are under some strain. In Q3, EBIT contracted by 6% to under €1.6bn, due to increased investment costs and various production and market launch costs. A slowdown in European sales did not help either – worldwide revenues were flat and the increased costs attributed to this quarter took an inevitable toll on profits. Nonetheless the company claims it is still on target to achieve its end of year financial goals, specifically an EBIT margin of between 8-10-% The company nonetheless expects 2013 to be largely flat in terms of financial performance, due to Europe’s economic problems, with strong sales in China and North America preventing a financial collapse; the company expects Europe to need around 4-5 years to recover fully – hence its focus on expansion beyond Europe. 2013 pre-tax profit is expected to similar to 2012’s €7.82bn, with investments for new models having added €1bn to the cost base for this year: in total the company will launch 13 new models and variants in 2013.
New Model News
BMW: the i8 and i3 have received their full launches – LA and London respectively – while the specifications for the new 4-series (the replacements for the 3-series coupe and cabrio models) have been released. However Ian Robertson, BMW’s sales and marketing director has indicated in an interview with Automotive News Europe that further X models are likely: “BMW has never shied away from taking bold steps.” Mini: Paceman launched, switchover to new Mini production at Oxford under way, although the new full Mini range will not appear until 2014. UK automotive press reports have set out plans for a 10-strong Mini line-up from the new UKL1 platform, although these have not been confirmed officially. However, it is clear that Mini will become a full brand with the current range extended to include a 5-door version

EUROPEAN CAR AND LCV PRODUCTION OUTLOOK REPORT November 2013| Page 39
BMW and an MPV; a saloon Mini is unlikely at this stage. Rolls-Royce: industry rumours surrounding an SUV following Bentley’s entry into the segment have gathered pace of late, although BMW and Rolls-Royce have not confirmed anything here.
Manufacturing News
Start of production of i3 electric car in September, following €400mn investment and creation of 800 jobs. It is worth noting that BMW claimed when the i3 was officially launched in July in London that the programme would be profitable from Day 1. Production of the new Mini has now started at Oxford, supported by increased production at Swindon (pressings) and Hams Hall (engines) in the UK; although the Mini range will expand greatly, the Oxford factory is limited to no more than 260,000 upa because of limitations in throughput possible at the paint shop – the influence of the comments by Harald Krueger, BMW board member for production, is that if a new paint shop were built at Oxford, then the existing assembly line could actually cope with increased assembly volumes. Just after the Frankfurt motor show, CEO Norbert Reithofer told the German press that BMW was considering building another new factory outside Europe in addition to the one already announced in Brazil. There have been reports that the company is looking at a full manufacturing facility in Mexico where Audi is currently building its first north American plant. One negative story concerned China where the company was refused permission to expand its Brilliance JV plant; the official reason given was that the current set-up does not meet environmental targets. Assembly of the Mini Countryman has begun in Thailand, alongside various BMW models; the Countryman is also assembled, from kits supplied from Austria in India and Malaysia.
Alliances Industry insiders suggest that engine alliance with PSA will lapse in 2016, due to BMW developing its own small engines for the Mini range and PSA’s increasingly close relationship with GM
Production Outlook
We now expect 2013 European production at BMW will rise by over 100,000 this year, to just over 1.1mn, largely because of better than expected sales of several models – eg 1-series, 5-series and X1 – which have either entered their mid-life or declining stages of their life cycles. The completion of the new 3-series and 4-series range from late 2013 and through 2014 will result in an increase once again in BMW brand production volumes in Europe. These will climb towards and over 1.2mn units, while total Mini production remains on an upward curve and it will continue to grow this year as the switchover to the new model is completed; this upward growth curve will continue as the range expands and Mini becomes a multi-model brand in its own right. We currently project Mini volumes at around 400,000 upa, but these could well be conservative and if enough capacity is made available, in the UK, at Nedcar and in Austria or in Germany, more than 500,000 Minis is a distinct possibility by the end of the decade.

EUROPEAN CAR AND LCV PRODUCTION OUTLOOK REPORT November 2013| Page 40
BMW Production Outlook to 2018
Group Marque Model range Series (platform) Plant CountryStart of Prod'n
End of Prod'n
Next new model 2007 Production 2008 Production
2009 Production 2010 Production 2011 Production 2012 Production
Production Outlook 2013
Production Outlook 2014
Production Outlook 2015
Production Outlook 2016
Production Outlook 2017
Production Outlook 2018
BMW BMW 1‐series GT UKL1 Leipzig DE H2 13 2013 0 0 0 0 0 0 3,500 45,000 58,000 60,000 58,000 54,500BMW BMW 1 series E87 Regensburg DE Q3 04 2011‐2012 133,109 115,543 127,915 108,685 59,500 0 0 0 0 0 0 0BMW BMW 1 series E81/82/88 (L2) Leipzig DE Q3/04 & Q2/07 2011‐2012 49,116 112,570 97,301 76,669 82,000 26,500 11,000 0 0 0 0 0BMW BMW 1‐series L7/F20/F21 Regensburg DE H2 11 0 0 0 51 65,000 82,000 95,000 90,000 84,500 79,500 70,000 95,000BMW BMW 1‐series L7/F20/F21 Leipzig DE H2 11 0 0 0 0 0 96,250 118,000 107,500 98,000 90,000 83,000 98,000BMW BMW 2‐series coupe, cabrio, GT L7/F20/F21 Regensburg or Leipzig DE H1 13 0 0 0 0 0 0 3,500 46,000 60,000 65,000 63,500 60,500BMW BMW 3 series E90 Leipzig DE Q1 05 108,834 34,415 29,682 7,752 0 0 0 0 0 0 0 0BMW BMW 3 series E90 Munich DE Q2 05 H2 12 219,636 223,394 217,531 206,039 167,000 0 0 0 0 0 0 0BMW BMW 3 series E90 Regensburg DE Q2 05 H2 12 170,657 158,254 93,653 113,546 128,000 46,500 13,000 0 0 0 0 0BMW BMW New 3‐series L7/F30 Munich/Regensburg DE Q4 11 2019 0 0 0 0 7,000 299,000 335,000 327,500 319,500 289,000 275,000 263,000BMW BMW 3‐series GT L7 Regensburg DE H1 12 2010 0 0 0 0 0 275 31,000 35,000 40,000 38,000 36,250 34,000BMW BMW 4‐series L7/F30 Munich/Regensburg DE Q4 11 2019 0 0 0 0 0 0 35,000 75,000 85,000 82,000 76,500 74,500BMW BMW 5 series E60 Dingolfing DE Q3 03 2010/2011 237,356 205,798 144,654 10,599 0 0 0 0 0 0 0 0BMW BMW 5 series L6/F10/F11 Dingolfing DE Q2 10 2017 0 0 590 185,530 242,000 235,000 231,000 216,000 203,000 194,000 235,000 250,000BMW BMW 5‐series GT L6/F07 Dingolfing DE Q3 10 2009 0 25 10,147 28,714 23,000 18,500 17,500 16,250 15,000 14,000 19,750 19,250BMW BMW 6 series E63/E64 Dingolfing DE Q1 03 2011 21,199 15,915 5,126 3,272 50 0 0 0 0 0 0 0BMW BMW 6 series L6/F12/F13 Dingolfing DE Q1 11 0 0 7 555 17,000 13,500 9,500 8,500 6,750 6,250 5,500 13,500BMW BMW 6 series 4dr GranCoupe L6/F06 Dingolfing DE Q4 12 2012/3 0 0 0 0 150 14,750 16,500 15,750 15,250 15,000 14,750 14,500BMW BMW 7 series E65/E66 Dingolfing DE Q1 05 Q3 08 2008 45,410 27,088 0 0 0 0 0 0 0 0 0 0BMW BMW 7 series L6/F01 Dingolfing DE Q3 08 2015 94 12,873 56,384 66,650 75,000 58,750 54,250 52,000 69,000 82,250 84,500 81,500BMW BMW 8 series L6 Dingolfing DE H2 15 0 0 0 0 0 0 0 0 0 5,000 15,000 13,250 11,500BMW BMW i3 electric vehicle New Leipzig DE Q4 13 or Q1 14 2013/14 0 0 0 0 0 0 2,750 22,000 27,500 25,000 22,000 20,500BMW BMW i8 New Leipzig DE Q4 14 2014 0 0 0 0 0 0 250 1,250 1,500 1,500 1,300 1,150BMW BMW Additional "i" series models New Leipzig DE Q3 15 2015 0 0 0 0 0 0 0 0 1,500 9,000 21,000 20,000BMW BMW Z2 UKL1 Leipzig DE Q2 15 2015 0 0 0 0 0 0 0 0 7,500 15,000 19,500 20,000BMW BMW Z4 E89 Regensburg DE Q4 08 2015 0 211 28,902 21,700 18,000 12,500 11,750 9,250 7,750 13,500 18,000 20,000BMW BMW X1 L2 Leipzig DE Q1 10 2017 0 0 16,655 111,547 145,000 121,000 145,000 129,000 108,500 85,000 102,000 105,000BMW BMW X2 L2 Graz (Magna‐Steyr factory) AU H2 16 2016 0 0 0 0 0 0 0 0 0 33,000 59,500 62,500BMW BMW X3 E83 Graz (Magna‐Steyr factory) AU Q2 03 Q4 09 2009 111,665 82,863 45,973 31,737 0 0 0 0 0 0 0 0BMW BMW Total 1,097,076 988,949 874,520 973,046 1,028,700 1,024,525 1,133,500 1,196,000 1,213,250 1,212,000 1,278,300 1,318,900BMW MINI MINI R50 Oxford UK H1 01 Q3 06 2006 32,523 20,184 0 0 0 0 0 0 0 0 0 0BMW MINI MINI Countryman/Paceman R60 Graz (Magna‐Steyr factory) AU Q3 10 2010 0 0 0 24,741 102,643 99,500 125,750 119,500 105,250 99,000 87,500 5,000BMW MINI MINI Coupe/Roadster R55 Oxford UK TBC, after 2011 2011+ 0 0 0 0 9,200 23,575 16,000 11,500 10,000 0 0 0BMW MINI MINI 2nd gen R55 Oxford UK Q3 06 Q4 12 2013 205,186 214,835 213,670 216,302 182,274 183,955 165,000 0 0 0 0 0BMW MINI Mini Clubvan R55 Oxford Uk H2 12 2012 0 0 0 0 0 261 1,900 2,100 1,950 1,650 1,400 1,200BMW MINI MINI 3rd gen UKL1 Oxford UK Q1 13 0 0 0 0 0 0 15,000 200,000 225,000 240,000 235,000 229,500BMW MINI MINI various models: line‐up to bUKL1 Nedcar NL Q3 14 0 0 0 0 0 0 0 19,000 50,000 65,000 90,000 155,000BMW MINI Total 237,709 235,019 213,670 241,043 294,117 307,291 323,650 352,100 392,200 405,650 413,900 390,700BMW Rolls Royce All Goodwood UK 1,009 1,247 870 3,215 3,685 3,234 3,100 2,950 3,150 3,300 3,500 3,650BMW Rolls Royce Total 1,009 1,247 870 3,215 3,685 3,234 3,100 2,950 3,150 3,300 3,500 3,650BMW ALL Total 1,335,794 1,225,215 1,089,060 1,217,304 1,326,502 1,335,050 1,460,250 1,551,050 1,608,600 1,620,950 1,695,700 1,713,250

EUROPEAN CAR AND LCV PRODUCTION OUTLOOK REPORT November 2013| Page 41
Daimler-Mercedes Corporate Developments
Daimler remains under severe cost pressure as sales fall relative to BMW; in 2012, Daimler postponed its profit targets until 2014, four years later than originally planned. Earnings had fallen in Q1 significantly, by 60%, with a revenue decline of 3%; the main driver behind was said to poor sales in Europe and China. In addition significant costs – €1.6bn in total – were booked against R&D, capacity expansion and product development. Q2 produced good results for Daimler, with profits up from €1.56mn in Q2/2012 to €4.58mn in Q2/2013, while quarterly revenue grew from €28.9mn to €29.7mn year-on-year. The main driver behind the strong growth in profits was the sale of Daimler’s remaining stake in EADS, an aerospace operation. On the automotive front, unit sales were up 6% year-on-year, with car sales up 9% and truck sales up just 1%. Q3 results also showed further growth; Q3/2013 EBIT was up from €1.9bn to just over €2.2bn, while revenue was up 5% at €30.1bn; the company is expecting a further improvement in Q4 EBIT and has forecast rise for the year to €7.5bn
Daimler is still expecting overall global growth in vehicle demand in 2013, with demand from North America and China underpinning this growth and thereby helping to maintain production volumes in Europe. The company also believes the bottom of the market has been reached in Europe. The company has had good sales in the 10 months to October, with an 11% rise to 1.19mn units worldwide (still some way behind BMW [1.35mn] and Audi [1.31mn] in the same period. In the US, however, the company was ahead of BMW in October sales, a move aided by the CLA compact coupe. Overall, the Mercedes brand started Q4 with a 15.3% y-o-y rise in deliveries, to over 126,000, with ytd figures of nearly 1.2mn, a rise of nearly 11%. As well as the CLA, the facelifted E-class was an important contributor to the October sales boost. Outside Europe, in China, Daimler is taking a 12% stake in its long-term partner BAIC; this is ahead of an IPO in BAIC.
New Model News
New S-class launched in July; S-class coupe replaces CL from mid-2014, with cabrio in 2015. Large Pullman S-class replaces Maybach. CLA 4-door coupe launched, underpinning H2 sales rise; rumours that Mercedes may launch a range below A-class (possibly to be called X-class), to compete in the Audi A1 segment, through joint small car platform with Renault, still unconfirmed; if this happens, it is unlikely before 2017. The CLA coupe has been a great success and has underpinned a 15% rise in Mercedes brand sales in October (compared to a 5% rise at BMW and 7% at Audi) GLA (A/B-class SUV) shown in Frankfurt in production ready form, having been shown earlier in the year in Shanghai in concept form. This will compete against the X1 and Q3.
Manufacturing News
Manufacturing news in relation to the Renault alliance noted below. One other important development concerns compact Mercedes cars: the A-class, GLA and C-class models will be made at a new factory to be built in Brazil from 2016.

EUROPEAN CAR AND LCV PRODUCTION OUTLOOK REPORT November 2013| Page 42
Daimler-Mercedes In a very symbolic development, Mercedes has opened its first engine plant outside Germany – at BAIC. This plant has been built with an investment of €400mn and will make up to 250,000 4- and 6-cylinder engines.
Alliances At the Frankfurt motor show, Daimler announced that its collaboration with Renault-Nissan would continue and widen, having completed building a factory in the US to supply both operations with Mercedes 4-cylinder engines. There are now 10 collaborative projects under way which include the supply of diesels from Mercedes to Infiniti. Joint developments in the truck arena will follow soon, meaning that the two companies have alliances at both ends of the size scale, starting with the co-development of the Renault Twingo and its four-seater Smart equivalent. A decision is expected by the end of 2013 regarding the joint production of compact cars at a Nissan plant in Mexico – this could involve the Mercedes GLA being made by Nissan. Three-way alliance with Ford and Nissan in fuel cells signed in January. Renault will not develop a luxury car based on a Mercedes platform. However, the two companies may build a large van together, the likelihood of this increasing when it was announced that from 2016, Mercedes would no longer make the Crafter for VW. Daimler is also taking a 5% stake in Aston Martin, a move which see close collaboration between Aston Martin and the AMG performance car division of Mercedes. Initially this will see AMG-Mercedes engines used in Aston Martins but it is likely that this will be extended to include platform sharing in the long term.
Production Outlook
Mercedes production in Europe expected to grow steadily from 1.2 to c1.4mn units through to 2018; the potential exists to increase A- and B-class and variant production, so exceeding 1.5mn upa in Europe, remains a distinct possibility and quite possibly higher if van demand recovers. The development of the possible X-class with Renault would certainly push European production over the 1.5mn upa level and possibly higher than that. At the Frankfurt motor show, Dieter Zetsche said the company was still looking at the B-segment in which the possible X-class model would fit – no decision has yet been and we do not expect one for a couple of years at least.

EUROPEAN CAR AND LCV PRODUCTION OUTLOOK REPORT November 2013| Page 43
Daimler-Mercedes Production Outlook to 2018
Group Marque Model range Series (platform) Plant CountryStart of Prod'n
End of Prod'n
Next new model 2007 Production 2008 Production
2009 Production 2010 Production 2011 Production 2012 Production
Production Outlook 2013
Production Outlook 2014
Production Outlook 2015
Production Outlook 2016
Production Outlook 2017
Production Outlook 2018
Daimler Mercedes‐Benz A‐Class W169 Rastatt DE Q3 04 2011 148,836 131,276 108,254 120,102 92,500 0 0 0 0 0 0 0Daimler Mercedes‐Benz B‐Class W169 Rastatt DE Q1 05 2011 133,682 121,062 100,054 118,284 85,000 0 0 0 0 0 0 0Daimler Mercedes‐Benz New A‐class W176 Uusikaupunki (Valmet) FIN H2 13 0 0 0 0 0 0 16,500 25,500 23,250 21,500 12,750 0Daimler Mercedes‐Benz New A‐class W176 Rastatt DE H1 12 2019 0 0 0 0 250 79,500 185,000 175,000 149,000 135,000 119,000 105,000Daimler Mercedes‐Benz New B‐class W246 Rastatt DE H1 12 2012 0 0 0 0 0 108,000 95,000 89,000 87,000 76,500 70,000 68,500Daimler Mercedes‐Benz A‐class roadster SLA C117 Rastatt DE H2 12 2019 0 0 0 0 0 0 0 6,000 16,500 16,000 14,750 13,000Daimler Mercedes‐Benz New B‐class W246 Kecskemet HU H1 12 2019 0 0 0 5 150 42,500 46,500 44,000 41,000 40,000 38,250 36,500Daimler Mercedes‐Benz GLA X256 Rastatt DE H2 13 2019 0 0 0 0 0 0 5,000 67,000 73,000 69,000 63,000 60,000Daimler Mercedes‐Benz CLA (4‐door coupe and shooting bW246/S117 Kecskemet HU H2 14 2020 0 0 0 0 0 600 68,500 90,000 83,500 79,000 71,250 67,500Daimler Mercedes‐Benz CLA shooting brake Kecskemet HU H2 15 0 0 0 0 0 0 0 0 25,000 45,000 55,000 51,000Daimler Mercedes‐Benz C‐Class W203 Bremen DE H2 06 2007 43,210 0 0 0 0 0 0 0 0 0 0 0Daimler Mercedes‐Benz C‐Class W204 Bremen DE H2 06 2014 113,639 170,781 89,120 91,569 83,500 84,000 55,000 0 0 0 0 0Daimler Mercedes‐Benz C‐Class W205 Bremen DE H1 14 H2 13 2014 0 0 0 0 0 0 0 220,000 229,000 213,000 205,000 197,500Daimler Mercedes‐Benz C‐Class W203 Sindelfingen DE H2 06 2007 432 0 0 0 0 0 0 0 0 0 0 0Daimler Mercedes‐Benz C‐Class W204 Sindelfingen DE H2 06 H2 13 2014 121,984 112,000 117,172 149,168 182,500 167,500 157,000 0 0 0 0 0Daimler Mercedes‐Benz C‐Class Sports coupe CL203 Sindelfingen DE H2 06 2007 11,987 0 0 0 0 0 0 0 0 0 0 0Daimler Mercedes‐Benz C‐class coupe C204 Bremen DE H1 11 2011 0 0 0 134 35,000 46,250 37,500 33,500 31,000 29,500 28,000 26,250Daimler Mercedes‐Benz E‐Class W211 Sindelfingen DE Q1 02 H2 08 2008 193,487 159,153 10,450 0 0 0 0 0 0 0 0 0Daimler Mercedes‐Benz E‐Class W212 Sindelfingen DE H2 08 2016 0 1,189 168,495 240,583 203,000 190,000 215,000 209,000 196,000 185,000 17,000 0Daimler Mercedes‐Benz E‐Class W213 Sindelfingen DE H1 17 2017 0 0 0 0 0 0 0 0 0 0 209,000 229,000Daimler Mercedes‐Benz E‐class Coupe/Cabrio C207/A207 Bremen DE H1 09 2016‐7 0 0 33,402 71,261 56,000 49,500 47,500 43,000 41,000 38,000 50,000 58,500Daimler Mercedes‐Benz CLS W211/C219 Sindelfingen DE Q1 05 2010‐11 30,437 22,692 6,386 10,516 0 0 0 0 0 0 0 0Daimler Mercedes‐Benz CLS, incl. estate version to compeW212/C218 Sindelfingen DE H1 11 2018 0 0 0 2,329 38,000 39,250 37,500 33,500 31,000 28,500 26,500 39,500Daimler Mercedes‐Benz S‐Class W221 Sindelfingen DE Q1 06 2012 to W222 87,206 77,907 40,437 71,521 76,500 65,000 25,000 0 0 0 0 0Daimler Mercedes‐Benz CL W221/C216 Sindelfingen DE H2 06 2013 11,590 6,984 1,672 2,778 2,400 750 0 0 0 0 0 0Daimler Mercedes‐Benz S‐Class, incl. S‐coupe replacemenW222 Sindelfingen DE Q1 12 2012 to W222 0 0 0 0 0 5,000 35,000 88,000 98,000 94,000 89,000 85,250Daimler Mercedes‐Benz SLK W203/ R171 Bremen DE Q4 03 2011 30,859 29,853 12,090 13,216 0 0 0 0 0 0 0 0Daimler Mercedes‐Benz SLK W204/ R172 Bremen DE Q1 11 2018 0 0 0 490 37,500 25,000 26,500 22,000 20,250 19,000 17,250 26,000Daimler Mercedes‐Benz CLK C209 Bremen DE H2 07 2007 21,343 16,460 0 0 0 0 0 0 0 0 0 0Daimler Mercedes‐Benz CLK (cabrio) A209 Bremen/ Osnabrück (KarmanDE H2 07 2007 19,267 15,373 4,056 0 0 0 0 0 0 0 0 0Daimler Mercedes‐Benz SL R230 Bremen DE H2 01 2010 9,817 15,401 4,609 4,864 2,500 0 0 0 0 0 0 0Daimler Mercedes‐Benz SL (incl. SSK) W212/ R231 Sindelfingen DE H2 11 0 0 0 0 500 14,000 14,500 12,250 10,750 10,250 9,500 8,750Daimler Mercedes‐Benz Sub SLS SLS Sindelfingen DE H2 15 0 0 0 0 0 0 0 2,500 5,000 6,000 5,000 4,500Daimler Mercedes‐Benz SLS/SLC SLS Sindelfingen DE H2 10 2010 0 0 141 4,807 3,250 2,250 1,750 1,200 1,000 800 2,000 2,500Daimler Mercedes‐Benz GLK W204 Bremen DE H1 08 2015 0 23,537 63,518 76,795 96,000 86,000 80,500 65,000 85,000 88,000 86,000 81,000Daimler Mercedes‐Benz Viano/Vito W639 Vitoria SP Q2 02 2013 97,103 102,494 54,601 70,248 78,000 70,500 65,000 44,000 0 0 0 0Daimler Mercedes‐Benz Viano/Vito W640 Vitoria SP H1 13 0 0 0 0 0 0 0 13,000 79,000 86,000 84,500 83,000Daimler Mercedes‐Benz New Sprinter NCV3 Düsseldorf/ Ludwigsfelde DE Mid 06 2015‐6 124,482 118,754 73,943 113,829 132,500 138,500 125,000 109,000 88,000 91,000 106,000 115,000Daimler Dodge/ Freightliner Sprinter Dusseldorf DE 2006 25,984 18,009 1,906 5,023 1,900 0 0 0 0 0 0 0Daimler VW Crafter Düsseldorf/ Ludwigsfelde DE Contract run2006 49,867 54,008 30,133 35,103 40,000 33,500 27,500 20,000 14,500 12,000 0 0Daimler Mercedes‐Benz Sprinter GAZ RU 2012 0 0 0 0 0 1,869 18,000 22,000 25,000 26,500 29,000 30,500Daimler Mercedes‐Benz G‐Wagen Graz (Magna‐Steyr factory) AU Major FL 2013 4,442 5,481 3,913 5,304 7,122 8,750 10,750 11,500 10,250 9,500 9,000 8,000Daimler Mercedes‐Benz Total 1,279,654 1,202,414 924,352 1,207,929 1,254,072 1,258,219 1,395,500 1,445,950 1,463,000 1,419,050 1,416,750 1,396,750Daimler Smart ForTwo A451 / C451 Hambach FR Q1 07 2014 102,660 139,964 115,469 97,435 103,560 103,000 99,000 15,000 0 0 0 0Daimler Smart New ForTwo C453 Hambach FR H1 14 0 0 0 0 0 90,000 120,000 117,500 108,000 105,000Daimler Smart Total 102,660 139,964 115,469 97,435 103,560 103,000 99,000 105,000 120,000 117,500 108,000 105,000Chrysler Chrysler Crossfire W202/ R170 Osnabrück (Karmann) DE H2 03 2008+ 716 0 0 0 0 0 0 0 0 0 0 0Chrysler Chrysler Crossfire Roadster W202/ R170 Osnabrück (Karmann) DE H2 04 2008+ 1,398 0 0 0 0 0 0 0 0 0 0 0Chrysler Chrysler 300C Hemi Graz (Magna) AU Q3 05 2010+ 19,078 11,426 2,146 3,002 0 0 0 0 0 0 0 0Chrysler Chrysler Voyager/ Grand Voyager RS Graz (Magna) AU H2 06 2006 20,619 1,500 0 0 0 0 0 0 0 0 0 0Chrysler Chrysler Total 41,811 12,926 2,146 3,002 0 0 0 0 0 0 0 0Chrysler Jeep Grand Cherokee WK Graz (Magna) AU Q1 05 22,540 14,318 3,041 2,495 0 0 0 0 0 0 0 0Chrysler Jeep Commander WK Graz (Magna) AU Q3 07 2010 6,673 2,463 189 0 0 0 0 0 0 0 0 0Chrysler Jeep Total 29,213 16,781 3,230 2,495 0 0 0 0 0 0 0Daimler Maybach Maybach W220 Sindelfingen DE H1 2012 320 317 205 157 200 190 0 0 0 0 0 0Daimler Maybach Total 320 317 205 157 200 190 0 0 0 0 0 0Daimler & Chrysler Total 1,453,658 1,372,402 1,045,402 1,311,018 1,357,832 1,361,409 1,494,500 1,550,950 1,583,000 1,536,550 1,524,750 1,501,750

EUROPEAN CAR AND LCV PRODUCTION OUTLOOK REPORT November 2013| Page 44
Fiat-Chrysler Corporate Developments
Sergio Marchionne, CEO of both Fiat & Chrysler, continues to push for full merger of Fiat and Chrysler, as soon as possible, although Fiat cannot reach agreement with the remaining shareholders in Chrysler. An IPO for the Chrysler shares which Fiat does not own still seems likely. At present Fiat owns 58.5% of Chrysler and wants to acquire the remaining stake owned by VEBA, a healthcare trust affiliated to the UAW. A key reason why Fiat wants full control of Chrysler is to have access to and control over the use of Chrysler $12bn cash reserves – this money is earmarked to help fund the turnaround strategy which Fiat wants to implement in Europe, particularly the new model programme at Alfa. The financial significance of Chrysler to Fiat cannot be underestimated; without Chrysler, Fiat would have posted a €1.04bn loss in 2012. Q1/2013 profit fell as Chrysler earnings fell, due to product launch costs, and continued problems with Fiat in Europe. 500L success has reduced losses in Europe, although delays in full launch of 500L variants had an impact on H2 figures. Q2 revenue was €22.3bn versus €21.5bn in the same period in 2012, with Chrysler continuing €12.9bn and €12.3bn in respective years. However it is again at the profit level that Chrysler’s significance is notable with total group trading profit at €1.03bn – of which Chrysler contributed €904mn. Fiat’s losses in Europe narrowed from €138mn to €98mn for the quarter, following a renewed attack on costs. That said, it is generally believed that Fiat still needs to cut costs at Melfi remains as Punto production falls and launch of 500X/Jeep B-SUV is still more than a year away. These results were generally in line with market expectations, and the company said it still expected full year revenue of €88-92bn and a trading profit of €4-5bn, with net earnings in the range €1.2-1.5bn. In the Q3 results, there was a mixed bag with positive signs amidst the uncertainty of the Chrysler takeovers situation. Group revenue was €20.7bn, up 1.4% in nominal terms, but up 8% at constant exchange rates. Maserati more than doubled its turnover compared the prior year. Group trading profit was down, from €901mn to €816mn, largely due to currency factors; losses in Europe were reduced by €73mn to €165mn, and net profit rose from €171mn to €189mn. European figures are now reported as part of the EMEA region for which Q3 sales were up 4% to 211,000 units; passenger car sales were up 6% and LCVs were unchanged. Revenue for the quarter was up slightly from €3.82bn to 3.86bn, but the area still report a loss of €119mn, albeit an improvement from the €219mn loss in the same quarter a year earlier. For the nine months to September, regional revenues were down €258mn to €12.99n, while losses “improved” from €573mn €304mn. In late October, Fiat completed the acquisition of the 50% stake in VM Motori, previously held by GM, at a price of €34.1mn; Fiat now has full control and VM will continue to supply engines throughout the Fiat-Chrysler group, including the new diesel for Maserati; engines will continue to be supplied to London Taxis as well.

EUROPEAN CAR AND LCV PRODUCTION OUTLOOK REPORT November 2013| Page 45
Fiat-Chrysler New Model News
2012 saw major new model programme announced: 19 new Italian made models, including variants to be launched by 2013, although the Alfa programme has been delayed since this announcement – indeed the first all-new Alfa is now expected in early 2015, rather than 2014 in the original plans. Alfa model plans are also somewhat up in the air, with the possibility of a large rear-wheel-drive models being developed off a Chrysler/Dodge model. In November, Marchionne said the company should be able to announce its revised plans for the Alfa brand by the end of Q1/2014. The RWD platform is still being worked on and the company still plans to produce the Giulia, a large sedan and a mid-szied SUV. The low volume 4C sports car is on track, but the Giulietta won’t be replaced now before 2016 and the Giulia has been delayed, by at least a year. The C-SUVs to be made in Italy are still planned but again design and other engineering issues have put these models’ launch back until at least 2015. Progress however is being made with Maserati, with the new Ghibli due to be in production before the end of 2013, at an annual rate of up to 25,000 upa, a volume which it may achieve although we have doubts that it will reach this level as quickly as Fiat hope – the competition from BMW and others is fierce and they have very loyal customer bases and distribution networks, things which Maserati currently lacks. As noted previously, Fiat intends to make all future Fiat models based on the 500 and Panda; Punto now likely to be replaced by extended Panda, and called Pandona. Expansion of 500 range continues; 500L 5- and 7-seaters have started production in Serbia, joined by Polish production of 500 Trekking, a 2WD crossover version, preceding 4WD 500X, also to be made for Jeep. The 500L received a major boost in October when it received the top safety rating from the US IIHS, a “prize” which should boost US sales.
Manufacturing News
While the Alfa model programme remains in limbo, Fiat had said it will proceed with the €1bn investment required at Mirafiori to make the Maserati SUV there from late 2014. This investment will be good news for the workers there who have been given an extended layoff owing declining sales of the Punto and other models currently made there – only 11,000 vehicles left the factory in H1, against a full year capacity of 300,000 units Official commitment to making 280,000 small 4WDs (500X and Jeep equivalent) has been announced, although we think this is too optimistic and our projections are rather more cautious. Earlier in 2013, Fiat had announced agreement to invest €700mn in Sevel Sud, the van JV with PSA; interestingly, although this is a 50:50 JV, Fiat will contribute €550mn and PSA €150mn. Investment will be mainly in robots for welding and a new spray paint system. Significantly, Marchionne suggested that this would be the last investment in Fiat until union agreement was finalised regarding working arrangements and labour costs – the implications of this for ongoing investment in Melfi and Mirafiori (below) remains to be seen. It does seem as though the initial investment in Mirafiori for Maserati has been approved but further investment will await finalisation of the Chrysler takeover.

EUROPEAN CAR AND LCV PRODUCTION OUTLOOK REPORT November 2013| Page 46
Fiat-Chrysler
As noted before, 500 to be made in Poland only from 2015-6 model change; Mexican production to end to give Tychy better production scale. Next 500 will have common structure for all versions: the current European and North American models currently very different. 500L output in Serbia being raised – potentially above rate projected here; however until production and sales are underway, caution is advisable here. Serbian plant has added XL version for US and low cost/spec version for local market during H1/2013. At the end of October, Fiat and its Turkish partner, Koc, confirmed investment plans for the Tofas JV. Around US$5209mn will be invested between 2015 and 2023, with the aim for Tofas to be able to make around 580,000 vehicles by this date, a substantial increase on current capacity. Much of this increase in capacity will be for export markets, not just from Turkey to the rest of Europe, but also the near and Middle East, as well as further afield. It is likely that Tofas will concentrate on small LCVs for European and global markets, and on cars for regional markets. As a sign of the increasing international supply of Fiat group models, in November the company confirmed that the Ducato van is now on sale in North America, as the Ram ProMaster – this replaces the Dodge version of the Mercedes Sprinter which the company used to sell.
Alliances Two alliances with PSA in LCVs continue, in Italy and Turkey but joint production in France will soon finish – Fiat will continue to source the Scudo until 2016; arrangements in Italy and Turkey expected to last into 2020s, although officially the Sevel Sud JV is fixed only until 2019.. Production contract for Opel Combo at Tofas in Turkey remains.
Production Outlook
Fiat brand production to fall c1mn in 2014; recovery to 2017/8 remains highly dependent on production growth in Italy. Poland, Serbia and Russia, and on US market accepting European products; while we remain hopeful this will be a success, some doubts have to remain here as this is an entirely new approach for Fiat.

EUROPEAN CAR AND LCV PRODUCTION OUTLOOK REPORT November 2013| Page 47
Fiat-Chrysler Production Outlook to 2018 (Fiat)
Group Marque Model range Series (platform) Plant CountryStart of Prod'n
End of Prod'n
Next new model 2007 Production 2008 Production
2009 Production 2010 Production 2011 Production 2012 Production
Production Outlook 2013
Production Outlook 2014
Production Outlook 2015
Production Outlook 2016
Production Outlook 2017
Production Outlook 2018
Fiat Fiat Seicento 187 Tychy PL 35,976 25,166 10,794 9,152 0 0 0 0 0 0 0 0Fiat Fiat New City Car (sub 500) 312 Tychy PL H1 13 2016 0 0 0 0 0 0 0 0 30,000 75,000 90,000 86,500Fiat Fiat 500 312 Tychy PL Mid 2007 2012 FL, new 20 65,116 201,825 184,143 185,102 157,233 151,354 187,500 167,500 185,000 209,000 215,000 212,000Fiat Fiat Additional 500 variants 312 Tychy PL Start 2016 0 0 0 0 0 0 0 0 0 25,000 75,000 69,000Fiat Ford Ka 312 Tychy PL Mid 2008 2008 0 19,046 112,493 92,927 67,204 54,613 50,500 41,000 19,000 0 0 0Fiat Fiat Panda 169 Tychy PL H1 03 2011 260,775 246,849 298,020 246,067 205,765 94,002 0 0 0 0 0 0Fiat Fiat New Panda Pomigliano IT H2 11 0 0 0 0 3,159 104,373 151,000 139,000 125,000 75,000 15,000 0Fiat Fiat Pandona (Punto replacement) Panda/316 Pomigliano IT Mid 2016 0 0 0 0 0 0 0 0 0 25,000 125,000 175,000Fiat Fiat Grande Punto Corsa/199 Melfi/ Mirafiori IT H1 06 2013 339,737 226,565 274,781 236,588 224,565 138,454 133,000 109,000 80,000 68,000 12,500 5,000Fiat Fiat Grande Punto 179/188 Mirafiori IT H1 06 9,302 8,841 5,911 6,748 9,603 5,500 3,500 2,500 0 0 0 0Fiat Fiat 500X ‐ SUV like version 500L/338 Melfi IT H2 14 2014 0 0 0 0 0 0 0 4,000 98,000 105,000 99,000 96,500Fiat Jeep B‐SUV ‐ version of 500X 500L Melfi IT H2 14 2014 0 0 0 0 0 0 0 10,000 125,000 135,000 125,000 112,000Fiat Fiat Punto 179/188 Mirafiori IT H2 06 2006 82,562 37,483 60,465 31,695 0 0 0 0 0 0 0 0Fiat Fiat Punto 179/188 Mirafiori IT H2 06 2006 7,078 4,068 1,975 1,437 0 0 0 0 0 0 0 0Fiat Fiat Punto 179/188 Zastava Serbia H1 13 0 0 15,000 15,000 8,000 0 0 0 0 0 0 0Fiat Fiat 500L ‐ new 5‐ & 7‐seater MPVs L0330 Zastava Serbia H1 12 0 0 0 0 0 30,000 131,000 145,000 150,000 145,000 143,000 139,500Fiat Fiat Idea 188/350 Mirafiori IT H2 03 2011 23,206 13,227 9,488 5,864 5,874 2,381 0 0 0 0 0 0Fiat Fiat Idea 188/350 Mirafiori IT H2 03 2011 232 189 66 39 0 0 0 0 0 0 0 0Fiat Fiat Stilo 192 Cassino IT Mid 06 2006 12,507 281 0 0 0 0 0 0 0 0 0 0Fiat Fiat Stilo 192 Cassino IT Mid 06 2006 812 21 0 0 0 0 0 0 0 0 0 0Fiat Fiat Bravo 198 Cassino IT End 2006 2011 115,328 86,051 63,785 44,685 30,065 16,833 13,250 10,000 2,500 0 0 0Fiat Fiat Bravo 198 Cassino IT 0 472 478 500 626 200 0 0 0 0 0 0Fiat Fiat New Bravo CANCELLED 317 Cassino IT H1 13 0 0 0 0 0 0 0 0 0 0 0 0Fiat Fiat Croma Vectra (Epsilon) Cassino IT H2 05 2012 24,992 26,722 11,363 9,328 0 0 0 0 0 0 0 0Fiat Fiat Croma Vectra (Epsilon) Cassino IT H2 05 2010+ 18 10 0 0 0 0 0 0 0 0 0 0Fiat Fiat Multipla 186 Mirafiori IT 2009 19,771 16,015 9,802 7,835 0 0 0 0 0 0 0 0Fiat Fiat Multipla 186 Mirafiori IT 2009 450 390 194 72 0 0 0 0 0 0 0 0Fiat Fiat Ulysse VF Valenciennes (Sevel Nord) FR Q1 02 2011 4,504 2,688 1,717 888 0 0 0 0 0 0 0 0Fiat Fiat Scudo U Valenciennes (Sevel Nord) FR Q1 02 2012 41,008 35,856 17,837 19,450 19,786 14,250 11,500 9,500 6,500 4,500 2,000 0Fiat Fiat Ducato X250 Val di Sangro (Sevel Sud) IT H2 06 2016 136,440 140,036 70,674 105,548 125,944 120,000 98,750 85,000 75,000 69,500 65,000 62,500Fiat Iveco Daily Brescia IT Pre 2002 2010+ 51,054 42,982 23,455 30,013 30,665 30,000 27,500 29,250 34,500 36,250 38,000 37,000Fiat Iveco Daily Valladolid SP Pre 2002 2010+ 40,329 30,799 12,334 15,500 16,000 14,500 11,500 10,000 13,500 15,000 16,000 15,000Fiat Fiat Palio 178 Bursa (Tofas) TU 2009+ 3,101 2,161 1,771 1,628 1,000 0 0 0 0 0 0 0Fiat Fiat Palio 178 Bursa (Tofas) TU 2009+ 1,400 163 122 0 0 0 0 0 0 0 0 0Fiat Fiat Albea 178 Bursa (Tofas) TU 2012/3 28,896 27,353 12,009 23,041 10,000 Included in Linea from 2012 0 0 0 0 0Fiat Fiat New B 326 Bursa (Tofas) TU H2 14 2014 0 0 0 0 0 0 0 0 23,500 67,500 85,000 82,250Fiat Fiat Linea D200 Bursa (Tofas) TU H2 07 2014 23,147 18,043 14,065 21,650 35,000 44,250 38,750 31,000 12,500 0 0 0Fiat Fiat New Linea 342 Bursa (Tofas) TU H1 15 2015 0 0 0 0 0 0 0 0 30,000 68,000 73,250 70,750Fiat Fiat and PSA Fiorino/Nemo/Bipper Bursa (Tofas) TU H2 08 2015/6 10,639 111,810 99,069 123,635 0 0 0 0 0 0 0 0Fiat Fiat and PSA Fiorino/Nemo/Bipper Bursa (Tofas) TU H2 08 2015/6 0 0 48,909 43,682 0 0 0 0 0 0 0 0Fiat Fiat and PSA Fiorino/Nemo/Bipper Bursa (Tofas) TU H2 08 2015/6 0 0 0 0 139,000 102,500 104,250 107,500 102,000 98,000 111,000 145,000Fiat Fiat Doblo 178/223 Bursa (Tofas) TU 2009 98,108 78,768 59,720 0 0 0 0 0 0 0 0 0Fiat Fiat Doblo 178/223 Bursa (Tofas) TU 2009 40,235 27,259 18,425 0 0 0 0 0 0 0 0 0
Fiat Fiat Doblo, inc Ram versions for US fro199/263 Bursa (Tofas) TU H2 09 2009 0 0 incl. in Doblo above 178
98,649 118,000 89,000 83,500 96,250 101,000 99,000 97,250 96,500
FIat Opel New Combo based on Doblo 199/263 Bursa (Tofas) TU H2 11 0 0 0 0 10,500 19,000 16,500 16,000 15,250 14,500 13,750 14,000Fiat Fiat Other Bursa (Tofas) TU 7,008 1,872 0 0 0 0 0 0 0 0 0 0Fiat Fiat/Jeep Various Fiat/Iveco vans and Jeep Various New Russian plant RU H2 13 0 0 0 0 0 0 0 5,000 30,000 38,000 45,000 50,000Fiat Fiat Total 1,483,731 1,433,011 1,438,865 1,376,723 1,217,989 1,031,210 1,062,000 1,017,500 1,258,250 1,372,250 1,445,750 1,468,500Fiat Alfa Romeo Total 151,499 109,428 104,022 120,068 136,121 92,053 86,300 78,750 82,000 143,900 207,150 227,400Fiat Lancia Total 117,864 113,298 113,796 97,963 108,172 75,183 74,250 68,750 60,500 45,000 36,500 65,000Fiat Chrysler/Jeep Total 0 0 0 0 0 0 0 1,000 15,000 25,000 30,000 33,000Fiat Ferrari Total 6,561 6,722 6,213 6,627 7,314 7,663 7,850 7,400 7,700 8,000 8,250 8,500Fiat Maserati Total 7,669 9,294 4,041 5,842 6,161 6,204 15,250 28,950 53,250 61,500 64,250 57,500Fiat ALL Total 1,767,324 1,671,753 1,666,937 1,607,223 1,475,757 1,212,313 1,245,650 1,202,350 1,476,700 1,655,650 1,791,900 1,859,900

EUROPEAN CAR AND LCV PRODUCTION OUTLOOK REPORT November 2013| Page 48
Fiat-Chrysler Production Outlook to 2018 (Alfa, Lancia, Maserati, Ferrari, Chrysler/Jeep)
Group Marque Model range Series (platform) Plant CountryStart of Prod'n
End of Prod'n
Next new model 2007 Production 2008 Production
2009 Production 2010 Production 2011 Production 2012 Production
Production Outlook 2013
Production Outlook 2014
Production Outlook 2015
Production Outlook 2016
Production Outlook 2017
Production Outlook 2018
Fiat Fiat Total 1,483,731 1,433,011 1,438,865 1,376,723 1,217,989 1,031,210 1,062,000 1,017,500 1,258,250 1,372,250 1,445,750 1,468,500Fiat Alfa Romeo Mi.To 955 Mirafiori IT H2 08 2016 0 24,759 65,342 50,391 41,077 24,857 21,500 17,000 14,500 30,000 49,500 55,000Fiat Alfa Romeo 147 937 Pomigliano IT Late 06 57,441 30,906 12,281 4,036 0 0 0 0 0 0 0 0Fiat Alfa Romeo Giulietta 940 Cassino IT Q4 09 2016 0 0 0 46,619 82,236 67,196 64,000 59,000 45,000 50,000 67,500 62,500Fiat Alfa Romeo Torino CANCELLED 940 Cassino IT H2 10 0 0 0 0 0 0 0 0 0 0 0 0Fiat Alfa Romeo 159 939 Pomigliano IT Q3 05 70,822 42,129 22,514 14,469 12,808 0 0 0 0 0 0 0Fiat Alfa Romeo Giulia 940 Cassino IT H2 15 2015 0 0 0 0 0 0 0 0 15,000 35,000 45,000 49,500Fiat Alfa Romeo GT (159) 947 Pomigliano IT Q1 04 13,322 5,305 1,259 1,237 0 0 0 0 0 0 0 0Fiat Alfa Romeo Crossover D Evo Cassino IT H2 16 2016 0 0 0 0 0 0 0 0 0 5,000 15,000 30,000Fiat Alfa Romeo 166 936 Mirafiori IT Q1 07 632 0 0 0 0 0 0 0 0 0 0 0Fiat Alfa Romeo 168 ‐ name unknown yet New Mirafiori IT H2 16 2016 0 0 0 0 0 0 0 0 0 5,000 10,000 12,500Fiat Alfa Romeo Luxury SUV Mirafiori IT H2 2014 0 0 0 0 0 0 0 0 3,500 15,000 16,500 14,500Fiat Alfa Romeo Brera 946 Grugliasco (Pininfarina) IT H1 07 4,755 3,770 1,661 1,718 0 0 0 0 0 0 0 0Fiat Alfa Romeo Brera Spyder 938 Grugliasco (Pininfarina) IT H1 06 4,527 2,559 965 1,598 0 0 0 0 0 0 0 0Fiat Alfa Romeo 4C Modena IT H1 13 2013 0 0 0 0 0 0 800 2,750 4,000 3,900 3,650 3,400Fiat Alfa Romeo Total 151,499 109,428 104,022 120,068 136,121 92,053 86,300 78,750 82,000 143,900 207,150 227,400Fiat Lancia Ypsilon 188/843 Termini Imerese IT Q2 03 Mid 2011 FL 2006, all new 76,149 55,861 50,999 48,859 36,876 0 0 0 0 0 0 0Fiat Lancia Ypsilon/Deltina 199/846 Tychy PL Mid 2011 2018 0 0 0 207 37,558 48,524 62,250 58,750 53,000 45,000 36,500 65,000Fiat Lancia Musa 188/350 Mirafiori IT Q3 04 2011 36,592 32,220 31,142 24,138 15,642 14,405 0 0 0 0 0 0Fiat Lancia Delta 844 Cassino IT H2 08 2008 0 20,638 29,568 23,198 18,096 12,254 12,000 10,000 7,500 0 0 0Fiat Lancia Thesis 841 Mirafiori IT 2007 885 511 91 0 0 0 0 0 0 0 0 0Fiat Lancia Phedra VL Valenciennes (Sevel Nord) FR Q1 02 2011 4,238 4,068 1,996 1,561 0 0 0 0 0 0 0 0Fiat Lancia Total 117,864 113,298 113,796 97,963 108,172 75,183 74,250 68,750 60,500 45,000 36,500 65,000Fiat Chrysler/Jeep C/D Seg cars/Cross‐overs Various Cassino IT 2014/5 0 0 0 0 0 0 0 1,000 15,000 25,000 30,000 33,000Fiat Chrysler/Jeep Total 0 0 0 0 0 0 0 1,000 15,000 25,000 30,000 33,000Fiat Ferrari Ferrari All Maranello IT 6,561 6,722 6,213 6,627 7,314 7,663 7,850 7,400 7,700 8,000 8,250 8,500Fiat Ferrari Total 6,561 6,722 6,213 6,627 7,314 7,663 7,850 7,400 7,700 8,000 8,250 8,500Fiat Maserati Boxster rival TBC IT 2016 0 0 0 0 0 0 0 0 0 3,000 4,500 4,250Fiat Maserati Ghibli M157 Grugliasco IT H1 2014 0 0 0 0 0 0 5,000 14,000 19,000 22,500 24,500 21,500Fiat Maserati Quattroporte Modena IT 5,334 3,706 1,254 1,411 1,592 1,392 500 0 0 0 0 0Fiat Maserati New Quattroporte M156 Grugliasco IT H2 2013 0 0 0 0 0 0 4,000 9,000 12,500 11,000 10,000 9,500Fiat Maserati Levante Grand Cherokee Mirafiori IT H2 2014 0 0 0 0 0 0 0 1,750 15,250 18,000 19,000 16,500Fiat Maserati Coupe / GT / Gran Cabrio Modena IT 2015 2,335 5,588 2,787 4,431 4,569 4,812 5,750 4,200 6,500 7,000 6,250 5,750Fiat Maserati Total 7,669 9,294 4,041 5,842 6,161 6,204 15,250 28,950 53,250 61,500 64,250 57,500Fiat ALL Total 1,767,324 1,671,753 1,666,937 1,607,223 1,475,757 1,212,313 1,245,650 1,202,350 1,476,700 1,655,650 1,791,900 1,859,900

EUROPEAN CAR AND LCV PRODUCTION OUTLOOK REPORT November 2013| Page 49
Ford Corporate Developments
European losses hit group performance; Q4/2012 saw Ford’s best global performance in 10 years, despite European problems. Q4 loss in Europe due to “unfavourable volume and model mix” issues; 2013 expected to be worse. 2013 losses in Europe likely to top $2bn as restructuring costs begin to be incurred (Europe lost $732mn in 2012); the full benefit from closing Genk and two UK operations – plus parallel move of production from Belgium to Spain and some from Spain to Germany – will take some years to materialise. In Q3 Ford posted losses for Europe of US£228mn, a major improvement on the US$468mn loss for the same quarter last year. Ford has benefited from improved pricing in the last quarter and this has clearly helped its bottom line. The company has already incurred US$250mn for Q1-3 on restructuring costs associated with closing Genk and Southampton. Most of this sum was for pay-offs for redundant workers. Although the company has started to restructure in Europe, its European CEO, Stephen Odell said just before the Frankfurt show that Ford was expecting to lose $1.8bn in Europe in 2013 – the benefits from the recent cuts will not be felt for a while yet. However in the Q3 results, the company said it now expected its full 2013 loss to be less than the loss in 2012, which is a significant improvement on the guidance given earlier in the year. This suggests that Odell’s earlier comments that he did not expect any further cutbacks in the near future seem justified; Odell had naturally added a rider, ie that Ford will “continue to keep production in balance with demand”. The company then added after the Frankfurt show that it was on track to be profitable in Europe by 2015, although this was predicated on a growth in the European market of “about 20% through the next five years or so …” – this would be equivalent of another 2.7mn vehicles being added to the annual size of the market, based on current projections of a 13.5mn sales volume for Europe
New Model News Previously we noted Ford’s plan to offer an upscale version of the Mondeo, called Vignale. This is similar to the DS strategy at Citroen and the planned Initiale range at Renault. We remain to be convinced that a volume brand can move upmarket simply by providing a high specification version of an existing model which is what Vignale is. Nonetheless, Ford expects half the customers for the Vignale models to come from premium brands – the Vignale will cost c€3-4,000 more than the Mondeo. The next Ka is likely now to come from Brazil initially, although it would not be surprising if this model were eventually added to the Romanian factory’s production line-up.
Manufacturing News
Although there have been no major changes since the announcement of the closure of Southampton, Dagenham and Genk, Ford announced a production slowdown in November at its Romanian plant due to slow sales of the B-Max. Ford planned to make >100,000 units in 2013 but sales have been much below this level: hence the production slowdown. Meanwhile, although expansion in Russia continues, Ford has announced that it has slowed production in Russia in August and September. Moreover from the end of September the St Petersburg plant will move to two shifts from three. In the long run, Ford will divide production in Russia between St Petersburg (150,000) and Sollers (200,000); this may lead to some of the models currently made or due to be made at Sollers being made in St Petersburg. Kits for Transit assembly will be shipped to Malaysia from early 2014; volumes have not been framed. This news follows from the announcement that Ford will be making a major push in the Middle East and Africa in the next two years – several European models will be part of a series of 17 new or refreshed models to be sold in these important emerging markets from next 2014 onwards.
Alliances No major news since the last report: Alliance with Daimler and Nissan in fuel cells signed in January; first vehicles due by 2017.

EUROPEAN CAR AND LCV PRODUCTION OUTLOOK REPORT November 2013| Page 50
Ford Production Outlook
Total production growth over next few years will be driven by Russia and LCVs in Turkey/Spain. European production including Russia to rise from 1.3mn in 2012 to c1.7mn by 2017/8; c1/2 of this growth will come in Russia, the balance shared between new Fiesta and widening LCV range, ie Transit, Transit Connect, Transit Courier.
Ford Production Outlook to 2018 Group Marque Model range Series (platform) Plant Country
Start of Prod'n
End of Prod'n
Next new model
2007 Production 2008 Production 2009 Production 2010 Production 2011 Production 2012 ProductionProduction
Outlook 2013Production
Outlook 2014Production
Outlook 2015Production
Outlook 2016Production
Outlook 2017Production
Outlook 2018
Ford Ford Ka BE146 Valencia SP H1 96 Q3 07 2008 53,012 35,761 0 0 0 0 0 0 0 0 0 0Ford Ford Fiesta B256 Valencia SP Q1 02 H2 08 2008/9 145,784 80,000 0 0 0 0 0 0 0 0 0 0Ford Ford Fiesta B2XX Valencia SP H2 08 H2 2014 0 33,684 169,306 108,986 50,000 14,500 0 0 0 0 0 0Ford Ford Fiesta B256 Cologne DE Q1 02 2008/9 269,001 126,116 0 0 0 0 0 0 0 0 0 0Ford Ford Fiesta B2XX Cologne DE H2 08 2015‐6 0 138,854 343,757 340,548 333,000 325,000 345,000 319,000 375,000 405,000 449,000 432,000Ford Ford Fusion B226 Cologne DE Q2 02 2009/10 129,847 115,411 55,696 38,971 24,000 6,000 0 0 0 0 0 0Ford Ford B‐Max B232 Craiova RO H2 11 0 0 0 0 0 30,591 75,000 78,000 80,000 74,000 70,000 68,500Ford Ford Focus C307 Saarlouis DE Q3 04 2008 FL 254,421 243,982 208,174 226,308 0 0 0 0 0 0 0 0Ford Ford Focus C307 Valencia SP Q1 05 2008 205,982 208,201 131,041 102,606 59,500 0 0 0 0 0 0 0Ford Ford Focus C307/C346 St Petersburg RU Q2 05 Q3 11 69,088 64,967 37,000 69,722 84,056 93,376 75,000 72,000 80,000 95,000 99,000 93,500Ford Ford Focus C346 Saarlouis DE H2 10 2017‐18 0 0 0 397 280,000 275,000 249,000 244,000 239,000 222,500 210,000 290,000Ford Ford Focus C‐MAX C214 Saarlouis DE 2007 FL 137,821 111,061 69,102 42,570 0 0 0 0 0 0 0 0Ford Ford Focus C‐MAX C344 Valencia SP H1 10 0 0 0 45,058 121,000 106,000 107,500 85,000 0 0 0 0Ford Ford Focus C‐MAX C344 Saarlouis DE H1 14 2017 0 0 0 0 0 0 0 15,000 78,000 70,000 106,500 109,000Ford Ford Focus coupe cabrio S383 Bairo Canavese IT Q2 06 15,088 12,472 3,886 4,346 0 0 0 0 0 0 0 0Ford Ford Kuga (Focus SUV) C394 Saarlouis DE H1 08 0 44,403 62,360 81,074 82,000 54,000 0 0 0 0 0 0Ford Ford Kuga (Focus SUV) C394 Valencia SP H2 12 0 0 0 0 0 13,000 95,000 88,000 79,000 55,000 65,000 69,000Ford Ford Mondeo CD162 Genk BE H1 07 32,346 0 0 0 0 0 0 0 0 0 0 0Ford Ford Mondeo CD3XX Genk BE H2 07 H2 13 142,874 197,503 116,973 110,128 98,750 67,500 55,000 34,500 PLANT CLOSINGFord Ford Mondeo CD3XX Valencia SP H1 14 0 0 0 0 0 0 0 5,000 80,000 90,000 85,000 82,250Ford Ford Mondeo CD3XX St Petersburg RU H1 09 0 0 4,367 10,668 14,751 14,348 7,500 6,500 6,000 11,500 21,000 29,000Ford Ford S‐Max CD3XX Genk BE H1 06 69,108 57,553 41,492 49,786 48,000 33,000 24,500 10,750 PLANT CLOSINGFord Ford S‐Max CD539 Valencia SP H2 14 0 0 0 0 0 0 0 19,000 45,000 43,500 41,500 39,000Ford Ford Galaxy CD3XX Genk BE Q2 06 2013 33,137 33,193 25,441 25,778 27,500 23,500 24,500 9,500 PLANT CLOSINGFord Ford Galaxy CD390 Valencia SP H2 14 0 0 0 0 0 0 0 12,500 25,000 26,500 24,000 22,500Ford Ford Fiesta B2XX Sollers JV RU H2 14 0 0 0 0 0 0 0 5,000 30,000 69,000 83,000 79,000Ford Ford EcoSport B2XX Sollers JV RU H2 13 0 0 0 0 0 0 0 9,000 29,000 32,000 28,500 26,500Ford Ford Kuga (Focus SUV) C394 Sollers JV RU H2 12 0 0 0 0 0 0 0 0 20,000 45,000 65,000 75,000 72,000Ford Ford Explorer/S‐Max/Galaxy/Kuga Various Sollers JV RU H1 12 0 0 0 0 0 0 6,992 19,750 22,250 20,000 19,000 17,000 16,250Ford Ford Transit Transit Sollers JV RU H1 12 0 0 0 0 0 1,263 11,500 16,000 26,500 32,000 31,000 29,000
Ford Ford Fiesta B256/ B2XX Cologne DE 2008+ 12,080 9,815 6,709 11,935 10,000 7,000 5,500 3,500 2,500 0 0 0
Ford Ford Transit Connect V227 Kocaeli TU H2 10 2010 112,093 84,847 54,063 75,588 102,000 75,000 45,000 0 0 0 0 0Ford Ford Transit Connect V227 Craiova RO H2 09 0 0 300 9,558 7,547 0 0 0 0 0 0 0Ford Ford Transit Connect V408 Valencia SP H1 12 0 0 0 0 0 0 33,000 109,000 102,000 96,500 90,000 88,000Ford Ford Transit V347/8 Southampton UK H2 06 2011‐2012 75,662 66,215 20,981 28,270 28,170 28,031 13,000 0 0 0 0 0Ford Ford Transit V347/8 Kocaeli TU H2 06 2011‐2012 2012 162,829 178,051 119,671 175,610 185,000 30,000 10,000 0 0 0 0 0Ford Ford Transit Courier B460 Kocaeli TU H2 13 tbc 0 0 0 0 0 0 0 60,000 92,000 95,000 89,000 84,500Ford Ford Transit V362/3 Southampton UK H1 12 0 0 0 0 0 0 PLANT CLOSINGFord Ford Transit V362/3 Kocaeli TU H1 13 0 0 0 0 0 126,000 183,500 219,500 221,000 224,000 227,000 220,000Ford Ford Total 1,920,173 1,842,089 1,470,319 1,557,907 1,555,274 1,330,101 1,379,250 1,463,000 1,655,000 1,725,500 1,811,500 1,850,000Ford Volvo C30 Y279 Ghent BE H1 07 2012+ 61,284 37,722 31,061 23,420 All production from August 2010 counted in GeelyFord Volvo XC30 Y556 Ghent BE H2 12 2012 0 0 0 0 All production from August 2010 counted in GeelyFord Volvo S30 Y555 Ghent BE H1 12 2012 0 0 0 0 All production from August 2010 counted in GeelyFord Volvo S40 Y276 Ghent BE Q3 04 H2 10 2011+ 55,000 40,579 27,424 14,974 All production from August 2010 counted in GeelyFord Volvo V50 Y280 Ghent BE Q3 04 H2 10 2011+ 60,500 61,090 52,093 35,942 All production from August 2010 counted in GeelyFord Volvo V60 Y283 Gothenburg SE H1 11 0 0 0 0 All production from August 2010 counted in GeelyFord Volvo S60 P24 Ghent BE Q1 00 H2 07 2010+ 37,576 25,461 6,345 0 All production from August 2010 counted in GeelyFord Volvo S60 CD3XX/ Y283 Ghent BE H2 10 0 0 0 2,885 All production from August 2010 counted in GeelyFord Volvo V70 P26/ Y285 Ghent BE Q2 00 Q2 07 2007 37,000 0 0 0 All production from August 2010 counted in GeelyFord Volvo V70 P26/ Y285 Gothenburg SE Q2 00 Q2 07 2007 7,877 0 0 0 All production from August 2010 counted in GeelyFord Volvo V70 CD3XX/ P2X Gothenburg SE Q2 07 2014 30,000 56,003 42,889 26,566 All production from August 2010 counted in GeelyFord Volvo S80 P3X/Y286 Gothenburg SE Q2 06 2013‐14 61,056 29,022 16,858 10,920 All production from August 2010 counted in GeelyFord Volvo V90 P3X Gothenburg SE 2013 tbc 0 0 0 0 All production from August 2010 counted in GeelyFord Volvo XC60 P1/Y359 Ghent BE Q1 08 0 14,682 66,655 46,837 All production from August 2010 counted in GeelyFord Volvo XC70 P26 Gothenburg SE Q3 00 Q2 07 2007 18,522 0 0 0 All production from August 2010 counted in GeelyFord Volvo XC70 CD3XX/ P2X Gothenburg SE Q3 07 20,000 31,046 14,578 12,761 All production from August 2010 counted in GeelyFord Volvo XC90 P28 Gothenburg SE Q2 02 2011FL 79,611 48,336 27,955 21,323 All production from August 2010 counted in GeelyFord Volvo C70 CC Y281 Uddevalla SE Q3 05 2012+ 20,330 12,807 8,250 6,751 All production from August 2010 counted in GeelyFord Volvo Total 488,756 356,748 294,108 202,379 0 0 0 0 0 0 0 0Ford Jaguar X type X400/ CD132 Halewood UK Q1 01 H2 09+ 2009+ 20,153 0 0 0 0 0 0 0 0 0 0 0Ford Jaguar S type X200/ DEW98 Castle Bromwich UK H2 99 2008 11,042 0 0 0 0 0 0 0 0 0 0 0Ford Jaguar XF X250 Castle Bromwich UK H1 08 1,436 0 0 0 0 0 0 0 0 0 0 0Ford Jaguar XJ / XJR X350/ DEW98 Castle Bromwich UK H2 02 2010 major FL 9,948 0 0 0 0 0 0 0 0 0 0 0Ford Jaguar XK / XK8 X150 Castle Bromwich UK H1 06 11,233 0 0 0 0 0 0 0 0 0 0 0Ford Jaguar Total 53,812 0 0 0 0 0 0 0 0 0 0Ford Land Rover Freelander P1/L359 Halewood UK Mid 2006 76,258 0 0 0 0 0 0 0 0 0 0 0Ford Land Rover New Discovery L319 (T5) Solihull UK Q2 04 2010 FL 43,919 0 0 0 0 0 0 0 0 0 0 0Ford Land Rover Range Rover Sport L321 Solihull UK Q2 05 2005 61,021 0 0 0 0 0 0 0 0 0 0 0Ford Land Rover Range Rover L322 Solihull UK H2 01 2012 30,057 0 0 0 0 0 0 0 0 0 0 0Ford Land Rover Defender Solihull UK 2011 21,293 0 0 0 0 0 0 0 0 0 0 0Ford Land Rover Total 232,548 0 0 0 0 0 0 0 0 0 0Ford Mazda Mazda 2 B256 / J37 Valencia SP H1 07 14,235 0 0 0 0 0 0 0 0 0 0 0Ford Mazda Total 14,235 0 0 0 0 0 0 0 0 0 0 0Ford ALL Total 2,709,524 2,198,837 1,764,427 1,760,286 1,555,274 1,330,101 1,379,250 1,463,000 1,655,000 1,725,500 1,811,500 1,850,000

EUROPEAN CAR AND LCV PRODUCTION OUTLOOK REPORT November 2013| Page 51
GM Corporate Developments
Earlier in the year, there were press reports and rumours regarding GM possibly taking control of or a greater stake in PSA. This was denied by both sides, with the two companies officially remaining committed to making the already agreed model development/platform sharing programmes and joint purchasing arrangements work. This was confirmed in interviews given by GM executives at the Frankfurt motor show in which they noted that three shared model programmes are under way (both based on PSA platforms) and that the key task was to make the existing alliance work before considering further moves in this regard. More recently, as PSA and Dongfeng have started to consider further co-operation, it seems as though GM has begun to roll back from its links with PSA. We would not be surprised to see a gradual unwinding of this alliance, especially as GM’s financial position is improving. Opel’s new CEO, Karl-Thomas Neumann, also emphasised at the Frankfurt show how the company will continue with its 23 new models due in the Drive! 2022 programme announced in 2012. One interesting corporate development at GM Europe has been the transfer of its Russian business into its European operations – according Karl-Thomas Neumann, Russia is already the third biggest market for Opel products so making it a full part of GM Europe is entirely logical. GM is still loss making in Europe and this situation is not going to change in the near future; admittedly European losses in Q2 narrowed from $394mn to $100mn, with the H1 loss totalling $285mn, versus $688mn loss in H1/2012. Q3 results showed an improvement in GM’s financial results for Europe; although it still lost US$214mn in the quarter (versus US$487mn in the same quarter in 2012), the region actually produced increased revenue, up from US$4.7bn to US$4.85bn. Press interviews at Frankfurt also drew comments from GM about the increased closeness of Buick in the US and Opel in Europe; Mark Adams, the former chief designer at Opel, now has this role at Buick and a key task is to find ways of bringing the two brands closer together. Long term the company would like to sell the small Adam in the US as a Buick but the model does not currently meet US safety standards and any redesign to comply with these will have to wait until the next model is launched in 5-7 years time. It is also worth noting that Opel has pulled out of Australia following disappointing sales there; the global expansion of the Opel brand is no longer a corporate objective for the company – the recovery of Opel will come from Europe, including Turkey and Russia but no serious effort will be placed on growing the Opel brand outside Europe. Sales in Israel and the near East may continue, but other GM brands will be used in the main for such markets.
New Model News
The highlights at the recent Frankfurt show where the revamped and improved Insignia and the Monza concept car which indicates the direction in which future Opel designs will move. Key earlier developments repeated here for convenience: Drive 2022: to launch 23 new models (including derivatives) between 2012 and 2016, starting with (imported) Mokka B-segment crossover and Adam B segment “premium” car, followed by new Cascada cabrio. Next new model to be revised Insignia later in 2013. PSA alliance models: the B-MPVs for both GM and PSA have been confirmed for production in Zaragosa from 2016; for now, plans for joint production of both companies’ B-segment car and for the Zafira replacement to come from PSA’s EMP2 platform from 2016/17

EUROPEAN CAR AND LCV PRODUCTION OUTLOOK REPORT November 2013| Page 52
GM remain in place, but it would not surprise us if the joint B car programme were postponed. We no longer think it is likely that the companies will produce vans in a joint programme. Independently developed models: Astra and Insignia remain outside PSA alliance. Increased Insignia volumes likely with versions for other GM brands, eg possible Cadillac version and new Buick Regal, although their production will remain outside Europe. Next Corsa looking increasingly likely to be made on a GM only platform. For now we assume that the replacement for the Agila (currently made by Suzuki in Hungary) will be made in Korea, but it is also possible this could be made in Europe although this remains unconfirmed for now.
Manufacturing News
In early October, GM and PSA confirmed that B-segment MPVs would be made at Zaragosa, the first example of joint manufacturing under the GM-PSA alliances. This will begin in 2016. Q4/2013 will see a slowdown in Corsa and Adam production in Germany, but GM claims this is a natural seasonal adjustment rather than due to a fall in demand: low volume kit assembly of the Corsa has been confirmed for Belarus, with 7,000 units to be made there in 2014. CKD production of current Mokka will be added to Zaragoza from 2014, at least two years earlier than previously planned. Initial investment here will be US$80mn, with significantly more likely to facilitate full manufacture from 2017/8. Decision to produce Mokka in Europe taken following better than expected sales in Europe and lack of capacity to meet global demand in Korea. In addition, Mokka production will help increase capacity utilisation in Spain where production is currently well below the capacity of 480,000 upa. In late September GM confirmed a €130mn investment in Kaiserslautern for a range of activities including: Body parts and front seat structures for the next Astra; Axles and body parts for the Insignia Additional equipment for the new 2.0l diesel engine family to be made there from 2016. Meanwhile, the Bochum factory will close by the end 2014; GM has committed to adding a second model at Russelsheim; we believe this will be the next Zafira. In addition, Russelsheim will make the new F40 transmission.
Alliances Alliance with Renault in large vans remains, with GM to source some versions of new Vivaro from Renault France, especially models which it can’t make in Luton; also Fiat-Tofas to continue supplying Combo (based on Fiat Doblo). The PSA remains in place, with model plans noted above – whether this will remain unchanged for much longer is open to question.
Production Outlook
European production at Opel/Vauxhall is in decline, and will fall below 830,000 next year as its major models age. The new Adam and Cascada will ameliorate but not stymie the fall. We expect Cascada exports beyond the EU to be added in the near term. The company will need to wait for the new Corsa and Astra to come on stream from 2017 and 2015 respectively before any sustained increase in Opel/Vauxhall volumes can be realistically expected. With these new models however, we do expect Opel/Vauxhall volumes to climb back over 1mn by the end of the period covered by this Outlook.

EUROPEAN CAR AND LCV PRODUCTION OUTLOOK REPORT November 2013| Page 53
GM Europe Production Outlook to 2018 Group Marque Model range Series (platform) Plant Country
Start of Prod'n
End of Prod'n
Next new model 2007 Production 2008 Production
2009 Production 2010 Production 2011 Production 2012 Production
Production Outlook 2013
Production Outlook 2014
Production Outlook 2015
Production Outlook 2016
Production Outlook 2017
Production Outlook 2018
GM Opel Agila 302 Gliwice PL Q1 00 Q4 07 2008 13,116 0 0 0 0 0 0 0 0 0 0 0GM Opel Adam Corsa Eisenach DE 2012‐2013 2018 0 0 0 0 0 1,750 60,000 69,000 65,000 63,000 59,000 76,000GM Opel Combo S4300 Zaragoza SP Q4 00 TBC 2010+ 61,416 57,006 29,914 37,068 27,941 0 0 0 0 0 0 0GM Opel Combo S4400 Zaragoza SP H2 12 0 0 0 0 0 0 0 0 0 0 0 0GM Opel Corsa Shared with Punto Zaragoza SP Q2 06 2014/5 283,605 264,250 227,048 222,617 216,084 188,500 220,000 210,000 202,000 188,000 130,000 0GM Opel Corsa GM2XX Zaragoza SP 2017‐18 0 0 0 0 0 0 0 0 0 45,000 199,000GM Opel Corsa Shared with Punto Eisenach DE Q3 06 2014/5 181,684 156,970 133,026 139,185 129,958 104,000 75,000 62,000 45,000 40,000 34,000 0GM Opel Corsa New Eisenach DE 2015 0 0 0 0 0 0 0 0 0 0 29,000 75,000GM Opel Meriva S4316 Zaragoza SP Q3 03 Q4 06 2006 141,359 101,936 82,708 30,846 0 0 0 0 0 0 0 0GM Opel Meriva S4470 Zaragoza SP H1 07 2017 0 0 0 89,614 121,394 76,500 65,000 59,000 46,000 34,500 0 0GM Opel Meriva PSA JV Zaragoza SP 2016 0 0 0 0 0 0 0 0 0 10,000 65,000 77,000GM Citroen C3 Picasso PSA JV Zaragoza SP 2016 0 0 0 0 0 0 0 0 0 20,000 68,750 72,500GM Opel Mokka Korea Zaragoza SP H2 16 2014 CKD/2016 0 0 0 0 0 0 0 10,000 35,000 65,000 78,000 90,000GM Opel Tigra S4300 Cerizay (Heuliez) FR Q3 04 2004 11,770 8,840 3,218 0 0 0 0 0 0 0 0 0GM Opel Astra T3300 Antwerp BE H2 04 219,194 165,505 124,180 75,120 0 0 0 0 0 0 0 0GM Opel Astra T3300 Bochum DE H2 04 124,406 102,696 76,599 45,700 44,379 35,000 0 0 0 0 0 0GM Opel Astra 2010 T3400 Russelsheim DE H2 10 0 0 0 0 18,345 36,500 29,500 14,000 9,000 0 0 0GM Opel Astra (incl. van) T3300 Ellesmere Port UK H2 04 2010 127,954 111,730 71,005 4,633 3,903 5,384 150 0 0 0 0 0GM Opel Astra 2010 T3400 Ellesmere Port UK H2 10 0 0 8,539 102,655 137,971 90,187 76,500 72,000 30,000 0 0 0GM Opel Astra 2015 T3600 Ellesmere Port UK H2 15 0 0 0 0 0 0 0 0 75,000 157,000 162,000 170,000GM Opel Astra T3000 Gliwice PL Q3 04 37,064 29,806 8,454 0 0 0 0 0 0 0 0 0GM Opel Astra T3300 Gliwice PL Q2 07 14,714 33,329 13,013 18,432 21,134 12,469 5,500 0 0 0 0 0GM Opel Astra 2010 T3400 Gliwice PL H2 10 0 0 10,860 120,796 152,881 112,868 103,000 108,000 51,000 0 0 0GM Opel Astra 2015 T3600 Gliwice PL H2 15 0 0 0 0 0 0 0 0 90,000 175,000 160,000 148,000GM Opel Cascada T3400 Gliwice PL H2 12 0 0 0 0 0 0 11,000 14,750 15,500 14,750 13,750 3,500GM Buick and others Non EU Cascasa T3400 Gliwice PL H1 15 0 0 0 0 0 0 0 0 11,000 16,000 20,000 2,500GM Opel and others Cascada 2 G3700 Gliwice PL H1 18 0 0 0 0 0 0 0 0 0 0 0 50,000GM Opel Astra coupe cabrio T3300 Antwerp BE Q2 06 26,763 17,958 4,369 4,093 0 0 0 0 0 0 0 0GM Opel Zafira T3300 Bochum DE Q3 05 2011 67,474 43,875 26,020 74,432 74,371 38,500 25,000 19,000 PLANT CLOSING
GM Opel Zafira T3300 Gliwice PL Q3 05 122,371 108,509 64,072 19,504 0 0 0 0 0 0 0 0GM Opel New Zafira T3470 Bochum DE H 1 11 0 0 0 0 12,577 74,500 64,500 49,500 PLANT CLOSING
GM Opel New Zafira T3470 Russelsheim DE H2 14 0 0 0 0 0 0 0 0 39,000 25,000 0 0GM Opel New C‐MPV (Zafira repl'ment) PSA JV Russelsheim DE H2 16 2016‐7 0 0 0 0 0 0 0 0 0 35,000 85,000 81,000GM Opel Vectra J3200 Rüsselsheim DE Q3 00 Q4 07 2008 116,584 93,942 0 0 0 0 0 0 0 0 0 0GM Opel Insignia, incl. Buick Regal until Q Epsilon 2 ‐ J3700 Rüsselsheim DE H1 08 2016 0 21,918 146,916 177,532 162,410 97,250 91,000 86,000 79,000 73,500 0 0GM Opel Insignia New Insignia Russelsheim DE H1 16 2016 0 0 0 0 0 0 0 0 0 5,000 115,000 130,000GM Opel Signum J3200 Rüsselsheim DE Q1 02 2009+ 9,358 4,163 0 0 0 0 0 0 0 0 0 0GM Opel Vivaro X83 Luton IBC UK H2 06 2006 FL 65,542 60,420 26,413 37,851 53,078 38,841 42,500 20,000 0 0 0 0GM Renault/ Nissan Trafic/ Primastar X83 Luton IBC UK H2 06 2006 FL 29,426 26,828 27,772 34,705 15,001 17,091 50 0 0 0 0 0GM Opel New Vivaro TBC Luton IBC UK H2 13 To be confirmed 0 0 0 0 0 0 0 33,000 63,000 64,000 61,000 59,000GM Opel Total 1,653,800 1,409,681 1,084,126 1,234,783 1,191,427 929,340 868,700 826,250 855,500 985,750 1,125,500 1,233,500GM Chevrolet Aveo / Kalos / Lanos / Matiz Daewoo small Warsaw (FSO) PL Late 06 72,578 90,428 30,949 44,782 4,883 0 0 0 0 0 0 0GM Chevrolet/ Opel Captiva/ Antara/ Cruze and otherVarious Shushary, St Petersburg RU H2 07 5,688 41,159 6,831 23,641 39,000 75,000 102,000 137,000 172,000 177,000 173,000 170,000GM Chevrolet Cruze T3400 Gliwice PL H1 16 0 0 0 0 0 0 0 0 20,000 35,000 33,250 30,000GM Chevrolet Various Korean models Various AvtoTor RU 0 0 0 56,010 70,097 82,887 45,000 57,000 65,000 72,000 71,000 70,000GM Opel Corsa/Astra/Zafira etc Various AvtoTor RU 0 0 2,460 21,893 34,727 48,489 30,000 33,000 35,000 31,000 30,000 28,000GM Various Incl Niva 4x4 and variants TBA AvtoVAZ RU H1 12 25,000 25,000 25,000 36,761 55,403 62,979 54,500 51,000 65,000 69,000 66,000 61,000GM Excludes kits assembled by various Russian and Uzbek assemblers, incl kits of Opel Corsa/Astra/Zafira pre 2010 103,266 156,587 65,240 183,087 204,110 269,355 231,500 278,000 357,000 384,000 373,250 359,000GM Saab 9‐3. J2900/ P440 Trollhattan SE Q3 08 2010? 77,598 59,847 12,378 1,112 All production from March 2010 counted in Saab‐SpykerGM Saab 9‐3 cabrio P442 Graz (Magna) AU 2011? 16,997 11,047 5,057 2 All production from March 2010 counted in Saab‐SpykerGM Saab 9‐5. J2900/ P640/641 Trollhattan SE Q4 08 2010? 22,545 14,391 3,250 368 All production from March 2010 counted in Saab‐SpykerGM Cadillac BLS Trollhattan SE Q2 06 2,772 1,195 0 0 0 0 0GM Saab/Cadillac Total 119,912 86,480 20,685 1,482 0 0 0 0 0 0 0 0GM ALL Total 1,876,978 1,652,748 1,170,051 1,419,352 1,395,537 1,198,695 1,100,200 1,104,250 1,212,500 1,369,750 1,498,750 1,592,500

EUROPEAN CAR AND LCV PRODUCTION OUTLOOK REPORT November 2013| Page 54
Honda Corporate Developments No other major official news since the last report: key earlier developments repeated here for convenience:
800 job losses announced for UK factory in January 2013 – process now complete: one of two assembly lines at Swindon plant switched from double to single shift operation in late February. Honda Europe president admitted at the Geneva motor show that Honda would not be profitable in Europe before 2016; Honda has not actually made money in Europe since 2007.
New Model News Near-production ready version of Civic estate shown at the Geneva show. 2WD version of CRV under development. High performance Civic Type-R will be produced at Swindon from 2015.
Manufacturing News Civic estate starts production in Swindon in late 2013/early 2014, but will not fully replace loss of production when Jazz stops and its replacement comes from outside Europe. Jazz SUV will definitely not be made in Europe. Future success of European operations will depend on the success of Civic and CRV and derivatives; questionable if Honda will be able to fully utilise the capacity at this plant with just two models, unless additional high volume variants of the Civic and/or additional export markets, especially for CRV, are allocated to the plant. Possible that one line could be mothballed and all Civic/CR-V assembled on one line.
Alliances None in Europe
Production Outlook Decision to move production of replacement Jazz outside Europe makes it almost impossible for Honda to fulfil ambition to make 80% of European sales in Europe. Concerns remain whether Honda will fully utilise UK capacity with just a two model production line-up. To help Honda Swindon, HQ needs to allocate more global markets to the Swindon plant; for example diesel powered CR-Vs made in Swindon are sold in Australia, with the petrol versions coming from Thailand. Swindon is the sole global plant for the 5-door Civic. More arrangements like this are required to utilise Swindon fully.
Honda Production Outlook to 2018
Group Marque Model range Series (platform) Plant CountryStart of Prod'n
Next new model
2007 Production 2008 Production 2009
Production 2010 Production 2011 Production 2012 Production
Production Outlook 2013
Production Outlook 2014
Production Outlook 2015
Production Outlook 2016
Production Outlook 2017
Production Outlook 2018
Honda Honda Civic DX Swindon UK Q1 06 2011‐12 139,685 110,293 47,234 45,185 26,215 64,814 100 0 0 0 0 0Honda Honda Civic New Swindon UK Q4 11 2016 0 0 0 0 0 12,725 45,000 48,000 51,000 60,000 65,000 63,500Honda Honda Civic CX Kocaeli TU Q2 06 2012 19,725 46,083 18,264 20,305 12,341 22,500 20,000 17,500 14,000 0 0 0Honda Honda Fit/City Fit Kocaeli TU Q4 05 2016 5,938 3,990 0 0 0 0 0 0 2,500 21,000 22,750 24,000Honda Honda Jazz AZ Swindon UK Q4 09 2013/4 0 0 8,912 33,398 23,273 24,750 23,500 18,750 14,000 0 0 0Honda Honda CRV WL Swindon UK Q2 07 2012‐2013 98,087 120,150 19,437 51,215 47,971 39,237 0 0 0 0 0 0Honda Honda CRV New Swindon UK Q3 2012 2017 0 0 0 0 0 24,104 75,000 78,000 76,500 70,000 75,000 77,000Honda Honda Civic/CRV TBC New Russian plant RU H2 15 0 0 0 0 0 0 0 0 18,000 29,000 33,500 36,750Honda Honda Total 263,435 280,516 93,847 150,103 109,800 188,130 163,600 162,250 176,000 180,000 196,250 201,250

EUROPEAN CAR AND LCV PRODUCTION OUTLOOK REPORT November 2013| Page 55
Hyundai-Kia Corporate Developments
At the Frankfurt motor show, Hyundai announced 22 new models and variants for launch in Europe by 2017, under the banner of “Product Momentum 2017”; this is part of the plan to reach 5% market share by 2020 (the original target was 2016). Key to this is Turkish production of the i10; once this is in full production, 90% of Hyundai’s European sales Europe will be made in the region. A new European corporate HQ was opened in October, expanding space and resources by 50%.
New Model News New cee’d variants through 2014-15. Further models to be added to the Czech and Slovakian plants. Production of the i10 has started. Manufacturing Hyundai has completed the expansion of its Turkish plant – Hyundai Assan (HAOS) – meaning that capacity of 200,000 upa is now in
place; by the end of 2013, US$677mn will have been invested, adding nearly 3,000 jobs. Production of the i10 started in late September and will be running at full rates from early 2014. Investment in Turkey was in the press and body shops, the latter now being fully automated. Trim shop capacity was also doubled.
Alliances None in Europe. Hyundai and Kia plants benefit from close proximity to each other, sharing supply of powertrains parts and also many suppliers. More than 60% of parts for Nosovice are sourced within Czech Rep.
Production Outlook
Across Czech, Slovakia, Turkey and Russia, Hyundai-Kia is already approaching 1mn upa and will pass this level in 2015. Potential exists all plants to increase production. Czech production underpinned by global exports; the factory also ships to Africa, the Caribbean and Australia/Oceania. For example, Hyundai Czech ships i30 3-dr and estate to Australia; but 5-dr version comes from Korea. By contrast RHD i10s, for Ireland and the UK, will come in from India.
Hyundai-Kia Production Outlook to 2018
Group Marque Model range Series (platform) Plant CountryStart of Prod'n
Next new model 2007 Production 2008 Production
2009 Production 2010 Production 2011 Production 2012 Production
Production Outlook 2013
Production Outlook 2014
Production Outlook 2015
Production Outlook 2016
Production Outlook 2017
Production Outlook 2018
Hyundai‐Kia Hyundai Accent Accent Izmit TU 55,971 49,723 40,247 35,854 17,940 3,165 0 0 0 0 0 0Hyundai‐Kia Hyundai i10 Izmit TU H2 2013 0 0 0 0 0 0 8,750 76,000 98,000 102,000 104,000 99,000Hyundai‐Kia Hyundai i20 PB changing to IB Izmit TU H2 2010 2014‐15 0 0 12 34,682 73,262 82,713 89,500 94,000 99,500 106,000 111,000 105,000Hyundai‐Kia Hyundai Matrix Matrix Izmit TU 27,720 30,959 11,823 4,959 90 0 0 0 0 0 0 0Hyundai‐Kia Hyundai H100/H1 Izmit TU 6,499 0 0 0 0 0 0 0 0 0 0 0Hyundai‐Kia Hyundai New H1 Karsan (Bursa) TU 0 0 0 0 574 5,000 15,000 17,500 16,250 15,250 14,250 13,000Hyundai‐Kia Hyundai Turkey Total 90,190 80,682 52,082 75,495 91,866 90,878 113,250 187,500 213,750 223,250 229,250 217,000Hyundai‐Kia Kia cee'd and variants ED Zilina SK Late 06 2012 134,996 163,320 121,635 95,906 103,693 35,287 0 0 0 0 0 0Hyundai‐Kia Kia cee'd and variants ‐ inc. kits for RJD Zilina SK H1 2012 0 0 0 0 0 85,324 127,000 135,000 133,000 129,000 123,500 119,000Hyundai‐Kia Kia Sportage inc. kits for Russia SL Zilina SK H1 09 21,469 37,503 38,515 54,415 101,073 136,325 144,000 141,000 136,500 130,000 121,000 133,000Hyundai‐Kia Kia Venga YN Zilina SK H2 11 0 0 0 0 10,636 35,064 32,000 29,000 25,000 0 0 0Hyundai‐Kia Kia B‐SUV Unknown Zilina SK H1 16 0 0 0 0 0 0 0 0 0 28,500 48,000 60,000Hyundai‐Kia Hyundai ix35 ‐ Tucson replacement EL Zilina SK H1 10 0 0 32 79,184 36,798 0 0 0 0 0 0 0Hyundai‐Kia Kia Total 156,465 200,823 160,182 229,505 252,200 292,000 303,000 305,000 294,500 287,500 292,500 312,000Hyundai‐Kia Hyundai i30 ED Nosovice CZ H2 08 2018 0 11,004 111,036 130,966 107,000 130,353 126,500 124,000 115,000 109,000 103,000 96,000Hyundai‐Kia Hyundai ix20 JC Nosovice CZ H1 11 0 0 0 19,725 46,316 45,391 34,000 30,500 25,500 0 0 0Hyundai‐Kia Hyundai B‐SUV New Nosovice CZ H1 16 0 0 0 0 0 0 0 0 0 40,000 65,000 75,000Hyundai‐Kia Hyundai ix35 LM Nosovice CZ H2 11 2016 0 0 0 0 69,597 127,269 141,000 137,500 124,000 102,000 139,000 145,000Hyundai‐Kia Hyundai ix30 MC Nosovice CZ H2 15 0 0 0 0 0 0 0 0 30,000 35,000 45,000 50,000Hyundai‐Kia Kia Venga YN Nosovice CZ H2 09 0 0 5,164 49,319 28,096 0 0 0 0 0 0 0Hyundai‐Kia Hyundai i40 St Petersburg RU H2 14 0 0 0 0 0 0 0 10,000 24,000 32,000 35,000 31,000Hyundai‐Kia Hyundai 4th model for Russia St Petersburg RU H1 15 0 0 0 0 0 0 0 0 35,000 65,000 75,000 70,000Hyundai‐Kia Kia Rio QBr/UB St Petersburg RU H2 11 0 0 0 0 19,962 100,273 90,500 87,000 84,000 80,000 75,750 71,000Hyundai‐Kia Hyundai Solaris and variants RBr St Petersburg RU H2 10 2015 0 0 0 0 106,165 124,825 115,000 99,000 101,000 108,000 105,500 103,000Hyundai‐Kia Hyundai Total 0 11,004 116,200 200,010 377,136 528,111 507,000 488,000 538,500 571,000 643,250 641,000Hyundai‐Kia ALL Total 246,655 292,509 328,464 505,010 721,202 910,989 923,250 980,500 1,046,750 1,081,750 1,165,000 1,170,000

EUROPEAN CAR AND LCV PRODUCTION OUTLOOK REPORT November 2013| Page 56
PSA Corporate Developments
PSA has had a rather tough time in recent times, but things have begun to turn around for the better since the announcement of the H1 results. The company was able to report results which exceeded analysts’ expectations. H1 revenue was €27.7mn, down 3.8% year-on-year, although most of the decline took place in Q1 when revenue was down by 6.5%. Particular problems were caused by disruption to C3 production at the Aulnay plant (which is due to close). The automotive division managed, however, to reduce its losses, from €510m to €147mn (the company as a whole lost €576mn), despite lower volumes and a decline in the company’s market sharer. These negative factors were offset by an improvement in the model mix sold – ie the average transaction price of PSA models sold has risen. The launch of the 2008 and continued good sales of the 3008, plus the DS line contributed most in this regard. One report in France suggested that nearly 75% of 2008 sales were of the top two specification versions, while for the C4 Picasso the ratio was even higher, at 80% In addition, the EC has given its approval for the French government’s backing of Banque PSA with €7bn of guarantees. Last time, the main corporate “news” concerned the rumours surrounding whether GM would take an increased stake in PSA, with the Peugeot family ceding control to GM. Despite this “story” apparently having “excellent sources”, this has been formally discounted by both sides, especially GM. It may well be that PSA would like to get close to GM but for now it would seem that GM does not want to pursue this idea, whether for financial or other reasons. More recently we have had reports that PSA has asked its banks to assess the implications of forming an alliance of some form with Chinese company Dongfeng. A sale to the Chinese should not be ruled out at some point in the future. It became apparent from press reports in October and November that PSA would have liked investment from the Chinese company, possibly through a share sale; there were even some reports that the Peugeot family would have even considered ceding control of the company to the Chinese. Things now appear to have ground to a halt in this regard – the Chinese are considering taking a 10% stake in PSA, possibly alongside a stake for the French government; the latter now seems unlikely while the Chinese company is now thought to have gone cool on the idea, preferring further industrial co-operations rather than direct investment. In the meantime, the possibility of the involvement of the Chinese has not gone down well with GM and the impression from GM is that it is now looking for ways to slim down its alliance activities, although it has made no official comment on this matter of late. Recent reports have now suggested that PSA could sell part or all of its stake in the PSA bank or and/or in Faurecia, its component subsidiary which has especially strong positions in the seating, interior and exhausts markets. Whole all this uncertainty prevails, PSA is continuing with its restructuring strategy “Rebound 2015”. A key part of this involves closing Aulnay, reorganisation at Rennes, cutting €550mn investment and cutting purchasing by €350mn: €600mn saving through restructuring, meaning total savings sought of €1.5bn. negotiations with the unions continue as PSA looks to find ways to reduce the costs of production in France – one study has suggested that total costs of production workers for PSA in France is €35/hour compared to €22/hour in Spain. The company has stated recently that it is not looking at further capacity cuts, ie it is not looking to close any more plants after Aulnay.

EUROPEAN CAR AND LCV PRODUCTION OUTLOOK REPORT November 2013| Page 57
PSA However, it is looking for ways to cut manufacturing costs and in this connection, in late October the company signed a new social contract with its unions; relevant highlights here include up to 3,000 older employees going on “senior leave” and the employment of more than 2,000 young people; and flexibility regarding wage moderation which will save as much as €125m,n., PSA has also asked suppliers to support a corporate target of cutting purchase costs by €600 per car by 2015, with €247 to be cut in 2013 alone – the 13 strategic and 65 “key” suppliers expected to bear the largest part of this cost cutting programme. The company is cutting its core platforms to just two, each to produce 1.8mn units by 2018: EMP2 for C and D segment models and EMP1 for B segment models, both of which will be used for models for both PSA and GM. However, cutting costs is only one route to improving the company’s finances – revenue also has to grow and in this regard, the company is going to be placing heavy reliance on the 308 and the widening range of DS models. The Citroen C-line is expected to play the role of a quasi-entry brand, a strategy which will potentially impact on the group’s margins. According to Peugeot CEO, Maxime Picat, Citroen will move upmarket with the DS line while Peugeot will improve its margins by selling more higher specification variants; he claims that 40% of 208 sales are of the top two trim line and for the 2008 the ratio is 70% Total global sales fell 1.1% in H1, to 1.46mn, with Europe down 13% year-on-year – by contrast, sales outside Europe were up by c23%, with the new emerging markets models, 301 and C4 Elysee, at the forefront of this growth
New Model News
No major news since the last report: key highlights reported last time include: 2008 Crossover successfully launched in H1, with production ramp up to c100,000 pa in Europe under way sooner than originally
planned. Subsequent major new models are 308 and C4 Picasso, the first major models based on the EMP2 platform. PSA claims that by 2014 as much as half its total output will be off the EMP2 platform and believes it can mimic the success of VW
with its highly modular MQB platform.
Manufacturing News
Earlier in 2013, there was positive news from the Mulhouse plant where the 2008 is produced. The early success of this model led to an increase in daily output from 310/day to 520/day at the start of September, a level which will rise to 615/day in October although we do not expect this to result in annual production of 125,000 as sales will slow later next year once the early enthusiasm for the model has waned. Nonetheless the success of 2008 is welcome for PSA and this has led to the creation of additional jobs and the temporary transfer of labour from Aulnay and Rennes to Mulhouse. However, in November the company admitted that production of other models was falling and the viability of maintaining two assembly lines there was under question, the Mulhouse plant makes the 2008 and the Citroen C4/DS4 – the factory is likely to make c320,000 units a year, but if it falls to 250,000 or close to this level then it is understood not to be viable to keep two assembly line going. Vigo (Spain) hopes to make up to 440,000 units, including kits, in 2013, although this appears optimistic to us at this time despite the success of the C4 Picasso and the new low cost models for emerging markets.

EUROPEAN CAR AND LCV PRODUCTION OUTLOOK REPORT November 2013| Page 58
PSA Production at Aulnay has now stopped – and following this (and in spite of the news above regarding Mulhouse), PSA claims it is still working towards a 100% utilisation rate at its French plants by 2016. As part of the alliance with GM, the replacement for the Citroen C3 Picasso will be made at GM’s Zaragosa plant on the same line as the next Opel Meriva. Meanwhile at the Douvrin engine plant (which it will soon own 100% when the JV with Renault ends), the company has invested over €890mn in the new EB engine, of which €438mn is in production equipment, with the balance in R&D work. Production of the new engine will begin in March 2014, with capacity of 320,000 upa.
Alliances PSA’s long alliance with Renault in component production will soon end: the Douvrin engine plant which is a 50:50 JV will become a PSA wholly-owned operation, while the STA transmissions operation will become a wholly owned Renault operation; PSA currently has a 20% stake. GM: ostensibly this alliance continues and the decision to make the new Citroen C3 Picasso at Opel Zaragosa is highly symbolic; however, whether the focus on the B segment car and C segment MPV models will continue is somewhat uncertain. GM is understood to be considering reducing its commitment to the alliance and the B segment car programme may not proceed – both companies would then develop their own new models. It now seems unlikely that; EMP1 and EMP2 will provide basis for future vehicles for both companies. Mitsubishi: joint venture in Russia continues to produce C/D segment crossover vehicles; this is now Mitsubishi’s sole European production presence. In addition, PSA sources the Peugeot iOn and Citroen C-Zero from Mitsubishi Japan where it is made as the MiEV. These alliances will continue despite the recent Renault-Mitsubishi tie-up in C and D segment cars Russia: in early March reports suggested PSA was in discussion with Russian company ZIL, best-known for the large vehicles which transported dignitaries in Soviet Russia. PSA also confirmed assembly in Kazakhstan with a local company, initially 4,000 upa, but expecting this to increase to at least 10,000 upa. Initial Kazakh assembly will focus on Peugeot 301, 3008, 508 and Partner van.
Production Outlook
PSA’s financial problems are evident in its production volumes; at Citroën, where 2012 European production fell below 900,000. We expect a further fall in 2013 to less than 830,000 at Citroen. Despite the new models, ie C4 Elysee and new C4 Picasso, we do not expect to see Citroën’s European production volumes climb back above 900,000 until 2017 while sales of the C3 and Citroën vans continue to fall. Peugeot has a better flow of new models than Citroen at the present time, especially with the recently launched 208/2008 and new 308. Accordingly, we see production at Peugeot remaining just below 1.2mn upa throughout the period covered in this Outlook, although in 2013-14, with the early success of the 2008/308, total production will be just over 1.2mn.

EUROPEAN CAR AND LCV PRODUCTION OUTLOOK REPORT November 2013| Page 59
PSA Citroen Production Outlook to 2018 Group Marque Model range Series (platform) Plant Country
Start of Prod'n
Next new model
2007 Production 2008 Production 2009
Production 2010 Production 2011 Production 2012 Production
Production Outlook 2013
Production Outlook 2014
Production Outlook 2015
Production Outlook 2016
Production Outlook 2017
Production Outlook 2018
PSA Citroën C1 B0 Kolin CZ Q2 05 2014 98,426 108,074 116,070 102,247 88,609 69,000 60,250 77,000 85,000 88,000 81,000 78,000PSA Citroën DS1 B0 Kolin CZ H2 13 2015/6 0 0 0 0 0 0 0 0 5,000 7,500 6,500 5,000PSA Citroën C2 A6 ‐ switch to A55 2Aulnay, Paris FR H2 03 2010 66,345 52,099 41,391 0 0 0 0 0 0 0 0 0PSA Citroën C2 A60 Aulnay, Paris FR H2 03 2009 7,726 5,943 2,684 0 0 0 0 0 0 0 0 0PSA Citroën C3 A81 ‐ switch to A51 Aulnay, Paris FR Q2 02 2008/9 214,110 174,175 0 0 0 0 0 0 0 0 0 0PSA Citroën C3 A81 Aulnay, Paris FR Q2 02 2008/9 12,649 15,361 7,265 0 0 0 0 0 0 0 0 0PSA Citroën C3 A51 Aulnay, Paris FR H1 09 2008/9 0 0 169,503 224,406 193,702 169,000 59,000 PLANT CLOSING 0 0 0 0
PSA Citroën C3 A51 Aulnay, Paris FR H1 10 2008/9 0 0 0 13,042 13,586 6,250 4,500 PLANT CLOSING 0 0 0 0
PSA Citroën C3 A51 Poissy, Paris FR H2 13 2015 0 0 0 0 0 0 65,000 126,500 103,000 10,000 0 0PSA Citroën New C3 New Poissy, Paris FR H2 15 2015 0 0 0 0 0 0 0 0 0 135,000 149,000 155,000PSA Citroën DS3 A55 Poissy, Paris FR H2 09 2016 0 0 1,486 68,391 77,169 66,250 70,500 67,500 62,000 55,000 74,500 80,000PSA Citroën C3 Pluriel A42 Villaverde, Madrid SP Q1 03 2009 9,456 6,900 19,890 11,791 5,500 0 0 0 0 0 0PSA Citroën C3 Picasso A70/71 Trnava SK H1 09 2016/7 0 2,500 91,500 75,000 72,000 57,500 49,500 44,000 42,000 21,000 0 0PSA Citroën C segment car for emerging mktsM4 Vigo SP H2 12 2012 0 0 0 0 0 7,000 45,000 48,000 43,000 41,000 39,000 37,000PSA Citroën C4 B50/B51 Mulhouse FR Q2 04 Q3 2010 178,345 136,482 99,460 89,623 24,620 0 0 0 0 0 0 0PSA Citroën C4 B50/B51 Mulhouse FR Q2 04 Q3 2010 6,314 5,019 3,131 1,930 5,329 4,500 4,000 3,750 3,500 4,000 5,000 4,000PSA Citroën C4/C4L B50/B51 Kaluga RU H2 10 2010 0 0 0 6,500 12,263 10,921 12,500 14,000 13,500 13,000 12,000 11,000PSA Citroën Other models in Russia Various Kaluga RU H1 14 2014 0 0 0 0 0 0 0 5,000 12,000 14,500 17,500 15,000PSA Citroën C4 B6 Mulhouse FR H1 11 2017 0 0 0 0 110,000 120,500 92,000 87,500 82,000 65,000 98,000 109,000PSA Citroën DS4 B75 Mulhouse FR H2 11 2018 0 0 0 233 34,593 31,000 29,500 26,250 24,000 22,500 19,000 25,000PSA Citroën E3 ‐ C4 Cactus New Villaverde, Madrid SP H2 14 2014 0 0 0 0 0 0 0 25,000 50,000 60,000 70,000 76,000PSA Citroën Xsara Picasso N68 Vigo SP 2008 8,230 10,807 35,925 24,072 8,325 0 0 0 0 0 0 0PSA Citroën Xsara Picasso N68 Rennes FR 12,143 47,846 5,942 0 0 0 0 0 0 0 0 0PSA Citroën C4 Picasso B58 Vigo SP H1 07 2013 215,714 191,818 133,814 126,808 114,000 80,500 45,000 0 0 0 0 0PSA Citroën C4 Picasso EMP2 Vigo SP H2 13 2013 0 0 0 0 0 0 61,000 151,000 148,500 143,000 139,000 129,000PSA Citroën DS5 B81 Sochaux FR H2 11 2018 0 0 0 0 4,424 30,000 21,500 18,000 16,000 14,000 12,000 22,000PSA Citroën C5 X7, EMP2 in 2017/8Rennes FR Pre 02 2013 49,909 98,602 79,987 79,106 65,726 40,000 26,500 24,500 20,000 14,500 25,000 35,000PSA Citroën C6 X61 Rennes FR Q3 05 7,343 1,667 982 1,114 1,029 1,400 250 0 0 0 0 0PSA Citroën C8 V3 Valenciennes FR Q1 02 2011FL 11,976 8,448 5,298 5,525 5,731 3,700 3,100 2,800 2,500 4,500 5,000 6,000PSA Citroën Jumpy U Valenciennes FR Q1 02 2007 37,198 41,035 19,957 27,910 29,625 22,000 20,000 17,500 16,000 21,000 22,000 21,500PSA Citroën Jumper Val di Sangro IT Pre 2002 2013FL 56,688 58,215 23,916 37,038 44,267 34,500 32,500 31,500 29,500 24,500 26,000 27,500PSA Citroën Berlingo M59 Vigo SP H2 96 133,359 0 0 0 0 0 0 0 0 0 0 0PSA Citroën Berlingo B9 Vigo SP H2 08 2016 0 128,933 116,223 132,856 133,000 102,500 97,000 89,000 81,000 88,000 99,000 105,000PSA Citroën Berlingo M59 Mangualde PT H2 96 48,924 31,717 20,919 24,214 0 0 0 0 0 0 0 0PSA Citroën Berlingo B9 Mangualde PT H2 09 0 0 0 0 25,681 23,574 29,000 27,500 24,500 22,000 20,250 19,750PSA Citroën Total 1,174,855 1,125,641 995,343 1,051,806 1,069,179 880,095 827,600 886,300 863,000 868,000 919,750 960,750PSA Peugeot Total 1,502,828 1,352,227 1,242,968 1,325,329 1,310,011 1,137,866 1,202,000 1,227,750 1,182,150 1,142,000 1,177,250 1,157,000PSA ALL Total 2,677,683 2,477,868 2,238,311 2,377,135 2,379,190 2,017,961 2,029,600 2,114,050 2,045,150 2,010,000 2,097,000 2,117,750

EUROPEAN CAR AND LCV PRODUCTION OUTLOOK REPORT November 2013| Page 60
PSA Peugeot Production Outlook to 2018
Group Marque Model range Series (platform) Plant CountryStart of Prod'n
End of Prod'n
Next new model 2007 Production 2008 Production
2009 Production 2010 Production 2011 Production 2012 Production
Production Outlook 2013
Production Outlook 2014
Production Outlook 2015
Production Outlook 2016
Production Outlook 2017
Production Outlook 2018
PSA Citroën Total 1,174,855 1,125,641 995,343 1,051,806 1,069,179 880,095 827,600 886,300 863,000 868,000 919,750 960,750PSA Peugeot 107 B0 Kolin CZ Q2 05 2014 104,427 108,187 116,070 110,554 91,308 77,000 59,000 77,000 92,000 93,000 91,750 88,000PSA Peugeot 1007 A08 Poissy FR Q4 04 H2 11 11,391 10,396 4,788 15 0 0 0 0 0 0 0 0PSA Peugeot 206 T10/T11 Poissy FR Pre 99 Q3 06 2006 8,355 4,933 4,061 6,533 4,963 2,500 0 0 0 0 0 0PSA Peugeot 206 incl 206CC T10/T11 Mulhouse FR Q3 06 2006 103,213 75,062 129,027 127,080 92,939 8,500 0 0 0 0 0 0PSA Peugeot 207 A70/71 Poissy/Aulnay FR Q4 06 2012 213,041 187,794 166,103 128,322 88,725 27,000 0 0 0 0 0 0PSA Peugeot 207 A70/71 Poissy/Aulnay FR Q4 06 2012 9,991 189 0 0 0 0 0 0 0 0 0 0PSA Peugeot 207 A70/71 Trnava SK H1 06 2012 178,000 183,000 194,000 129,000 105,000 57,500 0 0 0 0 0 0PSA Peugeot 207 incl 207CC A70/71 Villaverde, Madrid SP H1 07 127,071 107,824 107,878 107,522 98,000 77,000 65,000 10,000 0 0 0 0PSA Peugeot 208 Poissy FR H1 12 0 0 0 0 585 131,000 147,000 137,000 135,000 119,000 112,000 99,500PSA Peugeot 208 Trnava SK H1 12 0 0 0 0 0 96,500 181,000 209,000 199,000 193,000 187,500 179,000PSA Peugeot 208 Mulhouse FR H1 12 0 0 0 0 0 40,000 31,000 24,000 15,000 0 0 0PSA Peugeot 208CC Mulhouse FR H1 14 0 0 0 0 0 0 0 15,000 20,000 17,500 14,500 12,500PSA Peugeot 2008 Mulhouse FR H2 13 0 0 0 0 0 0 94,000 103,000 105,000 99,000 94,500 92,500PSA Peugeot 301 M3 Vigo SP H2 12 2012 0 0 0 0 0 11,250 77,000 79,000 73,500 71,000 66,500 62,000PSA Peugeot 307 T50/T51 Mulhouse/ Sochaux FR Q1 02 Q4 08 2008+ 4,615 0 0 0 0 0 0 0 0 0 0 0PSA Peugeot 307 CC T56 Mulhouse/ Sochaux FR H2 03 H2 09 2009+ 18,167 2,500 32 0 0 0 0 0 0 0 0 0PSA Peugeot 307 T50/T51 Sochaux FR H1 01 H2 08 2008 161,672 0 0 0 0 0 0 0 0 0 0 0PSA Peugeot 307 SW T52 Sochaux FR H2 02 H2 09 2009+ 67,853 33,903 0 0 0 0 0 0 0 0 0 0PSA Peugeot 308, incl SW and incl. CC from 20T7 Sochaux/ Mulhouse FR 2007+ 2013 106,054 299,322 209,341 222,946 198,405 145,000 35,000 25,000 10,000 0 0 0PSA Peugeot 3008 T8 Sochaux FR H2 09 2009 0 406 64,671 132,543 139,827 101,000 86,000 80,000 71,500 92,000 95,000 98,000PSA Peugeot 308 T7 Sochaux FR 2008+ 2 3,478 3,337 3,088 3,885 7,500 5,000 4,000 3,500 0 0 0PSA Peugeot 308 CC T7 Sochaux FR 2009+ 0 1,331 21,000 0 0 0 0 0 0 0 0 0PSA Peugeot 308 RCZ T7 ‐ add cabrio in 20Graz (Magna) AU H1 10 2015 0 0 92 19,135 19,725 9,750 8,500 7,500 6,250 13,500 17,000 16,250PSA Peugeot New 308, inc. SW and CC EMP2 Sochaux FR H2 13 2013 0 0 0 0 0 0 99,000 155,000 165,000 154,000 147,000 139,000PSA Peugeot 308 B50/B51 Kaluga RU H2 10 2010 0 0 0 15,500 19,000 9,000 0 0 0 0 0 0PSA Peugeot 408 T7 Kaluga RU H2 12 0 0 0 0 0 9,000 13,000 15,000 14,000 13,750 13,000 12,000PSA Peugeot Other models in Russia Various Kaluga RU H1 14 2014 0 0 0 0 0 0 0 5,000 15,000 17,500 20,000 17,500PSA Peugeot 5008 MPV T7, EMP2 2016/7 Sochaux FR H2 09 2016 0 0 21,923 69,345 74,469 45,000 44,250 42,000 38,500 60,000 69,000 64,000PSA Peugeot 407 incl coupe D22/D23 Rennes FR Q3 04 2010 127,930 81,756 33,247 28,898 734 0 0 0 0 0 0 0PSA Peugeot 508 incl coupe W2 Rennes FR H1 11 2011 0 0 0 6,385 131,750 92,250 62,000 59,000 48,000 30,000 1,000 0PSA Peugeot New 508 EMP2 Rennes FR 2016‐7 2016‐7 0 0 0 0 0 0 0 0 0 2,500 59,000 73,500PSA Peugeot 607 Z83 Sochaux FR Q2 07 2007 5,983 4,565 909 956 0 0 0 0 0 0 0 0PSA Peugeot 807 V2 Valenciennes (Sevel Nord) FR Q1 02 2011FL 20,223 13,384 6,185 5,724 6,376 4,250 3,250 3,000 2,750 5,000 5,500 5,000PSA Peugeot Expert U Valenciennes (Sevel Nord) FR Q1 02 2007 42,049 44,075 18,950 28,893 33,260 26,250 22,500 19,000 16,500 12,750 25,000 29,000PSA Toyota Pro‐Ace U Valenciennes (Sevel Nord) FR Q2 13 0 0 0 0 0 0 3,500 7,500 10,000 7,000 14,500 19,500PSA Peugeot Boxer Val di Sangro (Sevel Sud) IT Pre 2002 H2 06 2013FL 51,822 52,393 23,194 46,716 54,451 45,000 43,000 41,000 39,000 36,500 34,500 31,500PSA Peugeot Partner M59 Vigo SP H2 96 H1 08 H2 08 115,779 0 0 0 0 0 0 0 0 0 0 0PSA Peugeot Partner B9 Vigo SP H2 08 2016 0 108,086 93,614 112,991 122,000 95,250 93,000 84,000 79,000 83,000 90,000 100,000PSA Peugeot Partner M59 Mangualde PT H2 96 25,190 29,643 24,546 23,183 0 0 0 0 0 0 0 0PSA Peugeot Partner B9 Mangualde PT H2 09 0 0 0 0 24,609 20,366 30,000 26,750 23,650 22,000 20,000 18,250PSA Peugeot Total 1,502,828 1,352,227 1,242,968 1,325,329 1,310,011 1,137,866 1,202,000 1,227,750 1,182,150 1,142,000 1,177,250 1,157,000PSA ALL Total 2,677,683 2,477,868 2,238,311 2,377,135 2,379,190 2,017,961 2,029,600 2,114,050 2,045,150 2,010,000 2,097,000 2,117,750

EUROPEAN CAR AND LCV PRODUCTION OUTLOOK REPORT November 2013| Page 61
Renault-Nissan-Dacia Corporate Developments
Renault’s H1/2013 results were not especially good – revenue was down nearly 1% at €20.4bn, and while the company achieved an operating margin of 2.9% (€583mn), its operating result was a loss of €249mn, compared to a profit of €545mn in H1/2012; net income for H1 was just €97mn, compared to a profit of €774mn in H1/2012. The company chose to highlight the positive operating margin achieved and Carlos Ghosn claimed that the company was on target to meet its objectives. The contribution of Nissan to Renault’s results should not be understated – Nissan contributed €766mn to the operating income line, without which net income would have been in the region of €660mn. The company also reported a provision of €512mn to cover potential losses in Iran. Early in 2013, Renault claimed it would see sales growth and positive earnings for 2013, although it added the rider that this was subject to cost reduction targets being met. The company is looking for €600mn savings in 2013, building on €580mn savings in 2012: Most early 2013 Renault news concerned negotiations re: cost and labour reductions to establish a viable long-term plan. New
strategy, involving 7,500 jobs being cut by 2016, agreed in early March. Fixed costs to be cut, reducing production cost per French-made vehicle by €300, total annual savings of €159mn based on 2012’s
production of 530,000 units. In exchange, Renault commits to increasing French production by 180,000 to 710,000 units in 2016; 100,000 Renaults and 80,000 for
Nissan (Micra), plus compact vans for Mercedes. In addition to continuing to look to cut costs in France, the group is proceeding with its takeover of AvtoVAZ. It currently owns 25% f the Russian company and this will rise to 50.1% held by Renault in June 2014, alongside a 17.03% stake to be held by Nissan. This 67.13% stake will actually be in a JV with Russian Technologies, an investment company – which in turn will translate into a 74.5% stake in AvtoVAZ, which will give Renault full control. Just before the Frankfurt motor show, its senior management structure was disrupted when COO, Carlos Tavares, resigned after stating publicly that he wanted to run an American company; Carlos Ghosn evidently decided not to stand in his way. In terms of sales volumes, the ten months to October have some positive signs: Group sales were up 9.5% Renault brand sales were nearly 5% Renault’s LCV share was up nearly 5% to nearly 36% Dacia sales of cars and LCVs rose 13.6% in October, largely on the back of the new Sandero
New Model News
Renault: key highlights are: Zoe EV now in full production; Captur launched to great success and press acclaim at Geneva motor show; a Samsung version of the Captur is now thought likely, for production in Spain and export to Korea; Renault has for now pulled out of plans to make a luxury car based on Mercedes platform. Instead, Renault will try to enter the near luxury segment with models of its own under

EUROPEAN CAR AND LCV PRODUCTION OUTLOOK REPORT November 2013| Page 62
Renault-Nissan-Dacia the Initiale name (possibly replacing the Laguna/Espace). New Twingo will come only in 5-dr format; 3-dr format seen as making the vehicle too small. Nissan: model previously referred to as Invitation shown at Geneva as Note; production has now started and will move to 24-hour production in early 2014. Dacia: Moroccan-made Lodgy and Dokker now on sale in Europe, with strong production ramp up now in place; Sandero range now added to line-up in Morocco.
Manufacturing News
The main developments this year concern Nissan Sunderland which has seen the following in 2013: The start of production of the Note at Nissan Sunderland. Preparing for 24-hour production from early 2014, with the addition of 400 jobs and a third shift, mainly to produce the Note Line 1 at Sunderland had been worked 24/7 since 2010 making the Qashqai and Leaf; Line 2 will move to 24-hour working next year,
making the Juke and Note. 24-hour production will also occur in supporting functions, ie engine assembly, castings, axle and battery production. The Sunderland factory has also started preparing for production of the Infiniti Q30 and press reports have suggested forcibly – citing senior Infiniti executives – that a second Infiniti model, the QX30 crossover version – will also be made in Sunderland: This has not been confirmed but we have heard similar comments in discussions with suppliers – it may be a couple of years before
this is officially announced. The QX30 would give Infiniti a competitor to the Mercedes GLA and BMW X1. Investment for the Infiniti models will be at least UK£250mn, and a further 1,000 jobs will be created. At Renault there has been little news other than the ending of its component production alliance with PSA: the Douvrin engine plant (which is currently a 50:50 JV) will revert to 100% PSA ownership, while the STA transmissions operation will become a wholly owned Renault operation; PSA currently has a 20% stake. Early relevant news regarding Renault’s manufacturing operations include: Union agreement confirming Renault’s long term commitment to production in France: Kangoo at Maubeuge, c140,000 upa, possibly higher if Mercedes Citan is a success. Clio IV at Flins, up to c110,000 upa, mostly high specification versions; plus 50-60,000 Zoe. Flins will also make up to 82,000 Nissan
Micras a year from 2016. Scenic, Espace and Laguna at Douai, c220,000 upa by 2016, possibly rising to 240,000. Vans at Sandouville, c80,000 upa, up to 100,000 upa, incl Nissans; commitment to make Master large van at Batilly for 12 years. December 2012 commitment to Spanish factories remains in place; to include 1,200 new jobs. Full details still awaited. In May 2013, investment plans for Douai were confirmed €420mn to be invested to bring new Scenic, Laguna and Espace into production there; new technologies to be introduced, including hot stamping, the first time Renault will have this technology in-house, aluminium

EUROPEAN CAR AND LCV PRODUCTION OUTLOOK REPORT November 2013| Page 63
Renault-Nissan-Dacia stamping (also a first for Douai) and expansion of plastic parts production – much of which will be for export to other Renault plants. Claims it will make as many as 340,000 units in Turkey this year, which seems optimistic Dacia: Romanian factory is close to capacity; Moroccan factory now in full production mode but probably still 18 months or so away from full production despite fast ramp up. The second production line in the Moroccan plant was inaugurated in October, raising capacity to 340,000 upa, following an investment of €400mn. The second line produces the Dacia Sandero and Sandero Stepway models; line 1 produces the Lodgy and Dokker (the latter in passenger and van formats. Increased production in Morocco is highly likely and this could be increased further if labour disputes at Dacia Romania continue. RHD demand for Dacia Duster fulfilled by group plant in India. A small City car may also be added from 2015 and a Nissan badged version of the Dokker is also possible. We also now include production at Renault’s second plant in Morocco, SOMACA, in our Production Outlook because the majority of production from this plant is now going to be exported to Europe.
Alliances The key alliance remains between Nissan and Renault; this has been reinforced by decision to make Nissan Micra at Renault plant in France, the first time the partners have made cars for each other in Europe. The alliance between Daimler and Renault-Nissan is expanding – Renault is making Citan small vans for Mercedes in France and Mercedes engines will be supplied to Nissan in North America in the near future. Cross supply of engines will increase, as will the supply of transmissions from Renault to Mercedes for the V-class/Vito van and from Mercedes to Infiniti for various models. As noted earlier, Daimler/Mercedes technology will also underpin the new Infiniti Q30 to be made in the UK and eschewer. In addition, the new Twingo will be produced off a jointly developed platform, developed with Daimler for use also on smart models. In addition, Renault-Nissan and Mitsubishi have announced their won alliance, for small kei cars in Japan, D segment cars to be made at Samsung in Korea and a C-segment, the production location of which remains to be seen. If these models use the CMF platform which Renault-Nissan have recently developed this would an excellent example of cross-company platform sharing, something which is likely to become an increasingly common trend in the industry in the years ahead.
Production Outlook
Renault production will fall to just over 1.23mn in 2013, but steady growth back up to >1.5n is expected from 2015 due to new Clio, Megane/Scenic and wider range of LCVs to be made in France, plus additional boost from Nissan Micra. We remain doubtful that Renault in France will reach the 710,000 pa target set for 2016, although it should get close to this level a couple of years later. Nissan’s production continues to exceed records in the UK, but slowdown in Spain means Nissan will only marginal overall growth in 2013. Subsequent growth to 900,000 and close to 1mn upa due to expansion in Russia and Spain, plus additional models to be made in UK is expected. Dacia production is also growing strongly, in Russia and Morocco but Romanian output will be broadly stable. AvtoVAZ volumes of Renault/Dacia based models currently shown at c350-400,000 upa in the later years of the Outlook, but once old Ladas are fully phased out, Renault/Dacia-based models could exceed 1mn upa in Russia by 2020 and beyond.

EUROPEAN CAR AND LCV PRODUCTION OUTLOOK REPORT November 2013| Page 64
Renault and other group brands, Production Outlook to 2018
Group Marque Model range Series (platform) Plant CountryStart of Prod'n
End of Prod'n
Next new model 2007 Production 2008 Production
2009 Production 2010 Production 2011 Production 2012 Production
Production Outlook 2013
Production Outlook 2014
Production Outlook 2015
Production Outlook 2016
Production Outlook 2017
Production Outlook 2018
Renault‐Nissan Renault Twingo X06 Flins FR H1 07 2005 28,466 2 0 0 0 0 0 0 0 0 0 0Renault‐Nissan Renault Twingo X06 Flins FR H1 07 2005 386 0 0 0 0 0 0 0 0 0 0 0Renault‐Nissan Renault Twingo 2 /Twingo Campus X44 Novo Mesto (Revoz) SL Q1 07 2012 82,763 134,398 187,444 163,052 146,782 97,000 85,000 5,000 0 0 0 0Renault‐Nissan Renault Wind X33 Novo Mesto (Revoz) SL Q1 11 2010 0 0 0 20,000 12,000 1,000 250 100 0 0 0 0Renault‐Nissan Renault Twingo 3 inc Renault 5 replacemeX07 Daimler JV Novo Mesto (Revoz) SL H1 12 0 0 0 0 0 0 5,000 111,000 130,000 124,000 119,000 108,000Renault‐Nissan Smart New Four Seater W453 Novo Mesto (Revoz) SL H1 14 0 0 0 0 0 0 0 35,000 65,000 68,500 66,000 63,500Renault‐Nissan Renault Zoe EV X10 Flins FR H1 12 0 0 0 0 0 500 11,500 25,000 34,000 36,000 38,000 40,000Renault‐Nissan Renault Clio Campus X65 Flins FR Q3 09 0 0 13,000 5,000 0 0 0 0 0 0 0 0Renault‐Nissan Renault Clio X85, X98 from 2012 Flins FR Q4 05 207,917 160,056 126,228 140,732 136,382 115,000 135,000 109,000 85,000 71,000 55,000 49,000Renault‐Nissan Renault Clio X85 Flins FR Q4 05 2013 ‐ X98 3,277 3,620 5,208 7,693 14,461 10,000 7,500 5,500 5,000 3,500 2,500 2,000Renault‐Nissan Renault Clio X85 Valladolid SP Q4 05 36,951 20,560 25,450 30,000 40,000 41,000 6,000 0 0 0 0 0Renault‐Nissan Renault Clio X65 Novo Mesto (Revoz) SL Q4 06 2005 117,394 63,696 25,236 29,441 15,000 12,500 7,750 0 0 0 0 0Renault‐Nissan Renault Clio (Old Symbol) X65 Bursa TU 2006 75,448 48,887 0 0 0 0 0 0 0 0 0 0Renault‐Nissan Renault Symbol L35 Bursa TU H2 08 0 29,870 64,117 74,513 79,052 43,000 7,000 0 0 0 0 0Renault‐Nissan Renault Clio X85, X98 from 2012 Bursa TU 2013 ‐ X98 102,929 151,425 179,495 145,119 127,500 160,000 245,000 249,000 239,000 225,000 216,000 209,000Renault‐Nissan Renault Modus J77 Valladolid SP Q2 04 2,357 0 0 0 0 0 0 0 0 0 0 0Renault‐Nissan Renault Modus J77 Valladolid SP Q2 04 65,157 72,590 69,359 47,251 29,000 30,000 0 0 0 0 0 0Renault‐Nissan Samsung Captur for Samsung J87 Valladolid SP Q4 13 or Q1 14 0 0 0 0 0 0 5,000 10,000 15,000 12,000 10,000 7,000Renault‐Nissan Renault Captur J87 Valladolid SP H1 13 0 0 0 0 0 0 120,000 130,000 125,000 118,000 108,000 105,000Renault‐Nissan Renault Kangoo X76, X81 from 2016Maubeuge FR H2 97 2007‐2008 2011 (EV), 2015 190,252 178,602 113,488 139,243 146,677 119,000 99,000 86,000 92,000 106,000 115,000 112,250Renault‐Nissan Mercedes‐Benz Citan Kangoo Maubeuge FR H1 12 0 0 0 0 0 13,500 29,500 33,500 34,000 32,500 30,000 28,000Renault‐Nissan Renault Mégane X84 Douai FR Q1 03 2009+ 19,019 8,000 0 0 0 0 0 0 0 0 0 0Renault‐Nissan Renault Mégane CC X84 Douai FR Q2 03 2009+ 14,000 2,750 0 0 0 0 0 0 0 0Renault‐Nissan Renault Mégane CC X95 Douai FR Q2 09 27,907 0 0 10,000 11,000 7,500 3,250 3,000 2,500 6,000 9,500 9,000Renault‐Nissan Renault Mégane X84 Palencia SP 2009+ 168,620 157,513 58,500 0 0 0 0 0 0 0 0 0Renault‐Nissan Renault Mégane X84 Palencia SP Q2 09 2015 8,078 7,300 6,500 6,340 7,500 4,539 4,000 3,500 2,500 2,000 2,000 1,000Renault‐Nissan Renault Mégane X95 Palencia SP Q1 04 2015 0 0 190,280 255,736 245,000 210,000 142,000 129,000 160,000 221,000 209,000 191,000Renault‐Nissan Renault Megane sedan X84 Bursa TU Q1 04 2009+ 85,279 65,369 23,657 21,834 14,000 0 0 0 0 0 0 0Renault‐Nissan Renault Fluence incl. EV X95/L38 & B32/38 Bursa TU Q2 09 0 0 10,312 65,617 103,994 108,000 84,500 76,000 72,500 68,750 60,000 55,500Renault‐Nissan Renault Megane/Fluence X95 Moscow (AvtoFramos) RU H1 2011 0 0 0 0 3,085 5,000 7,750 20,000 45,000 65,000 69,000 66,000Renault‐Nissan Renault Scenic J95 Douai FR Q2 09 267,970 170,912 30,000 0 0 0 0 0 0 0 0 0Renault‐Nissan Renault Scenic R95 Douai FR H2 00 Q1 07 2015 0 0 130,000 184,191 166,000 133,500 107,500 95,000 91,000 129,000 145,000 130,000Renault‐Nissan Renault Laguna X74 Sandouville FR Q1 07 2014‐15 40,000 0 0 0 0 0 0 0 0 0 0Renault‐Nissan Renault Laguna X91 Sandouville FR Q1 02 Q1 10 2008 59,514 81,572 46,907 52,267 50,232 28,000 18,000 15,500 11,000 0 0 0Renault‐Nissan Renault Vel Satis Sandouville FR H2 02 H2 09 2011+ 2,812 1,693 1,180 0 0 0 0 0 0 0 0 0Renault‐Nissan Renault Espace J81 Sandouville FR 40,675 21,668 15,214 16,876 14,674 13,250 7,500 5,000 3,750 0 0 0Renault‐Nissan Renault New Laguna/Espace New CD Douai FR H1 15 0 0 0 0 0 0 0 0 39,000 70,000 75,000 69,000Renault‐Nissan Renault Trafic X82 Sandouville FR H2 14 0 0 0 0 0 0 0 45,000 95,000 100,000 94,500 91,000Renault‐Nissan Renault Master (incl Opel and Nissan versX62 Batilly FR H2 10 112,140 90,580 53,674 75,787 0 0 0 0 0 0 0 0Renault‐Nissan Renault New Master Batilly FR 0 0 0 5,000 106,491 110,000 97,000 86,500 78,000 69,500 85,000 91,000Renault‐Nissan Nissan Micra Flins FR H1 16 0 0 0 0 0 0 0 0 0 25,000 85,000 89,000Renault‐Nissan Renault Total 1,745,311 1,482,313 1,377,999 1,495,692 1,468,830 1,262,289 1,235,000 1,277,600 1,424,250 1,552,750 1,593,500 1,516,250Renault‐Nissan Nissan Total 546,415 522,298 386,205 529,377 663,985 667,622 684,500 768,000 941,500 973,000 987,250 966,250Renault‐Nissan Dacia Total 361,402 357,029 345,663 428,147 469,924 588,251 735,750 848,500 917,500 926,500 919,750 913,500Renault‐Nissan AvtoVAZ Total 0 0 0 0 0 16,764 83,500 155,000 265,000 415,000 475,000 488,000Renault‐Nissan ALL Total 2,653,128 2,361,640 2,109,867 2,453,216 2,602,739 2,534,926 2,738,750 3,049,100 3,548,250 3,867,250 3,975,500 3,884,000

EUROPEAN CAR AND LCV PRODUCTION OUTLOOK REPORT November 2013| Page 65
Nissan and other group brand totals, Production Outlook to 2018
Group Marque Model range Series (platform) Plant CountryStart of Prod'n
Next new model
2007 Production 2008 Production 2009
Production 2010 Production 2011 Production 2012 Production
Production Outlook 2013
Production Outlook 2014
Production Outlook 2015
Production Outlook 2016
Production Outlook 2017
Production Outlook 2018
Renault‐Nissan Renault Total 1,745,311 1,482,313 1,377,999 1,495,692 1,468,830 1,262,289 1,235,000 1,277,600 1,424,250 1,552,750 1,593,500 1,516,250Renault‐Nissan Nissan Micra K123 Sunderland UK Q1 03 2010 82,917 80,746 88,429 54,580 0 0 0 0 0 0 0 0Renault‐Nissan Nissan Micra CC K127 Sunderland UK Q3 05 5,576 3,001 175 0 0 0 0 0 0 0 0 0Renault‐Nissan Nissan Leaf (electric) X12G Sunderland UK H1 12 0 0 0 0 0 92 9,000 13,000 17,000 22,500 20,000 18,000Renault‐Nissan Nissan Juke P12C Sunderland UK Q1 10 2017 0 0 0 44,622 132,606 154,759 153,500 150,000 133,000 125,000 150,000 156,000Renault‐Nissan Nissan Note E111 Sunderland UK Q1 06 2012 92,678 77,819 50,880 52,872 46,602 44,884 24,000 0 0 0 0 0Renault‐Nissan Nissan New Note (Invitation) J02C Sunderland UK Q3 13 0 0 0 0 0 0 34,000 90,000 105,000 98,000 91,000 88,000
Renault‐Nissan Nissan New C segment car (Almera?) New Barcelona SP Q3 14 2014 0 0 0 0 0 0 0 25,000 70,000 82,000 76,500 70,500
Renault‐Nissan Nissan Qashqai P32L Sunderland UK Q4 06 2014 164,191 224,989 198,841 271,188 301,277 310,387 285,500 0 0 0 0 0
Renault‐Nissan Nissan Qashqai W32S Sunderland UK H2 13 0 0 0 0 0 0 6,500 300,000 310,000 305,000 298,000 291,000
Renault‐Nissan Nissan Primera MS/ X31B Sunderland UK Pre 02 8,316 0 0 0 0 0 0 0 0 0 0 0
Renault‐Nissan Nissan Teana FFL St Petersburg RU H2 09 2009 0 0 790 4,000 12,500 6,500 7,250 14,000 18,000 16,500 15,000 13,000Renault‐Nissan Nissan X‐Trail W32E St Petersburg RU H2 09 2014 0 0 3,000 11,000 21,000 11,500 18,000 31,000 33,000 29,000 26,000 24,000Renault‐Nissan Nissan Almera New Togliatti RU H2 13 2013 0 0 0 0 0 0 18,000 52,000 65,000 73,000 69,000 68,000Renault‐Nissan Nissan Qashqai ‐ inc. probable Renault vP32E St Petersburg RU H2 13 2013 0 0 0 0 0 0 0 10,000 40,000 50,000 55,000 54,750Renault‐Nissan Nissan Murano Murano St Petersburg RU H2 11 2014 0 0 0 0 5,500 7,000 5,750 5,250 4,500 6,000 7,250 7,500Renault‐Nissan Nissan Tiida New St Petersburg RU H2 13 0 0 0 0 0 0 0 7,750 24,000 30,000 28,000 26,000Renault‐Nissan Nissan Infiniti QX30 Mercedes A Sunderland UK 2017 0 0 0 0 0 0 0 0 0 0 10,000 25,000Renault‐Nissan Nissan Infiniti Q30 Mercedes A Sunderland UK H1 15 0 0 0 0 0 0 0 0 35,000 50,000 55,000 48,000Renault‐Nissan Nissan Primastar (and Renault Trafic, OpX83 Barcelona SP 2006 FL 86,435 69,445 24,556 41,263 69,000 51,500 45,000 0 0 0 0 0Renault‐Nissan Nissan NV200 X11M Barcelona SP 2009 0 0 420 12,753 27,000 25,500 39,000 38,000 35,000 31,000 29,000 27,500Renault‐Nissan Nissan Navarra QZ/H61 Barcelona SP 79,147 47,194 15,102 25,925 32,000 39,250 25,000 21,000 30,000 35,000 32,500 29,000Renault‐Nissan Nissan Pathfinder QZ/P61 Barcelona SP Q2 05 27,155 19,104 4,012 11,174 16,500 16,250 14,000 11,000 7,000 0 0 0Renault‐Nissan Nissan New models, details to be confirmUnknown Barcelona SP 2011‐12 0 0 0 0 0 0 0 0 15,000 20,000 25,000 20,000Renault‐Nissan Nissan Total 546,415 522,298 386,205 529,377 663,985 667,622 684,500 768,000 941,500 973,000 987,250 966,250Renault‐Nissan Dacia Total 361,402 357,029 345,663 428,147 469,924 588,251 735,750 848,500 917,500 926,500 919,750 913,500Renault‐Nissan AvtoVAZ Total 0 0 0 0 0 16,764 83,500 155,000 265,000 415,000 475,000 488,000Renault‐Nissan ALL Total 2,653,128 2,361,640 2,109,867 2,453,216 2,602,739 2,534,926 2,738,750 3,049,100 3,548,250 3,867,250 3,975,500 3,884,000
Dacia, AvtoVAZ and Renault/Nissan totals, Production Outlook to 2018
Group Marque Model range Series (platform) Plant CountryStart of Prod'n
Next new model
2007 Production 2008 Production 2009
Production 2010 Production 2011 Production
Production Outlook 2012
2012 ProductionProduction Outlook 2014
Production Outlook 2015
Production Outlook 2016
Production Outlook 2017
Production Outlook 2018
Renault‐Nissan Renault Total 1,745,311 1,482,313 1,377,999 1,495,692 1,468,830 1,262,289 1,235,000 1,277,600 1,424,250 1,552,750 1,593,500 1,516,250Renault‐Nissan Nissan Total 546,415 522,298 386,205 529,377 663,985 667,622 684,500 768,000 941,500 973,000 987,250 966,250Renault‐Nissan Dacia Logan Clio Pitesti RO H2 04 2012 185,246 88,347 50,548 50,952 41,796 56,171 0 0 0 0 0Renault‐Nissan Dacia New Logan Clio Pitesti RO Q4 12 0 0 0 0 0 2,851 85,000 98,000 89,000 84,500 79,500 74,250Renault‐Nissan Dacia Logan MCV Clio Pitesti RO H1 07 2012+ 99,515 104,189 80,247 44,514 39,187 34,922 16,750 50,000 63,000 65,000 61,000 59,250Renault‐Nissan Dacia Logan PU Clio Pitesti RO 2012+ 0 9,847 7,721 7,276 6,201 3,642 0 0 0 0 0 0Renault‐Nissan Dacia Logan Van Clio Pitesti RO 2012+ 7,400 7,100 8,969 10,436 11,176 7,545 0 0 0 0 0 0Renault‐Nissan Dacia Duster Clio Pitesti RO H1 2010 0 0 0 86,239 168,673 133,010 119,000 111,000 104,500 94,000 91,000 127,500Renault‐Nissan Dacia New Sandero Clio Pitesti RO Q4 12 0 0 0 0 0 18,234 145,000 137,500 131,000 125,000 119,000 105,000Renault‐Nissan Dacia Sandero Clio Pitesti RO 2012 0 74,828 148,527 141,882 60,587 50,777 0 0 0 0 0Renault‐Nissan Dacia Logan/Sandero/ Duster ‐ progressClio Moscow (AvtoFramos) RU 2006/ 2007 2012+ 69,241 72,718 49,651 86,848 142,304 168,099 170,000 177,000 180,000 175,000 167,750 162,000Renault‐Nissan Dacia Sandero/Logan Clio Somaca, Casablanca MO H1 2013 2013 0 0 0 0 0 58,000 65,000 70,000 75,000 73,000 71,500 70,500Renault‐Nissan Dacia Lodgy/Dokker and others from 20Clio Tangiers MO H1 2012 2012+ 0 0 0 0 0 55,000 135,000 205,000 275,000 310,000 330,000 315,000Renault‐Nissan Dacia Total 361,402 357,029 345,663 428,147 469,924 588,251 735,750 848,500 917,500 926,500 919,750 913,500
Renault‐Nissan Lada/Dacia/ Renault/Nissan
Various models on Logan platformClio Togliatti RU Q1 2012 0 0 0 0 0 16,764 83,500 125,000 175,000 310,000 375,000 390,000
Renault‐Nissan Nissan Datsun New Togliatti RU H2 2014 0 0 0 0 0 0 0 30,000 90,000 105,000 100,000 98,000Renault‐Nissan AvtoVAZ Total 0 0 0 0 0 16,764 83,500 155,000 265,000 415,000 475,000 488,000Renault‐Nissan ALL Total 2,653,128 2,361,640 2,109,867 2,453,216 2,602,739 2,534,926 2,738,750 3,049,100 3,548,250 3,867,250 3,975,500 3,884,000

EUROPEAN CAR AND LCV PRODUCTION OUTLOOK REPORT November 2013| Page 66
Suzuki Corporate Developments
Suzuki will launch a new model in Europe every year for the next three years to raise annual European sales to 300,000 by 2016; this sales target will continue to include significant imports – not all of Suzuki’s European sales will be produced in Hungary. The replacement for the Splash for example will come from Thailand. There is still no news on the break-up of its alliance with VW; the company has specifically denied that talks have resumed in an effort to break the impasse between the two companies.
New Model News Key new model is SX4 S-cross which is larger than the current models made in Hungary; essentially a C-segment vehicle, production in Hungary has focused on B-segment vehicles until now; production of the B-segment vehicles is widely expected to continue, but probably at lower volumes. The new S-cross – which replaces the smaller original SX4 - will operate in the Qashqai market. Although Suzuki will soon stop supplying Fiat with the Sedici, it will source diesel engines from Fiat for the new SX4/S-Cross; this new model will also form the basis of a smaller version to replace the Swift and which will compete in the emerging Captur/2008 segment,
Manufacturing Production target of up 100,000 for the new SX4 S-Cross confirmed, including for exports beyond Europe, ie: Asia, Middle East, South America and Oceania. S-Cross production started in September 2013.
Alliances Fiat production alliance soon to end, but engine sourcing will continue. Production Outlook
Some clarification re the S-cross has been provided but details on the 4x4 version of the Swift and whether this will be a stand alone model are awaited. It is possible that production in Hungary could be 50-70,000 upa higher than this if the Swift 4x4 variant is a model in its own right.
Suzuki Production Outlook to 2018
Group Marque Model range Series (platform) Plant CountryStart of Prod'n
Next new model
2007 Production 2008 Production 2009
Production 2010 Production 2011 Production 2012 Production
Production Outlook 2013
Production Outlook 2014
Production Outlook 2015
Production Outlook 2016
Production Outlook 2017
Production Outlook 2018
Suzuki Suzuki Jimny Linares SP 2009+ 5,064 3,163 549 0 0 0 0 0 0 0 0 0Suzuki Suzuki Grand Vitara St Petersburg RU H1 10 2011 0 0 0 0 0 0 0 5,000 20,500 17,500 16,000 14,000Suzuki Suzuki SX4 St Petersburg RU H1 10 2011 0 0 0 0 0 0 0 2,500 17,000 13,250 11,000 9,000Suzuki Suzuki Splash Esztergom HU Q2 08 2008 2,327 47,064 41,500 34,500 15,500 14,750 12,500 11,000 0 0 0 0Suzuki Opel Agila Esztergom HU Q2 08 2008 0 64,660 50,500 27,897 30,068 24,500 12,250 6,500 0 0 0 0
Suzuki Suzuki Swift YM2 Esztergom HU Q1 05H2 10, FL 2013, new after 2016
108,775 92,547 60,000 62,500 61,123 69,000 56,500 52,500 50,000 82,500 88,000 81,000
Suzuki Subaru Justy Esztergom HU 6,853 0 0 0 0 0 0 0 0 0 0 0Suzuki Suzuki Ignis Esztergom HU Q2 03 27,453 0 0 0 0 0 0 0 0 0 0 0
Suzuki Suzuki SX4 YY5 Esztergom HU Q2 06 2006 56,976 49,453 22,000 38,000 47,000 44,000 33,000 28,000 7,500 0 0 0
Suzuki Fiat Sedici Esztergom HU H2 06 2006 39,338 29,120 11,500 16,000 14,864 7,500 4,750 0 0 0 0 0Suzuki Suzuki S‐cross (SX4 repl) YAA Esztergom HU 2014+ 2014 0 0 0 0 0 0 18,000 91,000 97,000 100,000 98,500 96,500Suzuki Suzuki Total 246,786 286,007 186,049 178,897 168,555 159,750 137,000 196,500 192,000 213,250 213,500 200,500

EUROPEAN CAR AND LCV PRODUCTION OUTLOOK REPORT November 2013| Page 67
Tata-Jaguar-Land Rover Corporate Developments
Last time, we reported on news from the Frankfurt motor show regarding investment in a new range of Jaguar models. Additional information on JLR’s plans has since emerged and the situation is, we understand, as follows: £1.5bn invested in product development and manufacturing facilities at Solihull – a new body and assembly shop is now being built
to build new Jaguar sedans, crossovers and other derivatives, plus a Land Rover/Range Rover derivative of the Jaguar crossover. 1,700 new jobs at JLR, plus many more at suppliers Production to start in 2015. Rumours have also appeared in the UK press about JLR searching for additional land for further expansion although the company has not commented on this possibility. Previously we reported on the company’s impressive financial results to March 31, the key highlights of which are repeated here: Revenue up c17% at UK£15.8bn EBIT up 18.5% at UK£2.4bn, a ratio of 15.2% And retail sales up nearly 23% at 375,000. This strong financial performance has continued in the current financial years; in November, Tata confirmed that its Q2 income rose 71%, boosted by the contribution from JLR. More specifically, JLR’s profits in Q2 rose by 66% to UK£507mn – in fact JLR is now the principal contributor to Tata’s profits. Retail sales in China have been a consistent contributor here – overall in Q2 Jaguar deliveries rose by nearly 60% to over 20,000 units and Land Rover deliveries rose 15% to nearly 83,000 units. JLR expects to sell 100,000 vehicles in China in 2013, compared to 77,000 in 2012. The last year’s financial results justify Tata’s commitment to investing in JLR and its rapidly expanding new model launch programme. JLR will have invested around £2.75bn in the UK by the end of 2013 and similar sums will be spent on new models and expanding global production capacity for the next four years at least. This will result in a much wider range of Jaguar and Land Rover/Range Rover products being produced in the UK, rising UK production and the launch of full production facilities in China and ultimately in India, and possibly elsewhere, as well.
New Model News We now expect this to be as follows: Jaguar: the key focus will be on new range of compact RWD models to pitch Jaguar against BMW 3-series. We think the first model will now be called Q-TYPE, which will include saloon, cabrio, coupe and estate versions, with the first model appearing in 2015. This will be joined by a crossover, called XQ; these will be produced on the new iQ (Al) architecture which will also be used for a Land Rover model as well, almost certainly to be called Evoque Sport.

EUROPEAN CAR AND LCV PRODUCTION OUTLOOK REPORT November 2013| Page 68
Tata-Jaguar-Land Rover Later in the decade, we still expect a small, FWD Jaguar – to compete vs. Audi A3/BMW 1-series market – but not until after 2017. These new models would probably only take Jaguar to 250,000 upa in terms of European production,, so there is plenty of potential for Jaguar to grow beyond this if it is to approach the volumes achieved by BMW against which it is increasingly positioning itself.. Land Rover: with the new Range Rover and Range Rover Sport models now in production, attention turns to the replacement for the Freelander (expected to be called Discovery Sport) and Discovery from 2015. We also expect a “sub-Evoque” small SUV (and a Land Rover branded equivalent as well) around 2016, although this has not been officially confirmed. In 2017 or possibly later, we would expect the Discovery to be extended to include a “luxury” version and some time after 2017 we expect a LWB Evoque XL as well. The main uncertainty at Land Rover concerns the timing for the replacement for the Defender and its production location; ultimately some of these models will be made outside the UK, but we firmly believe that the first versions of the Defender replacement will be made here. It is not yet clear what will happen to the Discovery assembly hall when the new Discovery moves to the same line as the Range Rover/Range Rover Sport, but this facility could be used for the next Defender. Currently, we have this coming into production from 2016, but the numbers for this model in the Outlook are highlighted in pink to illustrate their provisional nature. Current Defender likely to go out of production – at least for developed world markets – in 2015 owing to difficulties in meeting safety and other legislation with existing design. However, production, even in kit form, for export to developing markets remains likely for a couple more years at least.
Manufacturing News
New engine plant well under way; at the Geneva motor show earlier in 2013, JLR announced that factory will double in size. Total investment in the new engine plant will be £500mn. Engine production is due to start early 2014; test engines already running in Evoque. New engines use “Hotfire” name; expected to power most of JLR’s planned 600,000 upa production by 2020. The first engine will be a diesel model, with petrol versions starting from mid 2015. JLR’s engineering director, Wolfgang Ziebart, indicated that three-cylinder petrol and diesel engines are also under consideration. petrol and Investment in new presses for the Freelander replacement Halewood – and also in presses at Castle Bromwich for the new CX17 models – is also understood to have started. As recently as mid-November, JLR confirmed that it was also evaluating a plant in Brazil. A decision on this will be made by the end of March 2014.
Alliances Engine alliance with Ford slowly being unwound, although JLR will either need to expand the Wolverhampton engine plant yet again or source engines from Ford for longer in order to meet its planned production volumes. Alliance agreed with Saudi to source aluminium in the country and possibly produce cars in the country some time later in the decade. Press reports suggest this will indeed happen and agreement has been reached but there has been no official confirmation of this. Production alliance with Chery in China now under way – models will be produced under the Land Rover badge and a jointly developed marque there.

EUROPEAN CAR AND LCV PRODUCTION OUTLOOK REPORT November 2013| Page 69
Tata-Jaguar-Land Rover Production Outlook
With the crossover and small Jaguars planned, we envisage close to 250,000 Jaguars being made in the UK in the second half of the decade, along with 450-500,000 Land Rovers/Range Rovers. The timing for these targets being reached will depend on the final launch schedules for all the new models being confirmed, especially the Defender. Some programmes, such as the Defender replacement, could get pushed back and these production targets could therefore not be reached until the end of the decade; the direction of travel for Jaguar Land Rover production however is clear and it is entirely conceivable that our projections here could well prove to be under-estimates.
Jaguar Land Rover Production Outlook to 2018
Group Marque Model range Series (platform) Plant CountryStart of Prod'n Next new model 2008 Production
2009 Production 2010 Production 2011 Production 2012 Production
Production Outlook 2013
Production Outlook 2014
Production Outlook 2015
Production Outlook 2016
Production Outlook 2017
Production Outlook 2018
Tata Jaguar X type X400/ CD132 Halewood UK Q1 01 2009+ 15,973 8,046 0 0 0 0 0 0 0 0 0Tata Jaguar Small Jaguars C‐X17 Solihull UK 2018?? 0 0 0 0 0 0 0 0 0 0 30,000Tata Jaguar Q‐TYPE C‐X17/X760 Solihull UK 2016 0 0 0 0 0 0 0 0 68,000 80,000 79,000Tata Jaguar XQ C‐X17/X761 Solihull UK 2016 0 0 0 0 0 0 0 0 25,000 48,000 50,000Tata Jaguar Q‐TYPE Fastback C‐X17/X764 Castle Bromwich UK H1 17 0 0 0 0 0 0 0 0 0 5,000 7,500Tata Jaguar F‐type X151/2 Castle Bromwich UK H2 13 H1 14 add coupe 0 0 0 0 0 12,500 15,000 18,000 16,000 14,500 13,000Tata Jaguar XF, inc est late 2012 X250 Castle Bromwich UK H1 08 2016 = X260 43,792 27,236 34,396 31,295 36,850 48,000 43,500 40,000 50,000 51,000 49,000Tata Jaguar XJ / XJR X350/1 to X360 Castle Bromwich UK H1 10 2017 5,982 1,953 16,495 14,033 15,086 18,750 18,250 17,000 14,000 16,000 19,000Tata Jaguar XK / XK8 X150 Castle Bromwich UK H1 06 Switch to X764 6,949 4,530 5,565 4,604 3,980 2,750 2,500 1,750 1,500 0 0Tata Jaguar Total 72,696 41,765 56,456 49,932 55,916 82,000 79,250 76,750 174,500 214,500 247,500Tata Land Rover Sub Freelander L851 Halewood UK 2017 0 0 0 0 0 0 0 0 0 12,500 35,000Tata Land Rover Range Rover Evoque Junior L551 Halewood UK H1 16 2016 0 0 0 0 0 0 0 0 15,000 48,000 55,000Tata Land Rover Freelander L359 Halewood UK Mid 2006 2014 59,137 35,405 56,487 48,753 52,993 56,000 50,000 0 0 0 0Tata Land Rover Discovery Sport L550 Halewood UK H1 15 2015 0 0 0 0 0 0 0 75,000 83,000 71,000 65,500Tata Land Rover Range Rover Evoque L538 Halewood UK H1 11 0 0 0 40,212 112,331 124,500 118,000 106,000 96,000 85,000 77,250Tata Land Rover Discovery L319 (T5) Solihull UK Q2 04 2011 FL 35,383 21,195 39,374 46,480 45,550 49,500 43,000 40,000 0 0 0Tata Land Rover New Discovery L661 Solihull UK H1 16 0 0 0 0 0 0 0 0 50,000 62,000 60,000Tata Land Rover Range Rover Evoque Sport L560 Solihull UK H1 17 0 0 0 0 0 0 0 0 0 45,000 55,500Tata Land Rover Range Rover Sport L321 Solihull UK Q2 05 2013 45,628 29,265 47,439 54,981 57,861 35,000 0 0 0 0 0Tata Land Rover New Range Rover Sport L494 Solihull UK H1 13 0 0 0 0 0 26,500 66,000 70,000 68,000 65,500 63,750Tata Land Rover Range Rover L322 Solihull UK H2 01 2012 23,786 15,173 24,563 30,848 20,167 0 0 0 0 0 0Tata Land Rover New Range Rover L405 Solihull UK H1 12 0 0 0 0 7,312 47,500 52,000 50,000 45,000 42,000 40,000Tata Land Rover New Defender L660 Solihull UK 0 0 0 0 0 0 0 0 40,000 60,000 55,000Tata Land Rover Defender L316 Solihull UK 22,345 15,543 17,233 19,825 15,534 17,250 16,250 12,500 7,500 2,500 0Tata Land Rover Defender L316 Solihull UK 1,868 0 0 0 0 0 0 0 0 0 0Tata Land Rover Total 188,147 116,581 185,096 241,099 311,748 356,250 345,250 353,500 404,500 493,500 507,000Tata Tata JLR Total 260,843 158,346 241,552 291,031 367,664 438,250 424,500 430,250 579,000 708,000 754,500
2015/6 ‐ cd be delayed

EUROPEAN CAR AND LCV PRODUCTION OUTLOOK REPORT November 2013| Page 70
Toyota Corporate Developments
There have been no major corporate developments since the last report.
New Model News Auris is now in full production in UK, including production of the estate/wagon version. In Turkey production of the new Corolla sedan has begun. Yaris production line-up now complete in France.
Manufacturing News
The most recent manufacturing news for Toyota in Europe concerns the decision make the RAV4 SUV in Russia from 2016. We still also expect a small C or B segment SUV to be made in Turkey from around this date.
Alliances Van production agreement with PSA will start later this year (see PSA tables for production volume). Production Outlook
New Auris at full production, including estate; rising Camry output in Russia and new Corolla sedan in Turkey should push Toyota’s 2013 European production close to 600,000 for the first time since 2007. Steady progress to over 700,000 will follow, but Toyota still has some way to go to get back to the 805,000 units produced in Europe in 2007; adding a third model in the UK and confirmation of an SUV for SUV would enable this target to be reached once again, and even exceeded later in the decade.
Toyota Production Outlook to 2018
Group Marque Model range Series (platform) Plant CountryStart of Prod'n
Next new model
2007 Production 2008 Production 2009
Production 2010 Production 2011 Production 2012 Production
Production Outlook 2013
Production Outlook 2014
Production Outlook 2015
Production Outlook 2016
Production Outlook 2017
Production Outlook 2018
Toyota Toyota Aygo B0 ‐ 590N Kolin CZ Q1 05 2014 106,982 108,127 101,000 82,911 90,788 70,000 78,000 88,000 95,000 97,000 94,500 92,000Toyota Toyota Yaris 316W Valenciennes FR Q1 06 2011 262,313 232,406 207,456 158,512 24,153 0 0 0 0 0 0 0Toyota Toyota Yaris 020X Valenciennes FR H2 11 2016‐17 0 0 0 0 125,000 200,000 187,000 183,000 173,000 183,000 200,000 219,000Toyota Toyota Corolla 340N Burnaston, Derby UK Q2 01 2007 11,839 0 0 0 0 0 0 0 0 0 0 0Toyota Toyota Auris 345 Burnaston, Derby UK H1 07 2012 120,317 102,588 50,212 68,687 57,411 27,821 0 0 0 0 0 0Toyota Toyota Auris New Burnaston, Derby UK H2 12 0 0 0 0 0 21,000 140,000 143,000 138,000 131,000 125,000 121,000Toyota Toyota Auris 131L Gebze TU Q1 07 2012 60,742 66,000 27,501 42,936 47,250 39,000 0 0 0 0 0 0Toyota Toyota Corolla Verso 240N Gebze TU Q1 04 2009 100,874 60,594 0 0 0 0 0 0 0 0 0 0Toyota Toyota Corolla Verso 681N Gebze TU Q3 09 2016 0 0 44,763 40,350 48,250 36,000 37,500 45,000 50,000 46,500 40,000 35,000Toyota Toyota Corolla sedan Gebze TU H1 13 2018 0 0 0 0 0 0 68,000 90,000 93,000 85,000 75,000 85,000Toyota Toyota C‐SUV (TBC) TBA Gebze TU H2 16 2016 0 0 0 0 0 0 0 0 0 25,000 50,000 55,000Toyota Toyota Avensis 223W/ 352WW Burnaston, Derby UK Q1 03 2008+ 142,669 92,063 0 0 0 0 0 0 0 0 0 0Toyota Toyota New Avensis MC 445L Burnaston, Derby UK 2011/12 2016/7 0 18,678 77,193 68,367 70,735 60,608 35,000 30,000 40,000 60,000 62,500 58,000Toyota Toyota RAV 4 St Petersburg RU H1 14 2014 0 0 0 0 0 0 0 0 0 35,000 45,000 50,000Toyota Toyota Camry MC 045L St Petersburg RU H2 08 2008+ 0 6,275 8,310 15,000 14,500 28,000 39,000 42,000 38,750 34,000 39,000 43,000Toyota Toyota Landcruiser Sollers RU H2 12 2012 0 0 0 0 0 1,250 8,500 15,000 23,000 20,000 18,750 16,500Toyota Toyota Total 805,736 686,731 516,435 476,763 478,087 483,679 593,000 636,000 650,750 716,500 749,750 774,500

EUROPEAN CAR AND LCV PRODUCTION OUTLOOK REPORT November 2013| Page 71
Volkswagen Group Corporate Develop-ments
The VW group continues to grow and go from strength to strength. H1/2013 global deliveries were up 5.5% yet-on-year at 4.7mn vehicles; June saw a rise of 3.7%. European deliveries were down 3.5% at 1.87mn, but sales in north America rose by 123% in H1; China rose 18.7%, while India rose 19.2% - Asia-Pacific as a whole rose by 16.8%. the changing geographic focus of the group is clear from this brief summary – China, India and North America are likely to be the main sources of sales growth in the near term, although Europe will remain key to production. Exports from Europe therefore will be integral to the group’s medium term success. In terms of brands, the key highlights at H1 are as follows: VW passenger cars were up 4.4% at 2.91mn, with a 19.4% rise in China being the main driver Audi saw a 6.4% rise, with China again the key, up 17.7%; US sales also rose 14% in H1 Skoda saw a fall of nearly 6% in H1, with Europe and Asia-Pacific contributing equally to the fall SEAT, so long the poor performer in the group, saw an 11.5% rise, with Europe showing an 8.2%. While sales volumes have been strong, then company’s financial results have been something of a mixed bag; operating profit decline by 26% in Q1, but its Q2 results have been much better, although its overall h1 results were still 11.6% down on H1/2012. The group still expects to outperform the market as a whole through 2013, with total deliveries exceeding 2012 volumes. Q” sales were 6% up year-on-year and 5.4% up for H1 overall. Q2 revenue was €52.1bn which was a rise of 8.5% on Q2/2012; operating profit was up 1.8% at €3.44bn comparison with 2012 is somewhat distorted owing the recent full integration of Porsche into the VW group. In terms of the individual brands, Volkswagen Passenger Cars experienced a H1 revenue decline of 4.5% with a fall in profit from €2.27bn to €1.49bn; Audi also saw a fall in earnings, from €2.87bn to €2.64bn. Skoda also saw its operating profit decline, from €449mn to €253mn, attributed largely to costs associated with the Octavia model changeover. SEAT is still the only loss-making brand with the group, with a slightly reduced H1 loss, of €40mn compared to €42mn a year earlier. Porsche also report a rise in profits in H1, of 3%, to €1.29bn. Despite the fall in H1 earnings, the company expects to meet its original 2013 objectives, ie matching the 2012 operating profit figure of €11.5bn and of achieving record sales and deliveries. When Q3 figures were released, VW passenger cars reported a 3.6% rise in deliveries to 4.36mn for the three quarters, and a rise of 6.8% for September alone. Asia-Pacific saw a rise of 16%, while in North America, deliveries were up 2.1% (but the US itself saw a small decline); deliveries also fell in Europe (-5.7%) and South America (-13.4%). Audi saw a rise through Q1-Q3 of 7.6% to 1.18mn, Skoda saw a fall of 4.5% to just under 685,000, while SEAT rose 11.7% to 266,000 units for the first three quarters. VW CV sales were broadly unchanged. Despite these mixed sales figures, financial results were ahead of market estimates; for Q3, the company reported EBIT of nearly €2.8bn, which was up to 7% ahead of analysts’ predictions. The company’s EBIT margin was 8.2%, which is especially impressive given the stage

EUROPEAN CAR AND LCV PRODUCTION OUTLOOK REPORT November 2013| Page 72
Volkswagen Group that many of the company’s models are in their life cycles; other cost factors which reduced the company’s performance included costs associated with expanding the Leipzig plant, launch costs for the Porsche Macan and later than expected saving from the MQB platform. Q1-Q3 revenue was up from €144.bn to €145.7bn, although group operating profit was down slightly from €8.9bn to €8.6bn; group profit for Q3 rose from €2.3bn to €2.8bn strong performances were reported across the group, with Skoda for example reported an operating profit rise of 8.8% to €371mn for the first three quarters, and at Porsche profits of €1.89bn were also up, albeit by just 1%, also for Q!-Q3. In line with VW brand deliveries being down, Q3 also saw brand revenue down, by 9% year-on-year; however it still reported a Q3 EBIT of €623mn, or 2.6% - this is expected to improve next quarter and in 2014 with the proportion of high specification new Golfs coming off the assembly line increasing. Porsche also contributed an operating profit of €1.9bn, with a margin of 17.6%; Audi reported profits of €3.7bn, which was done on last years, reflecting declining sales of ageing models, and upfront costs for expanding production capacity around the world. On the back of these and earlier figures, the company is expecting full year sales to top those in 2012 but with comparable operating profit; its total group sales volumes for Q1-Q3 exceeded 7mn for the first time. The company also reported a small rise in October and January to October sales, up 2% and 3.4% respectively. This has led the company’s head of sales, Christian Klingler to suggest that markets across Europe are now stabilising, especially in France, Spain and Italy are a period of continuous decline; sales in China continue to grow from strength to strength. Audi also reported a 6.7% rise in October, meaning the brand has experienced a 7.5% since the start of the year. A major contributor here has been the Audi A3 sedan which jus made in Hungary in one of the brand’s expanding factories.
New Model News
The key short term changes in VW’s model line-up is: Volkswagen: New Passat is due in 2015 and is likely to be accompanied by a shooting brake version of the CC, as well as a conventional estate version: would fill the gap between Passat and Phaeton. New mid-sized 7-seater SUV (currently known as CrossBlue) – primarily for US market and likely to be made in the company’s Tennessee plant – is expected to be officially confirmed by the end of the year; this model would it between Tiguan and Touareg. Audi: most growth at Audi expected to come from expanding Q range which could account for 40% of Audi sales by 2020. Growth of Q range seen as essential if Audi is to surpass BMW; Q range will include Q2 (based on A1), Q6 (coupe version of Q5) and Q8 (luxury version of Q7). Q4 likely to be added at end of decade. Q1, based on the up! is also now expected within a couple of years. Skoda: no major developments since our last report. The brand is in the midst of a major product re-vamp, at the heart of which will be a move into the SUV market, with a model likely to be called Polar. The brand has also added an estate version of the Rapid Seat: Exeo production has stopped and this model will not be replaced directly; Seat will use variants of the new Toledo and Leon to meet demand for the estate segment. In addition, the company will retain the Altea XL which it believes will be able to accommodate some of the demand for the estate versions of the Exeo. Porsche: the main development here has been the launch of the Macan which was unveiled at the recent Los Angeles motor show.

EUROPEAN CAR AND LCV PRODUCTION OUTLOOK REPORT November 2013| Page 73
Volkswagen Group Bentley: the brand has a target of selling 15,000upa by 2018, at the heart of which is the SUV based on the EXP9F concept car shown as various motor shows in 2012. The SUV is tasked with selling up to 4,000upa. The Bentley SUV is actually the main new model news of recent months at VW. This will result in an investment of £800mn at the Crewe factory and the creation of 1,000 jobs at Bentley and in the supporting supply chain. No technical details have been released but the technology underpinning the vehicle will also be used on a future Lamborghini SUV which is expected from 2017/8. We also expect a Gran Coupe Bentley (to compete vs. the Mercedes S-coupe and BMW 6-series Gran Coupe later in the decade. A budget brand, below Skoda, is still under consideration, as is the possibility of an additional acquisition. The budget brand, if it were launched, would start in China, and possibly India and Mexico. .
Manufacturing News
A number of significant developments have come to light in terms of VW group manufacturing plans in recent months, including: The opening of a new aluminium component plant at Munchsmunster near Ingolstadt; this will ease the pressure on capacity at Ingolstadt
and allow that plant to expand vehicle production while the new plant focused on body and suspension components Audi Hungary has now passed the milestone of producing 25mn engines, as well as having started series production of the A3 sedan;
production of the new A3 cabrio and the next TT will follow in 2014. Expansion of facilities at Skoda to allow for the next Skoda Fabia and Polar SUV are now under way; this year, Skoda has commissioned a
new €66mn press line which it claims is as much as 15% more efficient than outgoing equipment. Production of the updated Superb has started in Kvasiny where a new logistics centre and assembly line have been built; as new chassis line will be added in Kvasiny later in 2013
Start of production of the Skoda Octavia in Russia, at the GAZ plant in Nizhny Novgorod – GAZ and Skoda have invested €300mn in the plant to prepare for production of this model which is the second Skoda model to be made there, following the earlier production start of the Yeti; Octavia production has also behind at partner companies in Ukraine and Kazakhstan – whereas the Russian operation is a full manufacturing arrangement in Ukraine and Kazakhstan, fully welded bodies are shipped from the Czech Republic and final assembly takes place in Ukraine or Kazakhstan.
Porsche Leipzig paint shop has been completed, a development which is part of a €500mn investment to support the production of the Macan mid-size SUV.
Earlier in the year, Volkswagen reached agreement with IG Metall regarding a 5.7% pay rise in Germany which will secure labour harmony in Germany for at least two years. This is essential given the continued rise in production outside Europe. Golf production outside Europe is increasing, with VW Mexico due to start production in early 2014. Production will also soon be under way in Brazil, following investment there to make models on the MQB platform. Production of Passat in Emden has been cut, partly because the model is coming to the end of its life cycle and partly because of production having switched to North America.

EUROPEAN CAR AND LCV PRODUCTION OUTLOOK REPORT November 2013| Page 74
Volkswagen Group Despite the general overcapacity problems in Europe, VW remains committed to its European production facilities – indeed it will invest just under €800mn in its plant in Spain to prepare for the new Polo and a number of derivatives. This investment will take place over the next five years. We do not see any significant cutbacks in VW production capacity in Europe.
Alliances Alliances steadily being reduced as VW looks to increase control from its centre: will stop sourcing Crafter vans from Mercedes in 2016 and will instead make a large van of its, building on expertise from MAN. Details, timing and volumes for this remain to be confirmed. The unwinding of the Suzuki alliance (which never got off the ground) is still proceeding, but very slowly.
Production Outlook
VW’s position as the leading VM group in Europe seems unassailable. We now expect it to exceed 5mn units production in Europe by 2016, the recent downturn in Europe notwithstanding. Volkswagen will see a slight fall in short-term production while model switchover and production location changes are completed in 2013/14; Audi will be largely unchanged for a couple of years before rising again in 2016-2018 on the back of new models. Meanwhile Skoda will see a rise in production in 2013 and after an adjustment down in 2014 owing to model cycle effects on the Fabia, Yeti and Roomster, continued growth from 2015 is to be expected. Seat will struggle and will be increasingly dependent on the Audi Q3 to support production at Martorell; we remain doubtful that Seat is viable brand for VW in the long run, although VW is most unlikely to drop it having invested so heavily in it in recent times. More production for other brands at Seat’s factory is likely as is more production of Seats by other brands (eg Skoda making the Seat Toledo). Porsche wants to achieve 200,000 upa but we remain doubtful if it can achieve this before 2017– competition in its volume segments, the Macan and Cayenne SUV segments is getting tougher, and it may require a third SUV, smaller than Macan to help sustain the brand at over the 200,000 upa level in the long run.
VW Group Production Outlook to 2018
Marque 2007 Production 2008 Production 2009
Production 2010 Production 2011 Production
Production Outlook 2012
Production Outlook 2013
Production Outlook 2014
Production Outlook 2015
Production Outlook 2016
Production Outlook 2017
Production Outlook 2018
Volkswagen 2,026,602 2,054,283 1,835,493 2,124,741 2,372,955 2,422,795 2,478,500 2,420,500 2,454,250 2,582,500 2,626,250 2,638,250Audi 974,715 1,019,625 931,016 1,148,692 1,349,756 1,065,611 1,098,409 1,111,259 1,143,259 1,144,000 1,194,950 1,265,750Seat 412,937 379,834 293,548 344,162 370,794 396,393 417,500 403,500 461,250 470,500 455,000 446,000Skoda 621,626 614,999 541,189 558,735 583,000 589,150 651,800 639,000 668,000 716,250 693,000 662,250Lamborghini 2,580 2,424 1,253 1,227 1,738 2,197 2,500 2,800 3,750 5,000 5,500 6,000Bentley 10,000 7,692 3,596 4,792 7,528 9,108 9,275 9,200 10,950 11,850 12,325 14,300Porsche 107,170 96,721 75,637 95,529 127,165 146,500 164,168 196,500 198,100 198,400 203,800 204,500Total 4,155,630 4,175,578 3,681,732 4,277,878 4,812,936 4,631,754 4,822,152 4,782,759 4,939,559 5,128,500 5,190,825 5,237,050

EUROPEAN CAR AND LCV PRODUCTION OUTLOOK REPORT November 2013| Page 75
Volkswagen brand Production Outlook to 2018
Group Marque Model range Series (platform) Plant CountryStart of Prod'n
End of Prod'n
Next new model 2007 Production 2008 Production
2009 Production 2010 Production 2011 Production 2012 Production
Production Outlook 2013
Production Outlook 2014
Production Outlook 2015
Production Outlook 2016
Production Outlook 2017
Production Outlook 2018
Volkswagen Volkswagen 4 seater Up! (and 2‐seater from 2MHB Bratislava SK H1 11 0 0 0 0 20,000 137,000 139,500 142,000 135,000 132,000 121,000 150,000Volkswagen Seat Mii (Up!) MHB Bratislava SK H1 11 0 0 0 0 1,500 28,500 26,250 25,000 24,500 23,750 20,000 31,000Volkswagen Skoda Citigo MHB Bratislava SK H1 11 0 0 0 0 1,500 36,000 46,000 44,250 41,000 39,000 34,000 48,000Volkswagen Audi Q1 MHB Bratislava SK H2 16 0 0 0 0 0 0 0 0 0 15,000 26,000 24,250Volkswagen Volkswagen Polo A04 Bratislava SK H1 01 2008 53,972 0 0 0 0 0 0 0 0 0 0 0Volkswagen Volkswagen Polo A04 Pamplona SP H1 01 2009 228,462 259,000 90,765 0 0 0 0 0 0 0Volkswagen Volkswagen Polo A05 Pamplona SP H2 09 2016 0 92 152,735 365,695 353,353 287,287 292,000 275,000 245,000 302,000 310,000 303,500Volkswagen Volkswagen Polo MPV A05 Pamplona SP 2016 0 0 0 0 0 0 0 0 35,000 75,000 78,500Volkswagen Volkswagen Polo A04 Brussels BE H2 06 2009 46,888 53,177 39,749 15,000 0 0 0 0 0 0 0 0Volkswagen Volkswagen Golf V A5/ PQ35 Brussels BE H2 03 17,573 0 0 0 0 0 0 0 0 0 0 0Volkswagen Volkswagen Golf V A5/ PQ35 Zwickau / Mosel DE 2009 193,246 128,409 160,111 11,648 0 0 0 0 0 0 0 0Volkswagen Volkswagen Golf VI ‐ switch to Golf VII in 2013A6 Zwickau / Mosel DE H2 09 0 0 0 171,924 171,000 65,000 0 0 0 0 0 0Volkswagen Volkswagen Golf V A5/ PQ35 Wolfsburg DE H2 03 2009 287,810 315,057 383,021 33,626 0 0 0 0 0 0 0 0Volkswagen Volkswagen Golf VI (incl. cabrio ‐ final assembA6 Wolfsburg DE H2 08 0 0 0 325,565 405,500 178,000 35,000 0 0 0 0 0Volkswagen Volkswagen Golf VII MQB Wolfsburg/Mosel DE H2 13 2013‐14 0 0 0 0 0 289,000 570,000 565,000 549,000 535,000 517,500 503,000Volkswagen Volkswagen Tiguan (Golf SUV) VW416 Wolfsburg (Euro 5000) DE H1 07 2015 16,401 151,028 143,680 183,371 199,000 245,000 262,000 251,000 36,000 0 0 0Volkswagen Volkswagen New Tiguan MQB Wolfsburg (Euro 5000) DE 2015 0 0 0 7,126 0 0 0 0 202,000 245,000 252,000 249,000Volkswagen Volkswagen Golf Plus PQ35 Wolfsburg DE H2 04 Q1 10 2010FL 111,917 92,565 106,320 81,382 0 0 0 0 0 0 0 0Volkswagen Volkswagen Golf Plus FL PQ35 Wolfsburg DE 2010 2014 0 0 0 0 95,000 74,000 75,500 37,000 0 0 0 0Volkswagen Volkswagen Golf Plus 2 PQ36 Wolfsburg DE H1 14 H1 13 0 0 0 4,340 0 0 0 50,000 95,000 92,000 84,500 80,000Volkswagen Volkswagen Jetta/Bora PQ35 Mlada Boleslav CZ 0 1,627 1,633 80,828 275 50 0 0 0 0 0 0Volkswagen Volkswagen Touran A5/ PQ35 Wolfsburg (Euro 5000) DE Q1 03 2010 FL 187,900 135,762 106,888 31,639 0 0 0 0 0 0 0 0Volkswagen Volkswagen Touran A5/ PQ35 Wolfsburg (Euro 5000) DE Q1 13 0 0 0 0 114,000 114,000 69,000 0 0 0 0 0Volkswagen Volkswagen Touran MQB/VW368 Wolfsburg (Euro 5000) DE Q1 13 0 0 0 123,027 0 0 30,000 118,500 131,500 126,500 119,000 108,750Volkswagen Volkswagen Passat PQ46 Emden DE Q1 05 Q4 2010 252,792 188,989 142,082 46,332 0 0 0 0 0 0 0 0Volkswagen Volkswagen Passat PQ46 Zwickau / Mosel DE Q1 05 Q4 2010 141,189 125,242 52,210 45,409 0 0 0 0 0 0 0 0Volkswagen Volkswagen Passat PQ47 Emden & Zwickau DE 2010 FL 2014 0 0 0 786 291,000 235,000 217,000 199,000 225,000 237,000 230,000 225,000Volkswagen Volkswagen Passat PQ46 Mlada Boleslav CZ 392 642 394 0 0 0 0 0 0 0 0 0Volkswagen Volkswagen Passat PQ47 Mlada Boleslav CZ 0 0 0 76,901 700 1,000 250 0 0 0 0 0Volkswagen Volkswagen Passat CC PQ46 Emden DE Q3 07 2015 154 47,169 59,932 0 69,000 65,000 56,500 45,000 7,500 0 0 0Volkswagen Volkswagen New CC MQB Emden DE 2015 0 0 0 7,477 0 0 0 0 60,000 75,000 73,000 70,750Volkswagen Volkswagen Phaeton D1/VW611 Dresden DE Q4 01 2015 5,711 6,189 4,071 0 11,000 8,750 7,750 9,000 1,750 0 0 0Volkswagen Volkswagen Phaeton W631 Dresden DE 2015 0 0 0 22,775 0 0 0 0 8,750 11,000 12,000 10,750Volkswagen Volkswagen Eos A5 Setubal PT H1 06 switch Passsat/Jetta CC 55,559 43,578 17,880 45,230 22,511 11,138 8,500 1,750 0 0 0 0Volkswagen Volkswagen Scirocco A5 Setubal PT Late 2008 2015‐6 83 20,537 47,277 23,229 42,481 33,620 27,000 24,500 22,250 35,000 45,000 45,000Volkswagen Volkswagen Sharan VW418 Setubal PT H2 06 2011 23,808 19,703 14,643 0 14,968 0 0 0 0 0 0 0Volkswagen Volkswagen New Sharan T5 Setubal PT H1 11 0 0 0 26,966 35,000 48,399 39,000 33,500 31,000 24,000 30,000 38,000Volkswagen Volkswagen Touareg T5/PL75/VW759; VWBratislava SK H2 02 2010 72,455 62,229 29,576 20,861 0 0 0 0 0 0 0 0Volkswagen Volkswagen Touareg T5/PL75/VW759; VWBratislava SK H2 10 2017 0 0 0 94,944 72,000 87,500 74,000 70,750 72,000 70,000 89,000 96,750Volkswagen VW and Skoda Various models Various Kaluga RU Full Prod 2009 1,198 62,234 48,012 0 138,166 179,554 143,000 169,000 188,000 189,000 183,000 181,000Volkswagen VW and others Various models Various GAZ RU 2012/2013 0 0 0 137,180 0 0 38,750 63,000 77,000 80,000 78,000 76,500Volkswagen Volkswagen Caddy PQ35 Poznan PL Q4 03 2014 142,226 155,741 127,291 12,020 157,976 144,640 153,500 145,000 139,000 134,000 130,000 125,000Volkswagen Volkswagen Transporter T5 Poznan PL Q1 04 2015 24,810 18,738 10,802 129,460 19,025 17,357 22,000 21,000 23,000 22,750 22,250 21,500Volkswagen Volkswagen Transporter T5 Hanover DE Q2 02 2015 162,056 166,575 96,421 0 138,000 119,500 111,000 97,000 109,000 120,000 115,000 102,500Volkswagen Volkswagen Crafter replacement New (MAN light trucTBC DE H2 16 2016 0 0 0 0 0 0 0 0 0 10,000 33,500 45,000Volkswagen Volkswagen Amarok Pick‐up Hanover DE H2 12 0 0 0 0 0 17,500 35,000 34,250 31,000 29,500 26,500 24,500Volkswagen Volkswagen Total 2,026,602 2,054,283 1,835,493 2,124,741 2,372,955 2,422,795 2,478,500 2,420,500 2,454,250 2,582,500 2,626,250 2,638,250

EUROPEAN CAR AND LCV PRODUCTION OUTLOOK REPORT November 2013| Page 76
Audi Production Outlook to 2018
Group Marque Model range Series (platform) Plant CountryStart of Prod'n
Next new model
2007 Production 2008 Production 2009
Production 2010 Production 2011 Production 2012 Production
Production Outlook 2013
Production Outlook 2014
Production Outlook 2015
Production Outlook 2016
Production Outlook 2017
Production Outlook 2018
Volkswagen Audi A1 PQ25 Brussels BE H2 09 2017 0 0 226 51,937 117,566 126,500 125,000 114,000 109,000 104,000 135,000 148,750Volkswagen Audi Q2 PQ25 Brussels BE H1 15 2015 0 0 0 0 0 0 0 0 25,000 50,000 46,500 41,000Volkswagen Audi A3 A5 Brussels BE 2010 12,087 31,762 23,562 17,002 0 0 0 0 0 0 0 0Volkswagen Audi A3/RS3 (RS3 final assembly at GyA5/PQ35 Ingolstadt DE Q3 04 2010 218,828 171,863 173,177 169,610 170,316 0 0 0 0 0 0 0Volkswagen Audi A3 MQB/A6/ VW368 Ingolstadt DE H2 10 2010 0 0 0 0 7,000 160,000 198,750 193,500 187,000 173,000 162,500 180,000Volkswagen Audi A4 B7/PL46 Ingolstadt DE Q4 00 2008 274,195 54,252 0 0 0 0 0 0 0 0 0 0Volkswagen Audi A4 B8 MLB Ingolstadt DE Q4 07 2014 9,702 228,288 205,126 232,900 285,000 209,000 199,000 207,000 217,000 225,000 222,000 219,000Volkswagen Audi A4 B8 MLB Neckarsulm DE Q4 07 2014 2,209 79,589 70,054 67,458 38,000 11,000 13,000 19,000 23,500 25,000 23,500 19,000Volkswagen Audi A4 cabriolet B7 Rheine (Karmann) DE H2 2006 23,641 16,790 2,409 0 0 0 0 0 0 0 0 0Volkswagen Audi A4 Allroad B8 MLB Ingolstadt DE H1 09 2015 0 0 9,291 10,788 10,537 8,500 8,000 7,500 9,000 10,000 8,750 8,500Volkswagen Audi A5 incl. RS5 B7 Ingolstadt DE H1 2007 2014‐5 25,554 57,324 69,471 90,016 91,299 92,500 91,500 82,000 94,000 103,000 101,000 95,000Volkswagen Audi A5 cabriolet B7 Neckarsulm DE H2 09 2015 0 326 15,388 20,924 20,459 15,000 12,250 8,500 16,000 24,500 26,500 24,000Volkswagen Audi A6 Allroad C6 Neckarsulm DE H2 06 H2 11 FL, New 2 16,340 10,283 4,104 5,551 3,036 0 0 0 0 0 0 0Volkswagen Audi A6 incl. RS6 C6 Neckarsulm DE Q1 04 229,590 210,652 177,599 206,734 141,888 0 0 0 0 0 0 0Volkswagen Audi A6 C7 MLB Neckarsulm DE Q2 2011 2018 0 0 0 0 100,000 145,000 135,500 123,000 119,000 109,000 101,000 135,000Volkswagen Audi A6 Allroad C7 MLB Neckarsulm DE H2 2011 2018 0 0 0 0 0 7,000 8,750 7,750 7,000 6,000 5,500 8,000
Volkswagen Audi A7 C7 MLB Neckarsulm DE H2 09 0 0 251 8,496 37,301 31,000 29,750 26,500 24,500 22,500 31,000 33,500
Volkswagen Audi A8 D3/PL63 Neckarsulm DE 2010 22,182 20,140 8,009 4,701 0 0 0 0 0 0 0 0Volkswagen Audi A8 D4 ‐ MLB Neckarsulm DE H1 10 2017 0 0 590 17,734 38,542 38,000 36,250 34,750 33,500 32,000 49,000 56,000Volkswagen Audi A9 MLB Neckarsulm DE H1 15 0 0 0 0 0 0 0 0 10,000 15,000 17,500 15,500Volkswagen Audi TT Coupe A5/PQ35 Gyor HU Q3 06 2013‐4 40,417 31,101 18,010 20,413 19,704 16,040 0 0 0 0 0 0Volkswagen Audi TT Roadster A5/PQ35 Gyor HU Q3 06 2013‐4 16,349 10,688 4,811 5,804 5,804 4,940 0 0 0 0 0 0Volkswagen Audi TT (all from 2013) MQB Gyor HU Q1 14 0 0 0 0 0 0 20,250 33,000 31,500 30,250 29,500 27,750Volkswagen Audi A3 cabrio A5/PQ35 Gyor HU Q2 07 216 16,570 9,782 12,309 14,050 11,572 0 0 0 0 0 0Volkswagen Audi New A3 and new cabrio MQB/A6/ VW368 Gyor HU H1 13 0 0 0 0 0 5,500 25,500 78,000 85,000 81,000 76,500 75,000Volkswagen Audi R4 Neckarsulm DE H2 16 0 0 0 0 0 0 0 0 3,500 4,500 6,000 5,000Volkswagen Audi R8 Gallardo Neckarsulm DE Q2 08 2014 6,000 5,656 2,101 3,485 3,551 2,550 2,400 2,250 2,750 3,750 2,950 2,750Volkswagen Audi Quattro Neckarsulm DE 2015 0 0 0 0 0 0 0 0 2,000 2,500 2,750 2,500Volkswagen Audi Unnamed ‐ MPV style Undecided De 2016 9 9 9 9 9 9 9 9 9 7,500 15,000 18,000Volkswagen Audi Q6 MLB Neckarsulm DE H2 16 0 0 0 0 0 0 0 0 0 12,500 36,500 45,000Volkswagen Audi Q5 B6 then MLB Ingolstadt DE H2 07 2014/15 0 20,324 109,117 155,052 191,987 127,500 133,000 118,000 85,000 35,000 0 0Volkswagen Audi Q8 Q7 Bratislava SK H1 17 0 0 0 0 0 0 0 0 0 0 19,000 30,000Volkswagen Audi Q7 T5/PL75 Bratislava SK Q4 05 2015/16 77,396 54,008 27,929 47,769 53,707 54,000 59,500 56,500 59,000 68,000 77,000 76,500Volkswagen Audi Total 974,715 1,019,625 931,016 1,148,692 1,349,756 1,065,611 1,098,409 1,111,259 1,143,259 1,144,000 1,194,950 1,265,750
SEAT Production Outlook to 2018
Group Marque Model range Series (platform) Plant CountryStart of Prod'n
Next new model
2007 Production 2008 Production 2009
Production 2010 Production 2011 Production 2012 Production
Production Outlook 2013
Production Outlook 2014
Production Outlook 2015
Production Outlook 2016
Production Outlook 2017
Production Outlook 2018
Volkswagen Seat Ibiza PQ24 Martorell, Barcelona SP Pre 02 2008 172,209 91,114 14,827 0 0 0 0 0 0 0 0 0Volkswagen Seat Ibiza PQ25 Martorell, Barcelona SP H2 08 2014 0 101,356 158,890 188,083 190,000 162,250 150,000 130,000 165,000 180,000 178,000 173,000Volkswagen Seat Cordoba PQ24 Martorell, Barcelona SP Pre 02 2008 29,747 20,351 4,868 0 0 0 0 0 0 0 0 0Volkswagen Seat Toledo PQ35 Martorell, Barcelona SP Q1 05 4,744 5,407 571 0 0 0 0 0 0 0 0 0Volkswagen Seat Leon PQ35 Martorell, Barcelona SP Q3 05 2012 120,630 96,761 66,373 79,462 81,000 5,000 0 0 0 0 0 0Volkswagen Seat New Leon PQ36 Martorell, Barcelona Sp Q1 12 2019 0 0 0 0 0 66,250 117,500 135,000 145,000 140,000 135,000 124,500Volkswagen Seat Altea PQ35 Martorell, Barcelona SP Q1 04 71,365 54,542 32,792 43,351 42,000 26,250 23,000 20,000 18,750 15,000 12,000 5,000Volkswagen Seat Exeo PQ46 Martorell, Barcelona SP 2009+ 0 21 9,012 23,108 20,000 11,000 4,750 0 0 0 0 0Volkswagen Audi Q3 A5 Martorell, Barcelona SP H2 09 0 0 0 108 19,654 106,250 105,000 103,000 99,000 95,000 90,000 103,000Volkswagen Seat SUV based on Q3 Q3 Martorell, Barcelona SP H1 15 0 0 0 0 0 0 0 0 20,000 29,000 26,000 21,000Volkswagen Seat New Alhambra PQ46 Setubal PT H2 09 2017 0 0 0 7,050 18,140 19,393 17,250 15,500 13,500 11,500 14,000 19,500Volkswagen Seat Alhambra PL44 Setubal PT 14,242 10,282 6,215 3,000 0 0 0 0 0 0 0 0Volkswagen Seat Total 412,937 379,834 293,548 344,162 370,794 396,393 417,500 403,500 461,250 470,500 455,000 446,000

EUROPEAN CAR AND LCV PRODUCTION OUTLOOK REPORT November 2013| Page 77
Skoda Production Outlook to 2018
Group Marque Model range Series (platform) Plant CountryStart of Prod'n
Next new model
2007 Production 2008 Production 2009
Production 2010 Production 2011 Production 2012 Production
Production Outlook 2013
Production Outlook 2014
Production Outlook 2015
Production Outlook 2016
Production Outlook 2017
Production Outlook 2018
Volkswagen Skoda Fabia PQ24 Mlada Boleslav & Vrchabli CZ 93,998 0 0 0 0 0 0 0 0 0 0 0Volkswagen Skoda Fabia PQ25 Mlada Boleslav & Vrchabli CZ H2 05 2013 153,246 244,269 247,980 181,123 195,000 175,000 165,000 153,500 189,000 209,000 198,000 191,000Volkswagen Skoda Rapid/Seat Toledo PQ25 (AO+) Mlada Boleslav CZ H2 12 2012 0 0 0 0 0 11,500 89,000 96,500 89,000 82,500 80,000 75,000Volkswagen Skoda Octavia SK351 (A5) Mlada Boleslav & Vrchabli CZ H2 04 new model 277,181 275,545 187,696 218,621 185,000 0 0 0 0 0 0 0Volkswagen Skoda Octavia SK351 (A5) Bratislava SK H1 08 0 18,393 18,666 10,000 0 0 0 0 0 0 0 0Volkswagen Skoda Octavia SK361 (A6) Mlada Boleslav & Vrchabli CZ H2 11 0 0 0 0 20,000 225,000 233,000 219,000 198,500 182,000 171,000 166,000Volkswagen Skoda Superb SK451 Kvasiny CZ 2008 21,326 9,000 0 0 0 0 0 0 0 0 0 0Volkswagen Skoda Superb SK461 Kvasiny CZ H1 08 2015 0 18,257 24,872 65,964 69,000 61,000 56,500 52,000 62,000 63,000 60,500 55,000Volkswagen Skoda Yeti SK2XX Kvasiny CZ H1 09 2016 0 0 19,670 52,552 76,000 87,500 81,000 76,000 65,000 75,000 84,000 82,500Volkswagen Skoda Roomster SK2XX Kvasiny, switching to VrchabCZ H1 06 2013/14 69,637 43,247 39,664 27,729 35,000 26,250 24,500 39,000 48,000 45,000 42,500 39,000Volkswagen Skoda Polar SUV MQB TBC CZ H2 15 0 0 0 0 0 0 0 0 12,000 55,000 52,000 50,000Volkswagen Skoda Praktik SK2XX Kvasiny CZ H2 06 6,238 6,288 2,641 2,746 3,000 2,900 2,800 3,000 4,500 4,750 5,000 3,750Volkswagen Skoda Total 621,626 614,999 541,189 558,735 583,000 589,150 651,800 639,000 668,000 716,250 693,000 662,250
Porsche Production Outlook to 2018
Group Marque Model range Series (platform) Plant CountryStart of Prod'n
Next new model
2007 Production 2008 Production 2009
Production 2010 Production 2011 Production 2012 Production
Production Outlook 2013
Production Outlook 2014
Production Outlook 2015
Production Outlook 2016
Production Outlook 2017
Production Outlook 2018
Volkswagen Porsche Boxster 987 Uusikaupunki (Valmet) FIN Q2 05 2012 10,392 8,056 4,172 1,444 0 0 0 0 0 0 0 0Volkswagen Porsche Boxster 987 Stuttgart DE 2012 0 0 3,462 5,657 6,250 0 0 0 0 0 0 0Volkswagen Porsche Boxster 988 Stuttgart and Karmann Osna DE H2 11 2011 0 0 0 0 0 11,000 15,750 14,500 12,750 11,250 9,250 8,750Volkswagen Porsche Cayman 987 Uusikaupunki (Valmet) FIN H2 06 2012 12,634 8,089 6,242 4,941 2,015 0 0 0 0 0 0 0Volkswagen Porsche Cayman 987 Zuffenhausen, Stuttgart DE H2 06 2012 0 0 0 0 3,900 1,000 0 d 0 0 0 0Volkswagen Porsche Cayman 988 Karmann Osnabruck DE H2 11 2011 0 0 0 0 500 13,250 11,500 9,500 8,000 7,250 6,500Volkswagen Porsche 911 997 Zuffenhausen, Stuttgart DE Q1 05 2011 38,840 32,344 22,110 19,834 15,250 7,000 2,500 0 0 0 0 0Volkswagen Porsche 911 991 Zuffenhausen, Stuttgart DE Q1 11 0 0 0 0 6,000 20,250 27,250 28,000 25,500 22,750 19,750 21,000Volkswagen Porsche Panamera 997 Leipzig DE Q3 07 0 0 10,465 24,060 28,500 24,000 21,000 19,250 17,000 20,000 29,000 28,500Volkswagen Porsche Panamera coupe (928) 997 Leipzig DE H2 11 2011 0 0 0 0 3,250 3,500 2,750 2,250 2,000 3,500 3,750 3,000Volkswagen Porsche 961 New Zuffenhausen, Stuttgart DE H2 13 2013 0 0 0 0 0 0 0 100 1,000 900 800 750Volkswagen Porsche 918 Spyder 991 Zuffenhausen, Stuttgart DE H2 12 2012 0 0 0 0 0 0 168 400 350 0 0 0Volkswagen Porsche Macan Q5 Leipzig DE H2 10 0 0 0 0 0 0 750 43,000 56,000 63,000 61,000 58,000Volkswagen Porsche Cayenne T5 Leipzig DE Q4 02 2017‐18 45,304 48,232 29,186 39,593 62,000 79,250 80,750 77,500 74,000 69,000 73,000 78,000Volkswagen Porsche Total 107,170 96,721 75,637 95,529 127,165 146,500 164,168 196,500 198,100 198,400 203,800 204,500
Lamborghini and Bentley Production Outlook to 2018
Group Marque Model range Series (platform) Plant CountryStart of Prod'n
Next new model
2007 Production 2008 Production 2009
Production 2010 Production 2011 Production 2012 Production
Production Outlook 2013
Production Outlook 2014
Production Outlook 2015
Production Outlook 2016
Production Outlook 2017
Production Outlook 2018
Volkswagen Lamborghini ALL, inc SUV from 2016 Sant' Agata IT 2,580 2,424 1,253 1,227 1,738 2,197 2,500 2,800 3,750 5,000 5,500 6,000Volkswagen Lamborghini Total 2,580 2,424 1,253 1,227 1,738 2,197 2,500 2,800 3,750 5,000 5,500 6,000Volkswagen Bentley Arnage/Azure/Brooklands/ Mulsanne Crewe UK Pre 02 728 755 233 320 1,145 1,169 1,075 1,100 1,050 1,000 900 800Volkswagen Bentley New SUV Crewe UK 2015 0 0 0 0 0 0 0 0 2,000 3,000 4,000 3,750Volkswagen Bentley Gran Coupe MSB Crewe Uk 2018 0 0 0 0 0 0 0 0 0 0 0 2,500Volkswagen Bentley Continental GT/Supersports Crewe UK H2 03 2012 2,148 2,702 1,291 1,481 3,240 3,442 3,550 3,400 3,200 3,100 3,000 3,100Volkswagen Bentley Continental GT/Supersports cabrio Crewe UK H2 06 2014 4,849 2,410 719 1,080 793 2,739 2,100 2,300 2,400 2,500 2,400 2,200Volkswagen Bentley Continental Flying Spur Crewe UK H1 05 2013 2,275 1,825 1,353 1,911 2,350 1,758 2,550 2,400 2,300 2,250 2,025 1,950Volkswagen Bentley Total 10,000 7,692 3,596 4,792 7,528 9,108 9,275 9,200 10,950 11,850 12,325 14,300

EUROPEAN CAR AND LCV PRODUCTION OUTLOOK REPORT November 2013| Page 78
Volvo Corporate Developments
Developments at Volvo focus on deepening co-operation with Geely and new model plans associated with the new platforms, SPA for the larger models (S60 and above) and the new CMA platform for smaller models. In addition, production has now started at the first of two all-new Volvo plants in China, with the S60L going into production at the beginning in November. Earlier in the year, there were reports of clashes between Volvo and Geely executives over the direction of the Volvo brand: Geely apparently wanted to move Volvo upmarket into the luxury segment, something which Volvo management has resisted. Geely reportedly wants a Volvo to compete vs. the BMW 7-series, but Volvo executives do not think the brand can be stretched that far. At the heart of the new Volvo strategy are two new platforms, the Scalable Platform Architecture (SPA) and the Compact Module Architecture (CMA); these are integral to Volvo’s plan to sell 800,000 units a year globally by early 2020s, almost doubling 2013’s target of 425,000 units. SPA will produce vehicles above the S60/V60; CMA will be used for the next V40 and additional new small Volvos. These will appear from 2015. The company should break even in 2013, after its operating profits fell to just 18mn SKr (<$3mn) in 2012; net losses were actually SKr480mn; losses were due to declining sales and high product development costs booked in the last year for the V40 and initial work on the SPA platform.
New Model News 2014 to see acceleration of new model launches, all from the new SPA; first will be XC90, followed in 2015 by the replacement for S80 saloon (likely to be called S9), V90 estate (replacing V70) and a 2+2 coupe which is expected now to be called C60. These will all feature Volvo’s new four-cylinder diesel and petrol engines. New models will be named around the 40, 60 and 90 numbers, ie the 50, 70 and 80 numbers are understood to be dropped once new models come on stream; we have no indication as to which numbering scheme will be used for models smaller than the current V40 series.
Manufacturing News
Production of the C30 and C70 has now ended. Although production at the Uddevalla factory has ended, the company’s two factories in Gothenburg and Ghent will remain and are receiving new investment to make models on the new SPA and CMA platforms. The first example of this investment is the new body shop being built in Gothenburg at the present time for the next XC90.
Alliances None
Other News Now part of Chinese Geely group, Volvo has set up a new joint R&D centre with its parent company in Sweden; to focus on modular architecture which underpins the CMA and SPA platforms. 200 engineers will work in this new R&D centre which is described by Volvo as “a showcase for co-operation between a western world premium car manufacturers and a Chinese automotive company.”
Production European production likely to drop towards slightly in 2014, largely because of the end of XC90 ahead of its replacement and as a
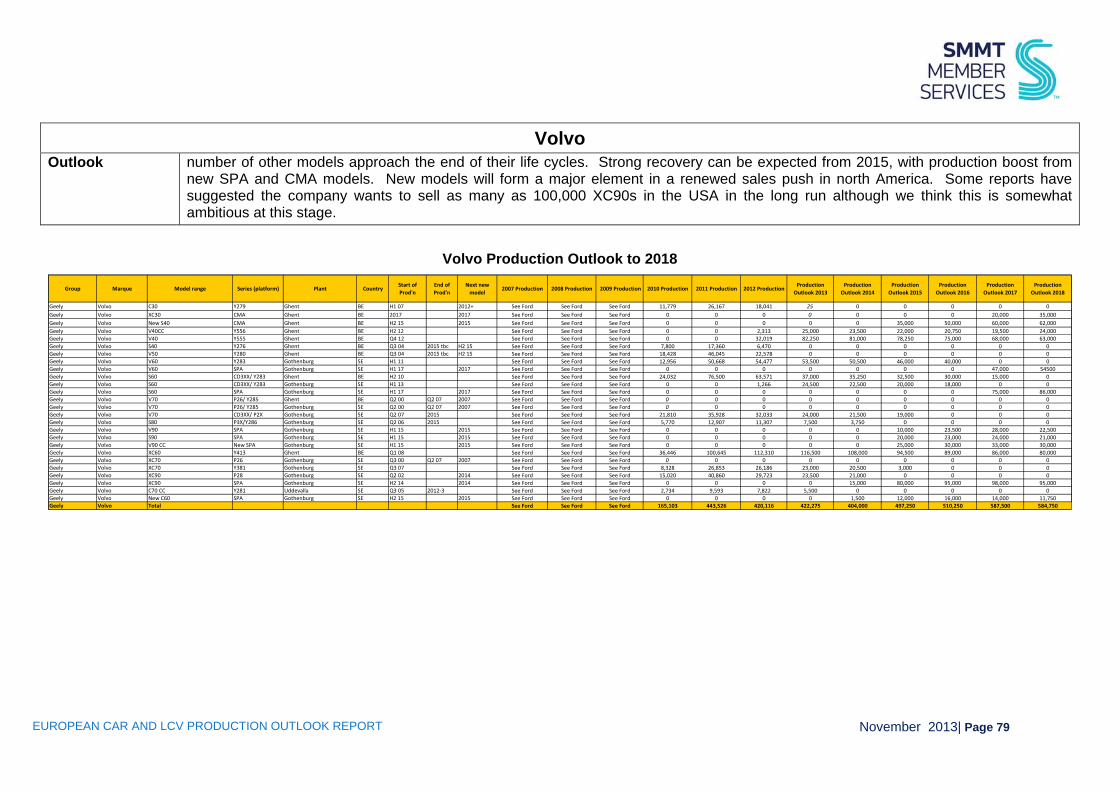
EUROPEAN CAR AND LCV PRODUCTION OUTLOOK REPORT November 2013| Page 79
Volvo Outlook number of other models approach the end of their life cycles. Strong recovery can be expected from 2015, with production boost from
new SPA and CMA models. New models will form a major element in a renewed sales push in north America. Some reports have suggested the company wants to sell as many as 100,000 XC90s in the USA in the long run although we think this is somewhat ambitious at this stage.
Volvo Production Outlook to 2018
Group Marque Model range Series (platform) Plant CountryStart of Prod'n
End of Prod'n
Next new model
2007 Production 2008 Production 2009 Production 2010 Production 2011 Production 2012 ProductionProduction
Outlook 2013Production
Outlook 2014Production
Outlook 2015Production
Outlook 2016Production
Outlook 2017Production
Outlook 2018
Geely Volvo C30 Y279 Ghent BE H1 07 2012+ See Ford See Ford See Ford 11,779 26,167 18,041 25 0 0 0 0 0Geely Volvo XC30 CMA Ghent BE 2017 2017 See Ford See Ford See Ford 0 0 0 0 0 0 0 20,000 35,000Geely Volvo New S40 CMA Ghent BE H2 15 2015 See Ford See Ford See Ford 0 0 0 0 0 35,000 50,000 60,000 62,000Geely Volvo V40CC Y556 Ghent BE H2 12 See Ford See Ford See Ford 0 0 2,313 25,000 23,500 22,000 20,750 19,500 24,000Geely Volvo V40 Y555 Ghent BE Q4 12 See Ford See Ford See Ford 0 0 32,019 82,250 81,000 78,250 75,000 68,000 63,000Geely Volvo S40 Y276 Ghent BE Q3 04 2015 tbc H2 15 See Ford See Ford See Ford 7,800 17,360 6,470 0 0 0 0 0 0Geely Volvo V50 Y280 Ghent BE Q3 04 2015 tbc H2 15 See Ford See Ford See Ford 18,428 46,045 22,578 0 0 0 0 0 0Geely Volvo V60 Y283 Gothenburg SE H1 11 See Ford See Ford See Ford 12,956 50,668 54,477 53,500 50,500 46,000 40,000 0 0Geely Volvo V60 SPA Gothenburg SE H1 17 2017 See Ford See Ford See Ford 0 0 0 0 0 0 0 47,000 54500Geely Volvo S60 CD3XX/ Y283 Ghent BE H2 10 See Ford See Ford See Ford 24,032 76,500 63,571 37,000 35,250 32,500 30,000 15,000 0Geely Volvo S60 CD3XX/ Y283 Gothenburg SE H1 13 See Ford See Ford See Ford 0 0 1,266 24,500 22,500 20,000 18,000 0 0Geely Volvo S60 SPA Gothenburg SE H1 17 2017 See Ford See Ford See Ford 0 0 0 0 0 0 0 75,000 86,000Geely Volvo V70 P26/ Y285 Ghent BE Q2 00 Q2 07 2007 See Ford See Ford See Ford 0 0 0 0 0 0 0 0 0Geely Volvo V70 P26/ Y285 Gothenburg SE Q2 00 Q2 07 2007 See Ford See Ford See Ford 0 0 0 0 0 0 0 0 0Geely Volvo V70 CD3XX/ P2X Gothenburg SE Q2 07 2015 See Ford See Ford See Ford 21,810 35,928 32,033 24,000 21,500 19,000 0 0 0Geely Volvo S80 P3X/Y286 Gothenburg SE Q2 06 2015 See Ford See Ford See Ford 5,770 12,907 11,307 7,500 3,750 0 0 0 0Geely Volvo V90 SPA Gothenburg SE H1 15 2015 See Ford See Ford See Ford 0 0 0 0 0 10,000 23,500 28,000 22,500Geely Volvo S90 SPA Gothenburg SE H1 15 2015 See Ford See Ford See Ford 0 0 0 0 0 20,000 23,000 24,000 21,000Geely Volvo V90 CC New SPA Gothenburg SE H1 15 2015 See Ford See Ford See Ford 0 0 0 0 0 25,000 30,000 33,000 30,000Geely Volvo XC60 Y413 Ghent BE Q1 08 See Ford See Ford See Ford 36,446 100,645 112,310 116,500 108,000 94,500 89,000 86,000 80,000Geely Volvo XC70 P26 Gothenburg SE Q3 00 Q2 07 2007 See Ford See Ford See Ford 0 0 0 0 0 0 0 0 0Geely Volvo XC70 Y381 Gothenburg SE Q3 07 See Ford See Ford See Ford 8,328 26,853 26,186 23,000 20,500 3,000 0 0 0Geely Volvo XC90 P28 Gothenburg SE Q2 02 2014 See Ford See Ford See Ford 15,020 40,860 29,723 23,500 21,000 0 0 0 0Geely Volvo XC90 SPA Gothenburg SE H2 14 2014 See Ford See Ford See Ford 0 0 0 0 15,000 80,000 95,000 98,000 95,000Geely Volvo C70 CC Y281 Uddevalla SE Q3 05 2012‐3 See Ford See Ford See Ford 2,734 9,593 7,822 5,500 0 0 0 0 0Geely Volvo New C60 SPA Gothenburg SE H2 15 2015 See Ford See Ford See Ford 0 0 0 0 1,500 12,000 16,000 14,000 11,750Geely Volvo Total See Ford See Ford See Ford 165,103 443,526 420,116 422,275 404,000 497,250 510,250 587,500 584,750

EUROPEAN CAR AND LCV PRODUCTION OUTLOOK REPORT November 2013| Page 80
Aston Martin Corporate Developments
The main news earlier in the year concerned the plan by Daimler to take 5% in the company, a move which will lead to engine being supplied to Aston Martin by AMG, the high performance division of Mercedes. This move will almost certainly also lead to a platform being supplied by Mercedes for a future Aston Martin vehicle. Having seen Italian’s finance company, Investindustrial take a stake in the company last year, in February there were reports that an additional investor, Beijing Auto of China, had walked away from a potential investment in the company. In May, it was confirmed that the £150mn investment from Investindustrial has been completed; this is supposed to underpin the new model programme which will flow in the next 5-6 years. Additional support from Daimler/Mercedes, through AMG, is however required as the funding requirements for the new model programme are substantially higher than originally thought.
New Model News
See below
Manufacturing News
Production of the Rapide completed the move of Rapide production from Austria to the UK in the middle of 2012, with UK production now expanded to include a new model, the Rapide S. This programme has been supported by a £1.6mn of support through the government’s Regional Growth Fund and involves 20 new jobs, securing a further 70. Production of Cygnet has been well below expectations; we now expect this will end during 2014, with production already running at very low volumes; we understand in fact that production is currently only on a build-to-order basis.
Alliances The idea of a Mercedes platform used to make Lagonda is now close to reality following the announcement of the stake to be taken by Daimler, but timing/confirmation still awaited
Aston Martin Production Outlook to 2018
Group Marque Model range Series (platform) Plant CountryStart of Prod'n
End of Prod'n
Next new model 2007 Production 2008 Production
2009 Production 2010 Production 2011 Production 2012 Production
Production Outlook 2013
Production Outlook 2014
Production Outlook 2015
Production Outlook 2016
Production Outlook 2017
Production Outlook 2018
Aston Martin Aston Martin Vantage VH/AM305 Gaydon UK Q3 05 2014 4,772 3,426 1,153 1,427 1,596 1,528 1,150 1,075 1,025 1,300 1,200 1,050Aston Martin Aston Martin Virage VH Gaydon UK Q2 11 0 0 0 0 763 576 0 0 0 0 0 0Aston Martin Aston Martin DB9/DBS VH Gaydon UK Q1 04 2015 2,436 3,061 1,322 1,276 657 412 800 850 350 0 0 0Aston Martin Aston Martin New DBS VH Gaydon UK H1 15 0 0 0 0 0 0 0 0 450 600 550 435Aston Martin Aston Martin New DB9 New platform Gaydon UK H1 15 0 0 0 0 0 0 0 0 500 900 800 750Aston Martin Aston Martin Lagonda Merc GL? Gaydon UK H1 15 2015 0 0 0 0 0 0 0 0 1,000 1,200 1,100 900Aston Martin Aston Martin Rapide VH/AM803 Graz (Magna) AU 2009‐2010 0 0 0 1,498 853 380 0 0 0 0 0 0Aston Martin Aston Martin Rapide VH/AM803 Newport Pagnell UK from mid 2012 0 0 0 0 0 261 825 750 675 600 550 475Aston Martin Aston Martin Vanquish VH Newport Pagnell UK 2009 165 0 0 0 0 382 925 875 825 750 600 550Aston Martin Aston Martin Cygnet iQ Gaydon UK 2014 0 0 0 0 558 154 100 50 0 0 0 0Aston Martin Aston Martin Total 7,373 6,487 2,475 4,201 4,427 3,693 3,800 3,600 4,825 5,350 4,800 4,160

EUROPEAN CAR AND LCV PRODUCTION OUTLOOK REPORT November 2013| Page 81


