23
European Commission Taxation and Customs Union 2011 edition of the ‘Taxation Trends’ report Marco Fantini Head of Section « Quantitative analysis of taxation « DG TAXUD
| Date post: | 19-Dec-2015 |
| Category: |
Documents |
| View: | 235 times |
| Download: | 1 times |
European Commission
Taxation and Customs Union
2011 edition of the ‘Taxation Trends’ report
Marco Fantini
Head of Section « Quantitative analysis of taxation «
DG TAXUD

2European Commission Taxation and Customs Union
The impact of the crisis on GDP growth

3European Commission Taxation and Customs Union
-2.8%
-1.7%
-1.9%
-2.3%
-3.7%
-4.7%
-5.3%
-8.2%
1.7%
-13.9%
-18%
-14.7%
-6.7%
-4.8%
-4.1%
-4.9%-7.6%
-3.7%
-2.6%
-5%-7.1%
-4.9%
-3.9%
-2.5%
-8.1%
-3.9%
-5.2%
Real GDP Growth Rate, 2009
> 0
-3 ≤ 0
-5 ≤ -3
-10 ≤ -5
≤ -10

4European Commission Taxation and Customs Union
Top 6 and bottom 6 growth rates
1.7%
-1.7% -1.9% -2.3% -2.5% -2.6%
-7.6%-8.1% -8.2%
-13.9%
-18.0%
-14.7%
-20%
-15%
-10%
-5%
0%
5%
PL CY MT EL PT FR IE SI FI EE LT LV

5European Commission Taxation and Customs Union
The impact of the crisis on public finances

6European Commission Taxation and Customs Union
Change in budget balance (2008-2009)
-8.0
-7.0
-6.0
-5.0
-4.0
-3.0
-2.0
-1.0
0.0
1.0
2.0
MT EE HU IT RO AT CZ DE SE PL LU SI FR BE SK EL LT NL DK LV BG PT UK ES CY IE FI EU-27
EA-17
% p
oint
General government revenue contribution General government expenditure contribution Change in budget balance
Average revenue drop: 0.6% of GDP
Average expenditure increase: 4% of GDP

7European Commission Taxation and Customs Union
Trends in the overall tax ratio 2000-2009, in % of GDP
37.0%
37.2%
36.7%
35.8%
37.0%
36.5%
36.2%
36.7%
36.6%
36.2%36.1%
36.4%
37.4%
37.1%
37.0%
36.6%36.8%
36.9%
37.3%
37.0%
35.0%
36.0%
37.0%
38.0%
2000 2001 2002 2003 2004 2005 2006 2007 2008 2009
EU-27 arithmetic average EA-17 arithmetic average
Drop: 3.8 %

8European Commission Taxation and Customs Union
Excluding social security contributions, the revenue drop looks even stronger
24.0%
24.5%
25.0%
25.5%
26.0%
26.5%
27.0%
2000 2001 2002 2003 2004 2005 2006 2007 2008 2009
EU-27 arithmetic average EA-17 arithmetic average
Drop: 6.8%

9European Commission Taxation and Customs Union
36.0
37.0
38.0
39.0
40.0
41.0
42.0
1995 1996 1997 1998 1999 2000 2001 2002 2003 2004 2005 2006 2007 2008 2009
Cyclically adjusted revenues EU-25 Tax revenue EU-25
Time trend for tax ratio, actual and adjusted for the cycle

10European Commission Taxation and Customs Union
The tax policy reaction

11European Commission Taxation and Customs Union
Budgetary impact of tax measures by type of measure, 2009
Labour raising
Consumption raising
Capital raising
Labour cutting
Consumption cutting
Capital cutting
Revenue-raising measures Tax-cutting measures

12European Commission Taxation and Customs Union
-2.8%
15%
18%
19%
15%
19%
25%
22%
22%
20%
21%
19%
25%
19%
19%
15%21.5%
16%
19.6%
20%19%
20%
20%
20%
20%
19%
25%
2009: Change in VAT rate since 2008
No change
Increase
Decrease
21%

13European Commission Taxation and Customs Union
-2.8%
15%
18%
23%
15%
19%
25%
23%
22%
20%
21%
21%
25%
19%
20%
17.5%21%
18%
19.6%
20%24%
20%
20%
21%
20%
19%
25%
2010: Change in VAT rate since 2008
No change
Increase
Decrease
21%
14European Commission Taxation and Customs Union
-2.8%
15%
18%
23%
15%
19%
25%
23%
23%
20%
22%
21%
25%
20%
20%
20%21%
18%
19.6%
20%24%
20%
20%
23%
20%
19%
25%
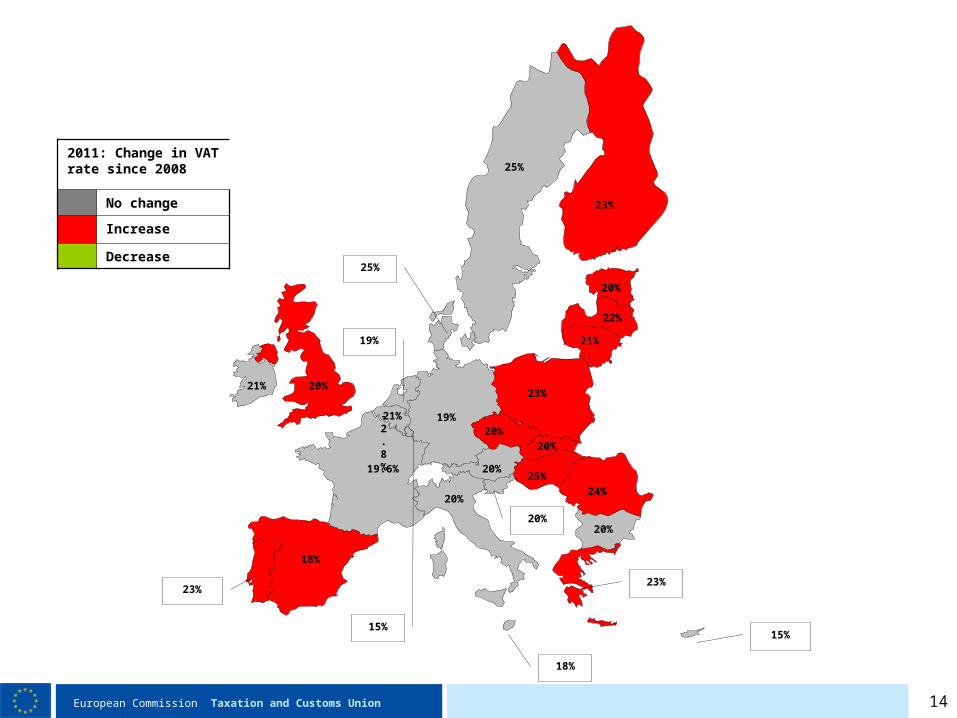
2011: Change in VAT rate since 2008
No change
Increase
Decrease
21%

15European Commission Taxation and Customs Union
VAT standard rates have been hiked strongly as a result of the crisis
19.0%
19.5%
20.0%
20.5%
21.0%
2000 2001 2002 2003 2004 2005 2006 2007 2008 2009 2010 2011
Average standard VAT rate
Revenue data stop here

16European Commission Taxation and Customs Union
Substantial recourse to excise duties to raise revenue
Excise Duties
Energy products Tobacco & alcohol Budgetary impact (% of GDP)
2009
Increase EE, GR, HU, LV, LT (2009-2011), RO, SI, ES
FI, HU, LV, LT (2009-2011), RO, SI, ES
EE: 0.1; GR: 0.13; HU: 0.1; LV: 0.9; LT: 0.7 (2009-2011); SI: 0.71; ES: 0.05 (2009), 0.04 (2010)
Decrease
IT, LT (2009-2011)
2010 -
Increase BG, CZ, DK, EE, GR, HU, LV, SI
BG, CY, CZ, DK, EE, FI, GR, HU, LV, PL, SI
BG: 0.34; DK: 0.4; EE: 0.8 (2010), 0.02 (2011); GR: 1.5; HU: 0.3; LV: 0.09
Decrease
PL, SK PL: -0.07; SK: -0.02

17European Commission Taxation and Customs Union
Crisis has not reversed, but possibly slowed, the steep decline in corporate tax rates
20%
22%
24%
26%
28%
30%
32%
34%
36%
1995 1996 1997 1998 1999 2000 2001 2002 2003 2004 2005 2006 2007 2008 2009 2010 2011
EU-27 average top statutory CIT rates EU-27 EATR - Taxation of the non-financial sector
Development of statutory CIT rate (adj.)

18European Commission Taxation and Customs Union
The average decline in PIT rates has stopped
Note: Including local taxes and surcharges
36%
38%
40%
42%
44%
46%
48%
50%
52%
1995 1996 1997 1998 1999 2000 2001 2002 2003 2004 2005 2006 2007 2008 2009 2010 2011
EU-27 EA-17

19European Commission Taxation and Customs Union
Trend to reduce labour taxes for low-income earners continues
Tax wedge on labour for worker at 2/3 of average earnings
33%
34%
35%
36%
37%
38%
39%
40%
2000 2001 2002 2003 2004 2005 2006 2007 2008 2009
EU-27 EA-17

20European Commission Taxation and Customs Union
Trends in environmental tax revenues,2000-2009, % of GDP
2.3%
2.4%
2.5%
2.6%
2.7%
2.8%
2.9%
2000 2001 2002 2003 2004 2005 2006 2007 2008 2009
EU-27 arithmetic averages EU-27 weighted averages

21European Commission Taxation and Customs Union
Tax revenue per unit of energy used, deflated2000-2009, % of GDP
120
125
130
135
140
145
150
2000 2001 2002 2003 2004 2005 2006 2007 2008 2009
EU-27 arithmetic EA-17 arithmetic

22European Commission Taxation and Customs Union
Summing up
REVENUES
Sharp decline in tax revenues in 2009, due to recession
To fight the recession, Member States relied more on expenditure increases than tax cuts,
… but even at the height of the crisis, a number of Member States were able to introduce tax cuts, and these focussed on labour taxes
Energy tax revenues and ITRs on Energy up in 2009, breaking long trend
RATES
Clear trend towards increases in indirect taxes, right up to present
Corporate tax rates seem to be stabilising
Average top PIT rates pick up in euro area, decline slightly in EU average

23European Commission Taxation and Customs Union
Additional information
The full report and a booklet with the main results are available at the following address:
http://ec.europa.eu/taxtrends
Thank you!


