European Conference on Quality Roma, July 2008 The French New Master Sample 2009 : building fresh annual sampling frames for household surveys based on the new annual Census. Marc CHRISTINE, Sébastien FAIVRE Insee, Statistical Methods Unit
Transcript
European Conference on Quality
Roma, July 2008
The French New Master Sample 2009 : building fresh annual sampling frames for household surveys based on the new annual Census.
Marc CHRISTINE, Sébastien FAIVRE
Insee, Statistical Methods Unit
Page 2
European Conference on Quality in Official Statistics - Roma, 8 – 11 July 2008
This presentation is based on a collective work with contributions of :
Vincent LOONIS, Edouard MAUGENDRE, Bruno BERLEMONT, Emmanuel GROS, Fabien GUGGEMOS (Insee).
Page 3
European Conference on Quality in Official Statistics - Roma, 8 – 11 July 2008
O C T O P U S S E
Organisation
Coordonnée
de Tirages
Optimisés
Pour une Utilisation
StatiStique
des Echantillons.
Coordinated Household Sampling System.
Page 4
European Conference on Quality in Official Statistics - Roma, 8 – 11 July 2008
CONTENTS :
I. Introduction : framework of the new Census. II. New orientations for future samples.III. Building PUs of Master Sample (IAA).IV. Consequences of the New Master Sample 2009 for
interviewers.V. Allocation and drawing of IAA.VI. Drawing of dwellings within IAA.VII. Drawing IAA : quality, calibration and weighting.VIII. Conclusion and future work.
Page 5
European Conference on Quality in Official Statistics - Roma, 8 – 11 July 2008
I. Introduction : framework of the new Census.
Since the 60’s, Insee organizes sample drawing systems based on the Census of population and dwellings and updated with « new » dwellings (identified from building permit records).
Since January 2004 : a new methodology of rotating Censuses, very different from the past :
Small municipalities (less than 10 000 inhabitants) : building 5 random samples of municipalities (« rotation groups »), with equal probabilities whole Census each year of all municipalities belonging to one of the rotation groups.
Big municipalities (over 10 000 inhabitants) : Building in each of them 5 samples of addresses (« rotation groups ») from a file updated each year (RIL, register of located blocks).
Drawing each year a sample of dwellings (clusters of addresses) ; the average sample rate is about 40 % of all dwellings belonging to the current rotation group.
Census of this sample of dwellings.
Page 6
European Conference on Quality in Official Statistics - Roma, 8 – 11 July 2008
The main new characteristics of Census :
• each year
• but only on a part of the territory.
Page 7
European Conference on Quality in Official Statistics - Roma, 8 – 11 July 2008
Example : the case of Brittany – The municipalities according to the 5 rotation groups (rural
space)– White = urban space.
Page 8
European Conference on Quality in Official Statistics - Roma, 8 – 11 July 2008
II. New orientations for future samples.
The New Census has led to a new definition of the INSEE sampling system.
A new project has started in 2003 and will end in 2009 (first sample
drawn in the New French Master Sample 2009 in May 2009).
Page 9
European Conference on Quality in Official Statistics - Roma, 8 – 11 July 2008
II.1 Persistence in some methodological choices or in organization.
• Face to face interview are still used in most of the Face to face interview are still used in most of the surveys carried out by INSEE.surveys carried out by INSEE.
=> A Master Sample system is still useful • … with fixed IAA (Interviewer Action Area) (built in 2007)• … and a sample of which being drawn and validated in June 2008,
building the Master Sample IAA.
• The dwellings of main INSEE survey samples will be drawn in the Master Sample IAA.
=> This ensures a geographical concentration of the surveyed dwellings in order to reduce survey costs.
Page 10
European Conference on Quality in Official Statistics - Roma, 8 – 11 July 2008
II.2 Changes and innovation.
To take profit from the « freshness » brought by the new Census :
Using as a frame of a given year n + 1 all the dwellings covered by the Census at year n.
The yearly sampling frame covers only a part of the territory.
=> Advantages :
‐ To limit the wastes due to the changes in buildings (demolition, main homes becoming secondary homes and V.V….), which create unwished costs.
‐ To draw in a more efficient way samples on particular sub-populations (whose recent characteristics are known).
‐ To get rid of a specific system to cover new dwellings.
‐ To ensure that dwellings surveyed one given year will not be surveyed again before 5 years (except particular cases).
Page 11
European Conference on Quality in Official Statistics - Roma, 8 – 11 July 2008
III. Building PUs of Master Sample (IAA).
Issue : how to conciliate the principle of drawing « rotating » samples from the most recent Census and building fixed Primary Units (IAA = Interviewers Action Area).
III. 1 Constraints and objectives.
Build Primary Units within each region, in order to create a division of the territory :
– … composed with municipalities belonging to the 5 rotation groups …– … with a minimum number of dwellings (300) in each of them.
Page 12
European Conference on Quality in Official Statistics - Roma, 8 – 11 July 2008
III.2 The actual building.
A) Big municipalities.
– Each of them constitutes one single PU (the 5 rotation groups of addresses remain in it).
B) Small municipalities.
The aim is to build an optimal partition from the territory :
Under constraints of minimum size (number of dwellings in each group) and with respect to regional boundaries.
With IAA being as less extended as possible.
=> For that purpose, considering the great number of constraints and the complexity of the problem, a specific algorithm has been implemented.
Page 13
European Conference on Quality in Official Statistics - Roma, 8 – 11 July 2008
Theoretical scheme.
1
1
5
5
43
2
11
5
4
2
3
Survey carried outduring year n, using
municipalitiesbelonging to group 1
Survey carried outduring year n+1, using
municipalitiesbelonging to group 2
Page 14
European Conference on Quality in Official Statistics - Roma, 8 – 11 July 2008
Algorithm to build PUs with small municipalities.
• In each region, it begins with the largest municipality (number of main dwellings) among the small ones : it is tried to build a PU around this municipality.
• Building of the PU around the largest municipality not yet allocated (that will be the « center » or « pivot » of the PU).
• A PU is achieved if, among municipalities of the same region (not yet allocated), whose distance to the pivot is less than a given threshold, it is possible to find enough municipalities in order to reach 300 main dwellings in each rotation group. If not, the PU is not constituted.
• At each step, the biggest municipality not yet allocated to one PU is tested as a possible pivot.
• At the end, all remaining communities are allocated to the closest PU.
Page 15
European Conference on Quality in Official Statistics - Roma, 8 – 11 July 2008
Ste Gauburge PUMunicipalities surveyed 2009-2013
Echauffour
Sainte-Gauburge
Saint-Aquilin-de-Corbion
5.1 Km
8.1 Km
Municipalities surveyed in 2009 Municipalities surveyed in 2010
Sainte-Gauburge
Foy
5.5 Km
Municipalities surveyed in 2011
Saint-Martin-des-Pezerits
9.1 Km
Les Genettes
11.1 Km
Auguaise
Brethel
Sainte-Hilaire-sur-Risle
Sainte-Gauburge7.3 Km
7.2 Km
4.9 Km
Municipalities surveyed in 2012
Courtomer
Planches
Mahéru
Sainte-Gauburge
11.4 Km
4.6 Km
5.7 Km
Bonnefoi
Ferrières La VerrerieMoulins La Marche
Le ménil Bérard
7.9 Km
6.4 Km
4.7 Km
9 Km
Municipalities surveyed in 2013
Page 16
European Conference on Quality in Official Statistics - Roma, 8 – 11 July 2008
STE GAUBURGE
Page 17
European Conference on Quality in Official Statistics - Roma, 8 – 11 July 2008
III.3 Results of building PUs (ZAE).
• 2893 IAA small municipalities.
• 892 IAA big municipalities
• Paris, Lyon and Marseille divided in several « arrondissements ».
• TOTAL = 3785 ZAE.
• The algorithm for building IAA is deterministic but the initial assignment of municipalities to different rotation groups is random.
=> ZAE are « random objects ».
Page 18
European Conference on Quality in Official Statistics - Roma, 8 – 11 July 2008
Heterogeneous IAA considering the size : IAA Z17434
Page 19
European Conference on Quality in Official Statistics - Roma, 8 – 11 July 2008
Built Primary Units in Brittany.
European Conference on Quality
Roma, July 2008
Page 21
European Conference on Quality in Official Statistics - Roma, 8 – 11 July 2008
IAA of la Tour du Pin near the French Alpes
vague 1 2 3 4 5
Page 22
European Conference on Quality in Official Statistics - Roma, 8 – 11 July 2008
IAA of Plounérin in Northern Brittany
vague 1 2 3 4 5
Page 23
European Conference on Quality in Official Statistics - Roma, 8 – 11 July 2008
Situation of the IAA of Plounerin (blue) and Callac
Page 24
European Conference on Quality in Official Statistics - Roma, 8 – 11 July 2008
IV. Consequences of the New Master Sample 2009 for interviewers.
Necessary to study the impact of the new PU on interviewers’ trajects.
Interviewers’ trajects in the New French Master Sample 2009 have to be compared with their trajects in the Master Sample 1999.
Page 25
European Conference on Quality in Official Statistics - Roma, 8 – 11 July 2008
IV.1 Methodology of the study
A try to estimate the extent of the new PU in relation with interviewers’ trajects.
Example of the IAA of Surgères (near the French Atlantic Coast).
Page 26
European Conference on Quality in Official Statistics - Roma, 8 – 11 July 2008
a. Definition of a PU’s extent.
Extent : average distance covered by the interviewer to reach a selected dwelling.
Hypothesis : the interviewer lives in the center of the PU (convention : only trajects between two different municipalities are
taken into account, trajects within the same municipality being set to 0).
Center of the PU :- Center (pivot) of the IAA for New Master Sample 2009 (NMS
2009)- Biggest municipality of the PU for the Master Sample 1999 (MS
1999).
Page 27
European Conference on Quality in Official Statistics - Roma, 8 – 11 July 2008
Municipalities belonging to the IAA of Surgères.
Commune Rotation
Groupe
Number of dwellings
(census of 1999)
Surgères (Center) 1 2 569
St-Germain-de-Marencennes 2 387
St-Georges-des-Bois 3 575
St-Mard 4 342
Chambon 5 268
Vouhé 5 149
Page 28
European Conference on Quality in Official Statistics - Roma, 8 – 11 July 2008
IAA Z17434
Page 29
European Conference on Quality in Official Statistics - Roma, 8 – 11 July 2008
b. Extent of a PU in the Master Sample 1999.
In the Master Sample 1999 :
- All municipalites being covered by Census
- Equal sample of dwellings within the primary units whatever the year the survey is drawn.
=> Average traject of an interviewer is calculated as the average distance of a PU’s dwelling to the center municipality (weighted by the part of PU’s dwellings located in the municipality).
Page 30
European Conference on Quality in Official Statistics - Roma, 8 – 11 July 2008
Extent of the IAA of Surgères in the Master Sample 1999.
Municipality Distance by road to Surgères
Part of the PU’s dwellings
Surgères 0 km 60%
St-Germain 4,1 km 9%
St-Georges 4,6 km 13%
St-Mard 5,2 km 8%
Chambon 9,9 km 6%
Vouhe 6,2 km 3%
Page 31
European Conference on Quality in Official Statistics - Roma, 8 – 11 July 2008
c. Extent of a IAA in the New Master Sample 2009.
Each year, the interviewer has to go to the municipalities belonging to the last rotation group covered by Census.
Hypothesis : same number of interviews carried out each year.
Within municipalities belonging to the same rotation group, selection of dwellings with equal probability sampling.
Page 32
European Conference on Quality in Official Statistics - Roma, 8 – 11 July 2008
Number of interviews carried out in the IAA of Surgères over a five years cycle.
Groupe Municipality Number of dwellings
Proportion of interviews
1 Surgères 2 569 20%
2 St-Germain 387 20%
3 St-Georges- 575 20%
4 St-Mard 342 20%
5
Chambon 268
20%Vouhé 149
Page 33
European Conference on Quality in Official Statistics - Roma, 8 – 11 July 2008
Conclusion: comparison of the number of interviews carried out in the IAA of Surgères in the two Master Samples.
Municipalities GR Proportion of interviews in the MS 1999
Proportion of interviews in
the NMS 2009
Distance to the center
Surgères 1 60% 20% 0 km
St-Germain 2 9% 20% 4,1 km
St-Georges 3 13% 20% 4,6 km
St-Mard 4 8% 20% 5,2 km
Chambon 5 6% 13% 9,9 km
Vouhé 5 3% 7% 6,2 km
Page 34
European Conference on Quality in Official Statistics - Roma, 8 – 11 July 2008
Extent of the IAA in the New Master Sample 2009.
IAA of Surgères:
extent of 4,5 km for the new Master Sample 2009 2,3 km for the Master Sample 1999.
Importance of the center municipality : 60% of interviews carried in Surgères in the MS 1999 (distance zero) and only 20% in the NMS 2009.
Page 35
European Conference on Quality in Official Statistics - Roma, 8 – 11 July 2008
IV.2 Generalisation of this study to the Primary Units built for both systems.
Field of comparison :
- 2 893 IAA of NMS 2009 composed with small municipalities
(11,4 millions of dwellings)
- 3 202 PUs of MS 1999 composed with municipalities in rural areas or small urban areas
(12,3 millions of dwellings).
Page 36
European Conference on Quality in Official Statistics - Roma, 8 – 11 July 2008
Global results of the comparison of extent of PUs between MS 1999 and NMS 2009.
Threshold 10 km 15 km 20 km 30 km Total
IAA
NMS 2009
1 633 2 533 2 814 2 884 2 893
56% 88% 97% 99,6% 100%
PU
MS 1999
2 268 2 914 3 116 3 180 3 202
71% 91% 97% 99,3% 100%
Page 37
European Conference on Quality in Official Statistics - Roma, 8 – 11 July 2008
Global results of the comparison of the extent of the IAA of NMS 2009 and the PUs
of MS 1999. On the field of comparison, the extent of the IAA NMS 2009 is 2
km higher than the spread of the PUs MS 1999.
An increasing extent is mainly seen on Primary Units with a very low extent.
Two main reasons :
– No IAA made of one municipality (as it happened for MS 1999)
– Fewer interviews carried out in the municipality center.
Page 38
European Conference on Quality in Official Statistics - Roma, 8 – 11 July 2008
V. Allocation and drawing IAA.
V. 1 Computation of allocation.
Basic hypotheses :
– IAA are drawn proportionnally to their sizes (number of main dwellings)
– Some of them are systematically kept (« take-all strata »).
Chosen parameters :
• For a common sample size with sampling rate TAU = 1/ 2000 (a little less than 12.000 main dwellings)….
• Average allocation : e = 20 sampled units for each IAA (except take–all stratum) : 1 IAA = 1 interviewer.
Page 39
European Conference on Quality in Official Statistics - Roma, 8 – 11 July 2008
Results :
Threshold of take-all stratum : 40.000 main dwellings.
37 big municipalities assigned to several interviewers. 488 drawn IAA, among which :
European Conference on Quality in Official Statistics - Roma, 8 – 11 July 2008
V. 2. Drawing IAAs.
• Stratified according to the regions (particular case : « Ile de France » – Paris region - splitted in two « crowns »).
• Balanced on regional totals :
It is necessary to balance not only on the level of whole IAA but also for each rotation group… … in order to benefit each year from a « representative » sampling frame.
It increases the number of balancing constraints and reduces the number of allowed independant variables.
Page 41
European Conference on Quality in Official Statistics - Roma, 8 – 11 July 2008
Moreover…
• The yearly sampling frame is balanced on the total of
municipalities belonging to the considered rotation group….
• … but not on the total of whole France (in practice, rotation groups are not equivalent).
It may be a source of bias for estimation (use of yearly « incomplete » sampling frame).
Page 42
European Conference on Quality in Official Statistics - Roma, 8 – 11 July 2008
Used balancing variables.
• Number of main dwellings of municipalities belonging to the IAA, for each of the five rotation groups.
• Total income (from tax sources) of municipalities belonging to the IAA, for each of the five rotation groups.
• Total number of dwellings in the whole IAA in peri-urban areas, rural areas and urban areas.
• Additional balancing variables in « Ile de France » (Paris region) : age, type of household, individual house / collective block, council flat, owner / tenant, number of immigrated peoples…).
Page 43
European Conference on Quality in Official Statistics - Roma, 8 – 11 July 2008
Provence IAA – 1st sample
Page 44
European Conference on Quality in Official Statistics - Roma, 8 – 11 July 2008
Provence IAA – 2nd sample
Page 45
European Conference on Quality in Official Statistics - Roma, 8 – 11 July 2008
VI. Drawing of dwellings within IAA.
Within each drawn IAA, secondary units (dwellings) are drawn with simple random sample, in the given yearly rotation group.
Particular difficulty in big municipalities :
– 1st phase of Census : addresses have not been completely randomly assigned to rotation groups
=> It is difficult to compute the actual likelihood.
– 2nd phase RP : new and big addresses are over sampled in the selection of addresses to be covered by Census (take-all strata within each rotation group).
=> Necessity of resampling dwellings in the sampling frame to have a frame of dwellings with equal weights.
Page 46
European Conference on Quality in Official Statistics - Roma, 8 – 11 July 2008
General scheme of different phases of sampling of dwellings :
Small Municipalities Big Municipalities
Sampling 5 rotation groups of municipalities (each small municipality being randomly assigned to a rotation group)
Sampling 5 rotation groups of addresses in each municipality.
First phase of sampling for Census Sampling each year addresses
creating clusters of dwellings within one rotation group (average rate = 8% of dwellings of the municipality)
Great and new addresses builld a take-all stratum
Geographical stratification (region)
Building PUs aggregating municipalities, conditionnally to the result of the first phase.
Building Primary Units (IAA) Each big municipality builds a
single PU.
Thresholds used to define the take-all strata (biggest cities)
1er degree : drawing PUs in each stratum (fixed for 5 or 10 years). Calibration of drawn PUs on different known totals.
Yearly sample frame = intersection of drawn PUs and dwellings belonging to the random Rotation Group of the year
Resampling of dwellings belonging to great addresses, in order to ensure equal probabilities for any dwelling belonging to the sample frame
Second phase : sampling of dwellings.
2nd degree : drawing dwellings in each PU (for each survey)
Page 47
European Conference on Quality in Official Statistics - Roma, 8 – 11 July 2008
VII. Drawing IAA : quality, calibration and weighting.
One looks at the quality of the sample of IAA, comparing :
– the estimate (from the sample of IAA) of totals of different
auxiliary variables (the values of which are supposed known on whole IAA)
– with the true total in France (known through Census 1999 or other comprehensive data, such as tax sources).
Page 48
European Conference on Quality in Official Statistics - Roma, 8 – 11 July 2008
It shows relative gaps : – more or less important – variable from one rotation group to the other, – whatever the type of estimator,– especially for breakdown according to :
‐ the type of space (rural / urban)‐ activity sector for employed people
(variables not taken into account as balancing conditions at the time of drawing IAA).
=> It may creates problems, particularly for yearly surveys, measuring evolutions.
Page 49
European Conference on Quality in Official Statistics - Roma, 8 – 11 July 2008
Relative error of yearly sampling frames on the variable « number of main dwellings in rural space ».
Groupe de rotation Erreur relative
(estimateur en expansion)
GR 1 +3,4%
GR 2 -3,3%
GR 3 -7,9%
GR 4 -8,1%
GR 5 -9,4%
Page 50
European Conference on Quality in Official Statistics - Roma, 8 – 11 July 2008
One solution to face this problem : calibration of IAA.
)()(:5...,,1 , ZTZTtsk
tkk
Theoretical background for calibration.
Ensure each year a calibration in order to obtain a yearly « representative » sampling frame.
)(,ZTtk = total of the calibration variable Z on municipalities belonging to rotation group t in IAA k. )(ZT = true total of variable Z in whole population.
k = new weight of IAA k after calibration process
Page 51
European Conference on Quality in Official Statistics - Roma, 8 – 11 July 2008
The initial weights are given by the choice of estimators :
• « expanded » :
• ratio :
Calibration is implemented at the national level and for each rotation group separately
=> several sets of calibrated weights.
sk k
tkte
TT
,
, 5ˆ
sk k
tk
tk
ktc
T
N
NT
,
,,
ˆ
kIAAintgrouprotationinerestofiableaoftotalT
kIAAofselectionofyprobabilit
kIAAintgrouprotationindwellingsofnumberN
kIAAindwellingsofnumberN
tk
k
tk
k
intvar,
,
Page 52
European Conference on Quality in Official Statistics - Roma, 8 – 11 July 2008
Used calibration variables :
- the same as used as balancing variables
- number of employed people, according to the sector of activity
- number of dwellings according to the size of urban units (built-up areas).
Page 53
European Conference on Quality in Official Statistics - Roma, 8 – 11 July 2008
Results of calibration in terms of relative errors.
• Relative error equals zero for all calibration variables…
• … and does not increase for other variables of interest.
Page 54
European Conference on Quality in Official Statistics - Roma, 8 – 11 July 2008
Example : impact of calibration on the variable « number of registered people at the National Employment Agency (ANPE) » at the end of the month.
European Conference on Quality in Official Statistics - Roma, 8 – 11 July 2008
Consequences of calibration process.
New weights of IAA (computed each year for the different rotation groups) are used to settle the number of dwellings to be drawn in each IAA.
Theoretically, calibration allows to increase allocations of dwellings in under-represented areas and V.V..
Actually, there are minimum / maximum numbers of secondary units to draw in each IAA (constraints of working conditions for the interviewers).
Page 56
European Conference on Quality in Official Statistics - Roma, 8 – 11 July 2008
Different impacts to be analysed :
On the number of dwellings to be drawn in each IAA and the structure of final samples.
On the distribution of weights.
On the statistical quality of estimators.
Page 57
European Conference on Quality in Official Statistics - Roma, 8 – 11 July 2008
Conclusion about calibrating IAA
An innovating methodology of calibrating at the level of Primary Units.
Empirical validation of the method on the basis of drawn IAA sample.
It allows to solve the problem of choosing among two types of estimators (« expanded » or « ratio »).
It will allow to incorporate fresh information by using calibrating variables derived from the new Census, available after 2009 (until now, use of 1999 Census for building, drawing and calibrating IAA).
Page 58
European Conference on Quality in Official Statistics - Roma, 8 – 11 July 2008
VIII. Conclusion and future work.
Using yearly Census allows substantial profit concerning the quality of the sampling frame (in particular : selection of sub-populations whose recent characteristics are well known).
But important complication of sampling process.
Some issues to be solved :
– Impact of the choice of estimators on allocations and estimations.– Implementation of a calibration procedure for big municipalities.– Possible change in status of municipalities (small becoming big and
v.v.) after 2011.– Computation of variance…
Page 59
European Conference on Quality in Official Statistics - Roma, 8 – 11 July 2008
European Conference on Quality in Official Statistics - Roma, 8 – 11 July 2008
ANNEXES sur le calage
Page 61
European Conference on Quality in Official Statistics - Roma, 8 – 11 July 2008
Impact du calage sur les poids des ZAE
› Les travaux menés sur la base de l’EM provisoire montrent que le calage des ZAE n’accroît pas la dispersion des poids pour l’estimateur en expansion.
› Les résultats sont très similaires dans les cinq bases de sondage annuelles.
Page 62
European Conference on Quality in Official Statistics - Roma, 8 – 11 July 2008
Fonction de répartition des poids des logements pour un tirage dans le groupe 1
Page 63
European Conference on Quality in Official Statistics - Roma, 8 – 11 July 2008
Impact du calage sur la pondération des logements (exemple du groupe 1)
Page 64
European Conference on Quality in Official Statistics - Roma, 8 – 11 July 2008
Page 65
European Conference on Quality in Official Statistics - Roma, 8 – 11 July 2008
Page 66
European Conference on Quality in Official Statistics - Roma, 8 – 11 July 2008
Page 67
European Conference on Quality in Official Statistics - Roma, 8 – 11 July 2008
Page 68
European Conference on Quality in Official Statistics - Roma, 8 – 11 July 2008
ANNEXES
Page 69
European Conference on Quality in Official Statistics - Roma, 8 – 11 July 2008
Répartition des ZAE par type d’espace(urbain, périurbain et rural)
ZAEGC ZAEPC Total
urbain 808 43 851 periurbain 29 356 385 ZAE sur un type d'espace ZAUER
rural 13 445 458 urbain/periurbain 0 609 609 periurbain/rural 0 1119 1119 ZAE sur deux types d'espace ZAUER
urbain/rural 0 18 18 ZAE sur les trois types d'espace 0 303 303 Total 850 2893 3743
Page 70
European Conference on Quality in Official Statistics - Roma, 8 – 11 July 2008
European Conference on Quality in Official Statistics - Roma, 8 – 11 July 2008
Impact du tirage des groupes de rotation sur la constitution des ZAE
› Exemple: cas des communes de Paray-le-Monial et Vitry en Charollais
› Paray-le-Monial:plus grande petite commune de la région Bourgogne (4111 résidences principales)
› => testée en premier en tant que commune pivot dans l’algorithme
› ZAE constituée avec 9209 résidences principales
Page 76
European Conference on Quality in Official Statistics - Roma, 8 – 11 July 2008
ZAE de Paray-le-Monial (Z71342)
vague 1 2 3 4 5
Page 77
European Conference on Quality in Official Statistics - Roma, 8 – 11 July 2008
ZAE de Paray-le-Monial et commune de Vitry-en-Charollais
Page 78
European Conference on Quality in Official Statistics - Roma, 8 – 11 July 2008
Impact du tirage des groupes de rotation sur les ZAE
› Vitry-en-Charollais (349 résidences principales): petite commune la plus proche de Paray-le-Monial
› Appartient comme Paray-le-Monial au groupe 2, donc ne fait pas partie de la même ZAE
› Aurait fait partie de la ZAE de Paray-le-Monial si elle avait été dans un autre groupe de rotation (donc d’une ZAE contenant au moins 5360 résidences principales)
› Appartient à une ZAE de taille plus réduite (1770 résidences principales), donc ayant une probabilité de tirage plus faible
Page 79
European Conference on Quality in Official Statistics - Roma, 8 – 11 July 2008
Page 80
European Conference on Quality in Official Statistics - Roma, 8 – 11 July 2008
Page 81
European Conference on Quality in Official Statistics - Roma, 8 – 11 July 2008
Jugement sur la qualité des tirages.
• Certaines variables souhaitées mais non retenues pour l’équilibrage : classes d’âge, emploi au lieu de résidence par grand secteur d’activité, dispersion géographique (respect du centre de gravité et de l’inertie de la population régionale)…
• MAIS :– On a vérifié ex-post que les tirages de ZAE étaient
admissibles au vu de certaines de ces variables (calcul de biais relatifs).
– variibles not kept as balancing ones can be reintroduced at the time of final calibration.
Page 82
European Conference on Quality in Official Statistics - Roma, 8 – 11 July 2008
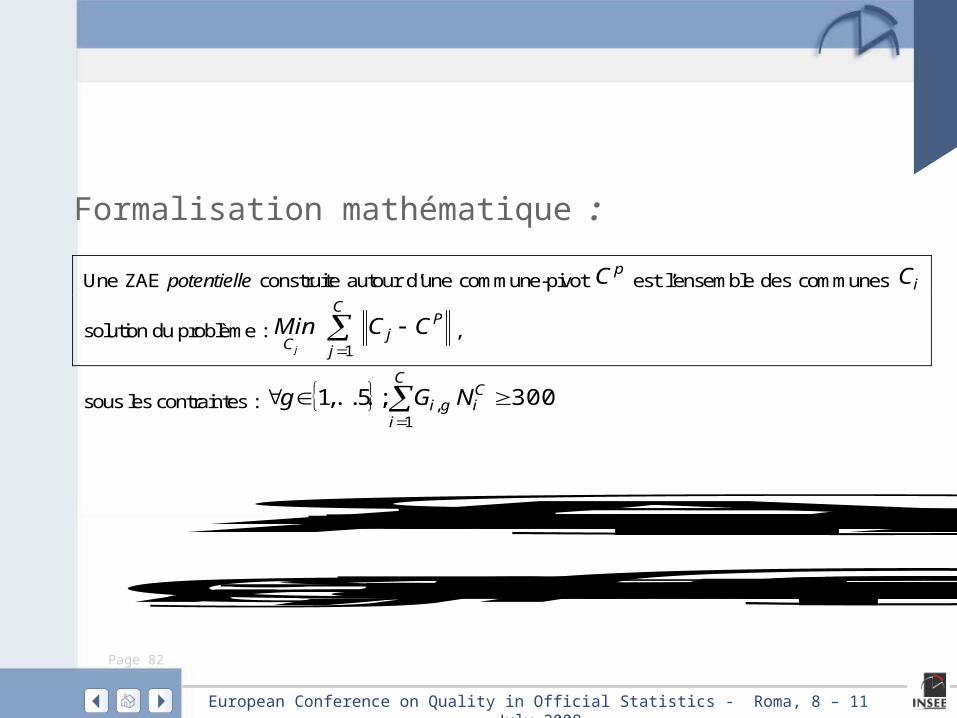
Formalisation mathématique :
CiN = nombre de logements principaux de la commune Ci.
Ggi, = 1 la commune iC est affectée au groupe de rotation g,
Une ZAE potentielle construite autour d’une commune-pivot pC est l’ensemble des communes iC
solution du problème : jC
Min P
j
C
j
CC 1
,
sous les contraintes :
C
i
Cigi NGg
1, 300:5...,,1
Page 83
European Conference on Quality in Official Statistics - Roma, 8 – 11 July 2008