Money, liquidity and welfare $ Yi Wen a,b,n a Research Department, Federal Reserve Bank of St. Louis, P.O. Box 422, St. Louis, MO 63166, United States b School of Economics and Management, Tsinghua University, Beijing, China article info Article history: Received 16 April 2014 Accepted 24 January 2015 Available online 13 February 2015 JEL: D10 D31 D60 E31 E41 E43 E49 E51 Keywords: Liquidity preference Heterogeneous money demand Financial intermediation Velocity Welfare costs of inflation abstract This paper develops an analytically tractable Bewley model of money demand to shed light on some important questions in monetary theory, such as the welfare cost of inflation. It is shown that when money is a vital form of liquidity to meet uncertain consumption needs, the welfare costs of inflation can be extremely large. With log utility and parameter values that best match both the aggregate money demand curve suggested by Lucas (2000) and the variance of household consumption, agents in our model are willing to reduce consumption by 3–4% to avoid 10% annual inflation. The astonishingly large welfare costs of inflation arise because inflation increases consumption risk by eroding the buffer-stock-insurance value of money, thus hindering consumption smooth- ing at the household level. Such an inflation-induced increase in consumption risk at the micro level cannot be captured by representative-agent models or the Bailey triangle. Although the development of financial intermediation can mitigate the problem, with realistic credit limits the welfare loss of moderate inflation still remains several times larger than estimations based on the Bailey triangle. Our findings provide a strong justification for adopting a low inflation target by central banks, especially in developing countries where money is the major form of household financial wealth. Published by Elsevier B.V. 1. Introduction In developing countries, liquid money (cash and checking accounts) is the major form of household financial wealth and a vital tool of self-insurance (precautionary saving) to buffer idiosyncratic shocks because of the lack of a well-developed financial system. Based on recent data in China and India, more than 90% of the household financial wealth is held in the form of cash and checking accounts. 1 Even in developed countries, because of borrowing constraints and costs of participating in the financial markets, money remains one of the most important assets to provide liquidity to smooth consumption for low-income households. Mulligan and Sala-i-Martin (2000) document that the majority of households in the United States do not hold financial assets other than checking accounts. In particular, based on the Survey of Consumer Contents lists available at ScienceDirect journal homepage: www.elsevier.com/locate/eer European Economic Review http://dx.doi.org/10.1016/j.euroecorev.2015.01.012 0014-2921/Published by Elsevier B.V. ☆ This paper is a revised version of Wen (2009). n Correspondence address: Research Department, Federal Reserve Bank of St. Louis, P.O. Box 422, St. Louis, MO 63166, United States. Tel.: þ1 314 444 8559; fax: þ1 314 444 8731. E-mail address: [email protected]1 Townsend (1995) points out that currency and crop inventory are the major forms of liquid assets to provide self-insurance against idiosyncratic shocks for farmers in India and Thailand, and surprisingly, purchases and sales of real capital assets, including livestock and consumer durables, do not play a role in smoothing income fluctuations. European Economic Review 76 (2015) 1–24
Transcript
Contents lists available at ScienceDirect
European Economic Review
European Economic Review 76 (2015) 1–24
http://d0014-29
☆ Thisn Corr
8559; faE-m
1 Towfor farmin smoo
journal homepage: www.elsevier.com/locate/eer
Money, liquidity and welfare$
Yi Wen a,b,n
a Research Department, Federal Reserve Bank of St. Louis, P.O. Box 422, St. Louis, MO 63166, United Statesb School of Economics and Management, Tsinghua University, Beijing, China
a r t i c l e i n f o
Article history:Received 16 April 2014Accepted 24 January 2015Available online 13 February 2015
JEL:D10D31D60E31E41E43E49E51
Keywords:Liquidity preferenceHeterogeneous money demandFinancial intermediationVelocityWelfare costs of inflation
x.doi.org/10.1016/j.euroecorev.2015.01.01221/Published by Elsevier B.V.
paper is a revised version of Wen (2009).espondence address: Research Department,x: þ1 314 444 8731.ail address: [email protected] (1995) points out that currency and crers in India and Thailand, and surprisingly, pthing income fluctuations.
a b s t r a c t
This paper develops an analytically tractable Bewley model of money demand to shedlight on some important questions in monetary theory, such as the welfare cost ofinflation. It is shown that when money is a vital form of liquidity to meet uncertainconsumption needs, the welfare costs of inflation can be extremely large. With log utilityand parameter values that best match both the aggregate money demand curve suggestedby Lucas (2000) and the variance of household consumption, agents in our model arewilling to reduce consumption by 3–4% to avoid 10% annual inflation. The astonishinglylarge welfare costs of inflation arise because inflation increases consumption risk byeroding the buffer-stock-insurance value of money, thus hindering consumption smooth-ing at the household level. Such an inflation-induced increase in consumption risk at themicro level cannot be captured by representative-agent models or the Bailey triangle.Although the development of financial intermediation can mitigate the problem, withrealistic credit limits the welfare loss of moderate inflation still remains several timeslarger than estimations based on the Bailey triangle. Our findings provide a strongjustification for adopting a low inflation target by central banks, especially in developingcountries where money is the major form of household financial wealth.
Published by Elsevier B.V.
1. Introduction
In developing countries, liquid money (cash and checking accounts) is the major form of household financial wealth anda vital tool of self-insurance (precautionary saving) to buffer idiosyncratic shocks because of the lack of a well-developedfinancial system. Based on recent data in China and India, more than 90% of the household financial wealth is held in theform of cash and checking accounts.1 Even in developed countries, because of borrowing constraints and costs ofparticipating in the financial markets, money remains one of the most important assets to provide liquidity to smoothconsumption for low-income households. Mulligan and Sala-i-Martin (2000) document that the majority of households inthe United States do not hold financial assets other than checking accounts. In particular, based on the Survey of Consumer
Federal Reserve Bank of St. Louis, P.O. Box 422, St. Louis, MO 63166, United States. Tel.: þ1 314 444
op inventory are the major forms of liquid assets to provide self-insurance against idiosyncratic shocksurchases and sales of real capital assets, including livestock and consumer durables, do not play a role
Finances (SCF), on average (over the period 1989–2007) nearly 60% of U.S. households do not hold any nonmonetaryfinancial assets (interest-bearing assets), and about 50% of those that hold checking accounts do not hold any interest-bearing assets. In addition, money demand is highly heterogeneous: The Gini coefficient of the distribution of money acrosshouseholds is greater than 0.85 in the United States. This degree of heterogeneity in money demand closely resembles thedistribution of financial wealth instead of consumption (with a Gini coefficient less than 0.3). This suggests that the liquiditymotive of money demand is at least as important (if not more so) as the transaction motive of money demand, even indeveloped countries such as the United States.2
When money is essential (as a store of value) for consumption smoothing and is unequally distributed across households,largely because of idiosyncratic needs for liquidity and the lack of sophisticated risk sharing, inflation can be far more costlythan recognized by the existing literature, which suggests that the welfare cost of inflation is less than 1% of aggregateoutput (see, e.g., Lucas, 2000).3
This paper argues that to properly assess the welfare cost of inflation in developing countries (as well as for low incomepeople in rich countries), it is desirable to use a theoretical model that takes the liquidity function of money and theprecautionary motives of money demand into account, so as to capture the buffer-stock-insurance value of cash in additionto the opportunity cost of forgone interest as suggested by Bailey (1956). The loss of the insurance value of money underinflation may generate far larger welfare costs than implied by the Bailey triangle because inflation reduces real moneydemand and exposes more cash-poor households to idiosyncratic risks by destroying the liquidity value of cash.
This paper constructs such a model by generalizing Bewley's (1980,1983) precautionary money demand model into atractable, dynamic stochastic general equilibrium (DSGE) framework where money can coexist with other assets (such ascapital).4 The key feature distinguishing Bewley's model from the related monetary literature, such as the heterogeneous-agent cash-in-advance (CIA) model of Lucas (1980) and the (S,s) inventory-theoretic model of Baumol (1952) and Tobin(1956), is that money is held solely as a store of value, completely symmetric to any other asset, and is not imposed fromoutside as the means of payments. Agents can choose whether to hold money depending on the costs and benefits. Byfreeing money from its role of medium of exchange, Bewley's approach allows us to focus on the inventory function ofmoney as a pure form of liquidity, so that the welfare implications of the liquidity-preference theory of money demand canbe investigated in isolation. Beyond Bewley (1980, 1983), my generalized model is analytically tractable; hence, it greatlysimplifies the computation of equilibrium in DSGE environments with both idiosyncratic and aggregate shocks, capitalaccumulation, financial intermediation, and nontrivial distributions of cash balances, thus facilitating welfare and business-cycle analysis. Analytical tractability also makes the mechanisms of the model highly transparent.
The major finding of the paper is that persistent money growth is very costly. When the model is calibrated to match notonly the interest elasticity of aggregate money demand but also the extent of idiosyncratic risk faced by households in thedata, the implied welfare cost of increasing the inflation rate from 0% to 10% per year is around 3% to 4% of consumption(or even higher).
Since holding money is both beneficial (providing liquidity) and costly (forgoing interest payment and bearing the inflation tax),agents opt to hold different amounts of cash depending on income levels and consumption needs. As a result, a key property of themodel is an endogenously determined distribution of money holdings across households, with a strictly positive fraction ofhouseholds being cash-constrained (i.e., with zero cash balances) in equilibrium. Hence, lump-sum money injections have animmediate positive impact on consumption for the cash-constrained agents, but not for agents with idle cash balances.Consequently, the aggregate price does not increase with the aggregate money supply one for one, so transitory monetary shocksare expansionary to aggregate output (even without open market operations), the velocity of money is countercyclical, and theaggregate price appears “sticky.”
However, with anticipated inflation, permanent money growth reduces welfare significantly for several reasons: (i)precautionary money demand induces agents to hold excessive amounts of cash to avoid liquidity constraints, raising theinflation tax on the population. (ii) Cash-poor agents suffer disproportionately more from the inflation tax because they aremore likely to be subject to idiosyncratic risks without self-insurance; thus, for the same amount of reduction in real wealth,inflation reduces their expected utility more than it does for liquidity-abundant agents.5 (iii) The size of the liquidity-constrained population (with zero cash balances) rises rapidly with inflation, leading to an increased portion of the
2 Ragot (2009) reports that this stylized fact holds for other developed countries and argues that this is a problem for theories that directly link moneydemand to consumption, such as cash-in-advance (CIA), money-in-the-utility (MIU), or shopping-time models, but is consistent with incomplete-marketmodels in which money is held as a form of financial asset that provides liquidity to smooth consumption.
3 Small welfare costs of inflation are also obtained by many others, such as Cooley and Hansen (1989); Dotsey and Ireland (1996); Henriksen and Kydland(2010), in different models. Lagos and Wright (2005) obtain a significantly higher welfare cost of inflation in a search model of money—about 4% ofaggregate consumption with a 10% inflation rate. Our welfare results are comparable to those obtained by Lagos and Wright (2005) in the order ofmagnitude, but with an entirely different mechanism and micro foundation.
4 General-equilibrium analysis with capital accumulation is important. Cooley and Hansen (1989) emphasize the general-equilibrium effect of inflationon output through substituting leisure for consumption in the face of positive inflation, which causes labor supply and output to decline. However, becausethese authors assume that money is held only for transaction purposes, the welfare cost of inflation is still small despite the general-equilibrium effects ofinflation on output, about 0.4–0.5% of GDP with 10% inflation.
5 This asymmetric effect of inflation is related but different from the distributional effect emphasized by Erosaa and Ventura (2002) in a heterogeneous-agent model where rich households rely more on credit transactions than low-income households.
Y. Wen / European Economic Review 76 (2015) 1–24 3
population unable to smooth consumption against idiosyncratic shocks.6 This last factor can dramatically raise social welfarecosts along the extensive margin.
The Bailey triangle is a poor measure of the welfare cost of inflation because it fails to capture the insurance function ofmoney (as noted and emphasized by Imrohoroglu, 1992). At a higher inflation rate, not only does the opportunity cost ofholding money increase (which is the Bailey triangle), but the crucial benefit of holding money also diminishes. In particular,when demand for money declines, the portion of the liquidity-constrained population rises; consequently, the welfare costof inflation increases sharply due to the loss of self-insurance for an increasingly larger proportion of the population. Thisresult is reminiscent of the analysis by Aiyagari (1994) in which he shows that the welfare cost of the loss of self-insurancein an incomplete-market economy is equivalent to a 14% reduction in consumption even though his calibrated modelmatches only one-third of the income and wealth inequalities in the data.
This paper is also related to the work of Alvarez et al. (2008). Both papers are based on an inventory-theoretic approachwith heterogeneous money demand and can explain the short-run dynamic behavior of velocity and sticky aggregate pricesunder transitory monetary shocks. However, my approach differs from theirs in important aspects. Most notably, theirmodel is based on the Baumol–Tobin inventory-theoretic framework where money is not only a store of value but also ameans of payment (similar to CIA models). In their model, agents are exogenously and periodically segregated from thebanking system and the CIA constraint always binds. For these reasons, the implications for the welfare cost of inflation intheir model may also be very different from those in this paper. For example, Attanasio et al. (2002) estimate the welfarecost of inflation based on a simple Baumol–Tobin model and find the cost to be less than 0.1% of consumption under 10%inflation. The main reason is that this segment of the literature has relied exclusively on Bailey's triangle (or the interestelasticity of money demand) to measure the welfare cost of inflation. Hence, despite having heterogeneous money holdingsacross households, such research is not able to obtain significantly larger estimates of the cost of inflation than those inrepresentative-agent models.
Bewley's (1980) model has been studied in the recent literature, but the main body of this literature focuses on anendowment economy. For example, Imrohoroglu (1992), Imrohoroglu and Prescott (1991), and Akyol (2004) study thewelfare cost of inflation in the Bewley model. To the best of my knowledge, Imrohoroglu (1992) is the first in the literature torecognize that the welfare cost of inflation in a Bewley economy is larger than that suggested by the Bailey triangle.However, like Bewley's (1980) work, this segment of the literature is based mainly on an endowment economy withoutcapital and these models are not analytically tractable.7
The rest of this paper is organized as follows: Section 2 presents the benchmark model on the household side and showshow to solve for individuals' decision rules analytically under borrowing constraints and idiosyncratic risks. It reveals someof the basic properties of a monetary model based on liquidity preference. Section 3 extends the model to a productioneconomy with capital and uses the model to evaluate the welfare cost of inflation. Section 4 introduces credit and bankinginto the general-equilibrium model and discusses some robustness issues of our welfare results. Section 5 concludesthe paper.
2. The benchmark model
The model features money as the only asset that can be adjusted quickly (costlessly) to buffer idiosyncratic shocks toconsumption demand at any moment. Interest-bearing nonmonetary assets (such as capital) can be accumulated to supportconsumption but are not as useful (or liquid) as money in buffering idiosyncratic shocks. This setup captures thecharacteristics of households in developing countries (or poor households in rich countries) for whom money (cash andchecking accounts) is the major form of household financial wealth and a vital tool of self-insurance (precautionary saving)to buffer idiosyncratic shocks.
We make the model analytically tractable by introducing two important features: (i) We allow an endogenous laborsupply with quasi-linear preferences (as in Lagos and Wright, 2005), and (ii) we replace idiosyncratic labor income shockstypically assumed in the incomplete-market literature (e.g., Imrohoroglu, 1989; Jappelli, 1990; Aiyagari, 1994; Huggett, 1993)by preference shocks. Even with quasi-linear preferences, the model is not analytically tractable if wage income is subject toidiosyncratic shocks. There are two ways to overcome this difficulty. One is to place idiosyncratic shocks on preferences (i.e.,to the marginal utility of consumption as in Lucas, 1980), and the other is to place them on total gross wealth, whichincludes labor income. This paper takes the first approach. Both approaches yield similar results for the welfare cost ofinflation when they are calibrated to match some key features of aggregate money demand and the idiosyncratic liquidity
6 In this paper, the term “liquidity-constrained agents” is synonymous to “households with a binding liquidity constraint” or “those with zero cashbalances.”
7 This literature tends to find higher welfare costs of inflation, but the absolute magnitude is still small. For example, Imrohoroglu (1992) shows thewelfare cost of 10% inflation is slightly above 1% of consumption. The reason is that the distribution of liquidity demand in the model does not respondsignificantly to inflation if the support of idiosyncratic shocks is binary or does not have enough points (as typically assumed in this literature to reducenumerical computation burdens). Hence, an extensive margin would be missing and this margin is important for the welfare costs of inflation. Our studyalso complements the analysis of Telyukovay and Visschers (2013), who found in a Lagos–Wright model that the welfare cost of inflation is higher whenagents hold money for insurance purpose in addition to transaction purpose. Specifically, idiosyncratic uncertainty can increase the welfare cost of 10%annual inflation (relative to the Friedman rule) from 0.2% to 0.5% of consumption.
Y. Wen / European Economic Review 76 (2015) 1–244
risk faced by households. This is reassuring because it suggests that the source of uninsurable idiosyncratic shocks does notmatter for our welfare results.8
Time is discrete. There is a unit mass of continuum households in the interval ½0;1�. Each household is subject to anidiosyncratic preference shock, θt, which is iid across both households and time and has the distribution FðθÞ � Pr½zrθ�withsupport θL;θH
� �. A household chooses sequences of consumption ctf g, labor supply ntf g, and nominal money balance mtþ1
� �to maximize lifetime utilities, taking as given the paths of aggregate real wage Wtf g, the aggregate price Ptf g, and thenominal lump-sum transfers τtf g. The nominal rate of return to holding money is zero.9
Assume that in each period t the decisions for labor supply and holdings for interest-bearing assets (if any) must be madebefore observing the idiosyncratic shock θt in that period, and the decisions, once made, cannot be changed for the rest ofthe period (i.e., these markets are closed afterward for households until the beginning of the next period). Thus, if there is anurge to consume during period t after labor supply and capital investment decisions are made and the preference shock θt isrealized, money is the only asset that can be adjusted to smooth consumption. Borrowing of liquidity (money) from othersources is not allowed.10 These assumptions imply that households may find it optimal to carry money as self-insurance tocope with idiosyncratic uncertainty (as in Bewley, 1980), even though money is not required as a medium of exchange.
An alternative way of formulating the above information structure for decision-making is to divide each period into twosubperiods, with labor supply and nonmonetary-asset investment determined in the first subperiod, the rest of the variables(consumption and money balances) determined in the second subperiod, and the idiosyncratic shocks θt realized only in thebeginning of the second subperiod. Yet another alternative specification of the model is to have two islands, with laborsupply and interest-bearing assets (if any) determined on island 1 and ct and mt determined on island 2 simultaneously bytwo spatially separated household members (e.g., a worker and a shopper), but only the shopper—who determinesconsumption and money balances in island 2—can observe θt in period t. Both members can observe aggregate shocks andthe history of family decisions up to period t. At the end of each period the two members reunite and share everythingperfectly (e.g., income, wealth, and information) and separate again in the beginning of the next period.11
2.1. Household problem
We use lower-case letters to denote individual variables and upper-case letters to denote aggregate variables in thispaper. Denote ht as the history of an individual household up to period t, and ht�1 as ht excluding θt, namely, ht ¼ ht� [ θt .Let Ht denote the history of the aggregate state up to period t. Then the problem of a household is to solve
maxct ðht ;Ht Þ;mt þ 1ðht ;Ht Þ;nt ðht� ;Ht Þ
E0X1t ¼ 0
βt θt log ctðht ;HtÞ�antðht� ;HtÞn o
ð1Þ
subject to
ct ht ;Ht� �
þmtþ1ðht ;HtÞPtðHtÞ rmtðht�1;Ht�1Þþτt
PtðHtÞ þWt Ht� nt ht
� ;Ht
� �; ð2Þ
mtþ1ðht ;HtÞZ0, ntðht� ;HtÞA 0;n½ �, and m0Z0 given; where τt is an exogenous, uniform, lump-sum nominal transfer (to bespecified later). To save notation, we drop the history indices ht ;Ht
, and nt ¼ ntðht� ;HttÞ, unless confusion may arise. Without loss of generality, assume a¼1 in the utility
function.12
The household problem can be formulated recursively. Define
xt �mtþτt
PtþWtnt ð3Þ
8 See an earlier version of this paper (Wen, 2010a,b) for analyses based on the alternative approach.9 The zero lower bound on government bonds implies that the nominal return to money is zero. In addition, the nominal interest rate on checking
accounts is essentially zero in many countries. However, since we may consider any perfectly liquid asset, including interest bearing checking accounts, asmoney, we can add a fixed interest rate on money. But doing so does not change our main results. This can be seen by simply redefining the time discountfactor in our model as the product of β and a fixed deposit rate. However, see Section 4 in this paper for the analysis with a time varying and endogenouslydetermined deposit rate.
10 This assumption will be relaxed in Section 4.11 Since the time period in the model can be short (e.g., t represents a month, a week, or a day), the assumption that labor supply and nonmonetary asset
holdings (such as fixed capital) are predetermined and cannot be adjusted instantaneously in the second subperiod after the realization of θt is not asextreme as it appears. This information/timing structure amounts to creating a necessary friction for the existence of money as a liquid asset. In reality,especially in developing countries, it is costly to exchange labor and real assets (such as land and livestock) for consumption goods in spot markets (e.g.,due to search frictions and other transaction costs). In developed countries, even government bonds are rarely held as a major form of liquid assets by low-income households and there are always costs involved in trading nonmonetary assets. As documented by Telyukovay and Visschers (2013) usinghousehold survey data, even credit cards are not as liquid as cash in meeting certain types of consumption demand.
12 The model remains tractable if the utility function takes the more general form of c1� σt �11�σ �nt . For simplicity we set σ ¼ 1 in this paper. Setting σ41 can
only enhance our conclusions.
Y. Wen / European Economic Review 76 (2015) 1–24 5
as the real wealth, and denote Jtðxt ;θtÞ as the value function of the household based on the choice of ct and mtþ1 after therealization of θt. We then have
Jt xt ;θt� ¼ max
ct ;mtþ 1θt log ctþβEtVtþ1
mtþ1
Ptþ1
�� ð4Þ
subject to
ctþmtþ1
Ptrxt ð5Þ
mtþ1Z0; ð6Þwhere Vt
mtPt
� �is the value function of the household based on the choice of nt before observing θt. That is,
Vtmt
Pt
�¼max
nt�ntþ
ZJtðxt ;θtÞ dF
� ð7Þ
subject to (3) and ntA 0;n½ �.Since money is not required as a medium of exchange, nor does it provide utility, a monetary equilibrium is a belief-
driven equilibrium. In what follows, we focus on the monetary equilibrium where money is accepted as a store of value andthe aggregate price PtA 0;1ð Þ is finite and bounded away from zero.
Proposition 1. The decision rules for consumption, money demand, and real wealth are given, respectively, by
ct ¼min 1;θt
θn
t
( )xt ð8Þ
mtþ1
Pt¼max
θn
t �θt
θn
t
;0
( )xt ð9Þ
xt ¼Wtθn
t Rðθn
t Þ; ð10Þwhere the cutoff θn
t is independent of individual history ht and is determined implicitly by the following Euler equation:
1Wt
¼ βEtPt
Ptþ1Wtþ1
� �R θn
t
� �; ð11Þ
where
R θn
t
� ��Z
max 1;θt
θn
t
( )dF41: ð12Þ
Proof. See Appendix A.1.
Consumption is a concave function of real wealth, with the marginal propensity to consume given by min 1; θtθn
t
n o, which
is less than 1 in the case of a low urge to consume (θtoθn
t ). Saving (money demand) is a buffer stock: agents save in thelow-return asset when consumption demand is low (mt þ 1
Pt40 if θtoθn
t ), anticipating that future consumption demand may
be high (Pr θ4θnh i
40).
Eq. (11) implicitly determines the optimal cutoff θnðHtÞ as a function of the aggregate state only. The interpretation ofEq. (11) is straightforward. Treat 1
W as the marginal utility of consumption fromwage income. The left-hand side (LHS) of theequation is the opportunity cost of holding one more unit of real balances as inventories (as opposed to increasingconsumption by one unit). The right-hand side (RHS) is the expected gains by holding money, which take two possiblevalues: The first term inside the integral of Eq. (12) reflects simply the discounted and inflation-adjusted next-period utilityvalue of inventories (real balances) in the case of a low urge to consume (since 1 dollar is just 1 dollar if not consumed),
which has probabilityRθrθn dFðθÞ. The second term is the marginal utility of consumption ( βEt Pt
Pt þ 1Wt þ 1
h iθtθn
t¼ θt
xt) in the case of
a high urge to consume (θ4θn), which has probabilityRθZθn dFðθÞ. The optimal cutoff θn
t (or real wealth xt) is chosen so thatthe marginal cost of holding money equals the expected marginal gains.
Hence, the rate of return to money is the inflation-adjusted real interest rate (β PtPt þ 1
) compounded by a liquidity premium
RðθnÞ. Notice that Rðθn
t Þ41, which implies that the option value of one dollar exceeds 1 because as inventories it providesliquidity in the case of a high consumption demand. This is why money has positive value in equilibrium despite the factthat its real rate of return is negative (β Pt
Pt þ 1o1) or dominated by interest-bearing assets.
The optimal level of total cash reserve (xt) is chosen such that the probability of running out of cash is strictly positive(1�Fðθn
t ÞA 0;1ð Þ) unless the real cost of holding money is zero (i.e., at the Friedman rule). Namely, the optimal cutoff θn
t and
Y. Wen / European Economic Review 76 (2015) 1–246
the real wealth xt are chosen simultaneously (as they are two sides of the same coin) so that 0oPr θ4θn
t
h io1. This
inventory-theoretic formula of money demand is akin to that derived by Wen (2011) in a optimal target inventory modelbased on the stockout-avoidance motive. Also note that aggregate shocks (if they exist) will affect the distribution of moneyholdings across households by affecting the cutoff θnðHtÞ.
Because θn
t is independent of ht, the cutoff provides a sufficient statistic for the distribution of money demand in theeconomy. This property facilitates aggregation and makes the model analytically tractable. Consequently, numerical solutionmethods (such as the method of Krusell and Smith, 1998) are not needed to solve the model's general equilibrium andaggregate dynamics.
By Eq. (10), real wealth is also independent of ht. The intuition for xt being independent of individual history is that (i) itis determined before the realization of θt, and all households face the same distribution of idiosyncratic shocks whenmaking labor supply decisions; and (ii) the quasi-linear preference structure implies that labor supply can be adjustedelastically to meet any target level of real wealth ex ante. Hence, in the beginning of each period agents opt to adjust laborincome so that the target wealth xt (or the probability of a binding liquidity constraint 1�FðθnÞ) maximizes expected utility.As a result, xt is the same across all households regardless of their individual history and initial real balances. This result isreminiscent of the Lagos–Wright (2005) model where the distribution of cash balances is degenerate. However, here thedistribution of cash holdings (mP ) is not degenerate even though x is degenerate.
2.2. Equilibrium analysis
Aggregation: Given the sequences of Wt ; τtf g and the initial distribution of m0, using capital letters to denote aggregatevariables (i.e., Ct �
Rcðht ;HtÞ dF), we can integrate individual decision rules by the law of large numbers. The resulting
system of equations that determines the competitive equilibrium path of Ct ;Mtþ1;Nt ;Xt ;θn
t ; Pt
n o1
t ¼ 0includes
1Wt
¼ βEt1
Wtþ1
Pt
Ptþ1R θn
t
� �ð13Þ
Ct ¼Dðθn
t ÞXt ð14Þ
Mtþ1
Pt¼H θn
t
� �Xt ð15Þ
Xt ¼Wtθn
t Rðθn
t Þ ð16Þ
Nt ¼ 1Wt
Xt�MtþτtPt
�ð17Þ
Mtþ1 ¼Mtþτt ; ð18Þ
where D θn� �
� Rmin 1; θ
θn
n odF, H θn
� �� R
max 0; θn �θt
θn
n odF, and these two functions satisfy DðθnÞþHðθnÞ ¼ 1. Eq. (18) is
the money market clearing equation. These six dynamic equations plus standard transversality conditions uniquely solve for
the equilibrium path of Ct ;Mtþ1;Nt ;Xt ;θn
t ; Pt
n o1
t ¼ 0, given the initial distribution of money demand.13
The quantity theory: The aggregate relationship between consumption (Eq. (14)) and money demand (Eq. (15)) impliesthe “quantity” equation
PtCt ¼Mtþ1Vt ; ð19Þ
where Vt � Dðθn
t ÞHðθn
t Þmeasures the aggregate consumption velocity of money. A high velocity implies a low demand for real
balances relative to consumption. Given the support of θ as θL;θH� �
and the mean of θ as Eθ¼ θ , by the definition for the
functions D and H, it is easy to see that the domain of velocity is θθH �θ
;1h i
, which is bounded below by zero but has no finite
upper bound, in sharp contrast to CIA models where velocity is typically a constant of 1.14 A zero velocity means a liquiditytrap (excessive money hoarding), and an infinite velocity means that either the value of money (1P) is zero or nominal moneydemand (M) is zero. This property explains why the model can generate enough variability in velocity to match the data.
13 The value functions are given by
Vmt
Pt
�¼ V0þ
1Wt
mt
Pt; J xt ;θt
� ¼ J0þβEt Pt
Pt þ 1Wt þ 1
h ixt if θtrθn
t
θt log xt if θt4θn
t
8<: :
Note that under preference shocks and with log utility function, the demand for real balances (mP ) is bounded from above for any positive value of P. So thevalue function V is also bounded. Also, if one is interested only in the dynamics near the steady state, the uniqueness of equilibrium can also be easilyproven (checked) by the eigenvalue method.
14 For the analysis of heterogeneous-agent CIA models where the CIA constraint on a household binds only with positive probability, see Wen (2010b).
Y. Wen / European Economic Review 76 (2015) 1–24 7
Steady-state analysis: Assume that money supply follows a constant growth path with
τt ¼ μMt ; ð20Þwhere μ is the growth rate.15 A steady state is defined as the situation without aggregate uncertainty and with time-invariant distributions of individual variables. Hence, in a steady state all real aggregate variables are constant over time,although the individual variables may be stochastic due to the iid shocks θt. Eq. (13) implies that the steady-state cutoff θn isconstant and determined by the relation
1¼ β1þπ
R θn� �
; ð21Þ
where π � Pt �Pt � 1Pt � 1
denotes the inflation rate. Hence, the cutoff θn is constant for a given level of inflation. The quantityrelation (19) implies Pt
Pt� 1¼ Mt þ 1
Mt¼ 1þμ in the steady state, so the steady-state inflation rate is the same as the growth rate
of money.Since by Eq. (21) the return to liquidity R must increase with π, the cutoff θn must decrease with π (because ∂RðθnÞ
∂θn o0);therefore, ∂θ
n
∂π o0. This means that when inflation rises, the required rate of return to liquidity must also increase accordinglyto induce people to hold money. However, because the cost of holding money increases with π, agents opt to hold lessmoney so that the probability of stockout (1�FðθnÞ) rises, which reinforces a rise in the liquidity premium (i.e., ∂2R
∂θn∂πo0).
Also, since the target wealth is given by xðθnÞ ¼WθnRðθnÞ, we have ∂x∂θn ¼ WF θn
� �40, so the target wealth decreases with π.
Therefore, a higher rate of inflation has two types of effects on welfare: the intensive margin and the extensive margin. Onthe intensive margin, ∂x∂πo0, so higher inflation leads to lower consumption through a negative wealth effect for all agents. Inaddition, liquidity-constrained agents suffer disproportionately more because they (i) do not have self-insurance (mtþ1 ¼ 0)to buffer shocks and (ii) still face the same variance of idiosyncratic shocks (σ2
θ) when having a lower wealth level. Thissecond aspect of the intensive margin is emphasized by Imrohoroglu (1992) and Akyol (2004). On the extensive margin,∂θn
∂π o0; thus, a high inflation rate means that a larger portion of the populationwill become liquidity constrained and subjectto idiosyncratic shocks without the buffer stock. This extensive margin will be shown to be an important force in affectingsocial welfare but it has not been fully appreciated by the existing literature.
Under the Friedman rule, 1þπ ¼ β, we must have R¼1 and θn ¼ θH according to Eq. (12). Consequently, D θn� �
¼ θθH
andH θn� �
¼ 1� θθH. Hence, we have xðHtÞ ¼WθH and
ct ¼min 1;θt
θH
� x¼ θtW : ð22Þ
That is, individual consumption is perfectly adjusted (smoothed) based on preference shocks under the Friedman rule,suggesting perfect self-insurance or the first-best allocation. The probability of being liquidity constrained (running out ofcash) is zero in this case because households opt to hold the maximum amount of money when the cost of doing so is zero:mt þ 1Pt
¼ θH�θt�
W40 for all θ.
However, since θn is bounded below by θL, the liquidity premium is then bounded above by R θL� ¼ θ
θL. This means there
must exist a maximum rate of inflation πmax such that Eq. (21) holds: θθL¼ 1þπmax
β . At this maximum inflation rate,
πmax ¼ βθθL
�1; ð23Þ
we have DðθLÞ ¼ 1 and HðθLÞ ¼ 0. That is, the optimal demand for real balances from all households goes to zero,
m ht ;Ht� �
¼ 0, if πZπmax.16
When the cost of holding money is sufficiently high, agents opt not to use money as the store of value and the velocity
becomes infinity: V ¼ D θLð ÞH θLð Þ ¼1. The velocity is a decreasing function of inflation because money demand drops faster than
consumption as the inflation tax rises: ∂V∂θn
∂θn
∂π 40. This long-run implication is consistent with empirical data. For example,
Chiu (2007) has found using cross-country data that countries with higher average inflation also tend to have significantlyhigher levels of velocity and argued that such an implication cannot be deduced from the Baumol–Tobin model with anexogenously segmented asset market.17
When money is no longer held as a store of value because of sufficiently high inflation (πZπmax), it must be true that
ct ¼min 1; θtθL
n ox¼ x¼ θW , so consumption is constant and completely unresponsive to preference shocks, suggesting the
worst possible allocation with a significantly lower level of welfare than the case with the Friedman rule. Note that theaggregate (average) consumption under hyper-inflation πZπmax is identical to the aggregate (average) consumption under
15 See Wen (2009) for dynamic analysis under monetary shocks.16 Obviously we need to assume that β4θL
θto support a monetary equilibrium even at low inflation rates. If β is too small, there does not exist a high
enough liquidity premium to induce people to hold money. As an example, suppose θ follows the Pareto distribution, F θ� ¼ 1�θ�σ with support 1;1ð Þ,
then θL ¼ 1 and θ ¼1, so the lower bound on β to support a monetary equilibrium is zero.17 Based on a long sample of the U.S. time-series data, Lucas (2000) also shows that the inverse of the velocity is negatively related to inflation.
Y. Wen / European Economic Review 76 (2015) 1–248
the Friedman rule by Eq. (22): C ¼WRθt dF¼ θW . This equivalence of aggregate allocations under drastically different
inflation rates reveals the danger of measuring the welfare cost of inflation (or the welfare cost of the business cycle) basedon representative-agent models. This point is quantified in the next section.
3. Welfare cost of inflation
3.1. Measures of welfare cost
We measure the welfare cost of inflation as the percentage increase (Δ%) in household consumption that would make anyindividual household indifferent in terms of expected lifetime utilities between living in a high-inflation regime (π) and theFriedman-rule inflation regime (πo � β�1). That is, Δ is the compensation required for household consumption as the inflationrate increases above the Friedman rule. By the law of large numbers, the expected momentary utility of an individual i is thesame as the aggregate (or average) utility of the population (with equal weights); namely,
Rθ ið Þlog cðiÞ dFðθÞ� R
n ið ÞdFθ� ¼ R
θ ið Þ log cðiÞdi�N. Thus, our welfare measure also corresponds to a social planner's measure with equal welfare weights.Hence, the welfare cost of inflation Δ solves
X1t ¼ 0
βtZ
θ log 1þΔ�
c πð Þ� �dF�N πð Þ
� ¼X1t ¼ 0
βtZθ log c πo�
dF�N πo� � : ð24Þ
By the household consumption policy, c¼min 1; θθn
n ox, and the property that x¼X is independent of individual history, the
above equation implies
Δ¼ exp1
θN πð Þ�N πo� þθ log
X πoð �X πð Þ þ Jθ πo� � Jθ πð Þ
� �� �1; ð25Þ
where Jθ πð Þ � Rθrθn πð Þ θ log θθn πð Þ
� �dF captures the effect of idiosyncratic risk (or the heterogeneity of consumption) on social
welfare.A perfect decomposition of the welfare cost into the intensive and extensive margins is difficult because they are both
endogenous and mutually reinforce each other. But one way to show that the high welfare cost of inflation found in ourmodel comes mainly from the loss of the buffer-stock value of money for the increased cash-poor population to self-insureagainst idiosyncratic risks is to compare Eq. (25) with an alternative (pseudo) measure (Δ�) based on the lifetime utility ofthe average consumption (C) of a household across different states (i.e., log C ¼ log D θn
� �X). This pseudo measure solves
X1t ¼ 0
βtZ
θ log 1þΔ�� C πð Þ� �
dF�N πð Þ�
¼X1t ¼ 0
βtZθ log C πo�
dF�N πo� � ; ð26Þ
which implies
Δ� ¼ exp1
θN πð Þ�N πo� �þθ log
C πoð ÞC πð Þ
� �� �1: ð27Þ
Clearly, the utility of the average consumption C, as opposed to the average utility of individual consumption c θt�
,captures mainly the impact of inflation on welfare along the intensive margin because only the average fall in consumption(under inflation) across all households is reflected in the pseudo measure Δ�. So by design the individual consumption risk(or the welfare loss of the uninsured fraction of the population without buffer stock in bad states) is omitted (averaged out)by this alternative metric Δ�.
Note that Δ� also pertains to the welfare measure in a representative-agent model. So the pseudo welfare measure canalso shed light on the low welfare cost of inflation found in representative-agent models.
As discussed previously, when the inflation rate is either sufficiently high with πZπmax or sufficiently low withπ ¼ πo ¼ β�1, we have identical aggregate allocations between the hyper-inflation regime (where people no longer holdmoney) and the Friedman-rule inflation regime (where people hold infinite real money balances), with N πmaxð Þ ¼N πoð Þ andC πmaxð Þ ¼ C πoð Þ. Consequently, the welfare cost of rising the inflation rate from πo to πmax is zero under the incorrectmeasure Δ�, whereas the correctly measured welfare cost of inflation (that properly takes into account of the risk along
the extensive margin) is given by Δ¼ exp 1θJθ πoð Þ� Jθ πmaxð Þ� �n o
�1, which is strictly positive because J πmaxð Þ ¼ RθrθL
θ log θθL
� �dF¼ 0 and J πoð Þ ¼ RθrθH
θ log θθH
� �dF40. This difference is striking. It suggests just how wrong representative-
agent models can be when it comes to welfare implications.
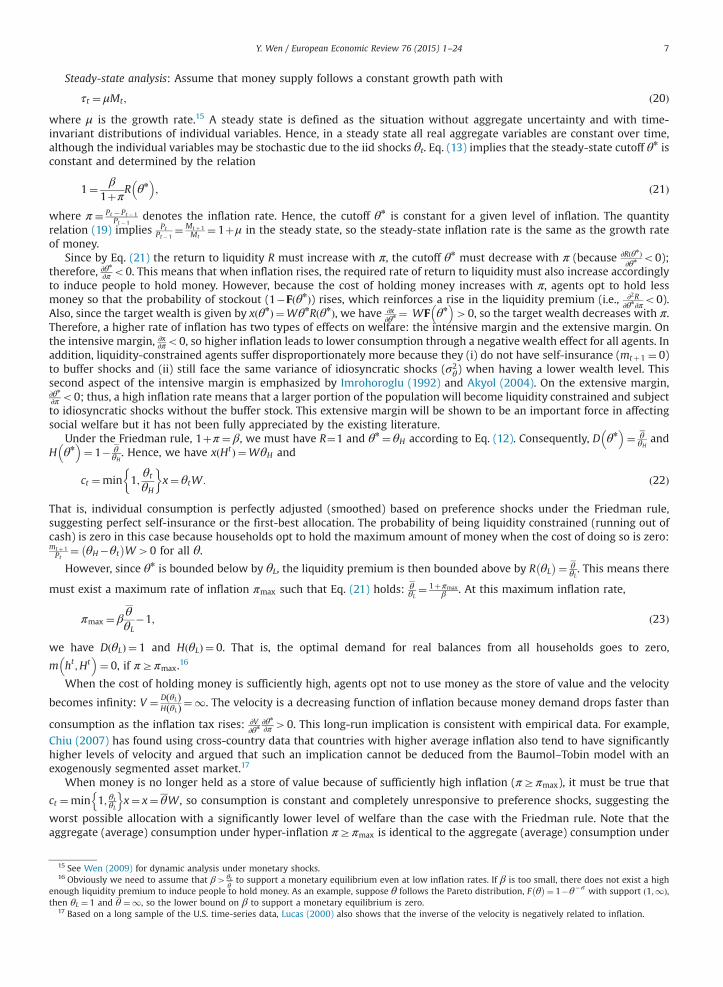
Fig. 1. Welfare costs, money demand, and velocity. (For interpretation of the references to color in this figure, the reader is referred to the web version ofthis paper.)
Y. Wen / European Economic Review 76 (2015) 1–24 9
3.2. Calibrations and predictions
The time period t is a year.18 We set the time discount factor β¼ 0:95. To facilitate calibration, we assume that theidiosyncratic shock θ follows the Pareto distribution:
FðθÞ ¼ 1�θ�σ; ð28Þ
with σ41 and the support ½1;1Þ. As a benchmark, we set the shape parameter σ ¼ 2:65 to roughly match the household
consumption risk (variance) in the U.S. data (see Section 3.2.2). The mean of this distribution is θ ¼ σσ�1. Since θ is not
bounded from above, at the Friedman rule money demand goes to infinity. In the following analysis, we assume thatπo ¼ β�1þε, where the positive number ε is arbitrarily close to 0 but not exactly equal to 0.19 We refer to this inflation rate
πo as the “Friedman rule”. With the Pareto distribution function, we have R θn� �
¼ 1þ 1σ�1θ
n�σ , H θn� �
¼ R θn� �
� σσ�1
1θn, and
D θn� �
¼ 1�H θn� �
. The cutoff θn πð Þ can then be solved explicitly using the relation R θn� �
¼ 1þπβ .
3.2.1. A special case without capitalNotice that we have not explicitly modeled firm behavior so far. But to illustrate the power of our framework, assume for
simplicity a representative firm with a linear production technology, Y¼N. The competitive real wage is then a constantW¼1. So the steady-state aggregate allocations are given by
C ¼ θnRðθnÞDðθnÞ; X ¼ θnRðθnÞ; N¼ θnRðθnÞDðθnÞ; ð29Þwhere the cutoff is determined by the inflation rate, R θn
� �¼ 1þπ
β . Thus, inflation affects aggregate allocations only throughaffecting the cutoff (distribution) θn.
18 We choose t to be a year because the aggregate money demand data used by Lucas (2000) are available only at the annual frequency.19 More specifically, we set ε¼ 10�6.
Y. Wen / European Economic Review 76 (2015) 1–2410
The welfare costs of inflation are graphed in the top panels in Fig. 1 (solid red lines). The top-left panel (solid red line)shows the correct measure of welfare cost (Δ). It is monotonically increasing with inflation. Hence, the Friedman rule isclearly optimal. The maximum welfare cost is reached at the maximum inflation rate πmax ¼ 52:576%, in which caseΔ� 14% of consumption. Beyond this inflation rate money is no longer valued (held) by households, so the welfare cost ofinflation remains constant at about 14% for πZπmax. When the inflation rate π ¼ 10% (i.e., π increases from 0% to 10% ), thewelfare cost is 3.94% of annual consumption, a big number. The cost would be 8.9% of consumption if measured relative tothe Friedman rule because of the highly concave feature of the welfare cost function Δ πð Þ.
In contrast, the top-right panel of Fig. 1 (solid red line) shows the pseudo measure of welfare cost (Δ�) based on the averageconsumption of a household (or a representative agent). This measure captures only the intensive margin and is not monotonic; itequals 0 at two extreme points—the point of the Friedman rule and the point where π ¼ πmax. In the first case, individualconsumption level (ct ¼ θtW) is the first-best—because it is costless to hold money, so agents are perfectly insured againstidiosyncratic risk. The average consumption in this case is θW . In the latter case, individuals' consumption levels becomehomogeneous across households at a constant level (ct ¼ θW) when money is no longer held as a store of value and agents becomecompletely uninsured. Without money, inflation no longer has any adverse liquidity effects on consumption, so Δ� remains at zerofor πZπmax. This is in sharp contrast to CIA models where agents are forced to hold money regardless of the inflation rate. Themaximum cost of inflation by the pseudo measure is Δ� ¼ 0:065% of consumption at π ¼ 2:88% (relative to the Friedman rule), atrivially small number. Under a 10% inflation rate, the incorrectly measured welfare cost is even smaller. This sharp contrast betweenΔ and Δ� reveals that the bulk of the welfare costs (more than 95%) comes from the extensive margin due to the inflation-inducedloss of self-insurance for the cash-poor households.
3.2.2. General equilibrium with capitalThis subsection introduces capital accumulation into our benchmark model. This extension serves at least three purposes: (i) to
facilitate calibrations, as any serious calibration requires a general-equilibrium model with capital in the production and aggregateinvestment in the aggregate resource constraint; (ii) to facilitate comparisons with the existing general-equilibrium literature onwelfare analysis; and (iii) to investigate the sensitivity of welfare costs to capital accumulation.
Firms: A representative firm produces final output according to the production technology, Yt ¼ AKαt N
1�αt . The firm rents
capital and hires labor from households. Perfect competition implies that factor prices equal their marginal products:Wt ¼ 1�αð ÞYt
Ntand rtþδ¼ αYt
Kt.
Households: Households accumulate illiquid capital asset through saving (st) and rent the capital stock to firms in acompetitive rental market with the rental rate denoted by rt. The illiquidity of the capital asset is captured by theassumption that saving decisions for fixed capital (stþ1) in period t must be made in tandem with the decision of laborsupply (nt) in the first subperiod (i.e., before the idiosyncratic preference shocks are realized). The household budgetconstraint becomes
ctþmtþ1
Ptþstþ1r 1þrtð Þstþ
mtþτtPt
þWtnt ; ð30Þ
where stþ1 ¼ stþ1ðht� ;H
tÞ in accordance with the notations in Eq. (1). Compared with the previous benchmark model, thereis now one more first-order condition for stþ1 on the household side:20
1Wt
¼ βEt1þrtþ1
Wtþ1; ð31Þ
which in the steady state becomes
1¼ β 1þrð Þ: ð32Þ
Compared with Eq. (21), it must be true that 1þrð Þ 1þπð Þ ¼ R θn� �
under the no-arbitrage condition, suggesting that the
nominal rate of return to the illiquid capital asset must equal (and be dictated by) the liquidity premium of money R. Inaddition, the model has the interesting property that household saving stþ1 can be made independent of the idiosyncraticpreference shock and individual history.21
General equilibrium: Define net real wealth as xt � mt þτtPt
þWtntþ 1þrtð Þst�stþ1. The household decision rules ofconsumption, real money balances, and net wealth are identical in functional form to Eqs. (8)–(12) except that the labor
supply changes to nt ¼ 1Wt
xt�mt þ τtPt
þstþ1
h� 1þrtð Þst �. That is, adding capital into the benchmark model does not change its
basic properties, such as the fact that xt ;θn
t
n oare independent of individual history ht. In general equilibrium, the aggregate
20 See Appendix A.2.21 To see this, simply introduce an arbitrary quadratic adjustment cost term ζs2tþ1 (ζZ0) into the household budget constraint, then Eq. (31) becomes
ζst þ 1 þ1ð ÞWt
¼ βEt1þ rt þ 1Wt þ 1
, which implies that household saving decisions depend only on the aggregate variables. This property holds true in the limit ζ-0. Thisin turn implies that household labor supply nt is the only margin that fully adjusts to meet the target wealth xt each period given the initial amount of cashin hand mt .
Note: α denotes capital share, β time discount factor, δ capital depreciation, σ shape parameter in Paretodistribution, A the scaling factor in Eq. (34), and σ2logcthe variance of log household consumption.
Y. Wen / European Economic Review 76 (2015) 1–24 11
supply of capital equals the aggregate demand of capital,Rstþ1 ht� ;H
t� �
dF¼ Ktþ1, and the aggregate supply of labor equals
the aggregate demand of labor,Rnt ht� ;H
t� �
dF¼Nt .Using upper-case letters to denote aggregate quantities, a general equilibrium is defined as the sequence
Ct ;Yt ;Nt ;Ktþ1;Mtþ1; Pt ;Wt ; rt ;θn
t
n o1
t ¼ 0, such that given prices Pt ;Wt ; rt ;f g and monetary policies, (i) all households
maximize utilities subject to their resource and borrowing constraints (and initial capital and money holdings), (ii) firmsmaximize profits, (iii) all markets clear, (iv) the law of large numbers holds, and (v) the set of standard transversalityconditions is satisfied.22 Because the steady state is unique and the system is saddle stable, the distribution of moneydemand converges to a unique time-invariant distribution in the long run for any initial distributions of capital s0 andmoney holdings m0.
Steady-state allocations: Proposition 2 in Appendix A.2 presents the full set of equations needed to solve for the dynamicpath of the general equilibrium. In the steady state, the capital-to-output and consumption-to-output ratios are given byKY ¼ βα
1�βð1�δÞ andCY ¼ 1� δβα
1�βð1�δÞ, respectively, which are the same as in standard RBC models without money. Since rþδ¼ αYK
and w¼ 1�αð ÞYN, the factor prices are given by r¼ 1β�1 and W ¼ 1�αð Þ βα
1�βð1�δÞ
� �α=ð1�αÞ, respectively. Hence, the existence
of money in this model does not alter the steady-state aggregate saving rate, the great ratios, and the real factor prices in theneoclassical growth model, in contrast to typical CIA models. However, the levels of aggregate income, consumption,employment, and capital stock are affected by money growth. These levels are given by
C ¼WθnR θn� �
D θn� �
; Y ¼ 1�βð1�δÞ1�βð1�δÞ�δβα
C; K ¼ βα1�βð1�δÞY ; N¼ 1�α
WY ; ð33Þ
where the cutoff is determined solely by the inflation rate as in the benchmark model without capital, R θn� �
¼ 1þπβ .
Calibration of key parameters: The remaining free parameters include σ in the Pareto distribution function and A in thequantity relationship:
MPY
¼ AHðθnÞDðθnÞ
; ð34Þ
where P denotes the aggregate price level, Y the aggregate output, M the aggregate money supply, PYM is the empirical
measure of the income velocity of money, and AHðθnÞDðθnÞ is the theoretical counterpart of income velocity implied by our model
(where the scale parameter A is a function of the consumption-to-income ratio). Since (i) the definition of money in theempirical data varies greatly (such as M1, M2, and M3), and (ii) the definition of the consumption-to-output ratio changesdepending on whether capital investment, government spending, net exports, and durable goods consumption are includedin GDP, the measured velocity of money also varies accordingly. Hence, we introduce the scaling parameter A to reflect thesevariations in the measurement bias in the mean of velocity when calibrating our model to match the data.
These two free parameters σ;Af g are calibrated by three independent methods, called Method 1, Method 2, and Method 3.Method 1 is our benchmark and the other two serve as robustness checks because Method 1 does not target the idiosyncratic riskfacing consumers. Nonetheless, all three methods imply a consumption variance at the household level consistent with theU.S. data.
Under Method 1, we set A¼1 and use a least squares criterion to estimate the value of σ that enables our model to bestmatch the empirical aggregate money demand curve (MPY) suggested by Lucas (2000). This is also the calibration strategy ofLagos and Wright (2005). Under Method 2, we choose the values of A;σf g to jointly match (i) the empirical money demandcurve of Lucas (2000) and (ii) the probability of running out of cash (the likelihood of a binding liquidity constraintPr θ4θnh i
) implied by the household survey data. Under Method 3, we choose the values of A;σf g to jointly match (i) theempirical money demand curve and (ii) the household consumption volatility implied by household data. Appendix Bprovides details of these calibration procedures.23
22 Such transversality conditions include limt-1βtEt
Kt þ 1Wt
¼ 0 and limt-1βtEt
Mt þ 1PtWt
¼ 0, where 1W is the shadow value of capital and 1
P is the value of money.23 Because of the lack of long time-series panel data that can track the consumption expenditure and money demand of the same households for more
than one year, we borrow information from cross-section data to infer consumption volatility. This is not entirely unreasonable. For example, if we survey
Fig. 2. Aggregate money demand curve in the model (�� � ��) and data (o o o).
Y. Wen / European Economic Review 76 (2015) 1–2412
The calibrated parameter values are summarized in Table 1. Notice that the values of σ under various calibration methodsimply that the variance of log consumption (log ct) in the model is in the range of 0.03–0.13 (see the last column in Table 1).This range of household consumption volatility is consistent with the empirical estimates of Telyukova (2011, Table 9), whoreports a range of 0.056–0.113 for the variance of various types of household consumption. Under Method 1, the model-implied variance of household consumption is 0.055, which is on the lower bound of Telyukova's estimates and hence moreconservative than the other two calibration methods. Thus, we use Method 1 as our benchmark calibration for σ;Af g in thispaper.24
Therefore, all the calibration methods amount to rationalizing the empirical money demand curve emphasized by Lucas(2000) and various measures of consumption risks. Using historical data for GDP, money stock (M1), and the nominalinterest rate, Lucas (2000) showed that the ratio of M1 to nominal GDP is downward sloping against the nominal interestrate. Lucas interpreted this downward relationship as a “money demand” curve and argued that it can be best rationalizedby the Sidrauski (1967) model of money-in-utility (MIU). Lucas estimated that the empirical money demand curve can bebest captured by an ad hoc power function of the form
MPY
¼ Ar�η; ð35Þ
where A is a scale parameter, r the nominal interest rate, and η the interest elasticity of money demand. He showed thatη¼ 0:5 gives the best fit. Because the money demand defined by Lucas is identical to the inverted velocity, a downward-sloping money demand curve is the same as an upward-sloping velocity curve (namely, velocity is positively related to the
(footnote continued)households from the same villages with similar living standards and consumption needs, then cross-section variations may very well indicate over-timeconsumption risk of a typical household in the village.
24 Telyukova's (2011) estimates are based on monthly data. However, she also reported similar estimates for the variance of household consumptionbased on quarterly data in an earlier 2009 version of her paper. Annual data are not available since the SCF data keep tract of the same households for onlyone year. Following Telyukova, we compute in our model the variance of the logarithm of consumption, log ct ¼ log min 1; θt
θn
n ox
h i, based on simulated
sample of θt with a sample size of 106. Keeping the variance of preference shocks constant, the model would generate larger welfare costs of inflation if the
Table 2Welfare costs (Δ% of consumption).
Calibration Raising π from 0% to 10% Raising π from 4% to 14%
Note: 3rd and 4th rows report the average cost under the two values of σ inTable 1.
Y. Wen / European Economic Review 76 (2015) 1–24 13
nominal interest rate or inflation). Similar to Lucas, the money demand curve implied by our model takes the form in Eq.(34). Fig. 2 shows the fit of the theoretical model to the U.S. data under calibration Method 1.25
The model's welfare implications under Calibration Method 1 are graphed in Fig. 1 (dashed blue lines). The top-left panel(dashed blue line) shows that the welfare cost function (Δ) is identical to that in the benchmark model without capital (solidred line) either toward πo or toward πmax, but lies slight above in between. When the inflation rate increases from theFriedman rule (πo) to π ¼ 10%, the welfare cost is 9.6% of annual consumption, as opposed to 8.9% in the benchmark modelwithout capital. When inflation increases from 0% to 10%, the welfare cost is 3.89% of annual consumption, which is slightlysmaller than before because the slope of the welfare function is now flatter in the range of moderate inflation. The costwould be even higher if we calibrate σ to match the variance of consumption in developing countries.26
In contrast, the top-right panel of Fig. 1 (dashed blue line) shows the pseudo measure of welfare cost (Δ�) based on theaverage consumption of a household (or a representative agent). This pseudo measure is now significantly higher than thecounterpart in the benchmark model without capital (solid red line), but the absolute magnitude is still small, more than aorder of magnitude smaller than the correct measure shown in the left panel. The maximum cost of inflation by theincorrect measure is Δ� ¼ 0:78% of consumption when π ¼ 2:7%, relative to the Friedman rule. It becomes even smallerunder a 10% inflation rate. These values are similar in magnitudes to those obtained in the existing literature based onrepresentative-agent models (e.g., Lucas, 2000; Cooley and Hansen, 1989). Similar to the benchmark model without capital,the bulk of the welfare costs (more than 85%) comes from the extensive margin.
The bottom-left panel of Fig. 1 shows the level of aggregate money demand (MP ), and the bottom-right panel shows the
consumption velocity of money (D θnð ÞH θnð Þ), where the solid red line pertains to the benchmark model without capital and the
dashed blue line to the model with capital. The money demand function is convex and decreases monotonically withinflation, whereas the velocity is also convex and increases monotonically with inflation. Near the Friedman rule, thedemand for money is close to infinity and the velocity is close to zero. In contrast, the demand for real balances becomeszero for πZπmax and the velocity of money becomes infinity at πmax.27 The velocity of money is identical in the two models(regardless of capital) because it is independent of the real wage. The velocity is close to zero near the Friedman rule becausehouseholds opt to hoard as much money as they can when its real rate of return equals the inverse of the time discountfactor (i.e., the demand for money approaches infinity as the opportunity cost of holding money goes to zero). In this case,the aggregate price level is close to zero and the borrowing constraint ceases to bind for all households (or across all possiblestates). The velocity of money becomes infinity as π-πmax because people want to divest their holdings of money as quicklyas possible to avoid the inflation tax despite the need for a store of value to self-insure against idiosyncratic shocks. But sincethe cost of holding money is so high as 1
Pt-1 and the insurance value of money is so low (fully destroyed), the demand for
money becomes zero. This pertains to the “hot potato effect” of inflation found in hyper-inflation countries where people tryto get rid of money as fast as they can to avoid further destruction of the liquidity value of money in hand.
These implications for money demand and velocity are quite different from standard CIA models, which imply a constantvelocity and a strictly positive lower bound on money demand, because agents under the CIA constraint must hold moneyeven with an infinite inflation rate at π ¼1. In the real world, people often stop accepting domestic currency as a store ofvalue or means of payment when the inflation rate is too high (but before reaching infinity), consistent with our model'sprediction.
Under Calibration Method 2, the implied welfare costs of 10% inflation range from 3.76% to 4.95%, depending on whetherπ is increased from 4% to 14% or from 0% to 10%, whereas the implied variance of household consumption is in the rage of0.03–0.11. Under Method 3, the implied welfare costs of 10% inflation range from 4.94% to 6.13%, depending on whether π is
(footnote continued)time interval becomes shorter. Hence, using an annual model is conservative because calibrating our model at a quarterly or monthly interval would onlyenhance our results.
25 The circles in Fig. 1 show plots of annual time series of a short-term nominal interest rate (the commercial paper rate) against the ratio of M1 tonominal GDP, for the United States for the period 1900–1997, the data sample used by Lucas (2000). The data are downloaded from the online HistoricalStatistics of the United States–Millennium Edition. The solid line with crosses is the model's prediction.
26 Wen (2011) in the Appendix uses statistics based on medical spending, traffic incidents, and work-related injuries to argue that consumption risk inChina is at least one order of magnitude larger than that in the U.S. For the sake of argument, suppose the variance of household consumption in China istwice of that in the U.S., then the implied welfare cost of 10% inflation (compared to 0% inflation) would be more than 6% of consumption.
27 The graph shows the velocity only for πoπmax.
Y. Wen / European Economic Review 76 (2015) 1–2414
increased from 4% to 14% or from 0% to 10%. The implied variance of household consumption is about 0.07–0.13, roughlyconsistent with independent empirical work (e.g., Telyukova, 2011). These welfare results are summarized in Table 2.
In a heterogeneous-agent economy with incomplete markets, the larger the variance of idiosyncratic shocks (or smallervalue of σ), the stronger the precautionary motive for holding money. This raises the inflation tax at a given inflation rate.More importantly, higher inflation shifts the mass of the distribution of money demand toward zero balances by reducingcash holdings across agents, resulting in a larger portion of the cash-constrained population (or a higher probability ofrunning out of cash for each individual) without self-insurance against idiosyncratic shocks. This shift of the distribution ofmoney demand in response to inflation is most critical in generating the large welfare cost, as evident in the differencebetween the welfare cost function Δ and the pseudo welfare cost function Δ� shown in Fig. 1.
To see the shift of the distribution of money demand, note that ∂R θnð Þ∂π 40 and ∂θn
∂π o0 by Eq. (21). The probability of
running out of cash is given by 1�F θn� �
¼ σ�1ð Þ 1þπ�ββ
� �, which increases with inflation. As inflation rises, the portion of
the population holding zero cash balances increases rapidly. For example, given the parameter values under Method 1, wheninflation increases from 0% to 10%, an additional 17% of the entire population is left without cash (thus without self-insurance), raising the total number of cashless agents to about 26% of the population. When holding money is too costly,the demand for real balances becomes so low that the probability of running out of cash is extremely high. The loss of bufferstocks or self-insurance amounts to large welfare costs. A comparison of Δ and Δ� in Fig. 1 suggests that this extensivemargin accounts for more than 90% of the welfare costs under moderate inflation (say for πZ5%), regardless of capital.
Another way to see the importance of the extensive margin in contributing to the large welfare cost of inflation is tointroduce an insurance market to the model so that cash-poor agents can borrow from cash-rich agents to mitigate theadverse liquidity effect of inflation. This analysis is carried out in the next section.
Here we emphasize a point made by Lagos and Wright (2005). That is, we notice that our three different calibrationmethods (with quite different ranges of parameter values) can all match the empirical money demand curve in Fig. 2 almostequally well, but the implied welfare costs are nonetheless quite different. In particular, the value of A is crucial for matchingthe Lucas money demand curve but plays no role in computing our welfare results (see Eq. (25)).28 Hence, as noted by Lagosand Wright (2005), simply computing the area underneath the money demand curve as a measure of the welfare cost ofinflation, as proposed by Bailey (1956) and favored by Lucas (2000), is not good enough. What is really needed is an explicitmodel of the micro foundations, especially the motives behind money demand, in order to properly estimate the welfarecost of inflation. Consistent with this spirit, here we offer a different model of money demand with micro foundationsalternative to those of Lagos and Wright, and we obtain different welfare results (as expected) because we emphasizedifferent functions of money in our models (medium of exchange versus store of value). One thing in common between ourtwo approaches is that both models obtain substantially larger welfare costs of inflation than in the existing representative-agent monetary literature, because in both models money is essential yet agents can opt not to hold money if the cost ofdoing so is sufficiently high. However, in the Lagos–Wright model the main source of welfare cost under inflation is the lossof the medium of exchange and matching efficiency. In our model, the main source of the welfare cost of inflation is the lossof the store of value for self-protection (insurance) against idiosyncratic consumption (or income) risk, which is notcaptured by the standard search-and-matching monetary models.
4. Welfare implications with credit and banking
There are at least two potential objections to the large welfare cost of inflation in the benchmark model. First, the modelposits uninsurable risk and assumes that money is the only liquid asset to help self-insure against such risk. This setup rulesout other types of store of value or insurance devices and does not take into account the role of credit and banking (such asconsumer credit or credit cards) in mitigating the idiosyncratic risk through borrowing and lending. Second, it is a commonbelief in the existing literature that inflation benefits debtors by redistributing the burden of inflation toward creditors. Forthese reasons, the welfare costs of inflation may be overstated.29
This section confronts these issues by extending the general-equilibrium Bewley model to a setting with “narrowbanking,” where cash-rich agents can deposit their idle cash into a community bank, and cash-poor agents with a bindingliquidity constraint can borrow from the bank by paying a nominal interest. The nominal interest rate of loans can beendogenously determined by the supply and demand of funds. This type of risk-sharing arrangement captures the realitythat consumers in developing countries (or poor households in rich countries) can often meet their liquidity demand (in alimited way) by borrowing money from relatives, friends, or local community banks.
More specifically, the key friction in the benchmark model is the nonnegativity constraint (mZ0) on nominal balances.With this constraint, there is always an ex post inefficiency on money holdings since ex post some agents end up holding
28 That is, A affects the estimated value of σ but does not directly enter the welfare function (25).29 Kehoe et al. (1992) study the welfare effects of inflation in a Bewley model with aggregate uncertainty. They show that lump-sum nominal transfers
can redistribute wealth from cash-rich agents to cash-poor agents, because the latter receive disproportionately more transfers than the former andthereby benefit from inflation. Consequently, inflation may improve social welfare. However, this positive effect on social welfare is quantitatively quitesmall and requires extreme parameter values in their model.
Y. Wen / European Economic Review 76 (2015) 1–24 15
idle balances while others end up liquidity constrained with zero balances. This creates a need for risk sharing, as suggestedby Lucas (1980). However, without the necessary information- and record-keeping technologies, households cannot lendand borrow among themselves. In this section, we assume that a community bank (or credit union) emerges to resolve therisk-sharing problem by developing the required information technologies. The function of the bank is to accept nominaldeposits from households and make nominal loans to bank members. Because of limited contract enforcement, we assumethat a household can borrow only up to a limit proportional to its average bank deposits in the past (
Rmt dF) plus an
additional fixed amount bZ0.30
For simplicity, we assume that (i) all deposits are withdrawn at the end of the same period (100% reserve banking) and(ii) all loans are one-period loans that charge the competitive nominal interest rate 1þ ~ı, which is determined by thedemand and supply of funds in the community. The nominal interest rate on deposits is denoted by 1þ id, with id ¼ψ ~ı andψA 0;1ð Þ. Any profits earned by the bank are distributed back to community members as lump-sum transfers.
Similar banking arrangements have been studied recently by Berentsen et al. (2007) and others. This literature showsthat financial intermediation improves welfare.31 However, these authors study the issue in the Lagos–Wright (2005)framework, which focuses on the medium-of-exchange function of money and has no capital accumulation. In addition, intheir model the welfare gains of financial intermediation come solely from the payment of interest on deposits and not fromrelaxing borrowers' liquidity constraints. In contrast, this paper focuses on welfare gains that derive mainly from risksharing or relaxing borrowers' liquidity constraints.
The time line of events is as follows: In the beginning of each period, each household makes decisions on labor supplyand capital investment, taking as given the initial wealth from last period. This is the first subperiod. In the secondsubperiod, idiosyncratic preference shocks are realized and each household chooses consumption, nominal balances, andthe amount of new loans.
4.1. The household problem
As in the previous model, hours worked and nonmonetary asset investment in each period must be determined beforethe idiosyncratic preference shock is realized; the remaining decisions are all made after observing θt. Each household takesthe bank's profit income (Tt) and government money transfers (τt) as given and chooses consumption, capital investment,labor supply, money demand, and credit borrowing (btþ1) to maximize the objective function in Eq. (1) subject to
ctþstþ1þmtþ1
Ptþ 1þ ~ıtð Þbt
Ptr 1þrtð Þstþ 1þ idt
� �mt
Ptþbtþ1
PtþWtntþTtþτt
Ptð36Þ
mtþ1Z0 ð37Þ
btþ1Z0 ð38Þ
btþ1rγZ
mt dFþb; ð39Þ
where ~ı denotes the nominal loan rate, id the nominal deposit rate, and r the real rental rate of capital. The nonnegativityconstraints on nominal balances (mtþ1) and loans (btþ1) capture the idea that households cannot borrow or lend outside thebanking system. Eq. (39) imposes a borrowing constraint on credit limits, where γZ0.
Proposition 2. Denoting real net wealth by xt � mtPtþWtntþTt þ τt
Pt� 1þ ~ıtð ÞbtPt
þ 1þrtð Þst�stþ1, and θn
t rθn
t r ~θn
t as the cutoffs,the decision rules of net wealth, consumption, money holdings, and loan demand are given, respectively, by
xt ¼ θn
t WtRt ; ð40Þ
ct ¼
θθn
xt if θrθn
t
xt if θn
t oθrθn
t
θ
θn
xt if θn
t oθr ~θn
t xtþγMtþb
Ptif θ4 ~θ
n
t
8>>>>>>><>>>>>>>:
ð41Þ
mtþ1
Pt¼
1� θθn
!xt if θrθn
t
0 if θ4θn
t
8>><>>: ð42Þ
30 The credit card is a similar type of institutional arrangement.31 For alternative approaches to money and banking, see Andolfatto and Nosal (2003).
Y. Wen / European Economic Review 76 (2015) 1–2416
btþ1
Pt¼
0 if θrθ t
θ
θn�1
�xt if θ
n
t oθr ~θn
t
γMtþbPt
if θ4 ~θn
t
8>>>>>><>>>>>>:
ð43Þ
where the cutoffs θn
t ;θn
t ;~θn
t
n oare determined jointly and uniquely by the following three equations:
~θn
t ¼ θn
t 1þγMtþbPtxt
" #ð44Þ
θn
t
θn
t
¼Et 1þ ~ıtþ1ð Þ Pt
Ptþ1wtþ1
� �Et 1þ idtþ1
� � Pt
Ptþ1wtþ1
� � ð45Þ
1¼ βEt 1þ idtþ1
� � PtWt
Ptþ1Wtþ1
� �R θn
t ;θn
t ;~θn
t
� �; ð46Þ
where
Rt �Zθoθn
dF θ� þZ
θn rθrθn
θθn
dF θ� þZ
θnoθo ~θ
n θn
θndF θ� þZ
θ4 ~θn
θn
θn
θ~θndF θ� ð47Þ
measures the liquidity premium of money.
Proof. See Appendix A.2.
The decision rules for illiquid capital assets and labor supply are similar to the previous models. But here there are fourpossible cases for money-credit demand: (i) If mtþ140, then btþ1 ¼ 0; namely, a household has no incentive to take a loanif it has idle cash in hand. (ii) If btþ140, thenmtþ1 ¼ 0; namely, a household will take a loan only if it runs out of cash. (iii) Itis possible that a household has no cash in hand but does not want to borrow money from the bank because the interest rateis too high; namely, mtþ1 ¼ btþ1 ¼ 0. (iv) Finally, the optimal demand for credit may exceed the credit limit and in this case,btþ1 ¼ γMtþb and mtþ1 ¼ 0. Which of these situations prevail in each period depends on the realized preference shock θt.So there exist three cutoff values with θnrθ
nr ~θn
and these cutoffs divide the domain of θ into four regions.Hence, the consumption function is easy to interpret. If the urge to consume is low (θoθn), then case (i) prevails and
c¼ θθnxox. If the urge to consume is high (θ4θ
n
), then case (ii) prevails and c¼ θθ
nx4x. In between (if θnrθrθn
),
consumption simply equals household net wealth, c¼x, so case (iii) prevails. Finally, if the urge to consume is too high
(θ4 ~θn
), then the household opts to hit its credit limit with c¼ xþγMþbP (case iv). The household in cases (ii) and (iv) is able
to consume more than its real net wealth because of the possibility of borrowing.In the money market, the aggregate supply of credit is
Rmt dF¼Mt and the aggregate demand is
Rbt dF¼ Bð~ıtÞ. Note that
credit demand can never exceed supply because the loan rate ~ıt will always rise to clear the market. The nominal loan ratecannot be negative because people have the option not to deposit. Hence, the credit market-clearing conditions arecharacterized by the following complementarity conditions:
Mt�Btð Þ~ıt ¼ 0; MtZBt and ~ıtZ0: ð48Þ
That is, the nominal loan rate is bounded below by zero. The market-clearing condition M�Bð Þ~ı ¼ 0 determines the nominalinterest rate of money. When the supply of funds exceeds credit demand (Mt4Bt), the equilibrium interest rate is zero,~ı ¼ 0. Otherwise, ~ı is determined by the equation M¼ B ~ıð Þ. Notice that the bank does not accumulate reserves because allreserves are distributed back to bank members by the end of each period. The bank's balance sheet is given by
where the LHS is the total inflow of funds in period t and the RHS is the total outflow of funds in period t. That is, at thebeginning of period t�1 (more precisely, the second subperiod of t�1), the bank accepts deposit Mt and makes new loansBt, and at the end of period t�1 it receives loan payment 1þ ~ıtð ÞBt , faces withdrawal of Mt, and makes interest payments todepositors. Any profits are distributed back to households in lump sums at the end of period t�1 in the amountTt ¼ ~ıt� idt
� �Bt , which becomes household income in the beginning of the next period.
Y. Wen / European Economic Review 76 (2015) 1–24 17
4.2. Welfare costs of inflation with financial intermediation
Aggregating the household decision rules gives the following relationships linking aggregate consumption, aggregatemoney demand, and aggregate credit demand, respectively, to household net wealth (x) in the steady state:
C ¼D θn;θ
n
; ~θn
� �x ð50Þ
M0
P¼H θn
;θn
; ~θn
� �x ð51Þ
B0
P¼ G θn
;θn
; ~θn
� �x; ð52Þ
where D� Rθoθnθθ n dFþ
Rθn oθoθ
n dFþRθ
n oθo ~θn θθ
n dFþRθ4 ~θ
n 1þγMþbPx
h idF; H� Rθoθn 1� θ
θn
�dF, and G� R
θn o θo ~θ
n
θθ
n�1� �
dFþRθ4 ~θ
nγMþb
Px dF. Notice that DþH�G¼ 1.
The model is closed by adding a representative firm as in the previous section. Hence, the general equilibrium of themodel can be solved in the same way as in the previous section. The model has a unique steady state in which the following
relationships hold: KY ¼ αβ
1�βð1�δÞ,CY ¼ 1� δαβ
1�βð1�δÞ, W ¼ 1�αð Þ βα1�βð1�δÞ
� �α=ð1�αÞ, and 1þr¼ 1
β. In addition, we also have
R θn;θ
n
; ~θn
� �¼ 1þπ
β 1þ id� , X ¼ θnWR, and N¼ 1�αð ÞYXθ
nR. The welfare cost function looks similar to Eq. (25), except the values
of X;Nf g are different and the welfare term Jθ πð Þ in Eq. (25) is now given by
Jθ πð Þ ¼Zθoθn
θ logθθn
dFþZθ
noθo ~θ
n
θ logθ
θndFþ
Zθ4 ~θ
nθ log 1þγMþb
Px
" #dF: ð53Þ
Proposition 3. Suppose the deposit rate id is bounded above by the lending rate ~ı; if the total supply of funds exceeds the totalcredit demand (Mt4Bt) at inflation rate π for some finite values of γ; b
n o, then the welfare cost function with banking is identical
to that without banking. In other words, financial intermediation does not improve welfare whenever the money-market interestrate is at the zero lower bound.
Proof. See Appendix A.3.
Since bank lending has an upper limit when γ; bn o
are finite, and since the optimal probability of running out of cash isan increasing function of inflation, under low inflation rates the demand for credit can be too low to exhaust the supply offunds. In this case, Proposition 4 states that there is no welfare gain from financial intermediation. In other words, atsufficiently low inflation rates, self-insurance can achieve identical allocations (distributions) to those with financialintermediation.
To understand this result, imagine first that the credit limit is infinitely small. Then by continuity the welfare costfunction in the banking model is identical to that in the benchmark model for all inflation rates. Also, since the supply offunds exceeds the demand, the nominal lending rate is zero for all inflation rates. Second, imagine that the credit limit isunbounded (infinity). Then the welfare cost functions in the two models shall remain identical (cross each other) at theFriedman-rule inflation rate because at this point the supply of funds exceeds credit demand and the nominal lending rate iszero. Therefore, for any finite credit limits the welfare cost functions in the two models must overlap at low inflation ratestoward the Friedman rule as long as Mt4Bt or ~ı ¼ 0. In this overlapping interval, financial intermediation does not improvewelfare.
We calibrate the credit limit in three ways. First, we set γ ¼ b ¼1, so that there are no borrowing limits, but with thedeposit rate id ¼ 0 as in the benchmark model. Second, we keep id ¼ 0 and set γ ¼ 0 and b ¼ 0:5x. Third, we setγ ¼ 1; b ¼ 0:05x, and the deposit rate equals half of the lending rate: id ¼ 1
2~ı. Namely, in the first case (called Model 1 in
Table 3), agents are free to borrow without limits at the market-determined lending rate ~ı. In the second case (called Model2), there exists a fixed credit limit b that is 50% of the household's wealth (x).32 In the third case (called Model 3) we set thecredit limit to the household average deposits (γ ¼ 1) plus an allowance worth 5% of net wealth, and set the deposit rateequal to half of the lending rate.33.The rest of the parameters are identical to Calibration 1 in Table 1.
The welfare cost functions with different borrowing limits are graphed in Fig. 3. The solid line in Fig. 3 shows the welfarecost function of the previous benchmark model with capital. It forms an upper envelope on the other three cost functions in
32 Since the average consumption C ¼Dxrx, the second calibration for credit limits is quite generous, as it allows a household to borrow more than 50%of its average consumption in the money market.
33 In the real world the deposit rates are in general significantly lower than the lending rates, especially in developing countries. For example, in Chinathe average interest rate on demand deposits is at most 20% of the lending rate. Telyukova (2011) assumes that id ¼ 0:3~ı in the U.S. Setting a relativelyhigher deposit rate implies a lower welfare cost of inflation in our model, so it goes against our welfare results.
Table 3Welfare costs with banking (Δ% of Consumption).
Models Raising π from 0% to 10% Raising π from 4% to 14%
Note: Model 1 is the banking model without borrowing limits, Model 2features a fixed credit limit of b ¼ 0:5x, and Model 3 features a credit limitproportional to the average deposits M=P and a deposit rate of idt ¼ 0:5~ı t .
Fig. 3. Welfare costs with credit and banking.
Y. Wen / European Economic Review 76 (2015) 1–2418
the figure. The dashed line represents the cost function in the banking model without borrowing limits (Model 1 in Table 3).It is clear that the welfare cost of inflation can be reduced significantly when banking credit (risk-sharing across households)is available (except at the Friedman rule and the maximum inflation rate πmax). Nonetheless, the welfare cost still increases(almost linearly) with inflation, such that in the limit when inflation reaches πmax , the welfare cost of inflation is identical tothat without banking or credit.
The dotted line in Fig. 3 represents the cost function in the second model with parameters γ ¼ id ¼ 0; b ¼ x=2n o
, and the
dot-dashed line represents the cost function in the third model with parameters γ ¼ 1; id ¼ 0:5~ı; b ¼ 0:05xn o
. Clearly, under
either forms of credit limits (i.e., with finite values of γ and b), financial intermediation does not improve welfare atsufficiently low inflation rates despite that the cost of borrowing may be zero (~ı ¼ 0), confirming Proposition 4. The intuitionis as follows. First, with relatively low inflation, households opt to hold a sufficient amount of real balances to bufferconsumption shocks since the cost of holding cash is relatively small. Second, the demand for credit is low because ofborrowing limits. Hence, households are forced to self-insure against idiosyncratic shocks at relatively low inflation rates.Third, since households take the availability of credit into account when determining the optimal level of net wealth, theyopt to reduce their net wealth one for one with the increased credit limit if the borrowing cost is zero. Consequently, theconsumption level is not affected and remains the same across all states of nature if ~ı ¼ 0 (see the proof in Appendix A.4); sofinancial intermediation has no effects on welfare whenever Mt4Bt .
However, things change dramatically when the inflation rates are high enough. With sufficiently high inflation, thesupply of funds shrinks and the demand for credit rises to a point such that the loan market clears (Mt ¼ Bt). In this case,self-insurance is no longer sufficient and outside credit becomes beneficial even though it is now costly to borrow (~ı40). Sofor inflation rate larger than a critical value, the welfare cost of inflation with financial intermediation becomes lower thanthat in the benchmark model.
In particular, the two cost functions with limited borrowing (the dotted line and the dot-dashed line in Fig. 3) becomeessentially linear (instead of hump-shaped) when π is high enough. Under the credit-limit calibration withγ ¼ 1; id ¼ 0:5~ı;b ¼ 0:05xn o
, the cost function becomes essentially flat for π421% per year. This means two things: First,
Y. Wen / European Economic Review 76 (2015) 1–24 19
the welfare cost of inflation with banking can be significantly reduced only at relatively high inflation rates. Second, sincethe cost increases only slowly with inflation for π421%, the maximum tolerable rate of inflation for households to stopholding money is now much higher than in the benchmark model. This second feature of the banking model arises becausethe nominal deposit rate increases with inflation whenever ~ı40, which can significantly reduce the inflation tax and theadverse liquidity effect of inflation on money holdings. However, the welfare cost of inflation at moderate inflation rates(πr20%) remains just as high as that in the no-banking model (see Table 3).
On the other hand, under the credit-limit calibration with γ ¼ id ¼ 0;b ¼ x=2n o
, even though deposits (checkingaccounts) do not pay interest, the welfare cost function starts to deviate from the benchmark model at a much lowerinflation rate (around π ¼ 2% or 1þπ ¼ 1:02). Beyond this point, the cost function increases almost linearly and reaches thesame maximum cost of 14% at πmax ¼ 52:576%. At the moderate inflation rate (π increases from 0% to 10%), the welfare costis only 1.82% of consumption, more than 2 percentage points lower than in the benchmark model (see Table 3).
Therefore, the welfare gains of credit and banking depend on the form of credit limits and the inflation rate. Withreasonable credit limits, there is little gain at low inflation rates because agents can self-insure against consumption riskwhen the cost of holding money is low, regardless of the form of credit limits. For very high inflation rates close to πmax , theinsurance value of money is low and the cost of borrowing (~ı) is high, so redistributing idle cash balances through financialintermediation may not significantly improve welfare (such as in Model 2 under the second credit-limit calibration), unlessthe nominal interest rate on demand deposits is close to the lending rate, or closely indexed to inflation (such as in Model 3under the third credit-limit calibration).34
How about the redistributive effects of inflation? Because inflation reduces the incentives for holding money, it thusdecreases credit supply (deposits) and increases the costs of borrowing in the credit market. Consequently, the nominalinterest of loans in the money market can increase with inflation more than one for one in our model. It is precisely thehigher interest cost of loans that may make debtors worse off (instead of better off) in the face of positive inflation, offsettingthe redistributive effects noted by Kehoe et al. (1992). Consequently, inflation can never be optimal in our model despitefinancial intermediation.
5. Conclusion
This paper provides a tractable general-equilibrium Bewley model of money demand as a new framework for studyingimportant monetary issues, such as the business-cycle properties of velocity,35 the welfare cost of inflation, monetary creditarrangement and narrow banking. In particular, the framework is used to rationalize the practice of a low inflation target in bothdeveloped and developing economies. The model shows that inflation can be very costly—at least about 3% to 4% of consumptionunder 10% inflation, and that most of the costs are borne by the liquidity-constrained cash-poor agents.
The primary reason for the astonishingly high welfare costs is that inflation erodes the buffer-stock-insurance value ofmoney, thus leading to increased liquidity risk (under preference shocks) or consumption volatility (under income shocks)at the micro level. Such an inflation-induced increase in consumption risk at the household level cannot be captured by theBailey triangle or representative-agent models or even the standard money-search models.36
Our benchmark model deliberately ignores other financial assets (such as stocks and government bonds) as a liquid storeof value to meet individual liquidity needs. The empirical facts about the composition of household financial wealth(presented in the Introduction) show that households in developing countries (or a significant number of them in richcountries) hold only cash as the major form of liquidity. Hence, it is only by taking an extreme approach can we hope to findpotential upper bounds on the welfare cost of inflation. It would be difficult to rationalize any central bank's inflation targetswithout knowledge of such upper bounds.
Yet, when we allow the possibility of credit through bank lending, or permit the use of credit cards, the welfare cost ofinflation can be reduced significantly, suggesting large welfare gains from financial intermediation or financial developmentin poor countries. However, with realistic credit limits, the welfare cost of inflation still remains much higher than predictedby representative-agent models.
Two simplifying strategies allow our general-equilibrium Bewley model to be analytically tractable despite the existence ofcapital, financial intermediation, and possible aggregate uncertainty. First, the idiosyncratic shocks come from preferences (as inLucas, 1980) or wealth income (as inWen, 2010a,b) rather than from labor income (as in Bewley, 1980). Second, the utility functionis linear in leisure. These simplifying strategies make the expected marginal utility of an individual's consumption and the targetwealth independent of idiosyncratic shocks and individual histories. With these properties, closed-form decision rules forindividuals’ consumption and money demand can be derived explicitly, and exact aggregation becomes possible under the law of
34 Most types of interest-bearing checking accounts in the U.S. pay very low interest compared with the lending rate (such as the interest rate on creditcards), and the deposit interest rate is often sluggish to reflect inflation changes.
35 See Wen (2009, 2010a).36 This result is the opposite of that found by Aiyagari (1994). In a general-equilibrium Bewley model Aiyagari shows that taxing capital is optimal
because precautionary saving under uninsurable risks induces dynamic inefficiency at the aggregate level; hence, taxing the rate of return on householdsaving can improve welfare by increasing the marginal product of capital (the interest rate) towards the Golden rule. In our model, however, savings do notcontribute to capital accumulation; thus, taxing nominal balances via inflation does not improve welfare.
Y. Wen / European Economic Review 76 (2015) 1–2420
large numbers. The aggregate variables form a system of nonlinear dynamic stochastic equations as in a representative-agent RBCmodel and can thus be solved by standard methods for business cycle analysis.
These simplifying strategies come at some costs. First, the assumption of preference shocks as the sole source of idiosyncraticrisk rules out any positive correlation between the distributions of consumption and money demand. However, Wen (2010a)shows that this correlation problem can be overcome by assuming wealth shocks—this alternative approach preserves closed-form solutions and generates similar welfare costs of inflation. Another cost is that the elasticity of labor supply is not a freeparameter. This imposes some limits on the model's ability to study labor supply behavior and labor market dynamics within thisframework. Nonetheless, the payoff of the simplifying assumptions is obvious: They not only make the generalized Bewley modelanalytically tractable regardless of aggregate uncertainty and capital accumulation and financial intermediation, but they alsoreduce the computational costs for a heterogeneous-agent model to the level of solving a representative-agent RBC model.Because of these advantages, the model may prove useful in applied work and serve as an alternative framework to the Baumol–Tobin model and the Lagos–Wright (2005) model for monetary policy analysis.37
Acknowledgments
I thank Pengfei Wang for discussions on issues related to this project. My gratitude also goes to two anonymous referees,Costas Azariadis, Jinghui Bai, Aleksander Berentsen, Gabriele Camera, Yongsung Chang, Mark Huggett, Ayse Imrohoroglu,David Levine, Narayana Kocherlakota, Qing Liu, Rodolfo Manuelli, Steve Williamson, Tao Zhu, and seminar participants atGeorgetown University, Hong Kong University of Science & Technology, Taiwan University, the Federal Reserve Banks of SanFrancisco and St. Louis, and the 2013 SED conference in Seoul for comments; Judy Ahlers for editorial assistance; and YumanTam and Luke Shimek for research assistance. The views expressed do not reflect official positions of the Federal ReserveBank of St. Louis and the usual disclaimer applies.
Appendix A
A.1. Proof of Proposition 1
Proof. Denoting λt ; vt� �
as the Lagrangian multipliers for constraints (5) and (6), respectively, and assuming interiorsolution for nt, the first-order conditions for ct ;mtþ1;nt
� �are given, respectively, by
θt
ct¼ λt ð54Þ
λt ¼ βEt∂Vtþ1
∂ ~mtþ1
Pt
Ptþ1
� �þPtvt ð55Þ
1¼Z
∂Jt∂xt
Wt dF; ð56Þ
where ~mt � mtPt
denotes real balances. The envelop theory implies
∂Jt∂xt
¼ λt ð57Þ
∂Vt
∂ ~mt¼Z
∂Jt∂xt
dF: ð58Þ
Eq. (56) reflects the assumption that decision for labor supply nt must be made before the idiosyncratic preference shockθt(and hence the value of Jðxt ;θtÞ) are realized.By the law of iterated expectations and the orthogonality assumption of aggregate and idiosyncratic shocks, Eqs. (56) and
(55) can be rewritten, respectively, as
1Wt
¼Zλt dF ð59Þ
λt ¼ βEtPt
Ptþ1Wtþ1þvt ; ð60Þ
where 1W pertains to the expected marginal utility of consumption in terms of labor income. The decision rules for
consumption and money demand are characterized by a cutoff strategy, taking as given the aggregate environment.Denoting the cutoff by θn
t , we consider two possible cases below.
37 The Lagos–Wright model is not suitable for dynamic business-cycle analysis, whereas the model presented in this paper does not suffer from thisweakness.
Y. Wen / European Economic Review 76 (2015) 1–24 21
Case A. θtrθn
t : In this case, the urge to consume is low relative to a target. It is hence optimal to hold money as a store ofvalue (to prevent possible liquidity constraints in the future). So mtþ1Z0, vt ¼ 0, and the shadow value of good (marginal
utility of consumption) λt ¼ βEt PtWtþ 1Pt þ 1
. Thus, ct ¼ θt βEt PtWtþ 1Pt þ 1
h i�1.
Case B. θtðiÞ4θn
t : In this case, the urge to consume is high relative to a target. It is then optimal to spend all money inhand, so vt40 andmtþ1 ¼ 0. By the resource constraint (5), we have ct ¼ xt . Eq. (54) then implies that the marginal utility ofconsumption is given by λt ¼ θt
xt.
The above considerations imply
λt ¼max βEtPt
Wtþ1Ptþ1;θt
xt
� ; ð61Þ
which determines the cutoff:
βEtPt
Wtþ1Ptþ1� θn
t
xt: ð62Þ
Eq. (59) then implies
1Wt
¼Z
max βEtPt
Wtþ1Ptþ1
� �;θt
xt
� dF; ð63Þ
which implicitly determines the optimal wealth x Ht� as a function of aggregate state only (i.e., xt is independent of
individual history ht). Using Eq. (62) to substitute real wealth xt, Eq. (63) implies the Euler equation (11) for money demand.The above analyses and the first-order conditions imply the decision rules for consumption, money demand, real wealth, and
labor supply summarized in the equations in Proposition 1. Notice that labor supply, nt ¼ 1Wt
xt�mt þτtPt
h i, may be negative if the
existing real balances are too high. To ensure that we have an interior solution (n40), consider the worst possible case where
money demand takes its maximum possible value, mtPt � 1
¼max 0; θn �θθn
n ox¼ θn �θL
θn x. Suppose Mtþ1 ¼Mtþτt ¼ 1þμ�
Mt and
PtPt� 1
¼ 1þπ ¼ 1þμ in the steady state, then τtPt¼ πMt
Pt¼ π
1þπMtþ 1Pt
¼ π1þπ
R mt þ 1Pt
dF¼ π1þπH θn
� �x (by the decision rule), where
H θn� �
� Rmax 0; θ
n �θθn
n odF. According to the definition of x in Eq. (3), n40 even in the worst possible case (i.e., the minimum
value of n is greater than 0) if xt�mt þτtPt
¼ 1�θn �θL
θn � π1þπH θn
� �h ix¼ θL
θn� π1þπH θn
� �h ix¼ θL
θn�πβH θnð ÞR θnð Þ
� �x40. This condition is
clearly satisfied when π ¼ 0. It is also satisfied in our model for 0oπrπmax since the ratio H θnð ÞR θnð Þ is monotonically decreasing in π
and approaches zero as π-πmax, whereas θn is decreasing in π but approaches θL, so the first term inside the bracket always
exceeds the second term for any πA β�1;πmax� �
under our parameter calibrations for β. The intuition is simple: sinceconsumption is bounded below by zero under log utility and it depends on labor income, under strictly positive preference shockscash holdings can never become too large to render hours worked negative. Thus, labor supply is always positive. It is also easy tosee that n is bounded away from above by a sufficiently large constant n because cash holdings are bounded below by zero. □
A.2. Proposition 2 and the Proof
Proposition 4. The general equilibrium of the model with capital can be characterized by the dynamic paths of ten aggregatevariables, Ct ;Ktþ1;Mtþ1;Nt ;Xt ;Yt ;θ
n
t ; Pt ;Wt ; rtn o
, which can be uniquely solved by the following ten aggregate equations:
Ct ¼Dðθn
t ÞXt ð64Þ
Mtþ1
Pt¼H θn
t
� �Xt ð65Þ
Xt ¼Wtθn
t Rðθn
t Þ ð66Þ
Xt ¼Mtþτt
Ptþ 1þrtð ÞKt�Ktþ1þWtNt ð67Þ
1Wt
¼ βEt1
Wtþ1
Pt
Ptþ1R θn
t
� �ð68Þ
1Wt
¼ βEt1þrtþ1
Wtþ1ð69Þ
Wt ¼ 1�αð ÞYt
Ntð70Þ
Y. Wen / European Economic Review 76 (2015) 1–2422
rtþδ¼ αYt
Ktð71Þ
CtþKtþ1�ð1�δÞKt ¼ Yt ð72Þ
Yt ¼ AtKαt N
1�αt ; ð73Þ
where D θn� �
� Rmin 1; θ
θn
n odF, H θn
� �� R
max 0; θn �θt
θn
n odF, and R θn
t
� �� R
max 1; θt
θn
t
n odF.
The aggregate dynamics of the model (such as transitional dynamics or impulse responses to aggregate shocks) can besolved by standard methods popular in the representative-agent RBC literature, such as the log-linearization method.
Proof. We provide only a briefly sketch of the proof here. Details can be found in Wen (2009, 2010a). Define
~xt �mtþτt
PtþWtntþ 1þrtð Þst ð74Þ
as net real wealth, and denote Jðxt ;θtÞ as the value function of the household based on the choice of ct, mtþ1, and stþ1.Wethen have
J ~xt ;θt� ¼ max
ct ;mtþ 1θt logctþβEtV
mtþ1
Ptþ1; stþ1
�� ð75Þ
subject to
ctþmtþ1
Ptþstþ1r ~xt ð76Þ
mtþ1Z0; ð77Þwhere V mt
Pt; st
� �is the value function of the household based on the choices of nt. That is,
Vmt
Pt; st
�¼max
nt�ntþ
ZJð ~xt ;θtÞ dF
� ð78Þ
subject to (74) and ntA 0;n½ �. Denoting λt ; vt� �
as the Lagrangian multipliers for constraints (76) and (77), respectively, andassuming interior solution for nt, the first-order conditions for ct ;mtþ1; stþ1;nt
� �are given, respectively, by
θt
ct¼ λt ð79Þ
λt ¼ βEt∂Vtþ1
∂ ~mtþ1
Pt
Ptþ1
� �þPtvt ð80Þ
Zλt dF¼ βEt
∂Vtþ1
∂stþ1
� �ð81Þ
1¼Wt
Z∂Jt∂ ~xt
dF; ð82Þ
where ~mt � mtPt
denotes real balances and Eq. (81) is derived by differentiating both sides of Eq. (75) with respect to stþ1. Theenvelop theory implies
∂Jt∂ ~xt
¼ λt ð83Þ
∂Vt
∂ ~mt¼Z
∂Jt∂ ~xt
dF ð84Þ
∂Vt
∂st¼ 1þrtð Þ
Z∂Jt∂ ~xt
dF: ð85Þ
Eq. (81) reflects the assumption that decision for stþ1 is made before the idiosyncratic preference shock θt (and hence thevalue of λt) is realized. Eqs. (81) together imply Eq. (31). The first-order conditions for fct ;mt þ 1
Pt;ntg are identical to those in the
benchmark model. After redefining cash in hand as xt ¼ ~xt�stþ1, the rest of the proof is similar to that in Appendix A.1 forProposition 1. □
A.3. Proof of Proposition 3
Proof. The proof is analogous to that in Appendix A.1 or Appendix A.2. The only important difference is to realize that wehave three cutoffs here, θn
;θn
; ~θn
� �. Hence, we have four possible cases to consider as elaborated in the main text. □
Y. Wen / European Economic Review 76 (2015) 1–24 23
A.4. Proof of Proposition 4
Proof. It suffices to show that if Mt4Bt , then both the individual consumption level and the labor supply in the bankingmodel are identical, respectively, to those in the benchmark model. First, notice that the real wage W in the banking modelis identical to that in the benchmark model because the capital-to-output ratio is not affected by financial intermediation.Second, whenMt4Bt , Eq. (48) implies that ~ıt ¼ 0. Hence, we also have idt ¼ 0. Eq. (45) then implies θ ¼ θ . Thus, Eqs. (46) and(47) imply
1þπβ
¼ R ~θn
� �¼Zθo ~θ
ndF θ� þZ
θ4 ~θn
θ~θndF θ�
; ð86Þ
which is identical to Eqs. (12) and (21) in the benchmark model. Hence, the liquidity premium function R is identical in thetwo models with ~θ
n ¼ θn. In addition, Eq. (44) implies 1þγMt þbPtxt
h i¼ ~θ
n
θn, so the decision rules in Eqs. (40) and (41) imply that
household consumption in the banking model is given by
ct ¼ θWR if θr ~θn
~θn
WR if θ4 ~θn
(¼min 1;
θ~θn
( )~θn
WR; ð87Þ
which is identical to Eq. (8) in the benchmark model after substituting out x by Eq. (10). As a result, the aggregateconsumption level C and the aggregate output Y are also identical across the two models, respectively. Finally, labor supplyin the banking model is given by N¼ 1�αð Þ YW, which is identical to that in the benchmark model because the aggregateoutput level is the same. Therefore, the welfare cost function in the banking model is identical to that in the benchmarkmodel whenever the credit market for loanable funds does not clear (or the lending rate is at the zero lower bound) becauseof excess liquidity on the supply side and borrowing constraints on the credit demand side. □
Appendix B. Supplementary data
Supplementary data associated with this paper can be found in the online version at http://dx.doi.org/10.1016/j.euroecorev.2015.01.012.
References
Aiyagari, S.R., 1994. Uninsured idiosyncratic risk and aggregate saving. Q. J. Econ. 109, 659–684.Akyol, A., 2004. Optimal monetary policy in an economy within complete markets and idiosyncratic risk. J. Monet. Econ. 51, 1245–1269.Alvarez, F., Atkeson, A., Edmond, C., 2008. Sluggish responses of prices and inflation to monetary shocks in an inventory model of money demand. Q. J. Econ.
124, 911–967.Andolfatto, D., Nosal, E., 2003. A Theory of Money and Banking. Federal Reserve Bank of Cleveland Working Paper 03-10.Attanasio, O., Guiso, L., Jappelli, T., 2002. The demand for money, financial innovation, and the welfare cost of inflation: an analysis with household data.
J. Polit. Econ. 110, 317–351.Bailey, M., 1956. The welfare cost of inflationary finance. J. Polit. Econ. 64, 93–110.Baumol, W.J., 1952. The transactions demand for cash: an inventory theoretic approach. Q. J. Econ. 66, 545–556.Berentsen, Aleksander, Gabriele Camera, Christopher Waller, 2007. Money, credit and banking. J. Econ. Theory 135 (1), 171–195.Bewley, T., 1980. The optimum quantity of money. In: Kareken, J.,Wallace, N. (Eds.), Models of Monetary Economies. Federal Reserve Bank of Minneapolis,
Minneapolis.Bewley, T., 1983. A difficulty with the optimum quantity of money. Econometrica 51, 1485–1504.Chiu, J., 2007. Endogenously Segmented Asset Market in an Inventory Theoretic Model of Money Demand. Bank of Canada Working Paper 2007-46.Cooley, T., Hansen, G., 1989. The inflation tax in a real business cycle model. Am. Econ. Rev. 79, 733–748.Dotsey, M., Ireland, P., 1996. The welfare cost of inflation in general equilibrium. J. Monet. Econ. 37, 29–47.Erosaa, Andrés, Ventura, Gustavo, 2002. On inflation as a regressive consumption tax. J. Monet. Econ. 49 (4), 761–795.Henriksen, E., Kydland, F., 2010. Endogenous money, inflation, and welfare. Rev. Econ. Dyn. 13, 470–486.Huggett, M., 1993. The risk-free rate in heterogeneous-agent in complete-insurance economies. J. Econ. Dyn. Control 17, 953–969.Imrohoroglu, A., 1989. Cost of business cycles within divisibilities and liquidity constraints. J. Polit. Econ. 97, 1364–1383.Imrohoroglu, A., 1992. The welfare cost of inflation under imperfect insurance. J. Econ. Dyn. Control 16, 79–91.Imrohoroglu, Ayse, Prescott, Edward C., 2001. Evaluating the welfare effects of alternative monetary arrangements. Fed. Reserve Bank Minneap. Q. Rev. 15 (3).Jappelli, T., 1990. Who is credit constrained in the U.S. economy? Q. J. Econ. 105, 219–234.Kehoe, T., Levine, D., Woodford, M., 1992. The optimum quantity of money revisited. In: Dasgupta, P., Gale, D., Hart, O., Maskin, E. (Eds.), Economic Analysis
of Markets and Games, M.I.T Press, Cambridge.Krusell, P., Smith, A., 1998. Income and wealth heterogeneity in the macroeconomy. J. Polit. Econ. 106, 867–896.Lagos, R., Wright, R., 2005. A unified framework for monetary theory and policy analysis. J. Polit. Econ. 113, 463–484.Lucas Jr., R.E., 1980. Equilibrium in a pure currency economy. Econ. Inq. 18, 203–220.Lucas Jr., R.E., 2000. Inflation and welfare. Econometrica 68, 247–274.Mulligan, Casey B., Sala-i-Martin, Xavier, 2000. Extensive margins and the demand for money at low interest rates. J. Polit. Econ. 108 (5), 961–991.Ragot, X., 2009. The Case for a Financial Approach to Money Demand. Banque de France Working Paper 300.Sidrauski, Miguel, 1967. Inflation and economic growth. J. Polit. Econ., 796–810.Telyukova, Irina, 2011. Household Need for Liquidity and the Credit Card Debt Puzzle, Working Paper, University of California, San Diego.Telyukovay, Irina, Visschers, Ludo, 2013. Precautionary Money Demand in a Monetary Business Cycle Model. J. Monet. Econ. 60 (8), 900–916.Tobin, J., 1956. The interest-elasticity of the transactions demand for cash. Rev. Econ. Stat. 38, 241–247.Townsend, R., 1995. Consumption insurance: an evaluation of risk-bearing systems in low-income economies. J. Econ. Perspect. 9, 83–102.
Y. Wen / European Economic Review 76 (2015) 1–2424
Wen, Y., 2009. Liquidity and Welfare in a Heterogeneous-Agent Economy. Federal Reserve Bank of St. Louis Working Paper 2009-019B.Wen, Y., 2010a. Liquidity Demand and welfare in a Heterogeneous-Agent Economy. Federal Reserve Bank of St. Louis Working Paper2010-009A.Wen, Y., 2010b, Lucas Meets Baumol and Tobin, Federal Reserve Bank of St. Louis Working Paper 2010-014B.Wen, Y., 2011. Input and output inventory dynamics. Am. Econ. J.: Macroecon. 3 (October), 181–212.