Innovative Applications of O.R. Prediction of financial distress: An empirical study of listed Chinese companies using data mining Ruibin Geng a , Indranil Bose b,1 , Xi Chen a,⇑ a School of Management, Zhejiang University, 866 Yuhangtang Road, Hangzhou, Zhejiang Province 310058, People’s Republic of China b Indian Institute of Management Calcutta, Diamond Harbour Road, Joka, Kolkata 700104, West Bengal, India article info Article history: Received 1 August 2013 Accepted 10 August 2014 Available online xxxx Keywords: Chinese companies Financial distress Financial indicators Neural network Majority voting abstract The deterioration in profitability of listed companies not only threatens the interests of the enterprise and internal staff, but also makes investors face significant financial loss. It is important to establish an effective early warning system for prediction of financial crisis for better corporate governance. This paper studies the phenomenon of financial distress for 107 Chinese companies that received the label ‘special treatment’ from 2001 to 2008 by the Shanghai Stock Exchange and the Shenzhen Stock Exchange. We use data mining techniques to build financial distress warning models based on 31 financial indicators and three different time windows by comparing these 107 firms to a control group of firms. We observe that the performance of neural networks is more accurate than other classifiers, such as decision trees and support vector machines, as well as an ensemble of multiple classifiers combined using majority voting. An important contribution of the paper is to discover that financial indicators, such as net profit margin of total assets, return on total assets, earnings per share, and cash flow per share, play an important role in prediction of deterioration in profitability. This paper provides a suitable method for prediction of financial distress for listed companies in China. Ó 2014 Elsevier B.V. All rights reserved. 1. Introduction Prediction of financial distress has been a topic of interest over the decades because of its great importance to listed companies, interested stakeholders and even the economy of a country (Wanke, Barros, & Faria, 2014). If the prediction of financial distress is reliable, managers of firms can initiate remedial measures to avoid deterioration before the crisis, and investors can grasp the profitability situation of the listed companies and adjust their investment strategies to reduce anticipated investment related losses. However, the rapid development of the capital market and the integration of the global economy have increased the num- ber of companies that suffer from financial distress over the years. In October 2007, the stock market in China crashed and wiped out more than two-thirds of its market value. According to the NASDAQ Company List, among 578 listed companies in 2008, the number of loss-making enterprises reached 278. Besides, Begbies Traynor’s latest Red Flag Alert shows a 24% increase in the UK companies facing ‘critical’ levels of financial distress in the last quarter of 2011 compared to the last quarter of 2010. It is not a surprise that numerous companies have faced consecutive years of loss, business damage, interests and assets shrinking, suspension of listing every year from 2000 to 2011. With the emergence of China as one of the leading markets for international investors, financial distress of Chinese companies has attracted increasing attention. Therefore, discovery of a suitable model for predicting the financial distress of listed Chinese companies is likely to be of great significance to global investors. Financial distress of a company usually refers to the situation that operating cash flow of a company cannot supersede the negative net assets of the firm. Different countries have different accounting procedures and rules, and the definition of financial distress put forward by different scholars is not always the same. It is generally agreed on that financial failure leads to substantive weakening of profitability of the company over time. Bankruptcy is the most widely used outcome of financial distress of a company. Ball and Foster (1982) pointed out that taking bankruptcy as a criterion ignored other options that a firm had, such as reducing its scale of operations, liquidating all of its assets and seeking a merger, if it faced ‘‘long-term cash flow problems’’. China Securities Regulatory Commission carries out a ‘Special Treatment’ (ST) warning mechanism to indicate abnormalities in a listed companies’ financial status. The aim of ST is to warn the managers http://dx.doi.org/10.1016/j.ejor.2014.08.016 0377-2217/Ó 2014 Elsevier B.V. All rights reserved. ⇑ Corresponding author. Tel.: +86 571 88206827. E-mail addresses: [email protected](R. Geng), indranil_bose@yahoo. com (I. Bose), [email protected](X. Chen). 1 Tel.: +91 33 2467 8300. European Journal of Operational Research xxx (2014) xxx–xxx Contents lists available at ScienceDirect European Journal of Operational Research journal homepage: www.elsevier.com/locate/ejor Please cite this article in press as: Geng, R., et al. Prediction of financial distress: An empirical study of listed Chinese companies using data mining. European Journal of Operational Research (2014), http://dx.doi.org/10.1016/j.ejor.2014.08.016
Transcript
European Journal of Operational Research xxx (2014) xxx–xxx
Contents lists available at ScienceDirect
European Journal of Operational Research
journal homepage: www.elsevier .com/locate /e jor
Innovative Applications of O.R.
Prediction of financial distress: An empirical study of listed Chinesecompanies using data mining
http://dx.doi.org/10.1016/j.ejor.2014.08.0160377-2217/� 2014 Elsevier B.V. All rights reserved.
Please cite this article in press as: Geng, R., et al. Prediction of financial distress: An empirical study of listed Chinese companies using data mEuropean Journal of Operational Research (2014), http://dx.doi.org/10.1016/j.ejor.2014.08.016
Ruibin Geng a, Indranil Bose b,1, Xi Chen a,⇑a School of Management, Zhejiang University, 866 Yuhangtang Road, Hangzhou, Zhejiang Province 310058, People’s Republic of Chinab Indian Institute of Management Calcutta, Diamond Harbour Road, Joka, Kolkata 700104, West Bengal, India
a r t i c l e i n f o a b s t r a c t
Article history:Received 1 August 2013Accepted 10 August 2014Available online xxxx
The deterioration in profitability of listed companies not only threatens the interests of the enterprise andinternal staff, but also makes investors face significant financial loss. It is important to establish aneffective early warning system for prediction of financial crisis for better corporate governance. Thispaper studies the phenomenon of financial distress for 107 Chinese companies that received the label‘special treatment’ from 2001 to 2008 by the Shanghai Stock Exchange and the Shenzhen Stock Exchange.We use data mining techniques to build financial distress warning models based on 31 financialindicators and three different time windows by comparing these 107 firms to a control group of firms.We observe that the performance of neural networks is more accurate than other classifiers, such asdecision trees and support vector machines, as well as an ensemble of multiple classifiers combined usingmajority voting. An important contribution of the paper is to discover that financial indicators, such asnet profit margin of total assets, return on total assets, earnings per share, and cash flow per share, playan important role in prediction of deterioration in profitability. This paper provides a suitable method forprediction of financial distress for listed companies in China.
� 2014 Elsevier B.V. All rights reserved.
1. Introduction
Prediction of financial distress has been a topic of interest overthe decades because of its great importance to listed companies,interested stakeholders and even the economy of a country(Wanke, Barros, & Faria, 2014). If the prediction of financial distressis reliable, managers of firms can initiate remedial measures toavoid deterioration before the crisis, and investors can grasp theprofitability situation of the listed companies and adjust theirinvestment strategies to reduce anticipated investment relatedlosses. However, the rapid development of the capital marketand the integration of the global economy have increased the num-ber of companies that suffer from financial distress over the years.In October 2007, the stock market in China crashed and wiped outmore than two-thirds of its market value. According to theNASDAQ Company List, among 578 listed companies in 2008, thenumber of loss-making enterprises reached 278. Besides, BegbiesTraynor’s latest Red Flag Alert shows a 24% increase in the UKcompanies facing ‘critical’ levels of financial distress in the last
quarter of 2011 compared to the last quarter of 2010. It is not asurprise that numerous companies have faced consecutive yearsof loss, business damage, interests and assets shrinking, suspensionof listing every year from 2000 to 2011. With the emergence ofChina as one of the leading markets for international investors,financial distress of Chinese companies has attracted increasingattention. Therefore, discovery of a suitable model for predictingthe financial distress of listed Chinese companies is likely to beof great significance to global investors.
Financial distress of a company usually refers to the situationthat operating cash flow of a company cannot supersede thenegative net assets of the firm. Different countries have differentaccounting procedures and rules, and the definition of financialdistress put forward by different scholars is not always the same.It is generally agreed on that financial failure leads to substantiveweakening of profitability of the company over time. Bankruptcyis the most widely used outcome of financial distress of a company.Ball and Foster (1982) pointed out that taking bankruptcy as acriterion ignored other options that a firm had, such as reducingits scale of operations, liquidating all of its assets and seekinga merger, if it faced ‘‘long-term cash flow problems’’. ChinaSecurities Regulatory Commission carries out a ‘Special Treatment’(ST) warning mechanism to indicate abnormalities in a listedcompanies’ financial status. The aim of ST is to warn the managers
2 R. Geng et al. / European Journal of Operational Research xxx (2014) xxx–xxx
and investors and also to use external mechanism to force the firmto enhance its operating performance.
Empirical studies using bankruptcy as the outcome of financialdistress has occupied a major part of literature related to this area.However, scholars in China have found it difficult to get enoughbankruptcy related data due to the late implementation andincompleteness of the Chinese bankruptcy law. It is believed thatST regulation in the China’s stock market provided a uniqueopportunity to provide early warning of impending financial crisisto be faced by company. According to the Chinese Stock ListingExchange Rule, there are three main reasons for designation of acompany as ST: (1) a listed company has negative net profits for2 years consecutively; (2) the shareholders’ equity of the companyis lower than the registered capital; and (3) a firm’s operationshave stopped and there is no hope of restoring operations in thenext 3 months due to natural disasters, serious accidents, or law-suits and arbitration. There are three types of ST labels to representdifferent levels of financial distress, that is, ST, *ST, and S*ST. STmeans special treatment due to loss for two consecutive years.*ST represents delisting warning due to loss for three consecutiveyears. S*ST indicates *ST stocks which are yet to restructure sharerights. According to the Chinese regulation, if a ST firm cannotimprove its performance within the next 3 years, it is labeled asPT (Particular Transfer) and may be delisted from the stock market.Once the companies are delisted, the stockholders suffer severelosses. So identifying firms that are likely to be labeled ST inadvance is an important activity for investors.
The connection between financial distress and bad profitabilityhas been studied in extant research on Chinese firms. Ding, Song,and Zen (2008) discovered that Chinese ST companies that showedthe sign of deterioration in the year before receiving such a labelhad a high probability of falling into financial distress in the fol-lowing year. Prediction of ST could provide an earlier warningabout bankruptcy by reminding the firms to pay attention to theirprofitability. So we chose to use ST companies as examples offinancially distressed firms who could move on to become bank-rupt in future. The objective of this paper is to apply data miningmodels to forecast which companies are likely to receive the STlabel. Such models can be useful in helping investors manage risksand make decisions in a more informed way. We aim to answerthree questions in this paper: which data mining models can pre-dict financial distress of Chinese firms most accurately; whichfinancial indicators are most effective in this prediction; and howearly can we foresee the sign of deterioration of profitability ofthe company? The results of this research can provide an earlywarning to listed companies so that they can take correctiveactions in order to avoid financial distress and delisting.
The reminder of this paper is organized as follow. In Section 2related studies on prediction of financial distress using data miningtechniques are reviewed. The research framework and empiricaldata collected for ST prediction are described in Section 3. Resultsof the numerical experiments are described in Section 4. Finally,discussion of the empirical results and their implications arepresented in Sections 5 and 6.
2. Literature review
Financial distress is a broad concept that contains several situ-ations in which firms face financial difficulty. The most commonterms used to describe these situations are ‘bankruptcy’, ‘failure’,‘insolvency’, and ‘default’. Altman (1993) put forward a completedescription and definition of financial distress and pointed out thatbankruptcy was closest to the legal definition of financial distress.Zmijewski (1984) defined financial distress as the act of filing apetition for bankruptcy. However, many financially distressed
Please cite this article in press as: Geng, R., et al. Prediction of financial distrEuropean Journal of Operational Research (2014), http://dx.doi.org/10.1016/j.e
firms never filed for bankruptcy, due to acquisition or privatization,whereas healthy firms often filed for bankruptcy to avoid taxes andexpensive lawsuits (Theodossiou, Kahya, Saidi, & Philippatos,1996). On the other hand, ‘failure’ was a situation where a firmcould not pay lenders, preferred stock shareholders, suppliers,etc., or a bill was overdrawn, or the firm was bankrupt. All thesesituations resulted in a discontinuity of the firm’s operations(Dimitras, Zanakis, & Zopounidis, 1996). However, Altman (1993)defined ‘failure’ as the situation where ‘‘the realized rate of returnon invested capital, with allowances for risk consideration, is sig-nificantly and continually lower than prevailing rates of similarinvestments’’, which did not indicate the discontinuity of a firm.For example, when Washington Mutual failed in 2008, the FDICwas able to broker a deal in which JP Morgan Chase bought theassets of Washington Mutual for US$ 1.9 billion (Palmeri, 2008).‘failure Insolvency’ represented negative performance indicatingproblems related to liquidity and was synonymous with negativenet worth (Zopounidis & Dimitras, 1998). Entities most commonlybecame insolvent by taking on too much debt. One example ofinsolvency was Almeco Ltd. that failed to pay Fimbank a debt thatwas due in 2013 (Orr, 2003). ‘Default’ referred to a situation wherea firm violated the condition of an agreement with a creditor thatresulted in legal action. For example, the Ministry of CorporateAffairs in India published a list of companies that defaulted inthe past (Ministry of Corporate Affairs, 2014). Ross, Westerfield,and Jaffe (2002) stated that ‘‘financial distress is a situation wherea firm’s operating cash flows were not sufficient to satisfy currentobligation (such as trade credit or interest expenses) and the firmis forced to take corrective action’’. To summarize, ‘default’ essen-tially meant a debtor had not paid a debt which he or she wasrequired to have paid. ‘Insolvency’ was a legal term meaning thata debtor was unable to pay his or her debts. ‘Bankruptcy’ was alegal finding that imposed court supervision over the financialaffairs of those firms that were insolvent or were in default.
ST label has been used as the symbol of financial distress in sev-eral studies related to Chinese firms (Altman, Heine, Zhang, & Yen,2007; Bailey, Huang, & Yang, 2011; Sun & Li, 2008a). ST firms gothrough one or more of four stages that include omission or reduc-tion of the annual dividend payment due to cash shortage, defaulton loan payments leading to a lawsuit, reorganization or take overand deletion from a stock exchange, and transfer to Asset Manage-ment Companies for disposal (Altman et al., 2007). There are twomain reasons for taking ST companies as examples as financiallydistressed firms. Firstly, the financial deterioration of a companyis generally considered to be a gradual process. ST as an ex anteevent of bankruptcy is a good representation of financial distress.In fact, the symptoms of Chinese ST companies are close to the def-inition of financial distress given by Newton (1975), Gestel et al.(2006), and Lau (1987). Secondly, researchers in China find it diffi-cult to obtain data related to bankrupt firms due to the process ofbankruptcy in China. Dairui and Jia (2009) define financially dis-tressed companies as ST and PT companies because they lacked adatabase of bankruptcy related information on Chinese listedcompanies.
Statistical techniques have been commonly used for predictionof business failure. Discriminant analysis has been the most fre-quently used method before 1980s (Altman, 1968; Beaver, 1966).This method has been criticized for its unrealistic assumptions,such as linear separability, multivariate normality, and indepen-dent predictor variables, which did not hold in case of real applica-tions. At the same time this method did not provide any estimateof the associated risk of failure. To overcome such limitations,researchers have proposed linear conditional probability models(LPM) and logit or probit regression analysis. Meyer and Pifer(1970) employed LPM for prediction of bankruptcy. Logit analysiswas proposed by Martin (1977) for the prediction of bank failures,
ess: An empirical study of listed Chinese companies using data mining.jor.2014.08.016
R. Geng et al. / European Journal of Operational Research xxx (2014) xxx–xxx 3
and for prediction of business failures by Ohlson (1980). Dimitraset al. (1996) provided a thorough review of statistical methodsused for prediction of business failures. Logistic regression iswidely used to predict the probability of financial distress (Li,Crook, & Andreeva, 2013).
Research methods for prediction of financial distress advancedfrom univariate to multivariate models using machine learningmethods based on artificial intelligence. According to Ravi Kumarand Ravi (2007), researchers employed different types of intelli-gent techniques to solve this problem (Carlos, 1996; Fletcher &Goss, 1993; Wilson & Sharda, 1994) and neural network (NN)was the most commonly used technique. Other data mining tech-niques included decision trees (DT) (Frydman, Altman, & Kao,1985), case based reasoning (Jo, Han, & Lee, 1997; Li & Sun,2009), genetic algorithms (Shin & Lee, 2002), Kohonen map (duJardin & Séverin, 2012), rough sets (McKee, 2000), simulation anal-ysis (Cohen, Doumpos, Neofytou, & Zopounidis, 2012), and supportvector machines (SVM) (Fan & Palaniswami, 2000; Gestel et al.,2006). Among them, the rough sets approach is distinctive as it isbased on rough sets theory rather than statistical probability orfuzzy set theory. There are two analysis methods based on roughsets theory that have been applied successfully for prediction ofbankruptcy (Greco, Matarazzo, Slowinski, & Zanakis, 2011). Theseinclude the Dominance-based Rough Set Approach (DRSA) andthe Variable Consistency Dominance-based Rough Set Approach(VC-DRSA). These approaches are useful when monotonic relation-ships exist between condition attributes and the decision classes.The rough approximations defined within DRSA (Błaszczynski,Greco, & Słowinski, 2007) require that objects having not-worseevaluation with respect to a set of condition attributes than a ref-erent object cannot be assigned to a worse class than the referentobject. However, the strict application of dominance principle byDRSA may identify several cases as unclassified. The problembecomes severe particularly when the data sets used to generatedominance principle are large. VC-DRSA extended DRSA byrelaxing the strict dominance principle and admitting some incon-sistent objects into the lower approximations (Greco, Matarazzo,Slowinski, & Stefanowski, 2001).
NN is inspired by the biological networks of the human nervoussystem. As a nonlinear mathematical approach, NN often outper-formed other single classifiers when testing complex data patternsas evidenced by Bose and Pal (2006) and Chen and Du (2009). Dhar,Mukherjee, and Ghoshal (2010) pointed out that the optimizationparameter selection in the model building process, such as chang-ing the number of neurons for each layer, the number of hiddenlayers, and the learning rate, made the performance better thancomparable methods. Methods for combination of multiple classi-fiers have been regarded as a new direction to develop highly reli-able decision making systems (Tax, Van Breukelen, Duin, & Kittler,2000; Tsai, 2014). Existing combination methods included majorityvoting (MV), Bayesian techniques, particle swarm optimization,and SVM (Shie, Chen, & Liu, 2012). Extant research has indicatedthat the performance of individual classifiers will be improved sig-nificantly by combining the multiple classifiers in the area of finan-cial distress prediction (Sun & Li, 2008b; Xiao, Yang, Pang, & Dang,2012). The main reason arises from two different aspects (Xu,Krzyzak, & Suen, 1992). First, there are a number of classificationalgorithms available for financial distress prediction. These algo-rithms are based on different theories and methodologies. Whenclassifiers are used on identical data set, the classifiers estimatethe same class posterior probability. To suppress the errors in esti-mation, the classifier outputs can be combined. Second, companies’financial situations can be described using numerous types of fea-tures, such as continuous variables, binary values, and discretelabels. One single classifier does not perform well for all types ofrepresentations. DT is more suitable for decision making based
Please cite this article in press as: Geng, R., et al. Prediction of financial distrEuropean Journal of Operational Research (2014), http://dx.doi.org/10.1016/j.e
on nominal data. The rough sets approach requires monotonicityof criteria. As a result, different classifiers are needed to handle dif-ferent types of features. Table 1 summarizes the representativeresearch papers that have used single or multiple classifiers forprediction of financial distress for Chinese firms.
Existing studies on prediction of financial distress have sufferedfrom a few limitations. The first issue has been limited availabilityof data on financial distressed companies. For example, in the caseof Chinese listed companies, ST companies were the best choice forfinancial distress analysis. However, only dozens of companieswere designated as ST every year. The number of ST companiesoperating in the stock market was much smaller than that ofnon-ST companies. The second issue has been related to the selec-tion of indicators of financial distress. Extant research has primar-ily focused on discovery of ‘better’ models for prediction offinancial distress without paying much attention to the analysisof the predictive ability of different financial indicators. Featureselection methods adopted in previous financial distress predictionstudies are either expert recommendation or statistical methodssuch as principle component analysis (Lin, Liang, Yeh, & Huang,2014). Thirdly, existing research papers mostly collected financialdata of ST companies that were either 1 year before treatment or2 year before treatment for prediction of financial distress (Dinget al., 2008). However, it was not very meaningful to forecast STrisk 1 or 2 years ahead, because ST was determined by the financialstatus of the company in the previous 2 years. Sevim, Oztekin, Bali,Gumus, and Guresen (2014) collected Turkish financial distresscases covering the period of 1992–2011 but achieved only a12 month warning system. There was a need to collect more his-torical data and make earlier predictions using those data. Finally,a rigorous selection of the control sample was almost absent inpast research. A common practice has been to select control sam-ples of similar size by using companies belonging to the sameindustrial sector.
3. Research methodology
In this paper, we conducted the prediction of financial distressusing the process of knowledge discovery. NN, DT and SVM areselected as the best three single classifiers for this purpose. Multi-ple classifiers based on MV (Sun & Li, 2008b) are introduced tocombine the prediction results obtained from the best three mod-els. We evaluated the performance of these four methods based onfour different partition ratios (i.e., 60:40, 70:30, 80:20, and 90:10).In order to enhance the robustness of the results and limit overfit-ting, we used 10 times repeated random sub-sampling validation.An important objective of this research is to determine whetherwe could foresee the sign of financial deterioration of the firm earlyon? So we collected financial data of the listed companies 3 years,4 years, and 5 years prior to the year when the companies receivedST and built prediction models for each of these time periods sep-arately. We also measured the predictive ability of the variablesusing importance ranking and identified the most important indi-cators of financial distress. Fig. 1 is a schematic diagram showingthe steps followed in this research.
3.1. Data collection
3.1.1. Sample of financially distressed companiesWe selected 107 listed companies from CSMAR (China Security
Market Accounting Research) database that were labeled as ST or*ST during 2008–2011 for reasons such as 2 years of losses, dam-aged business, or financially bankrupt (excluding major litigationor other factors). The number of companies labeled as ST or *ST
ess: An empirical study of listed Chinese companies using data mining.jor.2014.08.016
Table 1Summary of studies on prediction of financial distress for companies.
Papers Techniques Sample selection Best model
NN SVM DT LR DA RSA CM MC
Lin et al. (2014) Yes Yes No Yes Yes No No No Distressed companies with any of followingconditions: full-value delivery, stock transactionsuspension, re-construction, bankruptcy orwithdrawal from stock market
Models based on featuresets selected by anintegrated featureselection approach
Chen (2013) No No No No No No Yes No Electronics companies listed on Taiwan stockexchange
Subtractive clusteringusing particle swarmoptimization and fuzzysystems
Xiao et al. (2012) Yes Yes No Yes No Yes No Yes ST Chinese listed companies Multiple classifiers basedon Dempster–Shaferevidence theory
Li and Sun (2009) No No Yes Yes Yes No No Yes ST Chinese listed companies Hybrid case basedreasoning system
Chen and Du (2009) Yes No No No No No Yes No Companies stopped and suspended according toTaiwan stock exchange rules
Neural networks
Ding et al. (2008) Yes Yes Yes Yes Yes No No No ST Chinese listed companies Support vector machinesSun and Li (2008b) Yes Yes Yes Yes Yes No No Yes ST Chinese listed companies Multiple classifiers based
on majority votingBose and Pal (2006) Yes Yes No No Yes No No No Survived and failed click-and-mortar companies Neural networksAhn, Cho, and Kim (2000) Yes No No No No Yes No No Korean firms selected from Korea Information Service Hybrid model integrating
rough sets and neuralnetworks
Neural networks (NN), Support vector machines (SVM), Decision tree (DT), Logistic regression (LR), Discriminant analysis (DA), Rough Set Analysis (RSA), Clustering methods(CM), Multiple classifiers (MC).
4 R. Geng et al. / European Journal of Operational Research xxx (2014) xxx–xxx
in each year from 2008 to 2011 were 26, 29, 38, and 14. Moredetails about these companies appear in Appendix A.
3.1.2. Sample of financial healthy companiesTo create a control sample with which we could compare the
performance of the financially distressed companies, we selected107 listed companies randomly from the CSMAR database. Thesecompanies had not been labeled as ST till 2011. More details aboutthese companies appear in Appendix B.
Fig. 1. Schematic diagram showi
Please cite this article in press as: Geng, R., et al. Prediction of financial distrEuropean Journal of Operational Research (2014), http://dx.doi.org/10.1016/j.e
3.1.3. Time span of the data setPrevious studies on ST Chinese companies could achieve high
prediction accuracy by using financial data that was obtained 1or 2 years prior to the year when the companies received the STlabel (Ding et al., 2008), because whether a company was toreceive the ST label or not was determined exactly by its financialstatus in the previous 2 years. We implemented the models basedon financial data obtained 3, 4, and 5 years before the companiesreceived the ST label. We used time windows to collect the
ng the steps of the research.
ess: An empirical study of listed Chinese companies using data mining.jor.2014.08.016
R. Geng et al. / European Journal of Operational Research xxx (2014) xxx–xxx 5
financial data of ST companies. A 5-year time window meant thatwe used the financial data of the year t � 5 to predict whether thefirm was labeled as ST in year t. For example, if the companyreceived the ST label in 2008, its financial data in 2003 was used.The data sets based on 3-year and 4-year time windows were col-lected similarly. As for the control group, the financial data of thefinancial healthy companies in 2006 (5 years before 2011), in2007 (4 years before 2011), and in 2008 (3 years before 2011) werecollected.
3.2. Financial indicators
We chose 31 financial indicators as inputs based on the qualita-tive analysis of China Accounting Standards. These indicators couldbe divided into six categories that reflected the company’s sol-vency, profitability, operational capabilities, business developmentcapacity, structural soundness, and capital expansion capacity. Alist of the 31 financial indicators is provided in Table 2. All vari-ables used for calculation of the financial indicators are obtainedfrom the balance sheets, income statements or cash flow state-ments of the companies.
3.3. Modeling
The steps of this research are obtained by following the impor-tant steps of the standard data mining process of CRISP-DM(Shearer, 2000), including data understanding, data preparation,data modeling, and evaluation.
3.3.1. Data understanding‘Whether a company should receive the ST label or not’ is the
target variable of prediction. Except this target variable which isa binary variable, all input variables are continuous. Some
Table 2List of financial indicators.
Types Symbols Formula
Solvency TL/TA Total liaCA/CL Current(CA-I)/CL (CurrenTL/TSE Total liaCL/TA CurrentNOCF/CL Net opeEBIT/IE Earning
Profitability (SR–SC)/SR (Sales rNP/SR Net proEBIT/ATA EarningNP/ATA Net proNP/ACA Net proNP/AFA Net proNP/ASE Net pro
Operational capabilities MBI/ATA Main buSR/ACA Sales reSR/AFA Sales reMBC/AI Main buMBI/ABAR Main buCS/APA Cost of
Business development capacity MBI(t)/MBI(t � 1) Main buTA(t)/TA(t � 1) Total asNP(t)/NP(t � 1) Net pro
Structural soundness CA/TA CurrentFA/TA Fixed asSE/FA SharehoCL/TL Current
Capital expansion capacity NP/NOS Net proNA/NOS Net asseNICCE/NOS Net incrCR/NOS Capital
Please cite this article in press as: Geng, R., et al. Prediction of financial distrEuropean Journal of Operational Research (2014), http://dx.doi.org/10.1016/j.e
descriptive statistics related to the input variables for the three dif-ferent time windows are shown in Appendix C.
3.3.2. Data preparationThe data records of ST companies and normal companies are
combined as the initial data set. The completeness of the data isover 95% and the records with missing data are discarded.
As per the needs of supervised learning, we randomly parti-tioned the data into two parts for training and testing. The trainingdata is used for building the learning models whereas the testingdata is used for testing the predictive ability of the models. Differ-ent training to testing ratios such as 60:40, 70:30, 80:20, and 90:10are used in order to avoid the limitations of undertraining or over-training. In addition, we created 10 random training samples and10 random testing samples based on each partition ratio to con-duct cross-validation. We repeated all experiments on these 10paired training and testing samples separately and sequentially.Then we determined the average results across all samples. Thistype of resampling technique is known as repeated random sub-sampling validation and has been used in extant research (Usai,Goddard, & Hayes, 2009).
3.3.3. Data modelingAs the first step of data modeling, 10 models based on statistical
probability theory, namely, NN, C5.0 DT, C&R Tree, QUEST, CHAID,logistic regression, decision list, Bayes net, discriminant analysis,and SVM are applied for prediction of financial distress. Besides,VC-DRSA and DRSA are also adopted as the representative algo-rithms based on rough sets theory. We used the jMAF softwareto generate the results using DRSA and VC-DRSA. NN based onthe prune algorithm, C5.0, and SVM outperformed the other tech-niques and were chosen as representatives of data mining modelsbased on statistical probability. In order to combine the results of
e for calculation
bilities/total assetsassets/current liabilities
t assets-inventory)/current liabilitiesbilities/total shareholders’ equityliabilities/total assetsrating cash flow/current liabilitiess before interest and tax (EBIT)/interest expense
evenue–sales cost)/sales revenuefit/sales revenues before income tax/average total assetsfit/average total assetsfit/average current assetsfit/average fixed assetsfit/average shareholders’ equity
siness income/average total assetsvenue/average current assetsvenue/average fixed assetssiness cost/average inventorysiness income/average balance of accounts receivable
sales/average payable accounts
siness income of this year/main business income of last yearsets of this year/total assets of last yearfit of this year/net profit of last year
assets total assetssets/total assetslders’ equity/fixed assetsliabilities/total liabilities
fit/number of ordinary shares at the end of yearts/number of ordinary shares at the end of yearease in cash and cash equivalents/number of ordinary shares at the end of yearreserves/number of ordinary shares at the end of year
ess: An empirical study of listed Chinese companies using data mining.jor.2014.08.016
6 R. Geng et al. / European Journal of Operational Research xxx (2014) xxx–xxx
the top three models, we adopted the process of MV (Sun & Li,2008b).
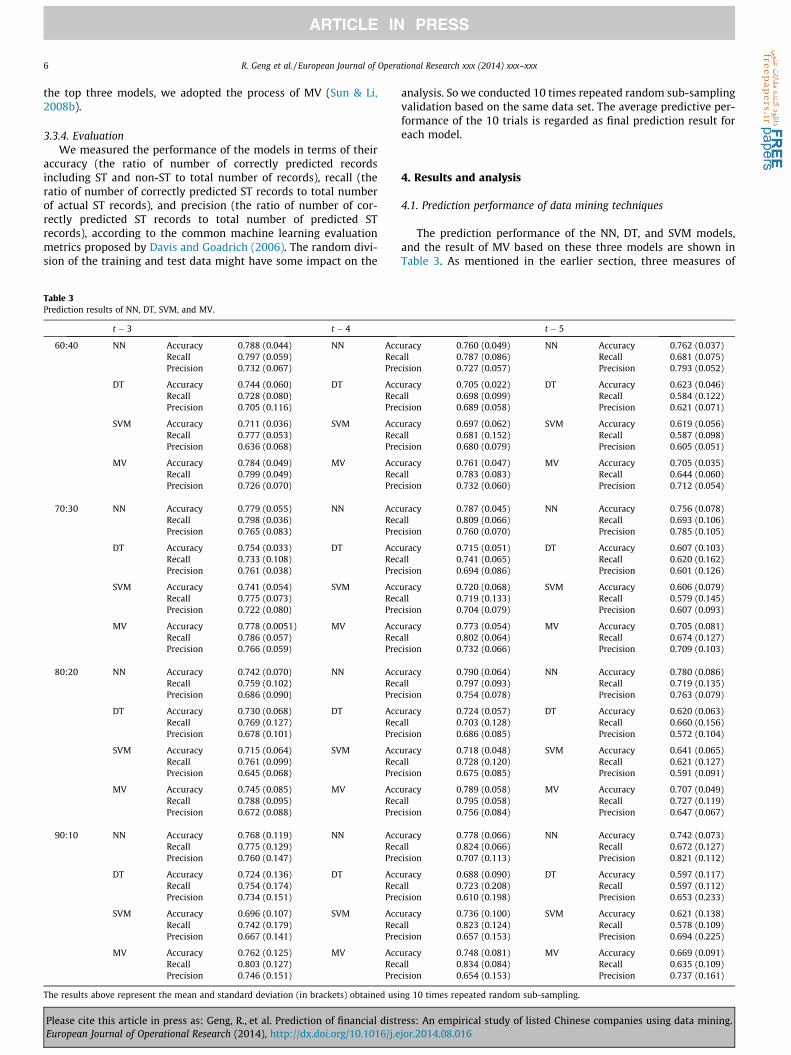
3.3.4. EvaluationWe measured the performance of the models in terms of their
accuracy (the ratio of number of correctly predicted recordsincluding ST and non-ST to total number of records), recall (theratio of number of correctly predicted ST records to total numberof actual ST records), and precision (the ratio of number of cor-rectly predicted ST records to total number of predicted STrecords), according to the common machine learning evaluationmetrics proposed by Davis and Goadrich (2006). The random divi-sion of the training and test data might have some impact on the
Table 3Prediction results of NN, DT, SVM, and MV.
t � 3 t � 4
60:40 NN Accuracy 0.788 (0.044) NN AccRecall 0.797 (0.059) RecPrecision 0.732 (0.067) Pre
The results above represent the mean and standard deviation (in brackets) obtained usi
Please cite this article in press as: Geng, R., et al. Prediction of financial distrEuropean Journal of Operational Research (2014), http://dx.doi.org/10.1016/j.e
analysis. So we conducted 10 times repeated random sub-samplingvalidation based on the same data set. The average predictive per-formance of the 10 trials is regarded as final prediction result foreach model.
4. Results and analysis
4.1. Prediction performance of data mining techniques
The prediction performance of the NN, DT, and SVM models,and the result of MV based on these three models are shown inTable 3. As mentioned in the earlier section, three measures of
Fig. 2. Predictive accuracy of NN, DT, SVM, and MV for (a) 3-year time window, (b)4-year time window, and (c) 5-year time window.
Fig. 3. Average standard deviation of predictive accuracy of NN, DT, SVM, and MVacross time windows and for different training to testing ratios.
R. Geng et al. / European Journal of Operational Research xxx (2014) xxx–xxx 7
prediction performance are reported in this table and they areaccuracy, recall, and precision. Scenarios based on different train-ing to testing ratios as well as different time periods are shownas well. As we have made 10 repeated experiments based on eachpartition ratio, we will get 40 samples to represent the predictionresults of the proposed models. In order to determine the best per-forming technique, we not only compared the average predictionaccuracy of the four models but also conducted two-sample t testbetween the accuracy of NN and that of the other four models. Thenull hypothesis of each t test was that the predictive accuracy ofNN was higher than that of SVM, DT, MV and RSA. The statisticalresults indicated that the prediction accuracy of NN was signifi-cantly higher than SVM, DT, and RSA in time windows t � 3,t � 4, and t � 5. However, the null hypothesis is not rejected whencomparing the accuracy of NN with MV in the 3-year and 4-yeartime windows. This indicated that MV performed as well as NNin these experiments.
The average prediction accuracy of NN is highest in each sce-nario, except for the case of 60:40 in the 4-year time windowand the case of 80:20 in the 3-year time window (Fig. 2). The per-formance of MV ranked second, close to but not exceeding theaccuracy obtained using NN significantly. The standard deviationof accuracy increased dramatically when the training to testingratio increased to 90:10. The large fluctuation of accuracy indicatedthe existence of overtraining problem in the case of 90:10. In the 3-year time window, the best result (78.82%) is obtained when thetraining to testing ratio was 60:40. The highest prediction accuracyof the 4-year time window and the 5-year time window (79.0% and78.0% respectively) occurred when the training to testing ratio was80:20. Training to testing ratio affects the prediction accuracy sig-nificantly. If most of the data is used for training and a smaller por-tion of the data is used for testing, data discrepancies betweentraining and testing will be enlarged. The model created using highpartition ratio is more likely to overfit to the training set and gen-erally have poor predictive performance. It is observed that ahigher training to testing ratio led to a deterioration and higherfluctuation (larger standard deviation) in accuracy, and hence the60:40 ratio is chosen for further analysis (see Fig. 3).
Using training to testing ratio of 60:40, ST could be predictedwith an average accuracy of over 75% for the best performing mod-els. One-way ANOVA with Fisher’s LSD procedure is used to testwhether the prediction accuracy of each model improved signifi-cantly as the time period decreased from 5 years to 3 years. Thepredictive performance of each model for time periods t � 3,t � 4, and t � 5 showed significant difference except those forNN. It seemed that a warning that was one more year ahead didnot sacrifice much accuracy when using NN. However, the accu-racy for time period t � 3 was relatively higher than the othertwo time periods for NN. We concluded that the prediction resultsbased on financial data of the 3-year time window were the mostaccurate. It was also intuitive that the closer we got to the time ofobtaining ST, the more precise prediction we made.
4.2. Rough sets analysis versus statistical probability models
As analysis approaches such as DRSA and VC-DRSA require theorder of input attributes corresponds to increasing or decreasingorder of preference of a decision maker (McKee, 2000), we examinethe monotonicity constraints. We randomly partition the trainingand testing sets using ratios of 60:40, 70:30, 80:20, and 90:10.Ten times repeated random sub-sampling validation is used foreach partition ratio as well. We apply the VC-DRSA method atthe partition ratio of 60:40 and set the consistency level at 0.9(consistency level at 1.0 for standard DRSA analysis), as the strictdominance principles by DRSA render several cases as unclassified.When the training to testing ratio is high, all cases are predicted as
Please cite this article in press as: Geng, R., et al. Prediction of financial distress: An empirical study of listed Chinese companies using data mining.European Journal of Operational Research (2014), http://dx.doi.org/10.1016/j.ejor.2014.08.016
8 R. Geng et al. / European Journal of Operational Research xxx (2014) xxx–xxx
ST companies by VC-DRSA at any consistency levels, which indi-cates that VC-DRSA is not a preferred method for this research.Thus we revert to the DRSA method. Prediction results using roughsets analysis for both DRSA and VC-DRSA methods are shown inTable 4. Although the prediction accuracy of DRSA within classifiedcases is relatively high, nearly a quarter of the cases remain unclas-sified when the DRSA method is used. Therefore, the total accuracyof rough set analysis is significantly lower than that of SVM, DT,and NN.
4.3. Evaluation of importance of financial indicators
Feature selection is conducted by ranking each financial indica-tor based on the strength of its relationship to the target variable,independent of other input variables. The idea is to perform a one-way ANOVA F test for each continuous predictor, which tested if allpredictors had the same mean as X. If Nj is the number of caseswith Y = j, j = 1� � �J, �xJ and s2
j is the sample mean and samplevariance of the predictor X for target class Y = j, ��x is the grand meanof predictor X, then the F statistic is calculated as:
F ¼PJ
j¼1NjðxJ � ��xÞ=ðJ � 1ÞPJ
j¼1ðNj � 1Þs2j =ðN � JÞ
ð1Þ
Predictors are sorted according to their p value in an ascendingorder. We applied two ranking methods to evaluate the predictiveability of each financial indicator – score and occurrence. The topseven financial indicators with smallest p value are assigned scores
Table 4Prediction results of rough sets analysis based on DRSA and VC-DRSA.
Please cite this article in press as: Geng, R., et al. Prediction of financial distrEuropean Journal of Operational Research (2014), http://dx.doi.org/10.1016/j.e
of 7 to 1 based on each ranking for 10 repetitions of each model.Financial indicators with higher prediction abilities are syntheti-cally determined by the ranking of final scores and number oftimes they occurred in the list of most important variables inTable 5. We repeated the process of ranking of financial indicatorsfor the three different time periods. Appendix D in the online sup-plement shows the results of ranking of financial indicators for NN,DT, SVM, and DRSA. The top ten important indicators generated bythe various methods were roughly the same although some differ-ences were observed in the order of their importance.
For the three different time windows, financial indicators withthe higher prediction abilities as ranked by the two criteria of scoreand occurrence are found to be same and included net profit onaverage total assets (NP/ATA) and return on total assets (EBIT/ATA) (as shown in first two rows of Table 5). Other importantfinancial indicators are mainly from the dimension of capitalexpansion capacity (e.g., earnings per share, net assets per share,cash flow per share, and capital reserves per share), profitability(e.g., operating gross profit rate, and net profit rate of currentassets) and business development capacity (e.g., net profit growthrate).
Based on the ranking obtained for importance of financial indi-cators, we repeated the accuracy related numerical experimentsusing the three models after feature selection. For these experi-ments, only the top ten financial indicators ranked by scores areused as inputs to predict the ST risk, rather than all 31 financialindicators. The training to testing ratio was set as 60:40 to controlthe problem of overtraining. Predictive performance after feature
The results represent the mean and standard deviation (in brackets) obtained using 10 times repeated random sub-sampling validation.
R. Geng et al. / European Journal of Operational Research xxx (2014) xxx–xxx 9
selection is shown in Table 6. Deleting the unimportant variablesfrom the prediction models is found to improve the performanceof DT and SVM models but reduced the accuracy of the NN model.Paired t test is conducted to figure out whether there existed sig-nificant difference between prediction accuracy before and afterfeature selection. The p-value of DT in time periods t � 3 andt � 5, as well of SVM for time period t � 3 was less than 0.05.The remaining paired t tests (at the significance level of 0.1) indi-cated that the prediction accuracy of NN models did not changesignificantly before and after feature selection. So we can concludethat the performance of NN is not affected by feature selection.This implied that the top ten variables could effectively representthe 31 financial indicators for prediction of financial distress.
5. Discussion
In this research we examined three questions: which methodperformed best in the prediction of financial distress? How earlycould we detect the financial deterioration of listed companies?Which financial indicators were of importance for determinationof financial distress? The results obtained in the previous sectionindicated that NN was the most robust and efficient model for pre-diction of financial deterioration, which was in conformity withprevious literature (Bose & Pal, 2006; Chen & Du, 2009). In fact,NN outperformed the other data mining methods in the 3-year,
Table 7Robust rules generated by DT.
t � 3 t � 4
Ranked by confidence Ranked by coverage Ranked by confidence Ran
If NP/ATA 6 0.025and NICCE/NOS 6 0.007 thenST = TRUE
If NP/ATA 6 0.025 andNICCE/NOS 6 0.414then ST = TRUE
If NOCF/CL 6 0.217 andNP(t)/NP(t � 1) 6 �0.332then ST = TRUE
If NNOSST =
If NOCF/CL 6 0.186and NP/SR 6 0.041andNP/ATA 6 0.044then ST = TRUE
If NP/ASE 6 0.055 thenST = TRUE
If NOCF/CL 6 0.205 andNP(t)/NP(t � 1) 6 �0.338then ST = TRUE
If NP/ATA 6 0.025 andNP(t)/NP(t � 1) 6 0.798then ST = TRUE
If NOCF/CL 6 0.207 and SR/ACA > 0.350 and NP/NOS 6 0.092 thenST = TRUE
If Nthen
Please cite this article in press as: Geng, R., et al. Prediction of financial distrEuropean Journal of Operational Research (2014), http://dx.doi.org/10.1016/j.e
4-year, and 5-year time windows with various training to testingratios. There were two advantages of NN which might have ledto its superior performance. Firstly, NN did not make any assump-tion about the statistical distribution or properties of the data. Sec-ondly, NN had a strong ability to fit nonlinear data and couldapproximate complex data patterns accurately. It was likely thatthe 31 financial indicators had complicated nonlinear relationshipswith the target variable, ‘whether ST or not’ and so NN gave rise togood classification due to the presence of complex relationshipsand noise in the data. SVM has been proposed as an excellent non-linear relationship recognition method by Vapnik (1995). Studiesby Ding et al. (2008) concluded that the performance of SVM inforecasting financial condition of Chinese listed companies wasbetter than that of back-propagation neural networks (BPNN)when training to testing ratio was 50:50. Various training algo-rithms can be used for NN modeling. We tried different trainingalgorithms, including prune algorithm, multilayer perceptron(MLP), and radial basis function network (RBFN), and determinedthat the prune algorithm outperformed others. The prune algo-rithm started with a large network and then removed the weakestunits in the hidden and input layers. In our experiments, the bestperformance was obtained when there were two hidden layersfor NN after pruning. However, DT models were able to generateif–then rules that conveyed insightful knowledge. In order todetect robust rules, we filtered the rules that determined high risk
t � 5
ked by coverage Ranked by confidence Ranked by coverage
P/ACA 6 0.066 and NP/6 0.191 thenTRUE
If MBI(t)/MBI(t � 1) 6 0.186 andNICCE/NOS 6 �0.121then ST = TRUE
If NICCE/NOS 6 �0.121then ST = TRUE
OCF/CL 6 0.207 and SR/>0.350 and NP/6 0.092 thenTRUE
Fig. 5. Results using 10 times repeated random sub-sampling validation forclassifiers in the 4-year time window.
Table 8Robust rules generated by DRSA.
t � 3 t � 4 t � 5
Ranked by coverage Coverage Ranked by coverage Coverage Ranked by coverage Coverage
If NP(t)/NP(t � 1) 6 �0.369 and (CA-I)/CL1 6 2.125 then ST = TRUE
29 If MBC/AI 6 14.349 and NP(t)/NP(t � 1) 6 �0.310 then ST = TRUE
34 If FA/TA 6 0.472 and NP/NOS 6 0.022 thenST = TRUE
25
If NP/ATA 6 0.018 and (CA-I)/CL1 6 1.141then ST = TRUE
26 If NP/SR 6 0.017 and NA/NOS 6 3.267then ST = TRUE
32 If NP/AFA 6 0.015 and FA/TA 6 0.559 thenST = TRUE
22
If (CA-I)/CL 6 0.977 and EBIT/ATA 6 0.032then ST = TRUE
24 If CA/CL 6 1.671 and NP/NOS 6 0.040then ST = TRUE
27 If NP/AFA 6 0.016 and FA/TA 6 0.472 thenST = TRUE
21
If NP/SR 6 0.0118 then ST = TRUE 22 If NOCF/CL 6 0.143 and NP/SR 6 0.017then ST = TRUE
25 If MBI(t)/MBI(t � 1) 6 0.186 and (CA-I)/CL0 6 �0.121 then ST = TRUE
20
If CA/TA 6 0.755 and NP/NOS 6 0.029then ST = TRUE
22 If NP/SR 6 0.010 and SR/AFA 6 4.218then ST = TRUE
22 If NP/SR 6 0.008 and EBIT/ATA 6 0.038then ST = TRUE
19
10 R. Geng et al. / European Journal of Operational Research xxx (2014) xxx–xxx
of ST with the condition that confidence value must be greater than0.8 and the number of supporting instances must be greater than aquarter of the sample size. The top five rules ranked by confidenceand coverage are presented in Table 7. Among the robust rules gen-erated by DT, the criterion of NP/ATA 6 0.025 occurred in nine outof ten repeated trials. This indicated that the risk of financial dis-tress was high when net profit of the firm was less than 2.5% ofthe value of average total assets held by the firm. Furthermore,DRSA was able to induce generalized decision rules as well. Theresults are shown in Table 8. Since the consistency (or confidence)level of DRSA was fixed at 1.0, the coverage of each rule was theonly criterion that was used for choosing the rules. However, thecoverage levels of DRSA rules were relatively low compared withDT rules. Among the top five robust rules generated by DRSA, theindicator NP/SR repeatedly occurred with an upper bound of0.01. This indicated that the value of NP/SR should be closely mon-itored and when it dropped below 0.01 this could signal the possi-bility of ST warning.
Multiple classifiers based on MV did not necessarily outperformthe best single classifiers. With the exception of the cases withtraining to testing ratio of 80:20 in the 3-year time window and60:40 in the 4-year time window, the average prediction accuracyof MV was always slightly lower than that of NN. Besides, the stan-dard deviation of MV was larger than single classifiers as well. Inother words, the multiple classifiers that are combined using MVdid not improve the performance of NN significantly. This conclu-sion contradicted the result of Sun and Li (2008a), and Xiao et al.(2012). Multiple classifiers could overcome the weaknesses of sin-gle classifiers when single classifier candidates had similar compe-tence in prediction of financial distress, as shown for 3-year and 4-year time window forecast with training to testing ratio at 60:40(Figs. 4 and 5 respectively). However, when there was one modelperforming in a stable fashion at the best level like the case ofthe prediction for the 5-year time window, as shown in Fig. 6,
Fig. 4. Results using 10 times repeated random sub-sampling validation forclassifiers in the 3-year time window.
Please cite this article in press as: Geng, R., et al. Prediction of financial distrEuropean Journal of Operational Research (2014), http://dx.doi.org/10.1016/j.e
multiple classifiers that combined the best model with other mod-els with poor performance lowered the predictive accuracy.
It seemed obvious that the closer we were to the year when thecompanies are labeled as ST, the higher was the accuracy of predic-tion. However, it was always better to detect the deterioration oflisted companies’ financial conditions as early as possible so thatthe managers got enough time and opportunity to take measuresto avoid such a financial crisis. As the tiny signals of deteriorationaccumulated and magnified, the ability to predict financial distressbecame stronger but obviously managers got less time to react tothe crisis. A tradeoff between prediction accuracy and time periodof forecast was inevitable. The results of one-way ANOVA withFisher’s LSD procedure test indicated that forecasts in the threetime periods were similar. Particularly, the prediction that isobtained in the 5-year time window was nearly as good as that
Fig. 6. Results using 10 times repeated random sub-sampling validation forclassifiers in the 5-year time window.
ess: An empirical study of listed Chinese companies using data mining.jor.2014.08.016
R. Geng et al. / European Journal of Operational Research xxx (2014) xxx–xxx 11
of the 4-year time window when NN is used as the classifier(Fig. 4).
To answer the third question related to ascertaining the relativeimportance of the financial indicators, the input variables areselected according to a ranking method. In extant research,Altman (1968) selected five financial indicators of strong predic-tive ability from the initial set of 22 financial indicators using step-wise discriminant analysis. In this research, among the 31indicators belonging to 6 categories, financial indicators reflectingcapital expansion capacity, profitability, and business developmentcapacity are found to be quite important in prediction of financialdistress. We observed that in contrast to the significant financialindicators obtained by Altman (1984), debt and capital allocationturned out to be weak indicators because the target variable wasset as ST rather than bankruptcy. The most important financialindicators that we obtained are related to net profit, earningsbefore income tax, cash flow, and net assets. This implied thatprofit and cash flow were important determinants of financialdeterioration.
An interesting observation related to the 10 most importantfinancial indicators in the different time periods of 3–5 years wasthat they were basically the same. For the 5-year time period theresult of ranking for the top 7 inputs by scoring and by occurrencehad very little divergence, whereas the same for the 3-year and the4-year time periods turned out to be the same indicators but onlydifferent in the order of importance. Paired t test on the predictionaccuracy before and after feature selection showed no significantdifference for NN. This was an important finding as it implied thatwe could make equally effective prediction based on the top tenfinancial indicators instead of considering all 31 financialindicators.
6. Conclusion
In this study, data mining techniques are used to build modelsfor predicting financial distress of Chinese listed companies basedon 31 financial indicators. 107 ST companies and the same numberof financially healthy listed companies are selected as the data set.The best method is obtained by comparing the performance ofdifferent prediction models at different time periods. The keycontributions of this research are as detailed below.
We considered all companies that had been designated as STduring 2008–2011 to obtain a large sample of ST companies. Con-trol samples are not confined to companies of the same size andbelonging to the same industry, in order to make the data set lessbiased. The prediction ability of the financial indicators for the 3-year, 4-year, and 5-year time windows are compared to examinehow early we could foresee the signs of financial deterioration atan acceptable accuracy. Financial data in the 5-year time windowachieved a satisfactory predictive performance and even betterthan that in the 3-year time window.
Next, we adopted 31 financial indicators based on the Chineseaccounting standards reflecting the solvency, profitability, opera-tional capabilities, business development capacity, structuralsoundness, and capital expansion capabilities of the companies.In the feature selection procedure, one-way ANOVA F test is con-ducted to test the strength of relationship between each input var-iable and the target variable. Besides, we also evaluated thepredictive ability of all financial indicators according to a rankingscheme using importance scores and frequency of occurrence.We obtained the top ten financial indicators with the highestpredictive ability and they included return on total assets, netprofit on total assets, earnings per share, and cash flow per share,among others. These indicators are found to have equivalent pre-dictive abilities as the 31 indicators that are chosen initially
Please cite this article in press as: Geng, R., et al. Prediction of financial distrEuropean Journal of Operational Research (2014), http://dx.doi.org/10.1016/j.e
according to a paired t test on the predictive accuracy before andafter feature selection.
Lastly, we identified NN as the best method for predicting finan-cial distress in comparison to MV, DT, and SVM. The results of the10 times repeated random sub-sampling validation and the impactof sensitivity analysis using multiple training to testing ratiosstrengthened the robustness of the findings. In terms of perfor-mance, NN based on the prune algorithm is found to be superiorto that of the BPNN and the SVM, contrary to the finding reportedby Ding et al. (2008).
Research on financial distress is usually limited to the use offinancial indicators disclosed in accounting statements, therebyignoring the role of non-financial indicators. In fact, some scholarshave found that non-financial indicators such as corporate gover-nance could be important in determining financial distress (Genget al., 2011). In a future study, we would use non-financial indica-tors in the prediction model to improve the prediction accuracy.The existence of difference in accounting standards across coun-tries might limit the generalizability of the results of this studyfor firms belonging to other countries. Future research could focuson building models for prediction of financial distress for differentcountries and compare and contrast between these models. Thetime window used to collect financial data of companies mightaffect the prediction accuracy significantly. We have criticizedthe ST risk prediction models based on financial data for 1-yearand 2-year time windows, and compared the model performanceof three different time windows in this paper. Prediction using datafrom 6-year to 10-year time windows could be taken up to decidehow far back in time we could go to determine the signs of finan-cial deterioration.
Appendix A. Supplementary material
Supplementary data associated with this article can be found, inthe online version, at http://dx.doi.org/10.1016/j.ejor.2014.08.016.
References
Ahn, B. S., Cho, S. S., & Kim, C. Y. (2000). The integrated methodology of rough settheory and artificial neural network for business failure prediction. ExpertSystems with Applications, 18(2), 65–74.
Altman, E. I. (1968). Financial ratios, discriminant analysis and the prediction ofcorporate bankruptcy. The Journal of Finance, 23(4), 589–609.
Altman, E. I. (1984). The success of business failure prediction models: Aninternational survey. Journal of Banking & Finance, 8(2), 171–198.
Altman, E. I. (1993). Corporate Financial Distress and Bankruptcy (2nd ed.). New York:John Wiley & Sons.
Altman, E. I., Heine, M. L., Zhang, L., & Yen, J. (2007). Corporate financial distressdiagnosis in China. Salomon Center Working Paper, New York University.
Bailey, W. B., Huang, W., & Yang, Z. (2011). Bank loans with Chinese characteristics:Some evidence on inside debt in a state-controlled banking system. Journal ofFinancial and Quantitative Analysis, 46(6), 1795–1830.
Ball, R., & Foster, G. (1982). Corporate financial reporting: A methodological reviewof empirical research. Journal of Accounting Research, 20, 161–234.
Beaver, W. H. (1966). Financial ratios as predictors of failure. Journal of AccountingResearch, 4, 71–111.
Błaszczynski, J., Greco, S., & Słowinski, R. (2007). Multi-criteria classification – Anew scheme for application of dominance-based decision rules. EuropeanJournal of Operational Research, 181(3), 1030–1044.
Bose, I., & Pal, R. (2006). Predicting the survival or failure of click-and-mortarcorporations: A knowledge discovery approach. European Journal of OperationalResearch, 174(2), 959–982.
Chen, M. Y. (2013). A hybrid ANFIS model for business failure prediction utilizingparticle swarm optimization and subtractive clustering. Information Sciences,220, 180–195.
Chen, W. S., & Du, Y. K. (2009). Using neural networks and data mining techniquesfor the financial distress prediction model. Expert Systems with Applications,36(2), 4075–4086.
Cohen, S., Doumpos, M., Neofytou, E., & Zopounidis, C. (2012). Assessing financialdistress where bankruptcy is not an option: An alternative approach for localmunicipalities. European Journal of Operational Research, 218(1), 270–279.
ess: An empirical study of listed Chinese companies using data mining.jor.2014.08.016
12 R. Geng et al. / European Journal of Operational Research xxx (2014) xxx–xxx
Dairui, L., & Jia, L. (2009). Determinants of financial distress of ST and PT companies: Apanel analysis of Chinese listed companies. <http://papers.ssrn.com/sol3/papers.cfm?abstract_id=1341795> Last accessed 07.03.14.
Davis, J., & Goadrich, M. (2006). The relationship between precision-recall and ROCcurves. In Proceedings of the 23rd international conference on machine learning,Pittsburgh, USA (pp. 233–240).
Dhar, S., Mukherjee, T., & Ghoshal, A. K. (2010). Performance evaluation of neuralnetwork approach in financial prediction: Evidence from India Market. InProceedings of the international conference on communication and computationalintelligence, Erode, India (pp. 597–602).
Dimitras, A. I., Zanakis, S. H., & Zopounidis, C. (1996). A survey of business failureswith an emphasis on prediction methods and industrial applications. EuropeanJournal of Operational Research, 90(3), 487–513.
Ding, Y., Song, X., & Zen, Y. (2008). Forecasting financial condition of Chinese listedcompanies based on support vector machine. Expert Systems with Applications,34(4), 3081–3089.
du Jardin, P., & Séverin, E. (2012). Forecasting financial failure using a Kohonen map:A comparative study to improve model stability over time. European Journal ofOperational Research, 221(2), 378–396.
Fan, A., & Palaniswami, M. (2000). Selecting bankruptcy predictors using a supportvector machine approach. In Proceedings of the international joint conference onneural networks, Como, Italy.
Fletcher, D., & Goss, E. (1993). Forecasting with neural networks: An applicationusing bankruptcy data. Information & Management, 24(3), 159–167.
Frydman, H., Altman, E. I., & Kao, D. L. (1985). Introducing recursive partitioning forfinancial classification: The case of financial distress. Journal of Finance, 40(1),269–291.
Geng, Z., Tan, L., Gao, X., Ma, Y., Feng, L., & Zhu, J. (2011). Financial distressprediction models of listed companies by using non-financial determinants inBayesian criterion. In Proceedings of the international conference on managementand service science, Wuhan, China.
Gestel, T. V., Baesens, B., Suykens, J. A. K., Van den Poel, D., Baestaens, D.-E., &Willekens, M. (2006). Bayesian kernel based classification for financial distressdetection. European Journal of Operational Research, 172(3), 979–1003.
Greco, S., Matarazzo, B., Slowinski, R., & Stefanowski, J. (2001). Variable consistencymodel of dominance-based rough sets approach. In Rough sets and current trendsin computing (pp. 170–181). Berlin Heidelberg: Springer.
Greco, S., Matarazzo, B., Slowinski, R., & Zanakis, S. (2011). Global investing risk: Acase study of knowledge assessment via rough sets. Annals of OperationsResearch, 185(1), 105–138.
Jo, H., Han, I., & Lee, H. (1997). Bankruptcy prediction using case-based reasoning,neural networks, and discriminant analysis. Expert Systems with Applications,13(2), 97–108.
Lau, A. (1987). A five-state financial distress prediction model. Journal of AccountingResearch, 25(1), 127–138.
Li, Z., Crook, J., & Andreeva, G. (2013). Chinese companies distress prediction: Anapplication of data envelopment analysis. Journal of the Operational ResearchSociety, 65(3), 466–479.
Li, H., & Sun, J. (2009). Gaussian case based reasoning for business-failure predictionwith empirical data in China. Information Sciences, 179(1–2), 89–108.
Lin, F., Liang, D., Yeh, C. C., & Huang, J. C. (2014). Novel feature selection methods tofinancial distress prediction. Expert Systems with Applications, 41(5), 2472–2483.
Martin, D. (1977). Early warnings of bank failure: A logit regression approach.Journal of Banking and Finance, 1(3), 249–276.
McKee, T. E. (2000). Developing a bankruptcy prediction model via rough setstheory. Intelligent Systems in Accounting, Finance & Management, 9(3), 159–173.
Meyer, P. A., & Pifer, H. W. (1970). Prediction of bank failures. The Journal of Finance,25(4), 853–868.
Ministry of Corporate Affairs (2014). Government of India. <http://www.mca.gov.in/MCA21/default_comp_list.html> Accessed 06.03.14.
Please cite this article in press as: Geng, R., et al. Prediction of financial distrEuropean Journal of Operational Research (2014), http://dx.doi.org/10.1016/j.e
Newton, G. W. (1975). Bankruptcy and insolvency accounting. New York: The RonaldPress.
Ohlson, J. A. (1980). Financial ratios and the probabilistic prediction of bankruptcy.Journal of Accounting Research, 18(1), 109–131.
Orr, K. G. (2003). Corporate insolvency. Times of Malta. <http://www.timesofmalta.com/articles/view/20130422/local/Corporate-insolvency.466585> Accessed 06.03.14.
Palmeri, C. (2008). JPMorgan chase to buy Washington mutual. <http://www.businessweek.com/stories/2008-09-26/jpmorgan-chase-to-buy-washington-mutualbusinessweek-business-news-stock-market-and-financial-advice> Accessed 06.03.14.
Ravi Kumar, P., & Ravi, V. (2007). Bankruptcy prediction in banks and firms viastatistical and intelligent techniques – A review. European Journal of OperationalResearch, 180(1), 1–28.
Ross, S., Westerfield, R., & Jaffe, J. (2000). Corporate finance. New York: McGraw-HillIrwin.
Sevim, C., Oztekin, A., Bali, O., Gumus, S., & Guresen, E. (2014). Developing an earlywarning system to predict currency crises. European Journal of OperationalResearch, 237(3), 1095–1104.
Shearer, C. (2000). The CRISP-DM model: The new blueprint for data mining. Journalof Data Warehousing, 5(4), 13–22.
Shie, F. S., Chen, M. Y., & Liu, Y.-S. (2012). Prediction of corporate financial distress:An application of the American banking industry. Neural Computing andApplications, 21(7), 1687–1696.
Shin, K. S., & Lee, Y. J. (2002). A genetic algorithm application in bankruptcyprediction modeling. Expert Systems with Applications, 23(3), 321–328.
Sun, J., & Li, H. (2008a). Data mining method for listed companies’ financial distressprediction. Knowledge-Based Systems, 21(1), 1–5.
Sun, J., & Li, H. (2008b). Listed companies’ financial distress prediction based onweighted majority voting combination of multiple classifiers. Expert Systemswith Applications, 35(3), 818–827.
Tax, D. M., Van Breukelen, M., Duin, R. P., & Kittler, J. (2000). Combining multipleclassifiers by averaging or by multiplying? Pattern Recognition, 33(9),1475–1485.
Theodossiou, P., Kahya, E., Saidi, R., & Philippatos, G. (1996). Financial distress andcorporate acquisitions: Further empirical evidence. Journal of Business Finance &Accounting, 23(5–6), 699–719.
Tsai, C.-F. (2014). Combining cluster analysis with classifier ensembles to predictfinancial distress. Information Fusion, 16, 46–58.
Usai, M. G., Goddard, M. E., & Hayes, B. (2009). LASSO with cross-validation forgenomic selection. Genetical Research, 91(6), 427–436.
Vapnik, V. N. (1995). The nature of statistical learning theory. New York: Springer-Verlag.
Wanke, P., Barros, C. P., & Faria, J. R. (2014). Financial distress drivers in Brazilianbanks: A dynamic slacks approach. European Journal of Operational Research.http://dx.doi.org/10.1016/j.ejor.2014.06.044.
Wilson, R. L., & Sharda, R. (1994). Bankruptcy prediction using neural networks.Decision Support Systems, 11(5), 545–557.
Xiao, Z., Yang, X., Pang, Y., & Dang, X. (2012). The prediction for listed companies’financial distress by using multiple prediction methods with rough setand Dempster–Shafer evidence theory. Knowledge-Based Systems, 26, 196–206.
Xu, L., Krzyzak, A., & Suen, C. Y. (1992). Methods of combining multiple classifiersand their applications to handwriting recognition. IEEE Transactions on Systems,Man and Cybernetics, 22(3), 418–435.
Zmijewski, M. E. (1984). Methodological issues related to the estimation of financialdistress prediction models. Journal of Accounting Research, 22, 59–82.
Zopounidis, C., & Dimitras, A. I. (1998). Multicriteria decision aid methods for theprediction of business failure. New York: Springer.
ess: An empirical study of listed Chinese companies using data mining.jor.2014.08.016